Average exchange rate Revenue 2,705 2,115. Operating profit Finance costs (69) (74) Profit before tax
|
|
|
- Magdalen Fitzgerald
- 5 years ago
- Views:
Transcription

1
2 Headwinds Remain Sales volumes recover, up 33% Strong Rand offsets recovery in demand and mix improvement Headline earnings in line with previous year Extraordinary increase in working capital Rights offer successfully completed Inflationary pressures remain 2
3 Income Statement R'million 2010 H H1 Average exchange rate Revenue 2,705 2,115 Operating profit Finance costs (69) (74) Profit before tax Taxation (6) (15) Net profit Basic headline earnings per share (cents) Dividend per share (cents) - - 3
4 Operating Profit H (ann.) Ave. R/$


5 Year-on-Year EBIT Comparison 2009 H Pension Benefit USD Margins Mix ROE on Margins Volume Other Margins Normal Costs Abnormal Foil Costs Valuation Items 2010 H1 5
6 Cash Flow R'million 2010 H H1 EBITDA Changes in working capital (364) 716 Inventories (337) 504 Debtors (168) 415 Creditors 141 (203) Changes in derivatives 25 (186) Tax payments (11) (48) Non-cash items Cash flow from operations (142) 723 Capital expenditure - normal and start up costs (62) (106) - project (32) (117) Shares issued Investments and other (33) 2 Cash flow before interest and dividends Interest (81) (100) Dividends 0 (29) Net cash flow
7 Rights Offer Fully Subscribed Proceeds applied to loan repayment : Long term Short term No further capital repayments until 2013 Additional headroom created Facilities currently R1380 million 7
8 Balance Sheet R'million 2010 H H1 Non-current assets 5,080 4,963 Current assets 2,222 1,628 Inventories 1, Trade and other receivables Net derivatives and other current assets TOTAL ASSETS (excluding cash) 7,302 6,591 Total equity 4,507 3,694 Total net borrowings 1,022 1,373 Deferred income tax liabilities Retirement benefit obligations Current liabilities TOTAL EQUITY AND LIABILITIES 7,302 6,591 Net debt to equity 22.7% 37.2% 8
9 Rolled Products Sales Volumes Tons('000) H1 2014(Fcst) Local Sales Export Sales 9
10 Mix and Margins Percentage Index 1 0
11 2010 H1 Manufacturing Performance Production improvements: H tons H tons Q tons Q tons Costs inflated by Project start up R24 million excluding R11 million capitalised Energy and payroll costs increase 11
12 Mix improvement targeted High value product improvements Can end sales up 20% HT Plate up 174% Brazing sheet up 162% Light Gauge foil up 15% Unlocking value from new investment in light gauge foil Maximising value from existing assets Optimising existing product streams Seeking new niche products Facilitate efficiency improvement through rationalising product offerings 12
13 Unit Costs Under Pressure Hulamin weighted average inflation +10.9% Gas increase year-on year +35% Electricity increase +22.3% Manpower inflation +8% Balance increase at SA inflation Net increase from project start-up costs +R24m Rolled Products sales volumes increase +34% H tons H tons Consumption increase (cost) +21% 13
14 Year-on-year Manufacturing Cost Comparison Cost related to new assets % Change year-on-year Hulamin Inflation 15 Activity Level Activity Level 10 Costs Sales Volume 14


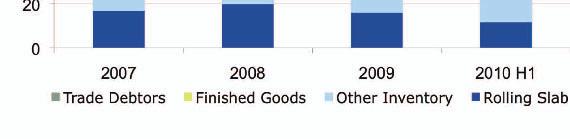
15 Changes In Inventory Days Indexed 1 5
16 Focus On Working Capital Total inventory increased by tons from H Transnet strike and subsequent port congestion Scrap processing disruption due to expansion Growth impact: 6000 tons inventory + debtors Permanent impact from direct route to market of 5 to 10 days over 2 years Debtors payment days improved: 55 days in days in
17 Capital Expenditure Project expenditure R32 million Rolling slab capacity expansion underway Residual expenses from Rolled Products expansion Normal capital expenditure reduced by 42% Rotating assets priority Stay in business replacements under focus Attractive improvements being prioritised 17
18 Rolled Products Expansion Update Focus on light gauge foil rolling qualifications Plate and Twin Roll Casters on improvement curve Edendale hot mill idled until plate demand returns Cold rolling opportunities 18

19 Hulamin Extrusions Recessionary environment, some improvement Sales volumes up 25% Driven by automotive growth Billet import implications: Margin squeeze Logistics risks materialise - port congestion 19

20 Hulamin Extrusions Outlook Building industry only expected to recover in 2011 Partnership with Mazor Ltd in Hulamin Building Systems showing benefits Extruders ITAC application submitted by AFSA 20

21 Global Demand Growth 43 new can lines in Asia/ Brazil in 5 years tons total aluminium rolled products Includes can end stock Automotive demand sharply up: kg/ vehicle kg/ vehicle 21
22 Supply Dynamics Wise Metals withdrawal from global can stock markets after displacing Alcoa in USA domestic can stock contract Improving rolling industry profitability Aleris exits Chapter 11 Ongoing mill closures and uncertainty Texarcana Cap de la Madeleine Ravenswood New aluminium complex at Ma aden in Saudi Arabia Novelis capacity expansion in Brazil Rise in value of Yuan 22
23 Current Metal Supply Hillside tons melting ingot export sales tons melting ingot tons slab Bayside tons slab Rolling Slab tons Hulamin Rolling Mill Sales tons Hulamin Remelt tons scrap 2 3
24 Future Metal Supply tons melting ingot Hillside/ Bayside Surplus melting ingot export sales Imports Rolling Slab tons tons Twin Roll Casters Hulamin Rolling Mill Sales tons Hulamin Casting facilities tons scrap 24
25 Current Status of Slab and Billet Supply Rolling slab supply planned to be discontinued July 2011 Slab supply mitigation Expansion of in-house facilities underway Idled assets started up June 2010 First batch imports underway Logistics risks e.g. port congestion Working capital implications Billet imports ongoing Qualification disruptions Logistics risks e.g. port congestion 25
26 Team South Africa Responds Participate in Team South Africa solutions Includes extruders, cable/ wire and casters Stakeholders include customers, AFSA, suppliers, government, other role players Stock piling current excess slab capacity from Bayside Other downstream beneficiation threats 26
27 Key Outcomes to Deliver On Sales volume tons Mix optimisation through sales volumes: Can end stock Heat treated and other plate Light gauge foil Brazing sheet Other new high value products Cost control/ eliminating waste Manpower Energy Logistics 27
28 Shared Hulamin vision of success R1 Billion EBIT (16% ROCE) Working capital days Alignment on few, high impact objectives driving profit and working capital Performance management (bottom up) Maintenance Process quality Productivity Waste elimination Capability 28
29 Exposure to Rand Aluminium Price Metal price lag Timing of buying and selling 100% hedge from 2007 (sold forward) Hedge reduced to 50% in 2009 due to cash flow risk Lower current Rand LME impact Profits Cash flow 29
30 Prospects Positive outlook. Solid market demand Additional volume of high value products Utilisation of new capacity with focus on: Working capital reduction and cash cycles Costs Volume growth 30
UNAUDITED INTERIM RESULTS FOR THE HALF-YEAR ENDED 30 JUNE 2011
 UNAUDITED INTERIM RESULTS FOR THE HALF-YEAR ENDED 30 JUNE 2011 Agenda Introduction Financial Review Operational Review Strategic Review and Objectives Prospects 2 Introduction - Operating Environment External
3 Operational Review. Strategic Review and Objectives
 UNAUDITED INTERIM RESULTS FOR THE HALF YEAR ENDED 30 JUNE 2012 1 Agenda 1 Introduction 2 Financial Review 3 Operational Review 4 Strategic Review and Objectives 5 Outlook 2 Key Points for H1 2012 Performance
2011 FINAL RESULTS PRESENTATION
 2011 FINAL RESULTS PRESENTATION FEBRUARY 2012 1 Agenda 1 Market Conditions 2011 2 Financial Review 3 Operational Review 4 Key Strategic Priorities 5 Outlook for 2012 and Beyond 2 MARKET CONDITIONS 2011
Hulamin Limited Interim Results Presentation
 Hulamin Limited Interim Results Presentation For the half-year ended 30 June 2009 Abnormal Market Conditions Sharpest fall in global consumption of aluminium since 1975 oil shock Rolled products and extrusions
AUDITED RESULTS FOR THE YEAR ENDED 31 DECEMBER 2015
 AUDITED RESULTS FOR THE YEAR ENDED 31 DECEMBER 2015 AGENDA 2 1 Opening remarks / market update Richard 2 Financial results David 3 Operational review Richard 4 Strategy update Richard 5 Outlook Richard
Interim Results Presentation Hulamin Limited. For the half-year ended 30 June 2007
 Interim Results Presentation Hulamin Limited For the half-year ended 30 June 2007 Salient features Continuing volume growth Sustained improvement in underlying performance by Rolled Products Operating
AUDITED RESULTS FOR THE YEAR ENDED 31 DECEMBER 2016
 AUDITED RESULTS FOR THE YEAR ENDED 31 DECEMBER 2016 AGENDA 2 1 Opening remarks / market update 2 Financial results 3 Operational review 4 Strategy update 5 Outlook 1 2 3 4 5 OPENING REMARKS / MARKET UPDATE
Introduction to Hulamin
 Introduction to Hulamin Topics covered in this presentation 1. The history of Hulamin 2. Industry overview and Hulamin s position in the value chain 3. Hulamin s growth and the factors underpinning it
Second quarter report 2012 Q 2012
 report Q page 2 SECOND QUARTER Contents Contents Financial review 3 Overview 3 Market developments and outlook 5 Additional factors impacting Hydro 7 Underlying EBIT 7 Finance 12 Tax 12 Items excluded
First quarter report 2012 Q 2012
 report 2012 Q 2012 page 2 FIRST QUARTER Contents Contents Financial review 3 Overview 3 Market developments and outlook 5 Additional factors impacting Hydro 7 Underlying EBIT 8 Items excluded from underlying
Think future. Think aluminium. INTEGRATED ANNUAL REPORT for the year ended 31 December 2015
 Think future. Think aluminium. INTEGRATED ANNUAL REPORT for the year ended 31 December 2015 2015 represents Hulamin s 75th anniversary of unlocking sustainable value to all our stakeholders STAKEHOLDER
Q 2012 Fourth quarter report 2012
 Q report page 2 FOURTH QUARTER About our reporting - discontinued operations About our reporting - discontinued operations On October 15 Hydro announced an agreement with Orkla ASA to combine their respective
Fourth quarter report 2011 Q Q Q Q
 Fourth report Q Q Q Q page 2 FOURTH QUARTER Contents Contents About our reporting 3 Financial review 4 Overview 4 Market developments and outlook 7 Additional factors impacting Hydro 9 Underlying EBIT
First quarter report 2010
 report 2010 page 2 FIRST QUARTER Contents Contents Financial review 3 Overview 3 Market developments and outlook 5 Additional factors impacting Hydro 6 Underlying EBIT 7 Items excluded from underlying
First quarter report 1
 report 1 2 FIRST QUARTER REPORT Contents Contents Financial review 3 Overview 3 Market developments and outlook 5 Additional factors impacting Hydro 7 Underlying EBIT 8 Finance 12 Tax 12 Items excluded
High-quality aluminium coils of AMAG Austria Metall AG
 High-quality aluminium coils of AMAG Austria Metall AG Financial Report 1 st half year of 2015 2 AMAG Financial Report Key figures for the AMAG Group Key figures for the Group in EUR million Q2/2015 Q2/2014
Highveld Steel and Vanadium. Annual Results 31 December 2009
 Highveld Steel and Vanadium Corporation Limited Annual Results 31 December 2009 Disclaimer 2 Forward looking statements This document may contain forward looking information and statements about Highveld
Integrated Annual Report for the year ended 31 December. Think future. Think aluminium. FINANCIAL STATEMENTS THE BUSINESS IN CONTEXT
 AN OVERVIEW THE BUSINESS IN CONTEXT STRATEGIC VALUE CREATION STATEMENTS Think future. Think aluminium. Integrated Annual Report for the year ended 31 December 2018 Think future. Think aluminium. Hulamin
Think future. Think aluminium. Audited Financial Results for the year ended 31 December and Cash Dividend Declaration
 Think future. Think aluminium. Audited Financial Results for the year ended 31 December and Cash Dividend Declaration 2 0 1 7 AUDITED RESULTS FOR THE YEAR ENDED 31 DECEMBER 2017 1 AGENDA 2 1 OPENING REMARKS
Argentum Metal Management Ltd HOLGER ELLMANN PARTNER
 Argentum Metal Management Ltd HOLGER ELLMANN PARTNER The macro-economic outlook Year to date YOY Aluminium demand January to September 2015 Global demand rose by 5.6 % to 43.4 Mio tonnes European demand
EARNINGS PRESENTATION
 EARNINGS PRESENTATION Fourth Quarter & Full Year 2017 Aleris Corporation March 19, 2018 Forward-Looking and Other Information IMPORTANT INFORMATION This information is current only as of its date and may
Total assets Total equity Total liabilities
 Group balance sheet as at 31 December Notes R 000 R 000 ASSETS Non-current assets Property, plant and equipment 3 3 263 500 3 166 800 Intangible assets 4 69 086 66 917 Retirement benefit asset 26 117 397
Financial performance
 Aluminium Peik Norenberg Senior Vice President Head of Finance and Strategy Financial performance 51145_6 08 2004 2 H ydro M edia Presentation outline Financial performance key issues Financial performance
Total assets
 GROUP BALANCE SHEET AS AT 31 DECEMBER Notes R 000 R 000 ASSETS Non-current assets Property, plant and equipment 3 3 166 800 2 697 148 Intangible assets 4 66 917 59 777 Retirement benefit asset 27 142 292
2 nd Quarter 2013 Earnings Presentation
 Click to edit Master title style 2 nd Quarter 203 Earnings Presentation August st, 203 Click Disclaimers to edit Master title style IMPORTANT INFORMATION This information is current only as of its date
The new hot rolling mill
 The new hot rolling mill Financial Report 3 rd Quarter 2015 2 AMAG Financial Report Key figures for the AMAG Group Key figures for the Group in EUR million Q3/2015 Q3/2014 Change in % Q1-Q3/2015 Q1-Q3/2014
Fourth quarter report
 4 report Q 2 FOURTH QUARTER REPORT About our reporting About our reporting As of January 1, Hydro has implemented the new accounting standards IFRS 10, IFRS 11, IFRS 12 and the amended IAS 27 and IAS 31
Bahrain. Aluminium. Industry
 Bahrain Aluminium Industry Bahrain Aluminium Industry - Outlook Contribution to Bahrain Economy 1.45 Million Units Produced in 2015. 28% of total Bahraini exports. 12% of the Bahrain s GDP Over 5,000 People
first quar ter r eport
 Q1 first report 2 FIRST QUARTER REPORT Contents Financial review 3 Overview 3 Market developments and outlook 5 Additional factors impacting Hydro 7 Underlying EBIT 8 Finance 12 Tax 12 Items excluded from
Financial and operating performance
 79 FINANCIAL AND OPERATING PERFORMANCE FINANCIAL AND OPERATING PERFORMANCE Edit... Index 79 05: Financial and operating performance Financial and operating review p.80 Liquidity and capital resources p.94
second quarter report
 Q2 second report 1 SECOND QUARTER REPORT Contents Financial review 2 Overview 2 Market developments and outlook 5 Additional factors impacting Hydro 8 Underlying EBIT 9 Finance 14 Tax 14 Interim financial
and operating performance
 119 Financial and operating review p.120 Liquidity and capital resources p.134 Additional information p.137 03: Financial and operating performance QUICK OVERVIEW Hydro had underlying EBIT of NOK 5,692
first quarter report
 Q1 first report 1 FIRST QUARTER REPORT Contents Financial review 2 Overview 2 Market developments and outlook 4 Additional factors impacting Hydro 7 Underlying EBIT 8 Finance 13 Tax 13 Interim financial
Third-quarter earnings burdened by raw material-related losses. Group adjusted EBITDA at EUR 56 million
 1 (23) Contents Highlights in the third quarter of 2017... 2 Highlights during the first nine months of 2017... 2 Business and financial outlook for the fourth quarter of 2017... 3 CEO Roeland Baan...
First quarter report 2009 Q1 Q3 Q2 Q4
 report Q1 Q3 Q2 Q4 page 2 FIRST QUARTER Contents Contents Financial review 3 Aluminium Metal 6 Aluminium Products 12 Energy 15 Corporate, other and eliminations 16 Items excluded from underlying EBIT and
Underlying EBIT. NOK 2,032 million
 report 1 2 3 4 page 2 Financial review Revenues Underlying EBIT Underlying Earnings per share 30,000 25,000 20,000 15,000 10,000 5,000 3,000 2,500 2,000 1,500 1,000 500 NOK 2.0 1.5 1.0 0.5 0 1q 07 2q 07
3 rd Quarter 2013 Earnings Presentation
 Click to edit Master title style 3 rd Quarter 203 Earnings Presentation November 6 th, 203 Click Disclaimers to edit Master title style IMPORTANT INFORMATION This information is current only as of its
Global Aluminum FRP Industry
 28 th International Aluminum Conference, Geneva, Switzerland Global Aluminum FRP Industry Sustainability Economic & Environmental Erwin Mayr, President Novelis Europe 9/19/2013 Topic today: Industry Sustainability
Company Release Fiscal Year 2016/17
 Company Release Fiscal Year 2016/17 October 1, 2016 to September 30, 2017 At a Glance Key Aurubis Group figures Q4 Fiscal year 2016/17 2015/16 Change 2016/17 2015/16 Change Revenues m 2,851 2,399 19 %
TONGAAT HULETT AUDITED RESULTS FOR THE YEAR ENDED 31 MARCH 2011
 1 TONGAAT HULETT AUDITED RESULTS FOR THE YEAR ENDED 31 MARCH 2011 Revenue of R9,681 billion (2010: R8,789 billion) Profit from operations of R1,338 billion (2010: R1,500 billion) Headline earnings of R806
Second Quarter 2018 Earnings Call. July 24, 2018
 Second Quarter 2018 Earnings Call July 24, 2018 Forward-looking statements Certain statements contained in this presentation may constitute forward-looking statements within the meaning of the Private
Norsk Gjenvinning Group 3rd Quarter 2017 Erik Osmundsen, CEO and Dean Zuzic, CFO
 Norsk Gjenvinning Group 3rd Quarter 2017 Erik Osmundsen, CEO and Dean Zuzic, CFO Disclaimer VV Holding AS is providing the following interim financial statements for Q3 2017 to holders of its NOK 2,235,000,000
Annual Accounts CEO Roeland Baan CFO Chris de la Camp. February 2, 2017
 Annual Accounts 216 CEO Roeland Baan CFO Chris de la Camp February 2, 217 Today s attendees from Outokumpu Roeland Baan CEO Chris de la Camp CFO Tommi Järvenpää Director Investor Relations 2 Disclaimer
Hydro. Executive Vice President and CFO, John Ottestad. Cheuvreux European Large Cap Conference Paris, 30 March 2007
 Hydro Executive Vice President and CFO, John Ottestad Cheuvreux European Large Cap Conference Paris, 30 March 2007 Agenda The heritage 1999-2007 years of transformation New Hydro Page: 2 We have a rich
31 Dec Dec Dec Dec Dec Dec Dec Dec Dec Dec Dec Dec 2017
 Shareholder returns Kumba s share price continued to recover significantly during the year from R159 at to end the year at R379, gaining the accolade of best performing share on the JSE. The share price
Investor Presentation. Heavy plate rolling mill starts operating in July at the Ouro Branco mill (MG)
") Investor Presentation Heavy plate rolling mill starts operating in July at the Ouro Branco mill (MG) Agenda Outlook Gerdau Highlights 2 Economic outlook GDP Growth 2014 2015f 2016f World 3.4% 3.1% 3.2%
Investor Presentation Heavy plate rolling mill starts operating in July at the Ouro Branco mill (MG) Agenda Outlook Gerdau Highlights 2 Economic outlook GDP Growth 2014 2015f 2016f World 3.4% 3.1% 3.2%
Constellium Reports Third Quarter 2017 Financial Results
 Constellium Reports Third Quarter Financial Results Amsterdam October 26, Constellium N.V. (NYSE and Euronext Paris: CSTM) today reported results for third quarter. Shipments of 374 thousand metric tons,
2017 Full Year Results Presentation
 2017 Full Year Results Presentation Australia's leading supplier of aluminium products and solutions 5 plants; 8 extrusion presses 18 distribution centres Australia-wide Annual extrusion capacity 70k tonnes
Continued good development during second quarter. Second quarter 2018 First half-year 2018
 2nd Quarter HALF-YEAR REPORT Continued good development during second quarter Second quarter First half-year Sales volume increased by 0.5 per cent to 99.1 ktonnes (98.7). Net sales rose to SEK 3,443 million
Financial review. Interim financial statements. Other information
 Third quarter report 2007 1 2 3 Financial review Results of operations new Hydro 3 Summary of results new Hydro 4 Consolidated results Hydro 7 Aluminium Metal 9 Aluminium Products 12 Rolled Products 13
Financial results
 www.arcelormittalsa.com Financial results for the year ended December 2012 www.arcelormittalsa.com Overview CEO Safety - Journey to Zero OVERVIEW Unit 2011 LTIFR 2012 LTIFR Comments AMSA 1.24 0.61 No fatalities
Iron Ore & Steel Derivatives Let the Battle Begin
 Iron Ore & Steel Derivatives Let the Battle Begin Topics Raw Material Price Volatility Financial Hedging Attributes Iron Ore World Steel Exchange Scrap Presented by: DATE: Tuesday November 30, 2010 Patrick
Think Future. Think Aluminium. Think Hulamin.
 INTEGRATED ANNUAL REPORT for the year ended 31 December 2012 Think Future. Think Aluminium. Think Hulamin. AT OUR CORE OUR VALUES Mutual respect We treat each other as we would like to be treated. We respect
Research. ART Argent Industrial Limited Full Year Results and Initiation Report. Valuation: Undervalued
 Aug-11 Nov-11 Feb-12 May-12 Aug-12 Nov-12 Feb-13 May-13 Aug-13 Nov-13 Feb-14 May-14 Aug-14 Nov-14 Feb-15 May-15 Aug-15 Nov-15 Feb-16 May-16 Research RESULTS COMMENTARY Argent released a respectable set
Alcoa Announces Highest Quarterly Income and Revenue in Company History
 7/10/2006 Alcoa Announces Highest Quarterly Income and Revenue in Company History NEW YORK--(BUSINESS WIRE)--July 10, 2006--Alcoa (NYSE:AA): Highlights: -- Second quarter 2006 income from continuing operations
Improved performance contributed to higher profit in the quarter
 1st Quarter 2018 INTERIM REPORT JANUARY-MARCH 2018 Improved performance contributed to higher profit in the quarter First quarter 2018 Sales volume increased by 0.3 per cent to 95.0 ktonnes (94.8) and
First quarter April 29, 2009 (1)
") First quarter 2009 April 29, 2009 (1) Highlights 20% drop in realized aluminium price vs Steep fall in demand Firm corrective measures taken Cut in primary aluminium production: 500 000 tonnes Workforce
First quarter 2009 April 29, 2009 (1) Highlights 20% drop in realized aluminium price vs Steep fall in demand Firm corrective measures taken Cut in primary aluminium production: 500 000 tonnes Workforce
2017 Interim Results Corporate Presentation. 25 August 2017
 2017 Interim Results Corporate Presentation 25 August 2017 0 Disclaimer This document may contain forward-looking statements that reflect risks and uncertainties. These forward-looking statements are generally
2013 IR PRESENTATION albasmelter.com
 2013 IR PRESENTATION Disclaimer This document has been prepared and issued by and is the sole responsibility of Aluminium Bahrain B.S.C. (the Company ). The document is being supplied to you solely for
Capital Markets Day 2006
 Capital Markets Day 2006 www.hydro.com 2006-09-28 Cautionary note in relation to certain forward-looking statements Certain statements contained in this announcement constitute forward-looking information
Third Quarter 2018 Earnings Call. October 25, 2018
 Third Quarter 2018 Earnings Call October 25, 2018 Forward-looking statements Certain statements contained in this presentation may constitute forward-looking statements within the meaning of the Private
Investor Presentation
 Investor Presentation 2017 www.gerdau.com 1 Outlook Gerdau Highlights 2 Better outlook for steel consumption Region / Country (in mt and %) 2017f 17/16 World 1,535 1.3% European Union 158 0.5% NAFTA 135
Constellium Reports Solid First Quarter 2015 Financial Results Including Wise Metals
 Constellium Reports Solid First Quarter 2015 Financial Results Including Wise Metals Amsterdam, May 14, 2015 Constellium N.V. (NYSE and Euronext: CSTM) today reported results for the first quarter ended.
Investor Presentation
 Investor Presentation 2017 www.gerdau.com 1 Outlook Gerdau Highlights 2 Better outlook for steel consumption Region / Country (in mt and %) 2017f 17/16 World 1,535 1.3% European Union 158 0.5% NAFTA 135
2 nd Annual Goldman Sachs JB Were Australasian Investment Forum, New York
 2 nd Annual Goldman Sachs JB Were Australasian Investment Forum, New York Kirby Adams, Managing Director and Chief Executive Officer March, 26 ASX Code: BSL Important Notice THIS PRESENTATION IS NOT AND
Strong demand in the third quarter - investing in future growth
 3rd Quarter INTERIM REPORT JANUARY-SEPTEMBER Strong demand in the third quarter - investing in future growth Third quarter Sales volume increased to 93.0 ktonnes (62.8). Organic growth was 4.8 per cent.
Constellium Reports Fourth Quarter and Full Year 2018 Results
 Constellium Reports Fourth Quarter and Full Year Results Amsterdam February 21, 2019 Constellium N.V. (NYSE: CSTM) today reported results for the fourth quarter and full year. Fourth quarter highlights:
Investor Presentation. January 2019
 Investor Presentation January 2019 As Ternium of January I 2019 25, 2019 1 Forward-Looking Statements This presentation contains certain forward-looking statements and information relating to Ternium S.A.
For personal use only
 Financial Results Half year ended 31 December 2016 15 February 2017 Agenda Results Overview Galdino Claro, Group CEO Financial Results Fred Knechtel, Group CFO Strategic Progress & Outlook Galdino Claro,
Investor Presentation. June 2018
 Investor Presentation As of June 1, 2018 Forward-Looking Statements This presentation contains certain forward-looking statements and information relating to S.A. and its subsidiaries (collectively, )
GERDAU S.A. and subsidiaries
 GERDAU S.A. and subsidiaries 05/02/2012 Mission To add value for our customers, shareholders, employees and communities by operating as a sustainable steel business. Vision To be a global organization
Quarterly Report First 9 Months 2017/18
 Quarterly Report First 9 Months 2017/18 October 1, 2017 to June 30, 2018 At a Glance Key Aurubis Group figures Operating Aurubis Group output/throughput 2017/18 20 Change 2017/18 20 Change Concentrate
Amsterdam October 25, 2018 Constellium N.V. (NYSE: CSTM) today reported results for the third quarter ended September 30, 2018.
 today reported results for the third quarter ended September 30, 2018.") Constellium Reports Third Quarter Results Amsterdam October 25, Constellium N.V. (NYSE: CSTM) today reported results for the third quarter. Third quarter highlights: Shipments of 379 thousand metric tons,
Constellium Reports Third Quarter Results Amsterdam October 25, Constellium N.V. (NYSE: CSTM) today reported results for the third quarter. Third quarter highlights: Shipments of 379 thousand metric tons,
Building Earnings Momentum
 1 Building Earnings Momentum R307 million improvement in headline earnings Mix of businesses again a strength Culture of making things happen Return on Capital Employed 2 2004 Financial Results 3 2004
Market analysis. Mines Smelters Zinc Copper. President & CEO Jan Johansson. Boliden s Capital Markets Days 7-8 June 2006 Odda, Norway
 Boliden s Capital Markets Days 7-8 June 2006 Odda, Norway Market analysis President & CEO Jan Johansson Mines Smelters Zinc Copper Boliden s Capital Markets Days 7-8 June 2006 Odda, Norway 2 Continued
Investor Presentation. Heavy plate rolling mill starts operating in July at the Ouro Branco mill (MG)
") Investor Presentation Heavy plate rolling mill starts operating in July at the Ouro Branco mill (MG) Agenda Outlook Gerdau Highlights 2 Economic Outlook GDP Growth 2014 2015f 2016f World 3.4% 3.1% 3.4%
Investor Presentation Heavy plate rolling mill starts operating in July at the Ouro Branco mill (MG) Agenda Outlook Gerdau Highlights 2 Economic Outlook GDP Growth 2014 2015f 2016f World 3.4% 3.1% 3.4%
Credit Suisse Annual Asian Investment Conference
 Adelaide Brighton Limited Credit Suisse Annual Asian Investment Conference Hong Kong, 27 30 March 2017 Martin Brydon Chief Executive Officer and Managing Director Adelaide Brighton Limited Overview of
Annual results Presentation 28 February M. Taylor, Chief Executive Officer B. García-Cos, Chief Financial Officer
 Annual results 2017 Presentation 28 February 2018 M. Taylor, Chief Executive Officer B. García-Cos, Chief Financial Officer Bekaert delivers 10% sales growth and 301 million underlying EBIT - Consolidated
Boom Logistics Limited. Half Year Results Presentation. 25 February Boom Logistics Limited. Half Year Results Presentation.
 Boom Logistics Limited Half Year Results Presentation 25 February 2011 Boom Logistics Limited Half Year Results Presentation 25 February 2011 Summary $5.1m trading NPAT for 1H11, up $4.6m from prior corresponding
Investor Presentation January 2016
 Investor Presentation Forward-Looking Statements This presentation contains certain forward-looking statements and information relating to S.A. and its subsidiaries (collectively, ) that are based on the
News Release. Corus Group plc 2004 Interim Results. Highlights. Substantial improvement in financial performance
 News Release 16 September Ref: 242 Corus Group plc Interim Results Highlights Substantial improvement in financial performance Group operating profit improved by 204m to 147m, with the rate of progress
Platt s Aluminum Symposium The Impact of Scrap Supply/Demand Trends on Key Sectors Panel Discussion
 Platt s Aluminum Symposium 2014 The Impact of Scrap Supply/Demand Trends on Key Sectors Panel Discussion 14 January 2014 1 Cautionary Statement Forward-Looking Statements This presentation contains statements
Alcoa Announces Highest Income and Revenue in Company's History
 Alcoa Announces Highest Income and Revenue in Company's History 2006 Annual Highlights: Annual income from continuing operations of 2.2 billion, or 2.47 per diluted share; excluding restructuring and impairment
Financial Year 2006/07
 Financial Year Investor Relations June 2007 www.voestalpine.com - Status Quo Revenue EBITDA EBIT FY 7.05 bn 1.37 bn 1.01 bn Divisions Steel Railway Automotive Profilform Systems Revenue/Division 49 % 27
Solidly on track in achieving our targets
 Solidly on track in achieving our targets Roeland Baan, CEO Credit Suisse Steel & Mining Conference September 12, 2017 Disclaimer This presentation contains, or may be deemed to contain, statements that
Norsk Gjenvinning Group 3rd Quarter 2017 Erik Osmundsen, CEO and Dean Zuzic, CFO
 Norsk Gjenvinning Group 3rd Quarter 2017 Erik Osmundsen, CEO and Dean Zuzic, CFO Disclaimer VV Holding AS is providing the following interim financial statements for Q3 2017 to holders of its NOK 2,235,000,000
MONDI GROUP RESULTS FOR THE YEAR ENDED 31 DECEMBER February 2011
 MONDI GROUP RESULTS FOR THE YEAR ENDED 31 DECEMBER 21 February 2011 Agenda Highlights Financial overview Operational review Summary Appendices Page 2 Key financial highlights Earnings significantly up
Financial Statements Release 2017
 Financial Statements Release 217 CEO Roeland Baan CFO Chris de la Camp January 31, 218 Disclaimer This presentation contains, or may be deemed to contain, statements that are not historical facts but forward-looking
Disclaimer FORWARD LOOKING STATEMETNS. This text includes forward looking statements.
 May 2017 Disclaimer This presentation has been prepared by Halcor S.A. (the «Company») for use during the Hellenic Fund and Asset Management Association. This text is provided under confidentiality for
MAGNITOGORSK IRON & STEEL WORKS. Magnitogorsk Steel (MMK) Q2 and H IFRS Financial Results Presentation
 Q2 and H IFRS Financial Results Presentation") MAGNITOGORSK IRON & STEEL WORKS Magnitogorsk Steel (MMK) and H1 212 IFRS Financial Results Presentation MMK Group Highlights Financials Revenue USD 2,516 mln 4% growth q-o-q Operating profit USD 95 mln
MAGNITOGORSK IRON & STEEL WORKS Magnitogorsk Steel (MMK) and H1 212 IFRS Financial Results Presentation MMK Group Highlights Financials Revenue USD 2,516 mln 4% growth q-o-q Operating profit USD 95 mln
Transpacific FY15 Half Year Results Presentation
 Transpacific FY15 Half Year Results Presentation Robert Boucher CEO Brendan Gill CFO 20 February 2015 - Disclaimer Forward looking statements - This presentation contains certain forward-looking statements,
Annual Financial Results
 Mittal Steel South Africa Limited Annual Financial Results for the 12 months ended December 2006 market & operations Rick Reato Introduction and Overview Earnings remain strong at R4.6bn - Earnings per
INTERIM RESULTS PRESENTATION
 INTERIM RESULTS PRESENTATION for the six months ended 31 March 2016 Agenda Strategic Update Financial Performance Divisional Performance Outlook and Imperatives 1 Strategic Update Phil Roux CEO 2 Environmental
First Quarter 2018 Earnings Call. April 26, 2018
 First Quarter 2018 Earnings Call April 26, 2018 Forward-looking statements Certain statements contained in this presentation may constitute forward-looking statements within the meaning of the Private
Global Aluminum Markets for Packaging, 25 th October 2017, Nashville, Tn
 Global Aluminum Markets for Packaging, 25 th October 2017, Nashville, Tn Paul Williams, Research Manager, Aluminium www.aluminum-us.com October 25-26, 2017 2 Structure of presentation 1 Packaging sector
2016 Investor Presentation Bank of America Merrill Lynch - Global Metals & Mining Conference 11 May ASX: SGM USOTC: SMSMY
 2016 Investor Presentation Bank of America Merrill Lynch - Global Metals & Mining Conference 11 May 2016 ASX: SGM USOTC: SMSMY www.simsmm.com Business Highlights Company Global leader in metals and electronics
What Do the Section 232 National Security Investigations Mean for You? August 2017
 What Do the Section 232 National Security Investigations Mean for You? August 2017 Trump s Trade Policy Agenda Introduced March of this year, but light on specifics. Main theme is more aggressive approach
Third Quarter 2018 Financial Results
 Third Quarter 2018 Financial Results October 26, 2018 C r e a t i n g I n n o v a t i v e S t e e l S o l u t i o n s AK Steel Executive Management Team Roger Newport Kirk Reich Jaime Vasquez Chief Executive
Annual F inancial Financial Results 2008
 Annual Financial Results 2008 16 February 2009 Disclaimer Our presentation contains some forward looking statements with respect to the financial Our presentation contains some forward looking statements
Segmental operating profit 227.7m Down 17% 1. Reported earnings per share 59.8p Down 4%
 Highlights Revenue 1,649m Down 5% 1 Segmental operating profit 227.7m Down 17% 1 Segmental operating margins 13.8% Down 160bps Operating cash flow 2 246m Up 6% Reported earnings per share 59.8p Down 4%