4Q15 4Q14 % Change Million EUR 12M15 12M14 % Change
|
|
|
- Cynthia Sparks
- 5 years ago
- Views:
Transcription


1


2


3


4
5 4Q15 4Q14 % Change Million EUR 12M15 12M14 % Change % Revenue Group 1, , % Revenue Other segment % Revenue at comparable scope 1, , % % Rebitda Group % Rebitda Other segment % Rebitda at comparable scope % Rebit Group % - Rebit Other segment Rebit at comparable scope % Profit (+) / loss (-) for the period % Total comprehensive income for the period % Cash flow from operating activities minus capital expenditure % Net debt Notional net debt
6
7
8 180.4mEUR Industrial solutions 28.6% Agro 1,589.0 meur 40.6% 76.9% Agro Biovalorization 30.7% 23.7% Industrial solutions 0.0% -0.7% Bio-valorization
9 AGRO Million EUR 12M15 12M14 % change Revenue % REBITDA % REBITDA margin 21.5% 19.0% - REBIT % REBIT margin 17.9% 15.4% -
10 BIO-VALORIZATION Million EUR 12M15 12M14 % change Revenue % REBITDA nm REBITDA margin -0.2% 1.3% - REBIT nm REBIT margin -6.1% -4.8% -
11 INDUSTRIAL SOLUTIONS Million EUR 12M15 12M14 % change Revenue % REBITDA % REBITDA margin 9.4% 7.2% - REBIT % REBIT margin 4.1% 2.0% -

 8.1 (7.2) 4.0 104.4 77.1 81.9 (6.")
12 REBIT FY15 Non-recurring items EBIT Net finance costs Income Tax Expense Share of result of investments PROFIT FY15 (27.3) 8.1 (7.2) (6.7)
13 3.3. CONSOLIDATED STATEMENT OF FINANCIAL POSITION Million EUR ASSETS Total non-current assets Property, plant and equipment Goodwill Other intangible assets Investments accounted for using the equity method Other investments Deferred tax assets Trade and other receivables Derivative financial instruments Total current assets Inventories Trade and other receivables Derivative financial instruments Cash and cash equivalents Non-current assets classified as held for sale Total assets 1, ,185.4
14 Million EUR EQUITY AND LIABILITIES Total equity Equity attributable to equity holders of the company Non-controlling interest Total liabilities Total non-current liabilities Financial liabilities Employee benefits Provisions Trade and other payables Derivative financial instruments Deferred tax liabilities Total current liabilities Bank overdrafts Financial liabilities Trade and other payables Derivative financial instruments Current tax liabilities Employee benefits Provisions Total equity and liabilities 1, ,185.4
15 CONSOLIDATED STATEMENT OF CASH FLOWS Million EUR OPERATING ACTIVITIES Profit (+) / loss (-) for the period Depreciation, amortization and impairment losses on tangible assets, goodwill and other intangible assets Impairment losses on other investments Impairment losses on disposal groups Changes in provisions Revaluation electricity forward contracts Finance costs Finance income Loss / (profit) on sale of non-current assets Share of result of equity accounted investees, net of income tax Income tax expense Other non-cash items Changes in inventories Changes in trade and other receivables Changes in trade and other payables Change in accounting estimates - inventory write off Cash generated from operations Income tax (paid)/received Dividends received Cash flow from operating activities
16 INVESTING ACTIVITIES Acquisition of property, plant and equipment Acquisition of other intangible assets Acquisition of businesses, net of cash acquired Subsequent consideration paid - acquisition Acquisition of investments, net of cash acquired Proceeds from the sale of property, plant and equipment Proceeds from the sale of other intangible assets Proceeds from the sale of subsidiaries, net of cash disposed of Proc. from the sale of investments accounted for using the eq. method Proceeds from the sale of other investments Capital decrease from other investments Capital decrease from investments accounted for using the eq. method Cash flow from investing activities FINANCING ACTIVITIES Increase of issued capital - issuance new shares Increase of issued capital - conversion of warrants Costs capital increase Capital increase from non-controlling interests Change in non-recourse factoring and securitization Proceeds from new borrowings (Reimbursement) of borrowings Cash movement resulting from settlement financial instruments Interest paid Interest received Other finance costs paid (Increase) of long term receivables Decrease of long term receivables Cash flow from financing activities Net increase / (decrease) in cash and cash equivalents Effect of exchange rate differences Cash and cash eq. less bank overdrafts at the beginning of the period Cash and cash eq. less bank overdrafts at the end of the period
17
18 Tessenderlo Group is a worldwide specialty company, focused on food, agriculture, water management and on valorizing bio-residuals. The group employs about 4,800 people and is a leader in most of its markets, with a consolidated revenue of 1.6 billion EUR in Tessenderlo Chemie NV is listed on NYSE Eurolist by Euronext Brussels and is part of Next 150 and BEL Mid indices. Financial News wires: Bloomberg: TESB BB Reuters: TesBt.BR Datastream: B:Tes 2015 Results February 16, 2016
2Q15 2Q14 % Change Million EUR HY15 HY14 % Change
 2Q15 2Q14 % Change Million EUR HY15 HY14 % Change 444.3 379.3 17.1% Revenue Group 850.1 775.7 9.6% - -1.4 - Revenue Other segment - -31.2 444.3 377.9 17.6% Revenue at comparable scope 850.1 744.5 14.2%
Tessenderlo Group 2Q16 and HY16 results
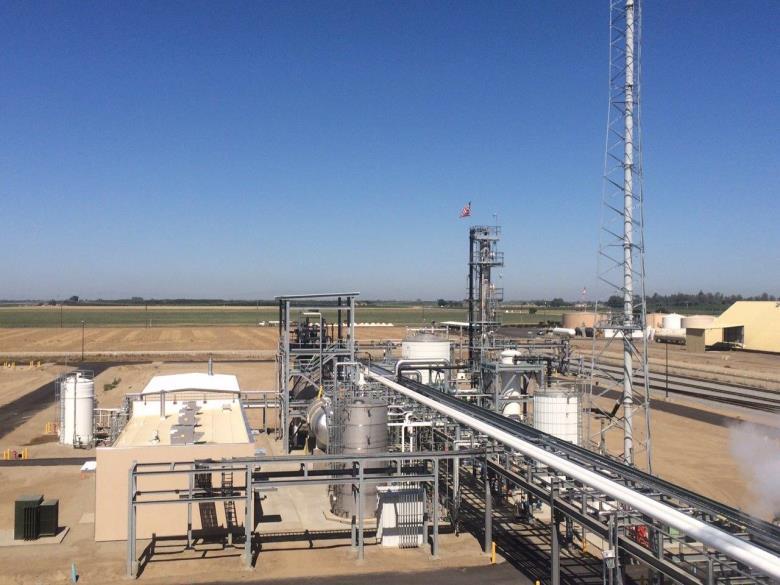
 Regulated information 1 Brussels, August 24, 2016 8:00 am CET Press release Tessenderlo Group 2Q16 and HY16 results Key Events In the first half of 2016, Tessenderlo Kerley, Inc. (TKI) announced the startup
TESSENDERLO GROUP 2Q17 AND HY17 RESULTS: STABLE HALF-YEAR REBITDA DESPITE CHALLENGING MARKET CONDITIONS
 PRESS RELEASE Regulated information 1 August 23, 2017, 8:00 am CET TESSENDERLO GROUP 2Q17 AND HY17 RESULTS: STABLE HALF-YEAR REBITDA DESPITE CHALLENGING MARKET CONDITIONS 1. KEY EVENTS Construction works
% -4.0% Revenue Group % -8.6% - Other revenue included
 PRESS RELEASE Regulated information 1 Brussels, August 22, 2018, 8:00 am CET TESSENDERLO GROUP 2Q18 AND HY18 RESULTS: STRONG SECOND QUARTER RESULTS, ALTHOUGH 2018 HALF YEAR RESULTS BELOW THOSE OF PREVIOUS
% REBITDA
 PRESS RELEASE Regulated information 1 March 14, 2018, 8:00 am CET TESSENDERLO GROUP 4Q17 AND 2017 RESULTS: REBITDA SLIGHTLY LOWER THAN EXPECTED, BUT STRONG CASH GENERATION AND SIGNIFICANT NET FINANCIAL
Tessenderlo Group reports solid operational performance and completes divestment of PVC/Chlor-Alkali businesses
 Regulated information* Brussels, August 25 th, 2011 Press release All comments included in this document, unless otherwise indicated, are based on the group s continuing operations QUARTERLY REPORT 30
Tessenderlo Group 3Q10 results: further improvements in operational performance and financial position
 Brussels, November 5 th, 2010 Regulated information* Press release QUARTERLY REPORT 30 SEPTEMBER 2010 Tessenderlo Group 3Q10 results: further improvements in operational performance and financial position
TESSENDERLO GROUP: SOLID 2018 RESULTS
 TESSENDERLO GROUP: SOLID 2018 RESULTS PRESS RELEASE Regulated information 1 March 14, 2019, 8:00 am CET 1. KEY EVENTS In January 2019, Performance Chemicals lifted the force majeure on the sodium hydroxide
Tessenderlo Group 2009 results: significant net loss confirmed but solid cash flow from operations despite very challenging economic environment
 Brussels, 12 February 2010 Regulated information* Press release QUARTERLY REPORT DECEMBER 2009 Tessenderlo Group 2009 results: significant net loss confirmed but solid cash flow from operations despite
Conference call 2Q17 and HY17 results
 Conference call 2Q17 and HY17 results Brussels, August 23, 2017 A replay of the webcast will be available on our website www.tessenderlo.com 2 BUSINESS HIGHLIGHTS Tessenderlo Kerley, Inc. East Dubuque
Conference call 2Q18 and HY18 results
 Conference call 2Q18 and HY18 results Brussels, August 22, 2018 A replay of the webcast will be available on our website www.tessenderlo.com Business highlights Acquisition of T-Power nv, a 425 MW combined-cycle
TESSENDERLO GROUP AND PICANOL GROUP ANNOUNCE PLAN TO MERGE ACTIVITIES INTO ONE BELGIAN INDUSTRIAL GROUP
 PRESS RELEASE Regulated information Embargo until 16 December 2015, 9:30 am CET TESSENDERLO GROUP AND PICANOL GROUP ANNOUNCE PLAN TO MERGE ACTIVITIES INTO ONE BELGIAN INDUSTRIAL GROUP BOTH COMPANIES TO
Tessenderlo Group. Interim report for the 6 month period ended 30 June
 Brussels, August 29, 2013 Regulated information Tessenderlo Group Interim report for the 6 month period ended 30 June 2013 1 1 Note that Tessenderlo Group publishes, in addition to this interim report,
Consolidated Statement of Profit or Loss (in million Euro)
") Consolidated Statement of Profit or Loss (in million Euro) Q1 2016 Q1 2017 % change Revenue 603 588-2.5% Cost of sales (408) (396) -2.9% Gross profit 195 192-1.5% Selling expenses (84) (86) 2.4% Research
Consolidated Statement of Profit or Loss (in million Euro) Q1 2016 Q1 2017 % change Revenue 603 588-2.5% Cost of sales (408) (396) -2.9% Gross profit 195 192-1.5% Selling expenses (84) (86) 2.4% Research
Consolidated Statement of Profit or Loss (in million Euro)
") Consolidated Statement of Profit or Loss (in million Euro) Q3 2015 Q3 2016 % change 9m 2015 9m 2016 % change Revenue 661 625-5.4% 1,974 1,873-5.1% Cost of sales (453) (415) -8.4% (1,340) (1,239) -7.5%
Consolidated Statement of Profit or Loss (in million Euro) Q3 2015 Q3 2016 % change 9m 2015 9m 2016 % change Revenue 661 625-5.4% 1,974 1,873-5.1% Cost of sales (453) (415) -8.4% (1,340) (1,239) -7.5%
 5 1. CONSOLIDATED INCOME STATEMENTS (in millions of euros) 2018 2017* REVENUE 2,643 2,505 Cost of sales (1,649) (1,471) GROSS PROFIT 995 1,034 Distribution and marketing costs (250) (224) Research
Consolidated Statement of Profit or Loss (in million Euro)
") Consolidated Statement of Profit or Loss (in million Euro) Unaudited, consolidated figures following IFRS accounting policies. Q2 2017 Q2 2018 H1 2017 H1 2018 Revenue 622 559 1,210 1,108 Cost of sales
Consolidated Statement of Profit or Loss (in million Euro) Unaudited, consolidated figures following IFRS accounting policies. Q2 2017 Q2 2018 H1 2017 H1 2018 Revenue 622 559 1,210 1,108 Cost of sales
PICANOL GROUP REALIZES THE STRONGEST HALF YEAR IN ITS HISTORY INCREASED TURNOVER FORECAST FOR 2016 BASED ON A WELL-FILLED ORDER BOOK
 PRESS RELEASE Regulated information Half-yearly information figures H1 2016 24 August 2016 8u00 CET - Consolidated results H1 2016 - PICANOL GROUP REALIZES THE STRONGEST HALF YEAR IN ITS HISTORY INCREASED
 o o o o - - - - - 1. INTERIM CONSOLIDATED INCOME STATEMENTS (in millions of euros) 2017 2016 REVENUE 2,510 2,312 Cost of sales (1,475) (1,337) GROSS PROFIT 1,035 975 Distribution and marketing
Tessenderlo Group. Interim report for the 6 month period ended 30 June
 Brussels, August 29, 2012 Regulated information Tessenderlo Group Interim report for the 6 month period ended 30 June 2012 1 1 Please note that Tessenderlo Group publishes, in addition to this interim
Reviewed Reviewed Not Reviewed Not Reviewed. Notes 2018
 As of September 30, Statement of Financial Position (Balance Sheet) Reviewed Audited Notes September 30, December 31, ASSETS Current assets 968.088.116 967.988.419 Cash and cash equivalents 5 37.103.817
FINANCIAL RESULTS. Consolidated Financial Statements - Fiscal Year Ended March 31, Consolidated Balance Sheets
 FINANCIAL RESULTS Consolidated Financial Statements - Fiscal Year Ended March 31, 2007-1. Consolidated Balance Sheets (ASSETS) Prior Year End Current Year End (As of March 31, 2006) (As of March 31, 2007)
CONSOLIDATED FINANCIAL STATEMENT YEAR ENDED DECEMBER
 CONSOLIDATED FINANCIAL STATEMENT YEAR ENDED DECEMBER 31 2016 BOURBONOFFSHORE.COM SUMMARY 1. Financial position statement...3 2. Statement of comprehensive income... 4 3. Statement of consolidated cash-flows...
Tessenderlo Group exits commodities and transforms into a global specialty group. Conference call for investors and analysts June 14 th, 2011
 Tessenderlo Group exits commodities and transforms into a global specialty group Conference call for investors and analysts June 14 th, 2011 This document may contain forward-looking statements and information.
Tessenderlo Group. Interim report for the 6 month period ended 30 June
 Brussels, 25 August 2011 Regulated information Tessenderlo Group Interim report for the 6 month period ended 30 June 2011 1 1 Please note that Tessenderlo Group publishes, in addition to this interim report,
APPENDICE 1 - Consolidated income statement
 APPENDICE 1 - Consolidated income statement (in millions of euros) 2008 Net sales 2 514 3 554 Metal price effect* (430) (1 135) Sales at constant metal prices* 2 085 2 419 Cost of sales (2 134) (3 065)
CONSOLIDATED FINANCIAL STATEMENT YEAR ENDED DECEMBER
 CONSOLIDATED FINANCIAL STATEMENT YEAR ENDED DECEMBER 31 2017 BOURBONOFFSHORE.COM SUMMARY 1. Financial position statement...3 2. Statement of comprehensive income... 4 3. Statement of consolidated cash-flows...
2013 CONSOLIDATED ACCOUNTS
 havas.com 1 Consolidated balance sheet ASSETS (in euro million) 12.31.13 Net 12.31.12 12.31.11 Non-current assets Goodwill 1 593 1 603 1 559 Other intangible assets 36 37 41 Property and equipment 255
SHAREHOLDERS GUIDE. Publication date 1 March 2017
 SHAREHOLDERS GUIDE Publication date 1 March 217 2 Bekaert Shareholders Guide Definitions Added value Operating result (EBIT) + remuneration, social security and pension charges + depreciation, amortization,
Statement of Earnings
 audited financial statements Statement of Earnings General Electric Company and consolidated affiliates For the years ended December 31 (In millions; per-share amounts in dollars) 2009 2008 2007 Revenues
Total assets 2,430,653 2,264,086
 of financial position at 31 December 2014 Assets Cash and balances with the Central Bank 376,045 354,862 Loans and advances to banks 347,115 380,728 Derivative financial instruments 2,017 1,237 Financial
Selling, general and administrative expenses 35,645 33,787. Net other operating income (292) (270) Operating profit 44,202 17,756
 (270) Operating profit 44,202 17,756") Condensed Interim Consolidated Income Statement For the quarter ended September 30 Continuing operations Revenue 328,071 258,941 Cost of sales 248,516 207,668 Gross profit 79,555 51,273 Selling, general
Condensed Interim Consolidated Income Statement For the quarter ended September 30 Continuing operations Revenue 328,071 258,941 Cost of sales 248,516 207,668 Gross profit 79,555 51,273 Selling, general
Overview of consolidated financial statements
 Overview of consolidated financial statements Consolidated balance sheet On 31 December 2015 On 31 December 2014 In EUR millions Assets Cash and balances at central banks 64,943 43,409 Loans and advances
KCE Electronics Public Company Limited and its subsidiaries
 Statements of financial position Consolidated financial Separate financial 31 December 31 December 31 December 31 December Assets Note 2014 2013 2014 2013 Current assets Cash and cash equivalents 7 463,016,990
Financial Results For the Fiscal Year 2016 ending January 31, 2016
 Financial Results For the Fiscal Year 2016 ending January 31, 2016 March 16, 2016 Balance Sheets (Consolidated) Thousands of Yen 31 Jan., 2016 Assets Current assets: Cash & Cash equivalents 1,984,469 Accounts
Despite strong headwind from raw material prices, inflation and currencies, REBITDA remains steady
 Press Release Regulated Information FY 2017 results Under embargo until Thursday 22 February 2018 at 7:00 a.m. CET Despite strong headwind from raw material prices, inflation and currencies, REBITDA remains
Opening New Frontiers
 Opening New Frontiers 2 nd QUARTER 2011 RESULTS REGULATED INFORMATION SOLVAY GROUP 2 nd QUARTER BUSINESS REVIEW Excellent operating result in the 2 nd quarter of 2011: REBITDA (EUR 304 million) up by 12%
Statement of Earnings
 audited financial statements Statement of Earnings General Electric Company and consolidated affiliates For the years ended December 31 (In millions; per-share amounts in dollars) 2012 2011 2010 REVENUES
Solvay Group IFRS pro forma financial statements (insert to annual report 2002)
") Solvay Group 2002 IFRS pro forma financial statements (insert to annual report 2002) 2 Solvay Group/2002 IFRS pro forma financial statements Content 2002 IFRS PRO FORMA FINANCIAL STATEMENTS page 3 NOTES
Solvay Group 2002 IFRS pro forma financial statements (insert to annual report 2002) 2 Solvay Group/2002 IFRS pro forma financial statements Content 2002 IFRS PRO FORMA FINANCIAL STATEMENTS page 3 NOTES
Regulated information
 Regulated information JENSEN-GROUP Half-Year Results 2015 1 Consolidated, non-audited key figures Income Statement 30/06/2015-30/06/2014 Non-audited, consolidated key figures June 30, 2015 June 30, 2014
Press release - Regulated information Announcement annual results 2013 Sioen Industries
 - Regulated information Announcement annual results 2013 Sioen Industries Press release Sioen Industries - 28/02/2014 before Stock Market opening 3 Net sales: EUR 323.0 million EBT: EUR 19.9 million (+
KCE Electronics Public Company Limited and its subsidiaries
 Statements of financial position Consolidated Separate financial financial 31 December 31 December Assets Note 2012 2011 2012 2011 Current assets Cash and cash equivalents 7 397,177,878 535,535,464 94,974,827
HALF YEARLY FINANCIAL REPORT FIRST SEMESTER Ter Beke Half Year Financial Report 2009 Regulated Information 28 August :45 p.m.
 HALF YEARLY FINANCIAL REPORT FIRST SEMESTER 2009 28 August 2009 5:45 p.m. 1/16 INTERIM ANNUAL REPORT MAIN ITEMS AND IMPORTANT EVENTS Ter Beke group: o Total turnover of EUR 191.4 million versus EUR 192.1
JABIL CIRCUIT, INC. AND SUBSIDIARIES CONDENSED CONSOLIDATED BALANCE SHEETS
 CONDENSED CONSOLIDATED BALANCE SHEETS (In thousands) 2011 2010 ASSETS Current assets: Cash and cash equivalents $ 888,611 $ 744,329 Trade accounts receivable, net 1,100,926 1,408,319 Inventories 2,227,339
Consolidated statement of total comprehensive income
 Consolidated statement of total comprehensive income (x 1,000) 2016 2015 Continuing operations Net revenue 89,729 71,787 Cost of Materials and subcontractors 10,354 6,240 Employee benefit expenses 52,014
Financial Statements for Fiscal 2003 (April 1, 2003 to March 31, 2004) Nippon Steel Chemical Co., Ltd.
 Nippon Steel Chemical Co., Ltd.") Financial Statements for Fiscal 2003 (April 1, 2003 to March 31, 2004) Nippon Steel Chemical Co., Ltd. 1 Consolidated Operating Performances 2004 2003 Increase or decrease 2004 from previous term Net sales
Financial Statements for Fiscal 2003 (April 1, 2003 to March 31, 2004) Nippon Steel Chemical Co., Ltd. 1 Consolidated Operating Performances 2004 2003 Increase or decrease 2004 from previous term Net sales
Updated reporting Philips Group
 Updated reporting Philips Group all amounts in millions of euros unless otherwise stated all the data included in this report are unaudited financial reporting according to IFRS unless otherwise stated
ANA reports non-consolidated financial results for the interim of FY2007
 Six months ended September 30, 2007 Non-consolidated financial results All Nippon Airways Co., Ltd. (9202) ANA reports non-consolidated financial results for the interim of FY2007 1.Non-consolidated financial
DIVIDEND WITH STOCK OPTION
 Regulated information* Brussels, 8 June 2010 Information document DIVIDEND WITH STOCK OPTION I. Short summary of the main features of the dividend with stock option Three possible choices Coupon number
TESSENDERLO GROUP Because every molecule counts. CEO Frank Coenen Tessenderlo Group
 TESSENDERLO GROUP Because every molecule counts CEO Frank Coenen Tessenderlo Group Our dream We want to ensure that life on our planet can thrive by creating a world that makes the most of its resources.
POU CHEN CORPORATION AND SUBSIDIARIES
 CONSOLIDATED BALANCE SHEETS March 31, 2013 December 31, 2012 March 31, 2012 January 1, 2012 ASSETS Amount % Amount % Amount % Amount % CURRENT ASSETS Cash and cash equivalents (Notes 4 and 6) $ 29,346,249
EVS reports third quarter 2018 results
 Publication on November 15, 2018, before market opening Regulated information Press release quarterly results EVS Broadcast Equipment S.A.: Euronext Brussels (EVS.BR), Bloomberg (EVS BB), Reuters (EVSB.BR)
Note of Transition to IFRS
 - 11 - Note of Transition to Upon to, the Company s opening consolidated statement of financial position was prepared by 1 as of April 1, 2013, its date to, with required adjustments made to the consolidated
Transition to U.S. GAAP and U.S. dollar as reporting currency
 Transition to U.S. GAAP and U.S. dollar as reporting currency A summary document for investors and analysts Safe Harbor Statement Certain statements contained in this document that are not statements of
Constellium Reports Fourth Quarter and Full Year 2018 Results
 Constellium Reports Fourth Quarter and Full Year Results Amsterdam February 21, 2019 Constellium N.V. (NYSE: CSTM) today reported results for the fourth quarter and full year. Fourth quarter highlights:
CONSOLIDATED BALANCE SHEET
 CONSOLIDATED BALANCE SHEET December 31, 2018 A S S E T S CURRENT ASSETS: Cash and time deposits 51,215 Accounts receivable-trade 95,065 Inventories 5,405 Short-term loans receivable 43,021 Deferred tax
Consolidated Balance Sheet - 1/2
 Consolidated Balance Sheet March 31, 212 ASSETS CURRENT ASSETS: Cash and cash equivalents (Notes 8 and 19) Time deposits over three months (Note 19) Receivables (Note 19): Trade notes (Note 11) Trade accounts
Cegedim: Significant improvement in profitability in Q1 2015
 SA au capital de 13 336 506,43 euros R. C. S. Nanterre B 350 422 622 www.cegedim.com Page 1 Quarterly Financial Information as of March 31, 2015 IFRS - Regulated Information - Not Audited Cegedim: Significant
Total current assets 1,829,773,522 1,676,918, ,618, ,874,951. Goodwill 17,934,556 17,934,
 Balance sheets As at 31 December 2008 and 2007 Note 2008 2007 2008 2007 Assets Current assets Cash and cash equivalents 125,073,235 213,721,846 35,553,545 69,417,520 Current investment - restricted cash
Non-GAAP Information 5/3/2018
 5/3/2018 Use of Non-GAAP Financial Information: The Company believes that non-gaap performance measures, which management uses in evaluating the Company's business, may provide users of the Company's financial
Consolidated income statement
 Consolidated income statement NET SALES 6,403 6,711 Metal price effect 1 (1,816) (2,022) SALES AT CONSTANT METAL PRICES 1 4,587 4,689 Cost of sales (5,658) (5,950) Cost of sales at constant metal prices
Itron, Inc. Comparison of Key 2015 Financial Metrics to Preliminary Results Announced February 17, Total operating expenses 486, ,839
 Itron, Inc. Comparison of Key 2015 Financial Metrics to Preliminary Results Announced February 17, 2016 (Unaudited, in thousands, except per share data) (announced Feb. 17, 2016) Preliminary FY 2015 Final
PRESS RELEASE EVS REPORTS FIRST QUARTER 2018 RESULTS
 Publication on May 17, 2018, before market opening Regulated information Press release quarterly results EVS Broadcast Equipment S.A.: Euronext Brussels (EVS.BR), Bloomberg (EVS BB), Reuters (EVSB.BR)
AGILENT TECHNOLOGIES, INC. CONDENSED CONSOLIDATED STATEMENT OF OPERATIONS (In millions, except per share amounts) (Unaudited)
 (Unaudited)") CONDENSED CONSOLIDATED STATEMENT OF OPERATIONS (In millions, except per share amounts) Twelve Months Ended October 31, Percent 2002 2001 Inc/(Dec) Orders $ 6,013 $ 6,414 (6%) Net revenue $ 6,010 $ 8,396
CONDENSED CONSOLIDATED STATEMENT OF OPERATIONS (In millions, except per share amounts) Twelve Months Ended October 31, Percent 2002 2001 Inc/(Dec) Orders $ 6,013 $ 6,414 (6%) Net revenue $ 6,010 $ 8,396
EUR millions, except earnings per share expressed in EUR
 Publication on November 16, 2017, before market opening Regulated information Press release quarterly results EVS Broadcast Equipment S.A.: Euronext Brussels (EVS.BR), Bloomberg (EVS BB), Reuters (EVSB.BR)
FINANCIAL ANALYSTS MEETING
 RECTICEL - FY2011 Results FINANCIAL ANALYSTS MEETING Speakers: Olivier Chapelle, CEO Jean-Pierre Mellen, CFO Brussels, 02 March 2012-1 - Agenda 1. Highlights 2. FY2011 consolidated results 3. FY2011 comments
Half year financial report. January June 2017
 Half year financial report January June 2017 Key figures 4-6/2017 4-6/2016 Change% 1-6/2017 1-6/2016 Change% 1-12/2016 Revenue, MEUR 196.0 192.4 1.9% 352.6 350.6 0.6% 775.8 Like-for-like revenue development,
Full Year Results 2015: Bekaert on track
 Press release Regulated information 26 February 2016 Press - Investors Katelijn Bohez T +32 56 23 05 71 www.bekaert.com Full Year Results 2015: Bekaert on track Strong margin growth, robust cash generation
CONSOLIDATED FINANCIAL STATEMENTS
 CONSOLIDATED FINANCIAL STATEMENTS FOR THE YEAR ENDED 31 DECEMBER ENDESA, S.A. AND SUBSIDIARIES CONSOLIDATED STATEMENTS OF FINANCIAL POSITION AT 31 DECEMBER AND 31 DECEMBER ASSETS 31 December 31 December
Picanol Group + Tessenderlo Group
 Picanol Group + Tessenderlo Group In 2013 Picanol Group acquired a 27.52% controlling interest in TessenderloGroup from the French company SNPE SA. Picanol Group's investment in TessenderloGroup aimed
Appendix 1: Results by business sector and geographic area - Full Year
 Appendix 1: Results by business sector and geographic area - Full Year I. SALES Innovative Materials 1 9,703 9,857 +1.6% +1.4% +4.5% Flat Glass 5,217 5,364 +2.8% +2.7% +6.5% High-Performance Materials
GILAT SATELLITE NETWORKS LTD. CONDENSED CONSOLIDATED STATEMENTS OF OPERATIONS U.S. dollars in thousands (except share and per share data)
") CONDENSED CONSOLIDATED STATEMENTS OF OPERATIONS (except share and per share data) 2016 2015 2016 2015 Audited Revenues $ 279,551 $ 197,543 $ 80,345 $ 67,682 Cost of revenues 204,061 143,318 56,147 47,181
CONDENSED CONSOLIDATED STATEMENTS OF OPERATIONS (except share and per share data) 2016 2015 2016 2015 Audited Revenues $ 279,551 $ 197,543 $ 80,345 $ 67,682 Cost of revenues 204,061 143,318 56,147 47,181
PRESS RELEASE For publication: March 14, hrs
 Piekstraat 2 3071 EL Rotterdam PRESS RELEASE For publication: March 14, 2019 08.00 hrs HUNTER DOUGLAS RESULTS 2018 Rotterdam, March 14, 2019 Hunter Douglas, the world market leader in window coverings
Consolidated income statement
 Consolidated income statement 2013 2012 Restated* Net sales 3,412 3,577 Metal price effect** (1,061) (1,179) Sales at constant metal prices** 2,351 2,398 Cost of sales (3,016) (3,170) Cost of sales at
PRESS RELEASE - March 2008 FULL YEAR RESULTS (shortened accounting year; January 1 March 31, 2008)
") PRESS RELEASE - March 2008 FULL YEAR RESULTS (shortened accounting year; January 1 March 31, 2008) Highlights Real closes the shortened accounting year, 1 January to 31 March, 2008 with an increase in
PRESS RELEASE - March 2008 FULL YEAR RESULTS (shortened accounting year; January 1 March 31, 2008) Highlights Real closes the shortened accounting year, 1 January to 31 March, 2008 with an increase in
Updated to reflect new accounting policy changes and quarterly presentation on Television business reported as discontinued operations.
 Updated reporting Philips Group Updated to reflect new accounting policy changes and quarterly presentation on Television business reported as discontinued operations. all the data included in this report
Prior Third Quarter End Current Third Quarter End (As of December 31, 2005) (As of December 31, 2006)
 (As of December 31, 2006)") FINANCIAL RESULTS Third Quarter Consolidated Financial Statements - Fiscal Year Ending March 31, 2007-1. Consolidated Balance Sheets Prior Third Quarter End Current Third Quarter End (As of December 31,
FINANCIAL RESULTS Third Quarter Consolidated Financial Statements - Fiscal Year Ending March 31, 2007-1. Consolidated Balance Sheets Prior Third Quarter End Current Third Quarter End (As of December 31,
Interim results for the six months ended 30 September 2011
 Press Release November 25, 2011 7:30 AM Huizingen, Belgium REGULATED INFORMATION Interim results for the six months ended 30 September 2011 14% year-over-year growth in total turnover in the first half
CONSOLIDATED FINANCIAL STATEMENTS
 CONSOLIDATED FINANCIAL STATEMENTS FOR THE SIX MONTHS ENDED 30 JUNE 2017 ENDESA, S.A. AND SUBSIDIARIES CONSOLIDATED STATEMENTS OF FINANCIAL POSITION AT 30 JUNE 2017 AND 31 DECEMBER 2016 (*) Unaudited ASSETS
Consolidated Balance Sheet - 1/2
 Consolidated Balance Sheet March 31, ASSETS CURRENT ASSETS (Note 3): Cash and cash equivalents (Notes 9 and 21) Time deposits over three months (Note 21) Receivables (Note 21): Trade notes (Note 13) Trade
ITURAN LOCATION AND CONTROL LTD. Consolidated Interim Financial Statements as of March 31, 2014
 Consolidated Interim Financial Statements as of March 31, 2014 Consolidated Financial Statements as of March 31, 2014 Table of Contents Page Consolidated Financial Statements: Balance Sheets 2-3 Statements
ITURAN LOCATION AND CONTROL LTD. Consolidated Interim Financial Statements as of March 31, 2013
 Consolidated Interim Financial Statements as of March 31, 2013 Consolidated Financial Statements as of March 31, 2013 Table of Contents Page Consolidated Financial Statements: Balance Sheets 2-3 Statements
4 TH QUARTER AND FULL YEAR 2015 RESULTS FEBRUARY 11, :00AM ET NYSE: NLSN
 4 TH QUARTER AND FULL YEAR 2015 RESULTS FEBRUARY 11, 2016 8:00AM ET NYSE: NLSN SAFE HARBOR FOR FORWARD-LOOKING STATEMENTS The following discussion contains forward-looking statements, including those about
Performance and Information
 Performance and Information This section introduces the financial position and basic details of the Ajinomoto Group. Eleven-Year Summary of 62 Selected Financial Data Consolidated Statements of 64 Financial
- 21 -
 - 21 - Consolidated Balance Sheet Tokyu Fudosan Holdings Corporation Yen (millions) U.S. dollars (thousands) (Note 2) Account title As of March 31, 2014 As of March 31, 2014 Assets Current assets Cash
Press Release. Outlook
 Press Release October 26, 2018 Signify reports third quarter sales of EUR 1.6 billion, improvement in operational profitability by 150 bps to 12.0% and free cash flow to EUR 64 million 2018 1 Sales of
SPIE Group Consolidated financial statements as at December 31, 2015
 SPIE Group Consolidated financial statements as at December 31, 2015 CONTENTS 1. CONSOLIDATED INCOME STATEMENT... 5 2. CONSOLIDATED STATEMENT OF COMPREHENSIVE INCOME... 5 3. CONSOLIDATED STATEMENT OF FINANCIAL
SMARTPHOTO GROUP 2013 HALF-YEARLY FINANCIAL REPORT. Regulated information
 SMARTPHOTO GROUP 2013 HALF-YEARLY FINANCIAL REPORT Regulated information 2013 HALF-YEARLY FINANCIAL REPORT TABLE OF CONTENTS Management responsibility statement 3 Key figures - Consolidated figures in
Financial results Full year
 Financial results 2013-2014 Full year Consolidated financial statements Consolidated income statement Revenue 247 135 262 863 Cost of sales (302 835) (278 434) Gross profit (55 700) (15 571) Sales and
LOTUS BAKERIES: ANNUAL RESULTS 2015
 LOTUS BAKERIES: ANNUAL RESULTS 2015 - Turnover growth of 18.3%, mainly due to very strong organic growth of over 13% - Recurrent operating cash flow increases very strongly by EUR 15.6 million to EUR 82.6
PRESS RELEASE 20 August 2009
 EMBARGO 20 August 2009 at 8.00. PRESS RELEASE 20 August 2009 LOSS AFTER RESTRUCTURING EUR 2.6 MILLION POSITIVE CURRENT RESULT Extraordinary and non-recurrent restructuring costs, reduced advertising revenue
Cegedim: EBITDA margin nearly stable in the first half of 2014
 Public company with share capital of 13,336,506.43 euros Trade and Commercial Register: Nanterre B 350 422 622 www.cegedim.com PRESS RELEASE Page 1 Quarterly Financial Information as of June 30, 2014 IFRS
Interim consolidated statement of financial position as of 30 September 2018 (Amounts expressed in Turkish Lira ( TL ) unless otherwise indicated.
 unless otherwise indicated.") Interim consolidated statement of financial position as of 30 September ASSETS Unaudited Audited Notes 30 September 31 December Current assets: Cash and cash equivalents 4 531.105.722 227.960.860 Financial
Interim consolidated statement of financial position as of 30 September ASSETS Unaudited Audited Notes 30 September 31 December Current assets: Cash and cash equivalents 4 531.105.722 227.960.860 Financial
ILLUSTRATION 12-1 TYPES OF INTANGIBLE ASSETS
 ILLUSTRATION 12-1 TYPES OF INTANGIBLE ASSETS INTANGIBLE ASSETS Identifiable Intangible Assets (Rights Type) Externally Acquired Internally Developed Financial Statement Treatment Unidentifiable Intangible
Constellium Reports Third Quarter 2017 Financial Results
 Constellium Reports Third Quarter Financial Results Amsterdam October 26, Constellium N.V. (NYSE and Euronext Paris: CSTM) today reported results for third quarter. Shipments of 374 thousand metric tons,
IBA Reports Half Year Results for 2018
 IBA Reports Half Year Results for 2018 Group revenue of EUR 115 million, with revenues weighted to H2 Five Proteus ONE solutions sold in the period, of which three contracts are awaiting financing and
F83. I168 other information. financial report
 Dufry Annual Report 2010 financial report F83 F83 financial report 84 CONSOLIDATED FINANCIAL STATEMENTS AS OF DECEMber 31, 2010 84 Consolidated Income Statement 85 Consolidated Statement of Comprehensive
EVS reports second quarter 2018 results
 Publication on August 30, 2018, before market opening Regulated information Press release quarterly results EVS Broadcast Equipment S.A.: Euronext Brussels (EVS.BR), Bloomberg (EVS BB), Reuters (EVSB.BR)
HUNTER DOUGLAS N.V., Piekstraat 2, 3071 EL Rotterdam, Nederland, Tel , Telefax HUNTER DOUGLAS NINE MONTHS 2013 RESULTS
 For release: November 6, 2013 08.00 hrs HUNTER DOUGLAS NINE MONTHS 2013 RESULTS Rotterdam, November 6, 2013 Hunter Douglas, the world market leader in window coverings (Luxaflex ) and a major manufacturer
EUR millions, except earnings per share expressed in. Audited EUR
 Publication on February 22, 2018, before market opening Regulated information Press release quarterly results EVS Broadcast Equipment S.A.: Euronext Brussels (EVS.BR), Bloomberg (EVS BB), Reuters (EVSB.BR)