2Q15 2Q14 % Change Million EUR HY15 HY14 % Change
|
|
|
- Robyn Bell
- 5 years ago
- Views:
Transcription


1


2


3
4 2Q15 2Q14 % Change Million EUR HY15 HY14 % Change % Revenue Group % Revenue Other segment % Revenue at comparable scope % % Rebitda Group % Rebitda Other segment % Rebitda at comparable scope % Rebit Group % - Rebit Other segment Rebit at comparable scope % Profit (+) / loss (-) for the period % Total comprehensive income for the period Cash flow from operating activities minus capital expenditure % % Net debt Notional net debt
5
6
7 102.8mEUR Industrial solutions 26.9% Agro meur 43.9% 85.0% Agro 29.3% Biovalorization 22.3% Industrial solutions 0.0% -7.3% Bio-valorization
8 AGRO Million EUR HY15 HY14 % change Revenue % REBITDA % REBITDA margin 23.5% 20.3% - REBIT % REBIT margin 20.7% 17.6% -
9 BIO-VALORIZATION Million EUR HY15 HY14 % change Revenue % REBITDA nm REBITDA margin -3.0% 2.7% - REBIT nm REBIT margin -8.7% -3.2% -
10 INDUSTRIAL SOLUTIONS Million EUR HY15 HY14 % change Revenue % REBITDA % REBITDA margin 10.0% 8.0% - REBIT % REBIT margin 4.9% 3.2% -
11 REBIT HY15 Non-recurring items EBIT Net finance costs Income Tax Expense Share of result of investments PROFIT HY15 (20.0) 6.0 (14.5) (6.7) 40.4
12 Million EUR ASSETS Total non-current assets Property, plant and equipment Goodwill Other intangible assets Investments accounted for using the equity method Other investments Deferred tax assets Trade and other receivables Derivative financial instruments Total current assets Inventories Trade and other receivables Derivative financial instruments Cash and cash equivalents Non-current assets classified as held for sale Total assets 1, ,185.4
13 Million EUR EQUITY AND LIABILITIES Total equity Equity attributable to equity holders of the company Issued capital Share premium Reserves and retained earnings Non-controlling interest Total liabilities Total non-current liabilities Loans and borrowings Employee benefits Provisions Trade and other payables Derivative financial instruments Deferred tax liabilities Total current liabilities Bank overdrafts Loans and borrowings Trade and other payables Derivative financial instruments Current tax liabilities Employee benefits Provisions Total equity and liabilities 1, ,185.4
14 Million EUR OPERATING ACTIVITIES Profit (+) / loss (-) for the period Depreciation, amortization and impairment losses on tangible assets, goodwill and other intangible assets Impairment losses on disposal groups Changes in provisions Finance costs/(income) - net Loss / (profit) on sale of non-current assets Share of result of equity accounted investees, net of income tax Income tax expense Other non-cash items Changes in inventories Changes in trade and other receivables Changes in trade and other payables Cash generated from operations Income tax (paid)/received Dividends received Dividends received from other investments Cash flow from operating activities
15 Million EUR INVESTING ACTIVITIES Acquisition of property, plant and equipment Acquisition of other intangible assets Acquisition of businesses, net of cash acquired Proceeds from the sale of property, plant and equipment Proceeds from the sale of subsidiaries, net of cash disposed of Proceeds from the sale of other investments Capital decrease from investments accounted for using the equity method Cash flow from investing activities FINANCING ACTIVITIES Capital increase from non-controlling interests Change in non-recourse factoring and securitization Proceeds from new borrowings (Reimbursement) of borrowings Cash movement resulting from settlement financial instruments Interest paid Interest received Other finance costs paid Decrease of long term receivables Cash flow from financing activities Net increase / (decrease) in cash and cash equivalents Effect of exchange rate differences Cash and cash equivalents less bank overdrafts at the beginning of the period Cash and cash equivalents less bank overdrafts at the end of the period
16
17 Tessenderlo Group is a worldwide specialty company, focused on food, agriculture, water management and on valorizing bio-residuals. The group employs about 4,800 people and is a leader in most of its markets, with a consolidated revenue of 1.4 billion EUR in Tessenderlo Chemie NV is listed on NYSE Eurolist by Euronext Brussels and is part of Next 150 and BEL Mid indices. Financial News wires: Bloomberg: TESB BB Reuters: TesBt.BR Datastream: B:Tes HY15 Results August 26, 2015
4Q15 4Q14 % Change Million EUR 12M15 12M14 % Change
 4Q15 4Q14 % Change Million EUR 12M15 12M14 % Change 374.4 319.8 17.1% Revenue Group 1,589.0 1,434.2 10.8% - -1.7 - Revenue Other segment - -34.7 374.4 318.1 17.7% Revenue at comparable scope 1,589.0 1,399.5
Tessenderlo Group 2Q16 and HY16 results
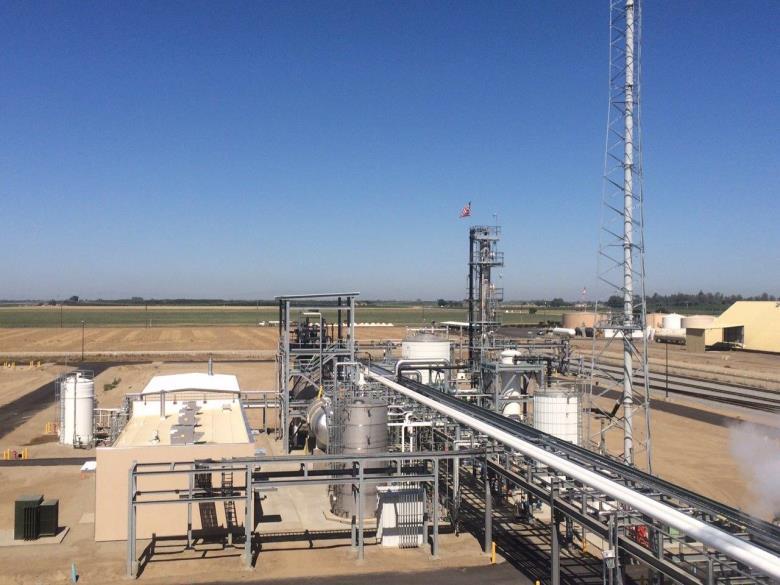
 Regulated information 1 Brussels, August 24, 2016 8:00 am CET Press release Tessenderlo Group 2Q16 and HY16 results Key Events In the first half of 2016, Tessenderlo Kerley, Inc. (TKI) announced the startup
TESSENDERLO GROUP 2Q17 AND HY17 RESULTS: STABLE HALF-YEAR REBITDA DESPITE CHALLENGING MARKET CONDITIONS
 PRESS RELEASE Regulated information 1 August 23, 2017, 8:00 am CET TESSENDERLO GROUP 2Q17 AND HY17 RESULTS: STABLE HALF-YEAR REBITDA DESPITE CHALLENGING MARKET CONDITIONS 1. KEY EVENTS Construction works
% -4.0% Revenue Group % -8.6% - Other revenue included
 PRESS RELEASE Regulated information 1 Brussels, August 22, 2018, 8:00 am CET TESSENDERLO GROUP 2Q18 AND HY18 RESULTS: STRONG SECOND QUARTER RESULTS, ALTHOUGH 2018 HALF YEAR RESULTS BELOW THOSE OF PREVIOUS
% REBITDA
 PRESS RELEASE Regulated information 1 March 14, 2018, 8:00 am CET TESSENDERLO GROUP 4Q17 AND 2017 RESULTS: REBITDA SLIGHTLY LOWER THAN EXPECTED, BUT STRONG CASH GENERATION AND SIGNIFICANT NET FINANCIAL
Tessenderlo Group reports solid operational performance and completes divestment of PVC/Chlor-Alkali businesses
 Regulated information* Brussels, August 25 th, 2011 Press release All comments included in this document, unless otherwise indicated, are based on the group s continuing operations QUARTERLY REPORT 30
Tessenderlo Group 3Q10 results: further improvements in operational performance and financial position
 Brussels, November 5 th, 2010 Regulated information* Press release QUARTERLY REPORT 30 SEPTEMBER 2010 Tessenderlo Group 3Q10 results: further improvements in operational performance and financial position
TESSENDERLO GROUP: SOLID 2018 RESULTS
 TESSENDERLO GROUP: SOLID 2018 RESULTS PRESS RELEASE Regulated information 1 March 14, 2019, 8:00 am CET 1. KEY EVENTS In January 2019, Performance Chemicals lifted the force majeure on the sodium hydroxide
Conference call 2Q17 and HY17 results
 Conference call 2Q17 and HY17 results Brussels, August 23, 2017 A replay of the webcast will be available on our website www.tessenderlo.com 2 BUSINESS HIGHLIGHTS Tessenderlo Kerley, Inc. East Dubuque
Tessenderlo Group 2009 results: significant net loss confirmed but solid cash flow from operations despite very challenging economic environment
 Brussels, 12 February 2010 Regulated information* Press release QUARTERLY REPORT DECEMBER 2009 Tessenderlo Group 2009 results: significant net loss confirmed but solid cash flow from operations despite
Conference call 2Q18 and HY18 results
 Conference call 2Q18 and HY18 results Brussels, August 22, 2018 A replay of the webcast will be available on our website www.tessenderlo.com Business highlights Acquisition of T-Power nv, a 425 MW combined-cycle
TESSENDERLO GROUP AND PICANOL GROUP ANNOUNCE PLAN TO MERGE ACTIVITIES INTO ONE BELGIAN INDUSTRIAL GROUP
 PRESS RELEASE Regulated information Embargo until 16 December 2015, 9:30 am CET TESSENDERLO GROUP AND PICANOL GROUP ANNOUNCE PLAN TO MERGE ACTIVITIES INTO ONE BELGIAN INDUSTRIAL GROUP BOTH COMPANIES TO
Tessenderlo Group. Interim report for the 6 month period ended 30 June
 Brussels, August 29, 2013 Regulated information Tessenderlo Group Interim report for the 6 month period ended 30 June 2013 1 1 Note that Tessenderlo Group publishes, in addition to this interim report,
Tessenderlo Group. Interim report for the 6 month period ended 30 June
 Brussels, August 29, 2012 Regulated information Tessenderlo Group Interim report for the 6 month period ended 30 June 2012 1 1 Please note that Tessenderlo Group publishes, in addition to this interim
PICANOL GROUP REALIZES THE STRONGEST HALF YEAR IN ITS HISTORY INCREASED TURNOVER FORECAST FOR 2016 BASED ON A WELL-FILLED ORDER BOOK
 PRESS RELEASE Regulated information Half-yearly information figures H1 2016 24 August 2016 8u00 CET - Consolidated results H1 2016 - PICANOL GROUP REALIZES THE STRONGEST HALF YEAR IN ITS HISTORY INCREASED
Consolidated Statement of Profit or Loss (in million Euro)
") Consolidated Statement of Profit or Loss (in million Euro) Q1 2016 Q1 2017 % change Revenue 603 588-2.5% Cost of sales (408) (396) -2.9% Gross profit 195 192-1.5% Selling expenses (84) (86) 2.4% Research
Consolidated Statement of Profit or Loss (in million Euro) Q1 2016 Q1 2017 % change Revenue 603 588-2.5% Cost of sales (408) (396) -2.9% Gross profit 195 192-1.5% Selling expenses (84) (86) 2.4% Research
Consolidated Statement of Profit or Loss (in million Euro)
") Consolidated Statement of Profit or Loss (in million Euro) Q3 2015 Q3 2016 % change 9m 2015 9m 2016 % change Revenue 661 625-5.4% 1,974 1,873-5.1% Cost of sales (453) (415) -8.4% (1,340) (1,239) -7.5%
Consolidated Statement of Profit or Loss (in million Euro) Q3 2015 Q3 2016 % change 9m 2015 9m 2016 % change Revenue 661 625-5.4% 1,974 1,873-5.1% Cost of sales (453) (415) -8.4% (1,340) (1,239) -7.5%
Tessenderlo Group exits commodities and transforms into a global specialty group. Conference call for investors and analysts June 14 th, 2011
 Tessenderlo Group exits commodities and transforms into a global specialty group Conference call for investors and analysts June 14 th, 2011 This document may contain forward-looking statements and information.
 5 1. CONSOLIDATED INCOME STATEMENTS (in millions of euros) 2018 2017* REVENUE 2,643 2,505 Cost of sales (1,649) (1,471) GROSS PROFIT 995 1,034 Distribution and marketing costs (250) (224) Research
Consolidated Statement of Profit or Loss (in million Euro)
") Consolidated Statement of Profit or Loss (in million Euro) Unaudited, consolidated figures following IFRS accounting policies. Q2 2017 Q2 2018 H1 2017 H1 2018 Revenue 622 559 1,210 1,108 Cost of sales
Consolidated Statement of Profit or Loss (in million Euro) Unaudited, consolidated figures following IFRS accounting policies. Q2 2017 Q2 2018 H1 2017 H1 2018 Revenue 622 559 1,210 1,108 Cost of sales
Tessenderlo Group. Interim report for the 6 month period ended 30 June
 Brussels, 25 August 2011 Regulated information Tessenderlo Group Interim report for the 6 month period ended 30 June 2011 1 1 Please note that Tessenderlo Group publishes, in addition to this interim report,
 o o o o - - - - - 1. INTERIM CONSOLIDATED INCOME STATEMENTS (in millions of euros) 2017 2016 REVENUE 2,510 2,312 Cost of sales (1,475) (1,337) GROSS PROFIT 1,035 975 Distribution and marketing
CONSOLIDATED FINANCIAL STATEMENT YEAR ENDED DECEMBER
 CONSOLIDATED FINANCIAL STATEMENT YEAR ENDED DECEMBER 31 2016 BOURBONOFFSHORE.COM SUMMARY 1. Financial position statement...3 2. Statement of comprehensive income... 4 3. Statement of consolidated cash-flows...
SHAREHOLDERS GUIDE. Publication date 1 March 2017
 SHAREHOLDERS GUIDE Publication date 1 March 217 2 Bekaert Shareholders Guide Definitions Added value Operating result (EBIT) + remuneration, social security and pension charges + depreciation, amortization,
Reviewed Reviewed Not Reviewed Not Reviewed. Notes 2018
 As of September 30, Statement of Financial Position (Balance Sheet) Reviewed Audited Notes September 30, December 31, ASSETS Current assets 968.088.116 967.988.419 Cash and cash equivalents 5 37.103.817
Opening New Frontiers
 Opening New Frontiers 2 nd QUARTER 2011 RESULTS REGULATED INFORMATION SOLVAY GROUP 2 nd QUARTER BUSINESS REVIEW Excellent operating result in the 2 nd quarter of 2011: REBITDA (EUR 304 million) up by 12%
APPENDICE 1 - Consolidated income statement
 APPENDICE 1 - Consolidated income statement (in millions of euros) 2008 Net sales 2 514 3 554 Metal price effect* (430) (1 135) Sales at constant metal prices* 2 085 2 419 Cost of sales (2 134) (3 065)
CONSOLIDATED FINANCIAL STATEMENT YEAR ENDED DECEMBER
 CONSOLIDATED FINANCIAL STATEMENT YEAR ENDED DECEMBER 31 2017 BOURBONOFFSHORE.COM SUMMARY 1. Financial position statement...3 2. Statement of comprehensive income... 4 3. Statement of consolidated cash-flows...
2013 CONSOLIDATED ACCOUNTS
 havas.com 1 Consolidated balance sheet ASSETS (in euro million) 12.31.13 Net 12.31.12 12.31.11 Non-current assets Goodwill 1 593 1 603 1 559 Other intangible assets 36 37 41 Property and equipment 255
FAIVELEY TRANSPORT: 25% INCREASE IN NET PROFIT 9.7% SALES GROWTH DURING THE FINANCIAL YEAR ORDER BOOK OF 1,616 MILLION. Press Release 5 June 2013
 Press Release 5 June 2013 FAIVELEY TRANSPORT: 25% INCREASE IN NET PROFIT IN THE 2012/2013 FINANCIAL YEAR Gennevilliers, 5 June 2013 IFRS ( millions) 2011/12 2012/13 % change Sales 900.5 987.7 +9.7% Operating
DIVIDEND WITH STOCK OPTION
 Regulated information* Brussels, 8 June 2010 Information document DIVIDEND WITH STOCK OPTION I. Short summary of the main features of the dividend with stock option Three possible choices Coupon number
TESSENDERLO GROUP Because every molecule counts. CEO Frank Coenen Tessenderlo Group
 TESSENDERLO GROUP Because every molecule counts CEO Frank Coenen Tessenderlo Group Our dream We want to ensure that life on our planet can thrive by creating a world that makes the most of its resources.
FINANCIAL ANALYSTS MEETING
 RECTICEL - FY2011 Results FINANCIAL ANALYSTS MEETING Speakers: Olivier Chapelle, CEO Jean-Pierre Mellen, CFO Brussels, 02 March 2012-1 - Agenda 1. Highlights 2. FY2011 consolidated results 3. FY2011 comments
Note of Transition to IFRS
 - 11 - Note of Transition to Upon to, the Company s opening consolidated statement of financial position was prepared by 1 as of April 1, 2013, its date to, with required adjustments made to the consolidated
Solvay Group IFRS pro forma financial statements (insert to annual report 2002)
") Solvay Group 2002 IFRS pro forma financial statements (insert to annual report 2002) 2 Solvay Group/2002 IFRS pro forma financial statements Content 2002 IFRS PRO FORMA FINANCIAL STATEMENTS page 3 NOTES
Solvay Group 2002 IFRS pro forma financial statements (insert to annual report 2002) 2 Solvay Group/2002 IFRS pro forma financial statements Content 2002 IFRS PRO FORMA FINANCIAL STATEMENTS page 3 NOTES
Interim results for the six months ended 30 September 2011
 Press Release November 25, 2011 7:30 AM Huizingen, Belgium REGULATED INFORMATION Interim results for the six months ended 30 September 2011 14% year-over-year growth in total turnover in the first half
HALF YEARLY FINANCIAL REPORT FIRST SEMESTER Ter Beke Half Year Financial Report 2009 Regulated Information 28 August :45 p.m.
 HALF YEARLY FINANCIAL REPORT FIRST SEMESTER 2009 28 August 2009 5:45 p.m. 1/16 INTERIM ANNUAL REPORT MAIN ITEMS AND IMPORTANT EVENTS Ter Beke group: o Total turnover of EUR 191.4 million versus EUR 192.1
Non-GAAP Information 5/3/2018
 5/3/2018 Use of Non-GAAP Financial Information: The Company believes that non-gaap performance measures, which management uses in evaluating the Company's business, may provide users of the Company's financial
Half year financial report. January June 2017
 Half year financial report January June 2017 Key figures 4-6/2017 4-6/2016 Change% 1-6/2017 1-6/2016 Change% 1-12/2016 Revenue, MEUR 196.0 192.4 1.9% 352.6 350.6 0.6% 775.8 Like-for-like revenue development,
Regulated information
 Regulated information JENSEN-GROUP Half-Year Results 2015 1 Consolidated, non-audited key figures Income Statement 30/06/2015-30/06/2014 Non-audited, consolidated key figures June 30, 2015 June 30, 2014
Full Year Results 2015: Bekaert on track
 Press release Regulated information 26 February 2016 Press - Investors Katelijn Bohez T +32 56 23 05 71 www.bekaert.com Full Year Results 2015: Bekaert on track Strong margin growth, robust cash generation
Picanol Group + Tessenderlo Group
 Picanol Group + Tessenderlo Group In 2013 Picanol Group acquired a 27.52% controlling interest in TessenderloGroup from the French company SNPE SA. Picanol Group's investment in TessenderloGroup aimed
Press release - Regulated information Announcement annual results 2013 Sioen Industries
 - Regulated information Announcement annual results 2013 Sioen Industries Press release Sioen Industries - 28/02/2014 before Stock Market opening 3 Net sales: EUR 323.0 million EBT: EUR 19.9 million (+
PRESS RELEASE - March 2008 FULL YEAR RESULTS (shortened accounting year; January 1 March 31, 2008)
") PRESS RELEASE - March 2008 FULL YEAR RESULTS (shortened accounting year; January 1 March 31, 2008) Highlights Real closes the shortened accounting year, 1 January to 31 March, 2008 with an increase in
PRESS RELEASE - March 2008 FULL YEAR RESULTS (shortened accounting year; January 1 March 31, 2008) Highlights Real closes the shortened accounting year, 1 January to 31 March, 2008 with an increase in
PRESS RELEASE For publication: March 14, hrs
 Piekstraat 2 3071 EL Rotterdam PRESS RELEASE For publication: March 14, 2019 08.00 hrs HUNTER DOUGLAS RESULTS 2018 Rotterdam, March 14, 2019 Hunter Douglas, the world market leader in window coverings
BE SEMICONDUCTOR INDUSTRIES N.V. DUIVEN, THE NETHERLANDS UNAUDITED CONDENSED INTERIM CONSOLIDATED FINANCIAL STATEMENTS JUNE 30, 2011
 BE SEMICONDUCTOR INDUSTRIES N.V. DUIVEN, THE NETHERLANDS UNAUDITED CONDENSED INTERIM CONSOLIDATED FINANCIAL STATEMENTS JUNE 30, 2011 Contents unaudited condensed interim consolidated financial statements
Interim results for the six months ended 30 September 2008
 Press Release November 27, 2008-8:00 Huizingen, Belgium REGULATED INFORMATION Interim results for the six months ended 30 September 2008 RealDolmen, the independent single source ICT solutions provider
ITURAN LOCATION AND CONTROL LTD. Consolidated Interim Financial Statements as of March 31, 2014
 Consolidated Interim Financial Statements as of March 31, 2014 Consolidated Financial Statements as of March 31, 2014 Table of Contents Page Consolidated Financial Statements: Balance Sheets 2-3 Statements
ITURAN LOCATION AND CONTROL LTD. Consolidated Interim Financial Statements as of March 31, 2013
 Consolidated Interim Financial Statements as of March 31, 2013 Consolidated Financial Statements as of March 31, 2013 Table of Contents Page Consolidated Financial Statements: Balance Sheets 2-3 Statements
Statement of Earnings
 audited financial statements Statement of Earnings General Electric Company and consolidated affiliates For the years ended December 31 (In millions; per-share amounts in dollars) 2012 2011 2010 REVENUES
PRESS RELEASE 20 August 2009
 EMBARGO 20 August 2009 at 8.00. PRESS RELEASE 20 August 2009 LOSS AFTER RESTRUCTURING EUR 2.6 MILLION POSITIVE CURRENT RESULT Extraordinary and non-recurrent restructuring costs, reduced advertising revenue
PRESS RELEASE EVS REPORTS FIRST QUARTER 2018 RESULTS
 Publication on May 17, 2018, before market opening Regulated information Press release quarterly results EVS Broadcast Equipment S.A.: Euronext Brussels (EVS.BR), Bloomberg (EVS BB), Reuters (EVSB.BR)
Financial Results For the Fiscal Year 2016 ending January 31, 2016
 Financial Results For the Fiscal Year 2016 ending January 31, 2016 March 16, 2016 Balance Sheets (Consolidated) Thousands of Yen 31 Jan., 2016 Assets Current assets: Cash & Cash equivalents 1,984,469 Accounts
HUNTER DOUGLAS N.V., Piekstraat 2, 3071 EL Rotterdam, Nederland, Tel , Telefax HUNTER DOUGLAS NINE MONTHS 2013 RESULTS
 For release: November 6, 2013 08.00 hrs HUNTER DOUGLAS NINE MONTHS 2013 RESULTS Rotterdam, November 6, 2013 Hunter Douglas, the world market leader in window coverings (Luxaflex ) and a major manufacturer
Despite strong headwind from raw material prices, inflation and currencies, REBITDA remains steady
 Press Release Regulated Information FY 2017 results Under embargo until Thursday 22 February 2018 at 7:00 a.m. CET Despite strong headwind from raw material prices, inflation and currencies, REBITDA remains
BE VANDEMOORTELE NV 3 KEY FINANCIAL FIGURES
 BE 0429 977 343 VANDEMOORTELE NV 3 KEY FINANCIAL FIGURES BE 0429 977 343 VANDEMOORTELE NV 4 BE 0429 977 343 VANDEMOORTELE NV 5 CONSOLIDATED INCOME STATEMENT As the shares are not traded in a public market,
Updated reporting Philips Group
 Updated reporting Philips Group all amounts in millions of euros unless otherwise stated all the data included in this report are unaudited financial reporting according to IFRS unless otherwise stated
HUNTER DOUGLAS RESULTS 2014
 PRESS INFORMATION For release: March 11, 2015 08.00 hrs HUNTER DOUGLAS RESULTS 2014 Rotterdam, March 11, 2015 Hunter Douglas, the world market leader in window coverings (Luxaflex ) and a major manufacturer
Updated reporting Philips Group
 Updated reporting Philips Group all amounts in millions of euros unless otherwise stated all the data included in this report are unaudited financial reporting according to IFRS unless otherwise stated
Selling, general and administrative expenses 35,645 33,787. Net other operating income (292) (270) Operating profit 44,202 17,756
 (270) Operating profit 44,202 17,756") Condensed Interim Consolidated Income Statement For the quarter ended September 30 Continuing operations Revenue 328,071 258,941 Cost of sales 248,516 207,668 Gross profit 79,555 51,273 Selling, general
Condensed Interim Consolidated Income Statement For the quarter ended September 30 Continuing operations Revenue 328,071 258,941 Cost of sales 248,516 207,668 Gross profit 79,555 51,273 Selling, general
Bekaert delivers vigorous growth, record results and continuing strong dividend
 Press release regulated information 13 March, 2009 Press Katelijn Bohez T +32 56 23 05 71 Investor Relations Jacques Anckaert T +32 56 23 05 72 Annual results 2008 Bekaert delivers Highlights 1 Bekaert
STRONG FIRST HALF RESULTS
 STRONG FIRST HALF RESULTS Kortrijk, Belgium, 22 July 2015 Today Barco (Nyse/Euronext: BAR; Reuters: BARBt.BR; Bloomberg: BAR BB) announced results for the six month period ended 30 June 2015. First half
HY press release
 Press Release 25 November 2016, Huizingen, Belgium REGULATED INFORMATION HY 2016-2017 press release (Results for the half year ended 30 September 2016) Growth in both segments leads to half year turnover
Bekaert. November 2014
 Bekaert Content Bekaert in essence Strategy review Annex: 3 rd quarter trading update 2014 1 st half year results 2014 1 Company profile Industrial company with unique geographic, product and sector exposure
SEPARATE INCOME STATEMENT
 ATTACHMENTS TO THE PRESS RELEASE The Separate Income Statements, Statements of Financial Position and the Statements of Cash Flows as well as the Net Financial Debt of INWIT, herewith presented, are the
ITURAN LOCATION AND CONTROL LTD. AND ITS SUBSIDIARIES. Consolidated Financial Statements as of December 31, 2015
 ITURAN LOCATION AND CONTROL LTD. AND ITS SUBSIDIARIES Consolidated Financial Statements as of 2015 ITURAN LOCATION AND CONTROL LTD. AND ITS SUBSIDIARIES Consolidated Financial Statements As of 2015 Table
EVS reports third quarter 2018 results
 Publication on November 15, 2018, before market opening Regulated information Press release quarterly results EVS Broadcast Equipment S.A.: Euronext Brussels (EVS.BR), Bloomberg (EVS BB), Reuters (EVSB.BR)
Group statement of comprehensive income (IFRS) Restated
 Restated") Group income statement (IFRS) EUR million Q1-Q4 Q1-Q3 Q1-Q2 Q1 Net sales 2,321.2 1,745.6 1,161.3 546.8 Cost of goods sold -1,949.2-1,462.6-972.9-462.8 Gross profit 372.0 283.0 188.4 84.0 Other operating
Group income statement (IFRS) EUR million Q1-Q4 Q1-Q3 Q1-Q2 Q1 Net sales 2,321.2 1,745.6 1,161.3 546.8 Cost of goods sold -1,949.2-1,462.6-972.9-462.8 Gross profit 372.0 283.0 188.4 84.0 Other operating
PRESS RELEASE For publication: November 2, hrs
 Piekstraat 2 3071 EL Rotterdam PRESS RELEASE For publication: November 2, 2017 08.00 hrs HUNTER DOUGLAS NINE MONTHS 2017 RESULTS Rotterdam, November 2, 2017 Hunter Douglas, the world market leader in window
Cegedim: EBITDA margin nearly stable in the first half of 2014
 Public company with share capital of 13,336,506.43 euros Trade and Commercial Register: Nanterre B 350 422 622 www.cegedim.com PRESS RELEASE Page 1 Quarterly Financial Information as of June 30, 2014 IFRS
Press Release. Outlook
 Press Release October 26, 2018 Signify reports third quarter sales of EUR 1.6 billion, improvement in operational profitability by 150 bps to 12.0% and free cash flow to EUR 64 million 2018 1 Sales of
Consolidated statement of total comprehensive income
 Consolidated statement of total comprehensive income (x 1,000) 2016 2015 Continuing operations Net revenue 89,729 71,787 Cost of Materials and subcontractors 10,354 6,240 Employee benefit expenses 52,014
SMARTPHOTO GROUP 2013 HALF-YEARLY FINANCIAL REPORT. Regulated information
 SMARTPHOTO GROUP 2013 HALF-YEARLY FINANCIAL REPORT Regulated information 2013 HALF-YEARLY FINANCIAL REPORT TABLE OF CONTENTS Management responsibility statement 3 Key figures - Consolidated figures in
LOTUS BAKERIES: ANNUAL RESULTS 2015
 LOTUS BAKERIES: ANNUAL RESULTS 2015 - Turnover growth of 18.3%, mainly due to very strong organic growth of over 13% - Recurrent operating cash flow increases very strongly by EUR 15.6 million to EUR 82.6
SEMESTRIAL FINANCIAL REPORT
 SEMESTRIAL FINANCIAL REPORT 30 JUNE 2012 Kinepolis Group Half-year financial report 30 June 2012 Press release Regulatory information 23 August 2012 Kinepolis generates 117.3 million revenue and 14.9 million
JABIL CIRCUIT, INC. AND SUBSIDIARIES CONDENSED CONSOLIDATED BALANCE SHEETS
 CONDENSED CONSOLIDATED BALANCE SHEETS (In thousands) 2011 2010 ASSETS Current assets: Cash and cash equivalents $ 888,611 $ 744,329 Trade accounts receivable, net 1,100,926 1,408,319 Inventories 2,227,339
ITURAN LOCATION AND CONTROL LTD. AND ITS SUBSIDIARIES. Consolidated Financial Statements as of December 31, 2016
 ITURAN LOCATION AND CONTROL LTD. AND ITS SUBSIDIARIES Consolidated Financial Statements as of 2016 ITURAN LOCATION AND CONTROL LTD. AND ITS SUBSIDIARIES Consolidated Financial Statements As of 2016 Table
SPIE Group Consolidated financial statements as at December 31, 2015
 SPIE Group Consolidated financial statements as at December 31, 2015 CONTENTS 1. CONSOLIDATED INCOME STATEMENT... 5 2. CONSOLIDATED STATEMENT OF COMPREHENSIVE INCOME... 5 3. CONSOLIDATED STATEMENT OF FINANCIAL
IBA Reports Half Year Results for 2018
 IBA Reports Half Year Results for 2018 Group revenue of EUR 115 million, with revenues weighted to H2 Five Proteus ONE solutions sold in the period, of which three contracts are awaiting financing and
ENCOURAGING FIRST HALF RESULTS
 ENCOURAGING FIRST HALF RESULTS Kortrijk, Belgium, 20 July 2016 Today Barco (Euronext: BAR; Reuters: BARBt.BR; Bloomberg: BAR BB) announced results for the six month period ended 30 June 2016. First half
Coherent, Inc. Consolidated Statement of Operations - GAAP
 Consolidated Statement of Operations - GAAP (In thousands except percentages and per share data, unaudited) March 31, December 30, September 30, July 1, April 1, December 31, October 1, July 2, April 2,
ITURAN LOCATION AND CONTROL LTD. AND ITS SUBSIDIARIES. Consolidated Financial Statements as of December 31, 2014
 ITURAN LOCATION AND CONTROL LTD. AND ITS SUBSIDIARIES Consolidated Financial Statements as of 2014 ITURAN LOCATION AND CONTROL LTD. AND ITS SUBSIDIARIES Consolidated Financial Statements as of 2014 Table
EUR millions, except earnings per share expressed in EUR
 Publication on November 16, 2017, before market opening Regulated information Press release quarterly results EVS Broadcast Equipment S.A.: Euronext Brussels (EVS.BR), Bloomberg (EVS BB), Reuters (EVSB.BR)
INFORMATION DOCUMENT WITH RESPECT TO THE OPTIONAL DIVIDEND OPTION PERIOD FROM 12 JUNE UP TO AND INCLUDING 6 JULY :00 PM (CET)
") Regulated information* (12 June 2012) Brussels,12 June 2012 Information Document *The enclosed information constitutes regulated information as defined in the Royal Decree of 14 November 2007 regarding
Regulated information* (12 June 2012) Brussels,12 June 2012 Information Document *The enclosed information constitutes regulated information as defined in the Royal Decree of 14 November 2007 regarding
Financial Results of the Principal Subsidiaries
 Financial Results of the Principal Subsidiaries Fiscal Year Ended March 31, 2018 May 15, 2018 Copyright 2018 JAPAN POST GROUP. All Rights Reserved. Table of Contents I Japan Post Holdings... 1 Year-on-Year
Bekaert delivers 10% sales growth and 301 million underlying EBIT
 Press release Regulated information 28 February 2018 07:00 a.m. CET Press - Investors Katelijn Bohez T +32 56 76 66 10 www.bekaert.com Full Year Results 2017 Bekaert delivers 10% sales growth and 301 million
FINANCIAL RESULTS. Consolidated Financial Statements - Fiscal Year Ended March 31, Consolidated Balance Sheets
 FINANCIAL RESULTS Consolidated Financial Statements - Fiscal Year Ended March 31, 2007-1. Consolidated Balance Sheets (ASSETS) Prior Year End Current Year End (As of March 31, 2006) (As of March 31, 2007)
Martela Oyj Interim Report
 Martela Oyj Interim Report 1.1 3.6 27 Turnover MEUR 42, 36, 3, 24, 18, 12, 6,, 3Q 25 4Q 25 1Q 2Q 3Q 4Q 1Q 27 2Q 27 Turnover 25, 29,3 26,9 27,2 28,8 36,8 29,9 3,4 Invoicing by market area MEUR 3 25 2 15
Constellium Reports Third Quarter 2017 Financial Results
 Constellium Reports Third Quarter Financial Results Amsterdam October 26, Constellium N.V. (NYSE and Euronext Paris: CSTM) today reported results for third quarter. Shipments of 374 thousand metric tons,
Consolidated income statement
 Consolidated income statement NET SALES 6,403 6,711 Metal price effect 1 (1,816) (2,022) SALES AT CONSTANT METAL PRICES 1 4,587 4,689 Cost of sales (5,658) (5,950) Cost of sales at constant metal prices
Zone de texte Condensed consolidated interim financial statements as of March 31, 2018
 Zone de texte Condensed consolidated interim financial statements as of March 31, 2018 Société anonyme with share capital of 1,516,715,885 Registered office: 13, boulevard du Fort de Vaux CS 60002 75017
Updated to reflect new accounting policy changes and quarterly presentation on Television business reported as discontinued operations.
 Updated reporting Philips Group Updated to reflect new accounting policy changes and quarterly presentation on Television business reported as discontinued operations. all the data included in this report
Constellium Reports Fourth Quarter and Full Year 2018 Results
 Constellium Reports Fourth Quarter and Full Year Results Amsterdam February 21, 2019 Constellium N.V. (NYSE: CSTM) today reported results for the fourth quarter and full year. Fourth quarter highlights:
CONVENIENCE TRANSLATION INTO ENGLISH OF CONDENSED INTERIM CONSOLIDATED FINANCIAL STATEMENTS ORIGINALLY ISSUED IN TURKISH
 CONVENIENCE TRANSLATION INTO ENGLISH OF CONDENSED INTERIM CONSOLIDATED FINANCIAL STATEMENTS ORIGINALLY ISSUED IN TURKISH CONDENSED CONSOLIDATED BALANCE SHEETS AT 30 SEPTEMBER 2017 AND 31 DECEMBER 2016
Appendix 1: Results by business sector and geographic area - Full Year
 Appendix 1: Results by business sector and geographic area - Full Year I. SALES Innovative Materials 1 9,703 9,857 +1.6% +1.4% +4.5% Flat Glass 5,217 5,364 +2.8% +2.7% +6.5% High-Performance Materials
ITURAN LOCATION AND CONTROL LTD. AND ITS SUBSIDIARIES. Consolidated Financial Statements as of December 31, 2013
 ITURAN LOCATION AND CONTROL LTD. AND ITS SUBSIDIARIES Consolidated Financial Statements as of 2013 ITURAN LOCATION AND CONTROL LTD. AND ITS SUBSIDIARIES Consolidated Financial Statements as of 2013 Table
NEMETSCHEK GROUP Financial Results Q2 / H1 2017
 Barco One Campus, Kortrijk, Belgium Architects: Jaspers-Eyers Architects Engineering Office: Establis Image: Marc Detiffe Realized with GRAPHISOFT and SCIA NEMETSCHEK GROUP Financial Results Q2 / H1 2017
Cegedim: Significant improvement in profitability in Q1 2015
 SA au capital de 13 336 506,43 euros R. C. S. Nanterre B 350 422 622 www.cegedim.com Page 1 Quarterly Financial Information as of March 31, 2015 IFRS - Regulated Information - Not Audited Cegedim: Significant
Statement of Earnings
 audited financial statements Statement of Earnings General Electric Company and consolidated affiliates For the years ended December 31 (In millions; per-share amounts in dollars) 2009 2008 2007 Revenues
interim report 2/2013 Consolidated Financial Statements Consolidated Income Statement 4 Consolidated Balance Sheet 5
 interim report 2/2013 Consolidated Financial Statements Consolidated Income Statement 4 Consolidated Balance Sheet 5 Consolidated Cash Flow Statement 6 Consolidated Statement of Changes in Shareholders