Genesee & Wyoming. Jack Hellmann, President & CEO. February Genesee & Wyoming Inc.
|
|
|
- Rodney Hardy
- 5 years ago
- Views:
Transcription

1 Genesee & Wyoming Jack Hellmann, President & CEO February
2 Forward-Looking Statements This presentation contains forward-looking statements regarding future events and the future performance of that involve risks and uncertainties that could cause actual results to differ materially from those expressed or forecasted, including, but not limited to, risks related to the operation of our railroads, severe weather conditions and other natural occurrences, economic and market conditions (including employee strikes or work stoppages), the credit risk of customers and counterparties, customer demand, railroad network congestion, derailments, currency fluctuations, changes in commodity prices, increased competition in the relevant market, and others, many of which are beyond our control. The Company refers you to the documents that it files from time to time with the Securities and Exchange Commission, such as the Company s Forms 10-Q and 10-K, which contain additional important factors that could cause its actual results to differ from its current expectations and from the forward-looking statements discussed during this presentation. Forward-looking statements speak only as of the date of this presentation or the date they were made. does not undertake, and expressly disclaims, any duty to update any forward-looking statement contained in this presentation whether as a result of new information, future events or otherwise, except as required by law. 2

3 Agenda G&W Overview Fourth Quarter 2015 Results 2016 Outlook 3


4 Overview NYSE: Listed as GWR with ~$3 billion market capitalization Railroads: 120 worldwide with ~16,000 track miles People: ~7,000 worldwide Equipment: >1,300 locomotives Annual Carloads: ~3 million Track Record of Acquisitions: Added >100 railroads since

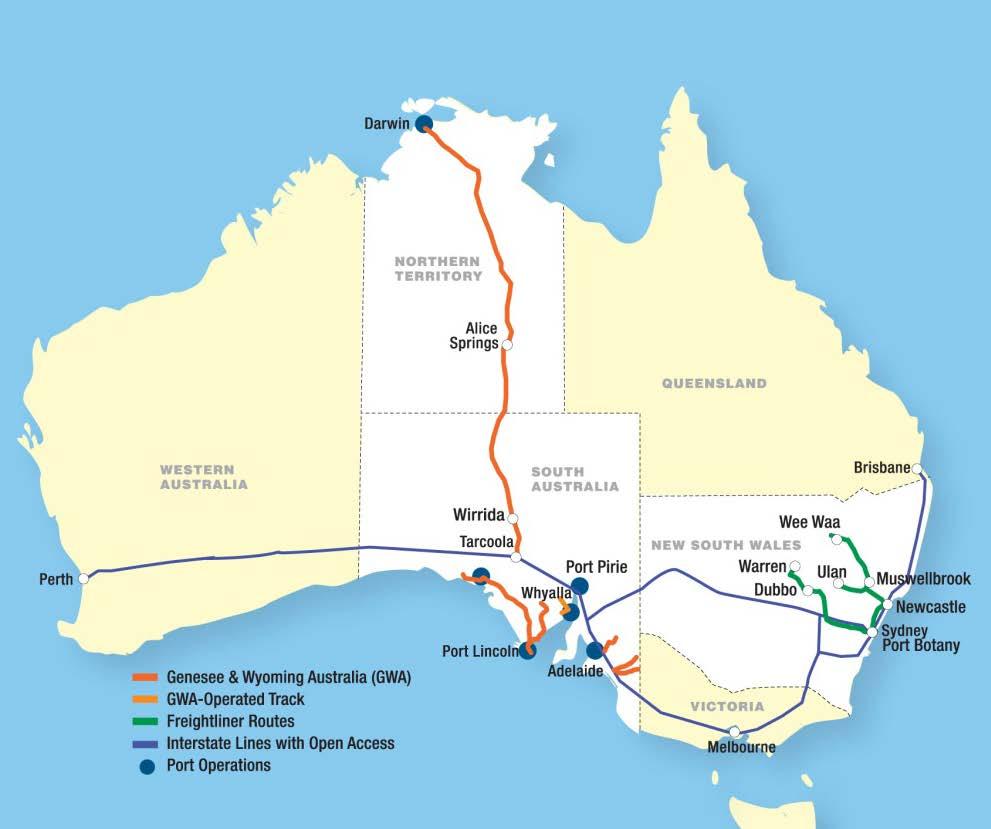

5 North America Australia U.K./Europe

6 Consistent Long-Term Revenue Growth ($ millions) 2,000 $2,000 1,500 1, Initial Public Offering 0 $3 6
7 G&W Operating Income by Segment (2016 Outlook) U.K./ Europe 9% Australia 11% North America 80% 7

8 G&W Safety Performance 2015 Injury Frequency Rate per 200,000 man-hours G&W and Freightliner through December; others through November FRA Group 2 FRA Group 3 Freightliner KCS Class I Avg NS BNSF UP CSX G&W * * Excludes Freightliner 8


9 Regional Operating Structure: Designed to be Close to Customers Ohio Valley Region Safety Finance HR IT Marketing /Sales Transportation Mechanical Engineering Customers 9


10 Industry-Leading Customer Satisfaction 8.0 = Loyal Customer Trucking Railroads 10


11 Extension of Class I Rail System: 2015: 1.7MM G&W Carloads Interchanged 170,000 90, , ,000 48, , ,000 11

12 Fourth Quarter 2015 Results and 2016 Outlook
13 Q Results Versus Q Adjusted Diluted EPS in-line with revised Q guidance of $ $.85 (1) Adjusted Diluted EPS of $0.85 decreased 24% (or 21%, excluding FX) (1) Three trends driving rail shipment weakness: i. Collapse in global commodity prices (e.g., iron ore, copper, manganese, crude oil) ii. Shift of U.S. and U.K. power generation away from coal to cheaper natural gas iii. Strong U.S. dollar impacting industrial customers (e.g., steel) as well as agricultural products ($ per share) Q Q Variance % Ex-FX Diluted EPS $ 1.47 $ 1.53 $ (0.06) Adjustments: Out of Period Benefit of Final Allocation of Fair Values to Freightliner's Assets & Liabilities $ (0.03) $ - $ (0.03) Business Development and Related Costs Net Gain on Sale of Assets - (0.02) 0.02 Application of Full Year Effective Tax Rate (0.04) Impact of Reduction in U.K. Effective Tax Rate (0.17) - (0.17) Short Line Tax Credit (0.47) (0.47) - Total Adjustments $ (0.62) $ (0.41) $ (0.21) Adjuted Diluted EPS (1) $ 0.85 $ 1.12 $ (0.27) (24%) (21%) (1) Adjusted Diluted Earnings Per Common Share (EPS) is a non-gaap financial measure. Reconciliations of non- GAAP financial measures accompany this presentation. 13
14 Q Results Versus Original Guidance ($ in millions, except per share amounts) Q Actual Original Q Guidance (October 2015) Variance to Mid-Point Operating Revenues $ $515 - $530 $ (7.6) Income from Operations $ 94.6 Out of Period Benefit of Final Allocation of Fair Values to Freightliner's Assets & Liabilities $ (2.6) Business Development and Related Costs 2.5 Net Gain on Sale of Assets (0.3) Adjusted Income from Operations* $ 94.2 $100 - $106 $ (8.8) Adjusted Operating Ratio* 81.7% ~80% (170 bps) Adjusted Diluted EPS* $ 0.85 $ $0.95 $ (0.08) Variance to Mid-Point ($ in millions, except per share amounts) Operating Revenues Adjusted Income from Operations* Adjusted EPS* Notes North America $ (3.8) $ (5.9) $ (0.06) Coal, Steel and Grain Australia (2.3) (3.0) (0.02) Mine closure U.K./Europe (1.5) Variance to Original Guidance $ (7.6) $ (8.8) $ (0.08) * Adjusted Income from Operations, Adjusted Operating Ratio and Adjusted Diluted EPS are non-gaap financial measures. Reconciliations of non-gaap financial measures accompany this presentation. 14
15 Q1 G&W North American Monthly Carloads North America down 17% in January (1/2 Coal, 1/3 Strong Dollar) Expect down ~11% in Q1 (000 s) Outlook January February March 15
16 2008 Guidance 2016 Outlook Revenues: ~$2 billion Operating Ratio (a) : ~81% Tax Rate: ~29% Net Interest Expense: ~$75 million Depreciation and Amortization: ~$220 million (incl. Equity Comp. Amortization) Diluted EPS (a) : $ $3.80 Diluted Shares: 58 million Free Cash Flow (a)(b) : ~$250 million Free Cash Flow Before New Business Investments (a) : ~$285 million (a) Does not reflect any impact of potential severance and restructuring related expenses in the U.K. and Australia. (b) Free Cash Flow is a non-gaap financial measure. Reconciliations of non-gaap financial measures accompany this presentation. 16
17 G&W Summary Outlook for 2016 Consolidated G&W Adjusted diluted EPS expected to decline approximately 10% (a) Free cash flow expected to increase approximately 10% to $285 million, prior to capital for new business investments (a) Deleverage from 3.7x net debt/ebitda to 3.4x net debt/ebitda (assuming no share repurchase or acquisitions/investments) (b) North America Segment (80% of operating income) Carloads down 3%; Core pricing up 3%; Operating income slightly down Coal revenue down 15% - 20% to $75 million - $80 million due primarily to natural gas competition Strong U.S. dollar continues to impede volumes due to cheaper imports (steel) and less competitive exports (paper, agricultural products) (a) Does not reflect any impact of potential severance and restructuring related expenses in the U.K. and Australia. (b) EBITDA is a non-gaap financial measure. Reconciliations of non-gaap financial measures accompany this presentation. 17
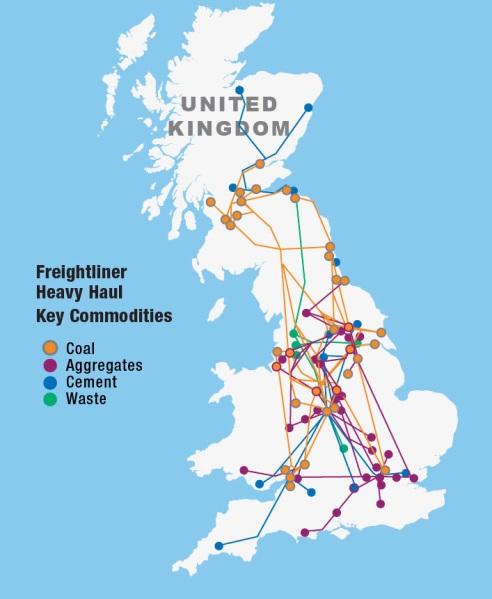
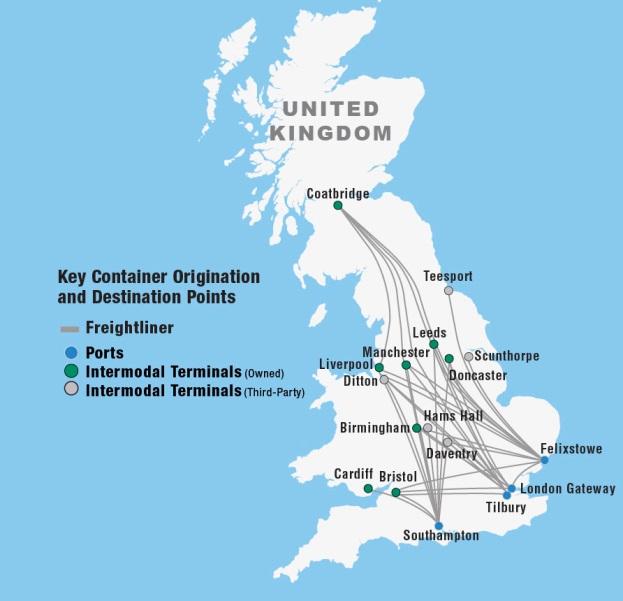
18 G&W Summary Outlook for 2016 (cont.) Australia Segment (11% of operating income) Operating income down 25% (a) primarily due to lower iron ore and manganese shipments as well as weaker currency Remaining iron ore exposure in Australia approximately US$44 million of revenue Additional cost reductions underway, coinciding with recent manganese mine closure U.K./Europe Segment (9% of operating income) Operating income flat (a) in 2016, with second half operating income expected to increase 15% after U.K. coal business restructured U.K. coal revenues down from annualized US$30 million in 2015 to approximately US$15 million in 2016; workforce restructuring complete by mid-2016 (see details next slide) Expected growth in aggregates and U.K. Intermodal (partial redeployment of coal equipment to serve new customer contracts; also bidding on other new business) Eliminating marginal routes in Freightliner s continental Europe intermodal business (a) Does not reflect any impact of potential severance and restructuring related expenses in the U.K. and Australia. 18
19 Detail on Restructuring U.K. Coal Business in First Half 2016 G&W original acquisition expectations for U.K. coal to fade by 2022 have now changed; we expect dramatically lower coal shipments in 2016 and a need to restructure the business Three parts of U.K. Coal Business Restructuring 1. Transition of leased locomotives to other revenue services under open access (well underway) 2. Restructure workforce (expected to be completed mid-2016) 3. Allow expiration of coal wagon leases (and/or convert some wagons for other service) In 2016, U.K. coal contribution forecast to be US$15 million of EBITDA lower than expected After U.K. workforce restructuring, annual EBITDA shortfall is US$10 million lower than expected Of the shortfall, US$5 million is leased equipment that we will redeploy in new service or return to lessors (majority by 2018) Lost EBITDA from U.K. coal of roughly US$5 million EBITDA originally expected to fade by 2022 While U.K. coal business has fallen off much more rapidly than expected, replacement business is proving available in other markets to fill US$5 million gap 19
20 Key Priorities for G&W in Safety - Freightliner integration to G&W safety culture 2. Strong Free Cash Flow - approximately 10% increase over 2015 (a) 3. New Commercial Development (U.S., U.K., Australia, Europe) 4. U.S. Short Line Tax Credit Extension 5. Acquisitions and Investments Worldwide (weighed against intrinsic value of GWR shares) (a) Free Cash Flow is a non-gaap financial measure. Reconciliations of non-gaap financial measures accompany this presentation. 20

21 21


22 Reconciliation of Non-GAAP Financial Measures 22
23 Non-GAAP Financial Measures This presentation contains references to Adjusted Income from Operations, Adjusted Operating Expenses, Adjusted Operating Ratio, Adjusted Net Income, Adjusted Diluted Earnings Per Common Share (EPS), Free Cash Flow, Earnings Before Interest and Taxes (EBIT), Earnings Before Interest, Taxes, Depreciation and Amortization (EBITDA), Adjusted EBITDA and Net Debt to Adjusted EBITDA, which are non-gaap financial measures as this term is defined in Item 10(e) of Regulation S-K under the Securities Act of 1933 and the Securities Exchange Act of 1934 and Regulation G under the Securities Exchange Act of In accordance with these rules, G&W has reconciled these non-gaap financial measures to their most directly comparable U.S. GAAP measures. Management views these non-gaap financial measures as important measures of G&W s operating performance or, in the case of Free Cash Flow, an important financial measure of how well G&W is managing its assets and a useful indicator of cash flow that may be available for discretionary use by G&W. Management also views these non-gaap financial measures as a way to assess comparability between periods. Key limitations of the Free Cash Flow measure include the assumptions that G&W will be able to refinance its existing debt when it matures and meet other cash flow obligations from financing activities, such as principal payments on debt. These non-gaap financial measures are not intended to represent, and should not be considered more meaningful than, or as an alternative to, their most directly comparable GAAP measures. These non-gaap financial measures may be different from similarly-titled non-gaap financial measures used by other companies. The following tables set forth reconciliations of each of these non-gaap financial measures to their most directly comparable GAAP measure (in millions, except percentages and per share amounts). 23
24 Adjusted Net Income and Adjusted Diluted EPS Three Months Ended December 31, 2015 Net Income Diluted EPS As reported $ 84.9 $ 1.47 Add back certain items: Business development and related costs Net gain on sale of assets (0.2) - Out of period benefit of final allocation of fair values to Freightliner's assets & liabilities (1.6) (0.03) Impact of reduction in U.K. effective tax rate (9.7) (0.17) 2015 Short-Line Tax Credit (27.4) (0.47) Application of full year effective rate on Q1 - Q3 results As adjusted $ 49.1 $ 0.85 Three Months Ended December 31, 2014 Net Income Diluted EPS As reported $ 87.4 $ 1.53 Add back certain items: Business development and related costs Net gain on sale of assets (1.0) (0.02) Retroactive Short-Line Tax Credit for Q1 - Q (27.0) (0.47) Application of full year effective rate on Q1 - Q3 results As adjusted $ 63.8 $ 1.12 FX (0.05) As adjusted excluding FX $
25 Adjusted Diluted EPS Three Months Ended December 31, 2015 Outlook (Revised - December 11, 2015) Diluted EPS As reported $ $0.80 Add back certain items: Business development and related costs 0.03 Australian severance costs 0.02 As adjusted $ $0.85 Three Months Ended December 31, 2015 Outlook (October 30, 2015) Diluted EPS As reported $ $0.90 Add back certain items: Business development and related costs 0.03 Australian severance costs 0.02 As adjusted $ $
26 Adjusted Income from Operations, Adjusted Operating Expenses and Adjusted Operating Ratio by Segment Three Months Ended December 31, 2015 North American Operations Australian Operations U.K./European Operations Total Operating revenues $ $ 55.2 $ $ Operating expenses Income from operations (a) $ 73.2 $ 10.5 $ 10.9 $ 94.6 Operating ratio (b) 75.5% 81.0% 93.2% 81.6% Operating expenses $ $ 44.7 $ $ Business development and related costs (1.2) (0.5) (0.9) (2.5) Net gain on sale of assets Out of period benefit of final allocation of fair values to Freightliner's assets & liabilities Adjusted operating expenses $ $ 44.2 $ $ Adjusted income from operations $ 74.1 $ 11.0 $ 9.1 $ 94.2 Adjusted operating ratio 75.2% 80.1% 94.3% 81.7% (a) Income from operations is calculated as operating revenues less operating expenses. (b) Operating ratio is calculated as operating expenses divided by operating revenues. 26
27 Adjusted Income from Operations, Adjusted Operating Expenses and Adjusted Operating Ratio by Segment (cont.) Three Months Ended December 31, 2014 North American Operations Australian Operations U.K./European Operations Total Operating revenues $ $ 72.4 $ 5.0 $ Operating expenses Income from operations (a) $ 90.3 $ 23.8 $ (0.6) $ Operating ratio (b) 73.3% 67.2% 111.5% 72.7% Operating expenses $ $ 48.6 $ 5.5 $ Business development and related costs (1.6) (0.0) - (1.6) Net gain on sale of assets Adjusted operating expenses $ $ 48.8 $ 5.6 $ Adjusted income from operations $ 90.4 $ 23.6 $ (0.6) $ Adjusted operating ratio 73.3% 67.4% 112.0% 72.7% (a) Income from operations is calculated as operating revenues less operating expenses. (b) Operating ratio is calculated as operating expenses divided by operating revenues. 27
28 Adjusted Income from Operations, Adjusted Operating Expenses and Adjusted Operating Ratio by Segment (cont.) Twelve Months Ended December 31, 2015 North American Operations Australian Operations U.K./European Operations Total Operating revenues $ 1,241.8 $ $ $ 2,000.4 Operating expenses ,616.1 Income from operations (a) $ $ 54.8 $ 31.9 $ Operating ratio 76.0% 77.4% 93.8% 80.8% Operating expenses $ $ $ $ 1,616.1 Business development and related costs (3.2) (2.7) (1.1) (7.0) Freightliner acquisition related costs (12.6) (0.0) - (12.6) Net gain on sale of assets Adjusted operating expenses $ $ $ $ 1,598.8 Adjusted income from operations $ $ 57.6 $ 32.7 $ Adjusted operating ratio 74.9% 76.3% 93.7% 79.9% (a) Income from operations is calculated as operating revenues less operating expenses. 28
29 Adjusted Income from Operations, Adjusted Operating Expenses and Adjusted Operating Ratio by Segment (cont.) Three Months Ended December 31, 2015 Outlook (October 30, 2015) North America Australia U.K./Europe Total Operating revenues $300 - $305 $55 - $60 $160 - $165 $515 - $530 Operating expenses Income from operations (a) $76 - $80 ~$12 $8 - $10 $97 - $103 Operating ratio (b) ~74% ~78% 94% - 95% ~81% Operating expenses $224 - $225 $43 - $48 $152 - $155 $418 - $427 Business development and related costs (2) - - (2) Australian severance costs - (2) - (2) Adjusted operating expenses Adjusted income from operations $78 - $82 ~$14 $8 - $10 $100 - $106 Adjusted operating ratio ~74% ~76% 94% - 95% ~80% (a) Income from operations is calculated as operating revenues less operating expenses. (b) Operating ratio is calculated as operating expenses divided by operating revenues. 29
30 Adjusted Diluted EPS Twelve Months Ended December 31, 2015 Diluted EPS As reported $ 3.89 Add back certain items: Business development and related costs 0.10 Freightliner acquisition-related costs 0.16 Net gain on sale of assets (0.03) Impact of reduction in U.K. effective tax rate (0.17) Loss on settlement of Freightliner acquisition-related foreign currency forward purchase contracts Short Line Tax Credit (0.47) As adjusted $ 3.68 FX (0.05) As adjusted excluding FX $
31 2016 Free Cash Flow Twelve Months Ended December 31, Outlook Net cash provided by operating activities $ 475 Net cash used in investing activities (225) Net cash used for acquisitions - Free cash flow $ 250 New business investments 35 Free cash flow before new business investments $
32 Net Debt/Adjusted EBITDA Twelve Months Ended December 31, 2015 Net income $ Add back: Provision for income taxes 75.9 Other income, net (1.9) Interest expense 67.1 Interest income (0.5) Depreciation and amortization expense Acquisition LTM* Combined Company LTM EBITDA $ $ 19.5 $ Add back certain items Non-cash compensation cost related to equity awards $ 14.6 Loss on settlement of Freightliner acquisition-related foreign currency forward purchase contracts 18.7 Freightliner acquisition-related costs 16.8 Net gain on sale of assets (2.3) Adjusted EBITDA $ $ 19.5 $ Net debt $ 2,269 Net debt/adjusted EBITDA ratio 3.7 : 1.0 * Includes Freightliner - 1/1/2015-3/24/2015 and other investments 32
33 EBIT, EBITDA and Net Debt/Adjusted EBITDA 2016 (Outlook) Net income $ 215 Add back: Provision for income taxes 90 Other income, net - Interest expense 75 Interest income - EBIT $ 380 Depreciation and amortization expense 204 EBITDA $ 584 Add back certain items: Non-cash compensation cost related to equity awards 16 Adjusted EBITDA $ 600 Net debt $ 2,023 Net debt/adjusted EBITDA ratio 3.4 :

34 34
Second Quarter 2016 Earnings Call
 Second Quarter 2016 Earnings Call August 1, 2016 1 Forward-Looking Statements This presentation contains forward-looking statements regarding future events and the future performance of that involve risks
Genesee & Wyoming Inc.
 Genesee & Wyoming Jack Hellmann, President and CEO February 2017 1 Forward-Looking Statements This presentation contains forward-looking statements regarding future events and the future performance of
Fourth Quarter 2017 Earnings Call
 Fourth Quarter 2017 Earnings Call February 8, 2018 1 Forward-Looking Statements This presentation contains forward-looking statements regarding future events and the future performance of that involve
Second Quarter 2018 Earnings Call
 Second Quarter 2018 Earnings Call July 27, 2018 1 Forward-Looking Statements This presentation contains forward-looking statements regarding future events and the future performance of Genesee & Wyoming
First Quarter 2017 Earnings Call
 First Quarter 2017 Earnings Call May 2, 2017 1 Forward-Looking Statements This presentation contains forward-looking statements regarding future events and the future performance of that involve risks
Genesee & Wyoming Inc.
 Genesee & Wyoming Inc. T. J. Gallagher, Chief Financial Officer Genesee & Wyoming Inc. 1 Forward Looking Statements This presentation contains forward-looking statements regarding future events and the
Genesee & Wyoming Inc. November 2018
 November 2018 1 Agenda 1. G&W Overview 2. Acquisitions & Investments 3. Business Update 2 Overview NYSE: Listed as GWR with ~$4.8B market capitalization Railroads: 122 with ~16,000 track miles (80% North
Reconciliation of Non-GAAP Financial Measures. Genesee & Wyoming Inc.
 Reconciliation of Non-GAAP Financial Measures 0 Non-GAAP Financial Measures This presentation contains references to Adjusted Net Income Attributable to G&W, Adjusted Diluted Earnings Per Common Share
Reconciliation of Non-GAAP Financial Measures. Genesee & Wyoming Inc.
 Reconciliation of Non-GAAP Financial Measures 0 Non-GAAP Financial Measures This presentation contains references to Adjusted Net Income Attributable to G&W, Adjusted Diluted Earnings Per Common Share
Reconciliation of Non-GAAP Financial Measures. Genesee & Wyoming Inc.
 Reconciliation of Non-GAAP Financial Measures 0 Non-GAAP Financial Measures This presentation contains references to Adjusted Net Income Attributable to G&W, Adjusted Diluted Earnings Per Common Share
Reconciliation of Non-GAAP Financial Measures. Genesee & Wyoming Inc.
 Reconciliation of Non-GAAP Financial Measures 0 Non-GAAP Financial Measures This presentation contains references to Adjusted Net Income Attributable to G&W, Adjusted Diluted Earnings Per Common Share
Type. Fourth Quarter 2008 Earnings Call. February 11, 2009
 Type Fourth Quarter 2008 Earnings Call February 11, 2009 Forward-looking Statements This presentation contains forward-looking statements regarding future events and the future performance of Genesee &
FORWARD LOOKING STATEMENTS
 FORWARD LOOKING STATEMENTS The following investor presentation contains certain forward-looking information within the meaning of applicable securities laws relating, but not limited, to Canadian Pacific
Type. Genesee & Wyoming Inc. September 11, Dahlman Rose & Co. 1 st Annual Global Transportation Conference
 Type Genesee & Wyoming Inc. Dahlman Rose & Co. 1 st Annual Global Transportation Conference September 11, 2008 Forward-looking Statements This presentation contains forward-looking statements regarding
Genesee & Wyoming Inc Annual Report. North America. Australia. U.K./Europe
 Genesee & Wyoming Inc. 2015 Annual Report U.K./Europe Australia North America Genesee & Wyoming owns or leases 120 freight railroads worldwide that are organized in 11 operating regions with 7,500 employees
Fourth Quarter Earnings Release January 19, 2012
 Fourth Quarter Earnings Release January 19, 2012 Jim Young, Chairman & CEO 1 Union Pacific Achieves Milestones Positives Record Financial Results Achieved in 4 th Quarter and Full Year Employee Safety
Union Pacific Reports All-Time Quarterly Records
 Union Pacific Reports All-Time Quarterly Records Diluted Earnings per Share up 21 Percent FOR IMMEDIATE RELEASE All-Time Quarterly Records Diluted earnings per share of $1.43 improved 21 percent. Operating
Fourth Quarter 2012 Earnings Release
 Fourth Quarter Earnings Release January 24, 2013 Jack Koraleski, CEO 1 Union Pacific Achieves Milestones Positives Fourth Quarter and Full Year Financial Results Employee Safety Customer Satisfaction Franchise
CP reports record fourth-quarter and record full-year results on the strength of its operating model and disciplined approach in the marketplace
 Release: January 18, 2018 CP reports record fourth-quarter and record full-year results on the strength of its operating model and disciplined approach in the marketplace Calgary, AB - Canadian Pacific
First Quarter 2008 Earnings Conference Call
 1 2008 Earnings Conference Call Proxy Statement Disclosure On February 22, 2008, CSX Corporation ("CSX") filed with the SEC a revised preliminary proxy statement in connection with its 2008 Annual Meeting.
First Quarter 2017 Results
 April 27, 2017 First Quarter 2017 Earnings Release Lance Fritz Chairman, President & CEO 1 First Quarter 2017 Results Earnings Per Share First Quarter Operating Ratio First Quarter $1.16 +14% $1.32 First
FORWARD LOOKING STATEMENTS
 FORWARD LOOKING STATEMENTS The following investor presentation contains certain forward-looking information within the meaning of applicable securities laws relating, but not limited, to Canadian Pacific
Media Contact: William H. Galligan Phone: 816/
 Media Contact: William H. Galligan Phone: 816/983-1551 bgalligan@kcsouthern.com Kansas City Southern Reports Record Fourth Quarter and Full-Year 2013 Revenues, Carloads and Operating Income Fourth Quarter
Union Pacific Reports Best-Ever Quarterly Results Diluted Earnings per Share up 13 Percent
 Union Pacific Reports Best-Ever Quarterly Results Diluted Earnings per Share up 13 Percent FOR IMMEDIATE RELEASE Best-Ever Quarterly Records Diluted earnings per share of $2.48 improved 13 percent. Operating
Type. Genesee & Wyoming Inc. NYSE Euronext & WJB Capital Growth Conference. Timothy J. Gallagher Chief Financial Officer
 Type Genesee & Wyoming Inc. NYSE Euronext & WJB Capital Growth Conference Timothy J. Gallagher Chief Financial Officer Forward-looking Statements This presentation contains forward-looking statements regarding
2018 FOURTH QUARTER EARNINGS CONFERENCE CALL. James M. Foote President and Chief Executive Officer
 2018 FOURTH QUARTER EARNINGS CONFERENCE CALL James M. Foote President and Chief Executive Officer FORWARD LOOKING DISCLOSURE This information and other statements by the company may contain forwardlooking
Kansas City Southern Reports Record Fourth Quarter and Full-Year 2018 Results
 KCS: Ashley Thorne, 816-983-1530, athorne@kcsouthern.com Kansas City Southern Reports Record Fourth Quarter and Full-Year 2018 Results Fourth Quarter 2018 Results Record fourth quarter revenues of $694
Union Pacific Reports Record First Quarter Diluted Earnings per Share up 17 Percent
 Union Pacific Reports Record First Quarter Diluted Earnings per Share up 17 Percent FOR IMMEDIATE RELEASE First Quarter Records Diluted earnings per share of $2.38 improved 17 percent. Operating revenues
1Q18 EARNINGS PRESENTATION NYSE: DOOR
 1Q18 EARNINGS PRESENTATION NYSE: DOOR Safe Harbor / Non-GAAP Financial Measures SAFE HARBOR / FORWARD LOOKING STATEMENT This press release contains forward-looking information and other forward-looking
2018 FIRST QUARTER CSX EARNINGS CONFERENCE CALL
 2018 FIRST QUARTER CSX EARNINGS CONFERENCE CALL FORWARD LOOKING DISCLOSURE This information and other statements by the company may contain forward-looking statements within the meaning of the Private
Kansas City Southern Reports Fourth Quarter and Full-Year 2016
 KCS: William H. Galligan, 816-983-1551, bgalligan@kcsouthern.com Fourth Quarter 2016 Results Kansas City Southern Reports Fourth Quarter and Full-Year 2016 Revenue of $599 million, unchanged from prior
Safe Harbor Statement
 Kansas City Southern Third Quarter 2014 Earnings Presentation October 17, 2014 Safe Harbor Statement This presentation contains forward-looking statements within the meaning of the securities laws concerning
Q Earnings. January 23, 2019
 Q1 2019 Earnings January 23, 2019 Forward-Looking Statements and Non-GAAP Financial Measures Forward-Looking Statements This presentation contains certain forward-looking statements within the meaning
CANADIAN PACIFIC ANNOUNCES 2008 RESULTS
 Release: Immediate, January 27, 2009 CANADIAN PACIFIC ANNOUNCES 2008 RESULTS CALGARY Canadian Pacific Railway Limited (TSX/NYSE: CP) announced its fourth-quarter and full-year 2008 results today. Net income
FORWARD-LOOKING STATEMENTS
 FORWARD-LOOKING STATEMENTS The following investor presentation contains certain forwardlooking information within the meaning of applicable securities laws relating, but not limited, to Canadian Pacific
Union Pacific Reports Best-Ever Quarterly Results
 Union Pacific Reports Best-Ever Quarterly Results Diluted Earnings per Share up 13 Percent FOR IMMEDIATE RELEASE Best-Ever Quarterly Records Diluted earnings per share of $2.37 improved 13 percent. Operating
Second Quarter 2016 Results
 July 21, 2016 Second Quarter 2016 Earnings Release Lance Fritz Chairman, President & CEO 1 Second Quarter 2016 Results Earnings Per Share Second Quarter $1.43 $1.38 Earnings Per Share -15% Down 15% $1.17
Fourth Quarter 2018 Results
 January 24, 2019 Fourth Quarter 2018 Earnings Release Lance Fritz Chairman, President & CEO 1 Fourth Quarter 2018 Results Earnings Per Share Fourth Quarter Operating Ratio Fourth Quarter $9.25 +39% $2.12
Third Quarter 2018 Teleconference Supplemental Data
 Third Quarter 2018 Teleconference Supplemental Data Cautionary Statement Forward-Looking Information This communication contains forward looking statements as that term is defined in the Private Securities
Fourth-Quarter 2015 Earnings Supporting Information. January 28, 2016
 Fourth-Quarter 2015 Earnings Supporting Information January 28, 2016 Forward-looking statements and non-gaap financial information This presentation includes forward-looking statements within the meaning
Kansas City Southern Reports Record Fourth Quarter and Full-Year 2017 Results
 KCS: Ashley Thorne, 816-983-1530, athorne@kcsouthern.com Fourth Quarter 2017 Results Kansas City Southern Reports Record Fourth Quarter and Full-Year 2017 Results Record fourth quarter revenues of $660
First Quarter 2015 Financial Results April 20, 2015
 First Quarter 2015 Financial Results April 20, 2015 Forward-Looking Statements The financial results in this presentation were determined on the basis of U.S. GAAP. Please refer to the website www.cn.ca/nongaap
Genesee & Wyoming Inc.
 Genesee & Wyoming Inc. Reconciliation of Non-GAAP Measures 3rd Quarter 2006 Earnings Conference Call Non-GAAP Reconciliation Free Cash Flow Free Cash Flow Description and Discussion Management views Free
In 2017, CP will continue to find opportunities to enhance the productivity, fluidity and safety of its operations.
 Release: Immediate January 18, 2017 CP reports record low operating ratio for fourth quarter and full year amid challenging conditions Calgary, AB - Canadian Pacific Railway Limited (TSX: CP) (NYSE: CP)
Kansas City Southern Reports Record First Quarter Results
 Kansas City Southern Reports Record First Quarter Results First Quarter 2018 Results Record first quarter revenues of $639 million, an increase of 5 from prior year on 1 volume growth Record first quarter
Kansas City Southern Reports Second Quarter 2016
 KCS: William H. Galligan, 816-983-1551, bgalligan@kcsouthern.com Second Quarter 2016 Results Kansas City Southern Reports Second Quarter 2016 Revenue of $569 million, a decrease of 3% from second quarter
FORWARD LOOKING STATEMENTS
 FORWARD LOOKING STATEMENTS The following investor presentation contains certain forward-looking information within the meaning of applicable securities laws relating, but not limited, to Canadian Pacific
Q Earnings. July 26, 2017
 Q3 2017 Earnings July 26, 2017 Forward-Looking Statements and Non-GAAP Measures Forward-Looking Statements This presentation contains certain forward-looking statements within the meaning of the U.S. Private
Burlington Northern Santa Fe, LLC
 Burlington Northern Santa Fe, LLC 2017 FIXED-INCOME INVESTOR CALL May 9, 2017 This presentation is intended to provide information to certain investors in Burlington Northern Santa Fe, LLC and BNSF Railway
Union Pacific Reports All-Time Quarterly Records Third Quarter Diluted Earnings per Share up 23 Percent
 Union Pacific Reports All-Time Quarterly Records Third Quarter Diluted Earnings per Share up 23 Percent FOR IMMEDIATE RELEASE All-Time Quarterly Records Diluted earnings per share of $1.53 improved 23
Third Quarter 2014 Earnings Release
 Third Quarter Earnings Release October 23, Jack Koraleski, CEO 1 Third Quarter Record Results Positives Best-Ever Quarter Operating Revenue Operating Income Operating Ratio Earnings Franchise Diversity
Kansas City Southern Reports Third Quarter Results
 Media Contact: William H. Galligan Phone: 816/983-1551 bgalligan@kcsouthern.com Third Quarter 2015 Results Kansas City Southern Reports Third Quarter Results Revenue of $632 million, a decrease of 7% compared
Reconciliation of Non-GAAP Financial Measures 2 nd Quarter 2007 Earnings Conference Call
 Reconciliation of Non-GAAP Financial Measures 2 nd Quarter 2007 Earnings Conference Call Reconciliation of Non-GAAP Financial Measures This earnings release contains the losses related to GWI s hurricane-damaged
3Q Fiscal 2017 ADP Earnings Call & Webcast. May 3, 2017
 3Q Fiscal 2017 ADP Earnings Call & Webcast May 3, 2017 Forward Looking Statements This presentation and other written or oral statements made from time to time by ADP may contain forward-looking statements
FORWARD LOOKING STATEMENTS
 FORWARD LOOKING STATEMENTS The following investor presentation contains certain forward-looking information within the meaning of applicable securities laws relating, but not limited, to Canadian Pacific
1st Quarter 2009 Investors Report
 1st Quarter 2009 Investors Report BURLINGTON NORTHERN SANTA FE CORPORATION INVESTORS' REPORT - UNAUDITED 1 st Quarter 2009 INDEX Page Earnings Press Release 1-3 Consolidated Income Information 4 Consolidated
2016 BB&T Annual Transportation Services Conference
 2016 BB&T Annual Transportation Services Conference February 10, 2016 Marta R. Stewart Executive Vice President Finance and Chief Financial Officer 1 Forward-Looking Statements Certain statements in this
Union Pacific Reports Fourth Quarter and Full Year 2017 Results
 NEWS RELEASE Union Pacific Reports Fourth Quarter and Full Year 2017 Results FOR IMMEDIATE RELEASE Omaha, Neb., January 25, 2018 Union Pacific Corporation (NYSE: UNP) today reported 2017 fourth quarter
Union Pacific Reports First Quarter Results First Quarter Diluted Earnings per Share up 9 Percent
 Union Pacific Reports First Quarter Results First Quarter Diluted Earnings per Share up 9 Percent FOR IMMEDIATE RELEASE First Quarter Results Diluted earnings per share of $1.30 improved 9 percent. Operating
Q Earnings. April 25, 2018
 Q2 2018 Earnings April 25, 2018 Forward-Looking Statements and Non-GAAP Measures Forward-Looking Statements This presentation contains certain forward-looking statements within the meaning of the U.S.
October 24, Q Supplemental Information
 October 24, 2018 Q3 2018 Supplemental Information Non-GAAP Disclaimer The financial results disclosed in this presentation include certain measures calculated and presented in accordance with GAAP. In
Q Earnings. October 31, 2018
 Q4 2018 Earnings October 31, 2018 Forward-Looking Statements and Non-GAAP Financial Measures Forward-Looking Statements This presentation contains certain forward-looking statements within the meaning
Q Earnings. July 20, 2016
 Q3 2016 Earnings July 20, 2016 Forward-Looking Statements and Non-GAAP Measures Forward-Looking Statements This presentation contains certain forward-looking statements within the meaning of the U.S. Private
Q Earnings. April 26, 2017
 Q2 2017 Earnings April 26, 2017 Forward-Looking Statements and Non-GAAP Measures Forward-Looking Statements This presentation contains certain forward-looking statements within the meaning of the U.S.
UNION PACIFIC REPORTS RECORD FOURTH QUARTER AND FULL YEAR EARNINGS. Fourth Quarter 2007 Records. Operating revenue totaled $4.2 billion, up 6 percent.
 UNION PACIFIC REPORTS RECORD FOURTH QUARTER AND FULL YEAR EARNINGS FOR IMMEDIATE RELEASE: Fourth Quarter 2007 Records Operating revenue totaled $4.2 billion, up 6 percent. Operating income grew 7 percent
1Q 2016 Earnings Call Presentation
 1Q 2016 Earnings Call Presentation Valmont Industries. Inc. 2016 Investor Day Forward-looking Statement Disclosure These slides contain (and the accompanying oral discussion will contain) forwardlooking
Q Earnings. November 1, 2017
 Q4 2017 Earnings November 1, 2017 Forward-Looking Statements and Non-GAAP Measures Forward-Looking Statements This presentation contains certain forward-looking statements within the meaning of the U.S.
The J. M. Smucker Company
 The J. M. Smucker Company Second Quarter Fiscal 2019 Earnings SUPPLEMENTARY INFORMATION November 28, 2018 Consolidated Results ($ in millions, except per share data) FY19 Q2 FY18 Q2 YoY Change Net Sales
Horizon Global First Quarter 2016 Earnings Presentation
 Horizon Global First Quarter 2016 Earnings Presentation May 3, 2016 1 Safe Harbor Statement Forward-Looking Statements This presentation may contain "forward-looking statements" as defined in the Private
Tenneco Reports Fourth Quarter And Full-Year 2012 Financial Results
 news release Tenneco Reports Fourth Quarter And Full-Year 2012 Financial Results Highest-ever full-year revenue of $7.4 billion Record net income and EPS for Q4 and full year Record fourth quarter cash
Robert Pace CHAIRMAN OF THE BOARD
 Robert Pace CHAIRMAN OF THE BOARD Safety Briefing Jim Larmer SEPTEMBER 10, 2014 Kevin Timmerman APRIL 10, 2015 Notice of Meeting Scrutineers Report on Quorum Consolidated Financial Statements Election
July 24, Q Supplemental Information
 July 24, 2018 Q2 2018 Supplemental Information Non-GAAP Disclaimer The financial results disclosed in this presentation include certain measures calculated and presented in accordance with GAAP. In addition
Amkor Technology, Inc. Financial Information October 2015
 Amkor Technology, Inc. Financial Information October 2015 1 Disclaimer Forward-Looking Statement Disclaimer All information and other statements contained in this presentation, other than statements of
Q Earnings Call. November 5, 2012
 Q4 2012 Earnings Call November 5, 2012 Forward-Looking Statements and Non-GAAP Measures Forward-Looking Statements -- This presentation contains certain forward-looking statements within the meaning of
Company Delivers Record Quarterly Net Sales of $1.7 Billion, up 12% over the Prior Year
 Company Delivers Record Quarterly Net Sales of $1.7 Billion, up 12% over the Prior Year Mike Thaman Chairman & Chief Executive Officer Michael C. McMurray Chief Financial Officer Third-Quarter Results
FORWARD LOOKING STATEMENTS
 FORWARD LOOKING STATEMENTS The following investor presentation contains certain forward-looking information within the meaning of applicable securities laws relating, but not limited, to Canadian Pacific
Q Earnings. January 24, 2018
 Q1 2018 Earnings January 24, 2018 Forward-Looking Statements and Non-GAAP Measures Forward-Looking Statements This presentation contains certain forward-looking statements within the meaning of the U.S.
Q Earnings. November 2, 2016
 Q4 2016 Earnings November 2, 2016 Forward-Looking Statements and Non-GAAP Measures Forward-Looking Statements This presentation contains certain forward-looking statements within the meaning of the U.S.
Second Quarter 2017 Financial Results. July 25, 2017
 Second Quarter 2017 Financial Results July 25, 2017 Forward-Looking Statements Certain statements included in this presentation constitute forward-looking statements within the meaning of the United States
Fourth Quarter February 25, 2009
 Crown Castle International NYSE: CCI Fourth Quarter 2008 Earnings Conference Call February 25, 2009 1 Cautionary Information This presentation contains forward-looking statements and information that are
Reconciliation of Non-GAAP Financial Measures. Genesee & Wyoming Inc.
 Reconciliation of Non-GAAP Financial Measures 0 Non-GAAP Financial Measures Reconciliation This presentation contains reconciliations of G&W s adjusted income from operations, adjusted operating ratios,
Q Financial Supplement
 Reconcilation of GAAP and Non-GAAP Financial Measures Non-GAAP Net Income and Non-GAAP EPS (in thousands except per share data) 2014 2015 Three Months Ending June 30, Low Range Guidance (1) High Range
Q Earnings. July 25, 2018
 Q3 2018 Earnings July 25, 2018 Forward-Looking Statements and Non-GAAP Measures Forward-Looking Statements This presentation contains certain forward-looking statements within the meaning of the U.S. Private
UNION PACIFIC REPORTS RECORD FOURTH QUARTER AND FULL YEAR EARNINGS Operating Ratio Improves to 79.6 percent. Fourth Quarter 2006 Highlights
 UNION PACIFIC REPORTS RECORD FOURTH QUARTER AND FULL YEAR EARNINGS Operating Ratio Improves to 79.6 percent FOR IMMEDIATE RELEASE: OMAHA, Neb., January 25, 2007 Fourth Quarter 2006 Highlights Record fourth
Union Pacific Reports Fourth Quarter and Full Year 2015 Results
 NEWS RELEASE Union Pacific Reports Fourth Quarter and Full Year 2015 Results Fourth Quarter Operating Ratio of 63.2 percent FOR IMMEDIATE RELEASE Fourth Quarter Results Diluted earnings per share of $1.31
February 7, Q4 & Full Year 2017 Supplemental Information
 February 7, 2018 Q4 & Full Year Supplemental Information Non-GAAP Disclaimer The financial results disclosed in this presentation include certain measures calculated and presented in accordance with GAAP.
Q Earnings. October 28, 2015
 Q4 2015 Earnings October 28, 2015 Forward-Looking Statements and Non-GAAP Measures Forward-Looking Statements This presentation contains certain forward-looking statements within the meaning of the U.S.
Third Quarter 2018 Earnings Thursday, November 8, 2018
 Third Quarter 2018 Earnings Thursday, November 8, 2018 1 Forward-Looking Statements This presentation may contain "forward-looking statements" as defined in the Private Securities Litigation Reform Act
/// The New Wabtec. February 25, 2019
 The New Wabtec February 25, 2019 DISCLAIMER / FORWARD-LOOKING STATEMENTS Caution Concerning Forward-Looking Statements This presentation contains forward-looking statements as that term is defined in Section
Fourth Quarter Earnings Conference Call. January 27, 2016
 Fourth Quarter Earnings Conference Call January 27, 2016 1 Forward-Looking Statements Certain statements in this presentation are forward-looking statements within the meaning of the safe harbor provision
Diluted EPS $0.46 $0.46 0% $1.16 $1.26 (8)%
%") Donaldson Reports Third Quarter Results Donaldson Company, Inc. (NYSE: DCI) announced its financial results for its fiscal 2013 third quarter. Summarized financial results are as follows (dollars in millions,
Donaldson Reports Third Quarter Results Donaldson Company, Inc. (NYSE: DCI) announced its financial results for its fiscal 2013 third quarter. Summarized financial results are as follows (dollars in millions,
Fortress Transportation and Infrastructure Investors LLC. Supplemental Information Third Quarter 2018
 Fortress Transportation and Infrastructure Investors LLC Supplemental Information Third Quarter 2018 Disclaimers IN GENERAL. This disclaimer applies to this document and the verbal or written comments
For personal use only
 HY14 Results 15 May 2014 Disclaimer This presentation includes both information that is historical in character and information that consists of forward looking statements. Forward looking statements are
Cliffs Natural Resources Inc. Reports Fourth-Quarter and Full-Year 2014 Results
 NEWS RELEASE Cliffs Natural Resources Inc. Reports Fourth-Quarter and Full-Year 2014 Results Reports Fourth-Quarter Adjusted EBITDA 1 of $297 million Reports U.S. Iron Ore Realized Pricing of $99 Per Ton
Diluted earnings per share of $1.98 increased 37 percent. Operating income totaled $2.1 billion, up 5 percent.
 NEWS RELEASE Union Pacific Reports Record Second Quarter Results Second Quarter Diluted Earnings per Share up 37 percent FOR IMMEDIATE RELEASE Second Quarter Results Diluted earnings per share of $1.98
SECOND QUARTER 2014 EARNINGS CALL SUPPLEMENTAL MATERIALS
 SECOND QUARTER 2014 EARNINGS CALL SUPPLEMENTAL MATERIALS July 29, 2014 2013 FIS and/or its subsidiaries. All Rights Reserved. Agenda TOPIC Second Quarter 2014 Highlights Operations Review Financial Summary
UNITED STATES SECURITIES AND EXCHANGE COMMISSION WASHINGTON, DC FORM 8-K
 UNITED STATES SECURITIES AND EXCHANGE COMMISSION WASHINGTON, DC 20549 FORM 8-K CURRENT REPORT Pursuant to Section 13 or 15(d) of the Securities Exchange Act of 1934 Date of Report (Date of earliest event
UNION PACIFIC CORPORATION (Exact name of registrant as specified in its charter)
") UNITED STATES SECURITIES AND EXCHANGE COMMISSION Washington, D.C. 20549 FORM 8-K CURRENT REPORT Pursuant to Section 13 or 15(d) of the Securities Exchange Act of 1934 Date of Report (Date of earliest event
UNITED STATES SECURITIES AND EXCHANGE COMMISSION Washington, D.C. 20549 FORM 8-K CURRENT REPORT Pursuant to Section 13 or 15(d) of the Securities Exchange Act of 1934 Date of Report (Date of earliest event
Third Quarter Third Quarter Quarterly Financial Review. Quarterly Financial Review
 Quarterly Financial Review Third Quarter 2006 Third Quarter 2006 Quarterly Financial Review Norfolk Southern Corporation Finance Department Three Commercial Place Norfolk, Virginia 23510.2191 Printed by
4Q16 Earnings Presentation
 TUBULAR & ENERGY SERVICES CONSTRUCTION PRODUCTS RAIL PRODUCTS & SERVICES www.lbfoster.com 4Q16 Earnings Presentation March 2, 2017 Safe Harbor Statement This presentation and oral statements regarding