Burlington Northern Santa Fe, LLC
|
|
|
- Morris Lang
- 6 years ago
- Views:
Transcription

1 Burlington Northern Santa Fe, LLC 2017 FIXED-INCOME INVESTOR CALL May 9, 2017 This presentation is intended to provide information to certain investors in Burlington Northern Santa Fe, LLC and BNSF Railway Company debt securities. The information presented may not be distributed to third parties or quoted in analyses prepared based on this presentation.
2 Agenda Financial Results Spotlight Topic Financial Management 2
3 Cautionary Statement Regarding Forward- Looking Statements and Information Statements made in this presentation relating to the Company s future economic performance or business outlook, projections or expectations of financial or operational results, or statements that refer to matters that are not historical facts, are "forward-looking statements" within the meaning of the federal securities laws. Similarly, statements that describe the Company's objectives, expectations, plans or goals are forward-looking statements. Forward-looking statements involve a number of risks and uncertainties, and actual performance or results may differ materially. For a discussion of material risks and uncertainties that the Company faces, see the discussion in Part I, Item 1A, of the Company s Form 10-K. Important factors that could cause actual results to differ materially include, but are not limited to, the following: Economic and industry conditions: material adverse changes in economic or industry conditions, both in the United States and globally; volatility in the capital or credit markets including changes affecting the timely availability and cost of capital; changes in customer demand; effects of adverse economic conditions affecting shippers or BNSF s supplier base; effects due to more stringent regulatory policies such as the regulation of greenhouse gas emissions that could reduce the demand for coal or governmental tariffs or subsidies that could affect the demand for grain; the impact of low natural gas or oil prices on energy-related commodities demand; changes in environmental laws and other laws and regulations that could affect the demand for drilling products and products produced by drilling; changes in prices of fuel and other key materials, the impact of high barriers to entry for prospective new suppliers and disruptions in supply chains for these materials; competition and consolidation within the transportation industry; and changes in crew availability, labor and benefits costs and labor difficulties, including stoppages affecting either BNSF s operations or customers abilities to deliver goods to BNSF for shipment; Legal, legislative and regulatory factors: developments and changes in laws and regulations, including those affecting train operations, the marketing of services or regulatory restrictions on equipment; the ultimate outcome of shipper and rate claims subject to adjudication; claims, investigations or litigation alleging violations of the antitrust laws; increased economic regulation of the rail industry through legislative action and revised rules and standards applied by the U.S. Surface Transportation Board in various areas including rates and services; developments in environmental investigations or proceedings with respect to rail operations or current or past ownership or control of real property or properties owned by others impacted by BNSF operations; losses resulting from claims and litigation relating to personal injuries, asbestos and other occupational diseases; the release of hazardous materials, environmental contamination and damage to property; regulation, restrictions or caps, or other controls on transportation of energy-related commodities or other operating restrictions that could affect operations or increase costs; the availability of adequate insurance to cover the risks associated with operations; and changes in tax rates and tax laws; and Operating factors: changes in operating conditions and costs; operational and other difficulties in implementing positive train control technology, including increased compliance or operational costs or penalties; restrictions on development and expansion plans due to environmental concerns; disruptions to BNSF s technology network including computer systems and software, such as cybersecurity intrusions, misappropriation of assets or sensitive information, corruption of data or operational disruptions; network congestion, including effects of greater than anticipated demand for transportation services and equipment; as well as natural events such as severe weather, fires, floods and earthquakes or man-made or other disruptions of BNSF Railway s or other railroads operating systems, structures, or equipment including the effects of acts of terrorism on the Company s system or other railroads systems or other links in the transportation chain. We caution against placing undue reliance on forward-looking statements, which reflect our current beliefs and are based on information currently available to us as of the date a forward-looking statement is made. We undertake no obligation to revise forward-looking statements to reflect future events, changes in circumstances, or changes in beliefs. In the event that we do update any forward-looking statements, no inference should be made that we will make additional updates with respect to that statement, related matters, or any other forward-looking statements. 3

4 First Quarter Results JULIE PIGGOTT Executive Vice President & Chief Financial Officer 4
5 First Quarter 2017 Highlights $ in Millions Three Months Three Months % Ended 3/31/17 Ended 3/31/16 CHG Freight Revenue $ 4,972 $ 4,549 9% Other Revenue % Total Revenue 5,185 4,767 9% Operating Expenses (3,591) (3,262) 10% Operating Income 1,594 1,505 6% Interest / Other / Taxes (756) (721) 5% Net Income $838 $784 7% Units (in thousands) 2,480 2,330 6% Average Freight RPU $2,005 $1,952 3% 5
6 First Quarter 2017 Results FREIGHT REVENUES TOTAL UNITS $ in Millions Units in Thousands % Change vs Coal +$181M (+23%) $960 19% $1,108 22% Ag Products +$60M (+6%) Coal +74K (+18%) % % Ag Products +5K (+2%) $1,680 34% % Industrial Products +2K (+0%) Consumer Products +$136M (+9%) $1,224 25% Industrial Products +$46M (+4%) Consumer Products +69K (+6%) 1,299 53% TOTAL FREIGHT REVENUES $4,972M CHANGE FROM $423M (+9%) TOTAL UNITS 2,480K CHANGE FROM K (+6%) 6

7 Consumer Products YTD Volume Highlights (through March 31, 2017) Consumer Products volumes increased due to higher domestic intermodal, international intermodal, and automotive volumes. The increases were primarily due to higher market share, improving economic conditions, and normalizing of retail inventories. 7

8 Industrial Products YTD Volume Highlights (through March 31, 2017) Industrial Products volumes were up slightly. Increases in minerals and other commodities that support domestic drilling activity were mostly offset by lower petroleum products volume due to pipeline displacement of U.S. crude traffic and lower plastics volume. 8

9 Agricultural Products YTD Volume Highlights (through March 31, 2017) Agricultural Products unit volumes increased primarily due to higher grain exports, partially offset by lower domestic grain. 9

10 Coal YTD Volume Highlights (through March 31, 2017) Coal volumes increased due to mild winter weather in the first quarter of 2016 and higher natural gas prices in the first quarter of 2017, which led to increased utility coal usage, partially offset by the effects of retirements of coal generating facilities. 10

11 BNSF Railway Update CARL ICE President & Chief Executive Officer 11


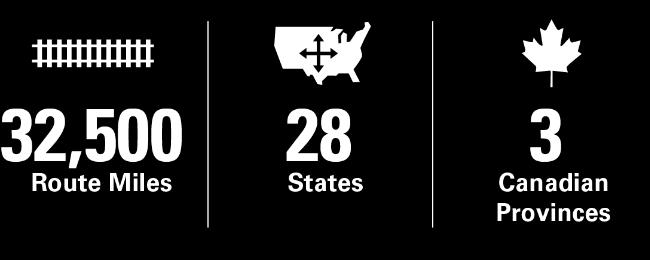
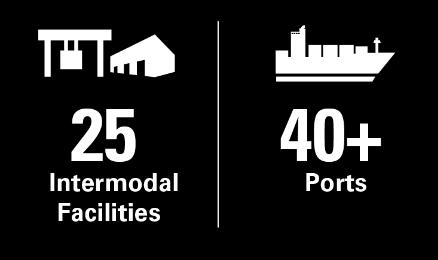
12 The BNSF Network * 12

13 BNSF s Vision Our vision is to realize the tremendous potential of BNSF Railway by providing transportation services that consistently meet our customers expectations. 13
14 BNSF A Culture Focused on Safety EMPLOYEE OPERATIONAL COMMUNITY SAFETY VISION TO OPERATE FREE OF ACCIDENTS AND INJURIES 14
15 BNSF Safety Results Employee Reportable Personal Injury Incidents Per 200,000 Employee Hours BNSF Train Incidents Have Declined BNSF has approximately 180 million train miles per year Incidents per million train-miles % Source: Federal Railroad Administration Data 15


16 Injury Rates by Industry 16


17 Value in Freight Rail Transportation HIGHWAY GRIDLOCK REDUCTION WORKHORSE OF THE ECONOMY In the U.S., railroads account for approximately 40% of all freight (more than any other transportation mode) A doublestack intermodal train removes +280 long-haul freight trucks from the highway COST EFFICIENCY In general, shippers $ pay less for shipping per ton mile via rail than other forms of surface transportation SUSTAINABILITY Moving freight by rail instead of trucks reduces greenhouse gas emissions by an estimated 75% Source: Association of American Railroads (AAR) 17


18 Environmental Stewardship Reducing Our Emissions Over the last decade, BNSF has upgraded about 40 percent of our locomotive fleet to more energy-efficient technologies, helping us make great strides in increasing fuel efficiency and decreasing CO 2 and particulate emissions. We have also improved fuel efficiency through changes in operations and maintenance practices. Recycling Materials Major recycling efforts further reduce BNSF s environmental impact. In 2016, BNSF recycled approximately: 18

19 Diversified Business Mix Units in Thousands 9% 16% 11% 18% Ag Products 973 Industrial Products 1,686 Ag Products 1,110 Industrial Products 1,727 22% 23% Consumer Products Domestic & Auto 2,325 Consumer Products International 3,195 Coal 2,458 30% Consumer Products Domestic & Auto 2,896 Consumer Products International 2,222 Coal 1,803 18% 30% 23% 19


20 Business Units Agricultural Products Strong Franchise Increasing US Yields High global grain supplies and strong U.S. dollar are continuing headwinds Coal Long-term challenges Regulatory uncertainty Impact of weather, renewables and natural gas Consumer Products Strong long-term opportunity for highwayto-rail conversion New Service Products Ocean carrier fundamentals Industrial Products Petrochemical Expansion Development of unit train origins and destinations Low oil prices & modal shift to pipeline impacting petroleum products 20


21 New & Enhanced Services Drive Growth North Line Intermodal Service Stockton PNW to/from TX Los Angeles Joint Service with KCS to/from Mexico San Bernardino BNSF Network 21


22 Velocity Performance 2016 performance improved 4% over 2015 as we continued to focus on key velocity drivers and ways to improve performance KEY DRIVERS OF PERFORMANCE +4% Focus on Safe Production Collaborating with customers on efficient new facility design and expansion Asset utilization focus (crew, loco, car) Long pool crew agreements Unit train conversion Preventative maintenance programs / asset health monitoring Efficient use of increases in capacity Annual System Velocity Comparison 22


23 Enhancing Capacity Capital Investment ,454 miles of CTC added 218 miles of double-track added 35 extended sidings added 22 new sidings added 23
24 Capital Investments CAPITAL COMMITMENTS VS. UNITS $5.5 $5.8 $4.0 $3.9 Capital in $ Billions $2.7 $3.6 $3.6 $ P Replacement Capital Expansion PTC Locomotive Equipment Units 24

25 Expenses and Financial Management PAUL BISCHLER Vice President Finance and Treasurer 25
26 BNSF First Quarter Operating Expenses THREE MONTHS ENDED 3/31/17 $ in Millions % Change vs Compensation & Benefits +$75M (+6%) Operating expenses for the three months ended March 31, 2017 were $3,591 million, an increase of $329 million, or 10%, compared to three months ended March 31, A significant portion of this increase is due to the following changes in underlying trends in expenses: Materials & Other -$5M (-2%) Equipment Rents +$8M (+4%) Depreciation & Amortization +$53M (+10%) $308 9% $196 5% $573 16% $1,283 36% $626 17% $605 17% Fuel +$210M (+53%) Compensation and benefits increased primarily due to higher health and welfare costs, wage inflation, and increased volumes partially offset by productivity improvements. Fuel increased due to significantly higher average fuel prices and increased volumes, partially offset by improved efficiency. Purchased Services -$12M (-2%) TOTAL OPERATING EXPENSES $3,591M CHANGE FROM $329M (+10%) Depreciation expense increased due to a larger depreciable asset base. 26


27 2017 Capital Investments 2017 Capital Commitment $3.4B 12% 3% 13% 72% Core Network and Related Assets Locomotive, Freight Car, and Other Equip $2.4 billion $440 million $410 million $100 million Expansion and Efficiency PTC Core Network & Related Assets Loco, Freight Car, & Other Equip Expansion & Efficiency Positive Train Control 27
28 Financial Management Shareholder Returns Flexible No target/minimum requirement Excess cash defined as cash after: Maintenance capital Expansion capital Liquidity Target Leverage Ranges 1 Adjusted Debt to EBITDAR less Maintenance Capital 3 to 4x EBITDAR less Maintenance Capital Interest Coverage 5 to 6x 1. Metrics are non-gaap. Please refer to the Appendix of this presentation for a Non-GAAP Reconciliation of the Adjusted Debt to EBITDAR less Maintenance Capital and EBITDAR less Maintenance Capital Interest Coverage pursuant to SEC Regulation G. 28
29 Cash Flow Summary Twelve Months Ended 3/31/ $ in Millions Cash From Operations 7,177 6,925 7,175 Investment/CapEx (3,710) (3,981) (5,827) Free Cash Flow 1 3,467 2,944 1,348 Shareholder Returns (2,375) (2,500) (4,000) Net Borrowings 1, ,629 Other (31) (13) (32) Change in cash 2, (55) Cash Balance 4,566 3,218 2,329 Credit Metrics (1)(2) Target Adjusted Debt to EBITDAR less x to 4x Maintenance Capital EBITDAR less Maintenance Capital x to 6x Interest Coverage 1. Free Cash Flow and Credit Metrics are non-gaap financial measures 2. Please refer to the Appendix of this presentation for a Non-GAAP Reconciliation of the Adjusted Debt to EBITDAR less Maintenance Capital and EBITDAR less Maintenance Capital Interest Coverage measures used on this page pursuant to SEC Regulation G. 29
30 Debt Maturities Scheduled Principal Payments As of March 31, 2017 $ in Millions $2,000 Amortizing Bullet $1,500 $1,000 $500 $ includes $500 million, 50-year Junior Subordinated Debt issued in 12/05 and callable 1/15/26. 30
31 BNSF Investor Relations Contact Please direct your questions to: Beth Miller Assistant Treasurer

32 Appendix BNSF reports its results in accordance with generally accepted accounting principles ( GAAP ). Management believes, however, that certain non-gaap financial measures used in the management of its business may provide users of the information with additional comparisons to publicly reported results. These non-gaap measures are used by management in the evaluation of the business and in making certain operating decisions. These non-gaap measures should not be considered a substitute for GAAP measures. 32
33 Reconciliation to GAAP Computation of Adjusted Debt to EBITDAR less Maintenance Capital and EBITDAR less Maintenance Capital Interest Coverage Twelve Months Ended 3/31/17 12/31/ /31/2015 Net Income $ 3,623 $ 3,569 $ 4,248 Add: Taxes 2,157 2,124 2,527 Add: Interest Expense Add: Other (Income) Expense - net (5) - 21 Operating Income $ 6,774 $ 6,685 $ 7,724 Add: Depreciation & Amort $ 2,181 $ 2,128 $ 2,001 Add: Rent Expense EBITDAR $ 9,534 $ 9,397 $ 10,330 Less: Replacement capital (2,506) (2,594) (2,944) Less: Locomotive Replacement (309) (363) (480) Adjusted EBITDAR $ 6,719 $ 6,440 $ 6,906 $ in Millions Debt (a) $ 23,241 $ 22,044 $ 21,737 Other adjustments (b) (1,277) 166 (925) Adjusted Debt $ 21,964 $ 22,210 $ 20,812 Adjusted Debt to EBITDAR less Maintenance Capital Adjusted EBITDAR $ 6,719 $ 6,440 $ 6,906 Interest Adjustments including interest portion of rent expense Adjusted Interest $ 1,191 $ 1,185 $ 1,130 EBITDAR less Maintenance Capital Interest Coverage (a) Debt was restated to reclassify debt issuance costs from other assets to long term debt with the adoption of ASU in Restatement period was December 2014 and (b) Primarily cash offset by long-term operating leases. 33
34 Operating & Financial Information Reports currently on BNSF website ( SEC filings Annual R-1 Report to the Surface Transportation Board Operating expenses, operating statistics, equipment inventories, maintenance information, etc. Weekly carload data Weekly, QTD & YTD volumes by major commodity group compared to same period last year 34
35
Burlington Northern Santa Fe, LLC
 Burlington Northern Santa Fe, LLC 2016 FIXED-INCOME INVESTOR CALL NOVEMBER 9, 2016 This presentation is intended to provide information to certain investors in Burlington Northern Santa Fe, LLC and BNSF
Burlington Northern Santa Fe, LLC
 Burlington Northern Santa Fe, LLC 2014 Fixed-Income Investor Call November 12, 2014 This presentation is intended to provide information to certain investors in Burlington Northern Santa Fe, LLC and BNSF
FORM 10-Q. BNSF RAILWAY COMPANY (Exact name of registrant as specified in its charter)
") (Mark One) UNITED STATES SECURITIES AND EXCHANGE COMMISSION WASHINGTON, D.C. 20549 FORM 10-Q QUARTERLY REPORT PURSUANT TO SECTION 13 OR 15(d) OF THE SECURITIES EXCHANGE ACT OF 1934 For the quarterly period
(Mark One) UNITED STATES SECURITIES AND EXCHANGE COMMISSION WASHINGTON, D.C. 20549 FORM 10-Q QUARTERLY REPORT PURSUANT TO SECTION 13 OR 15(d) OF THE SECURITIES EXCHANGE ACT OF 1934 For the quarterly period
BNSF Railway Company (Exact name of registrant as specified in its charter)
") UNITED STATES SECURITIES AND EXCHANGE COMMISSION WASHINGTON, D.C. 20549 FORM 8-K CURRENT REPORT Pursuant to Section 13 or 15(d) of The Securities Exchange Act of 1934 Date of Report (Date of earliest event
UNITED STATES SECURITIES AND EXCHANGE COMMISSION WASHINGTON, D.C. 20549 FORM 8-K CURRENT REPORT Pursuant to Section 13 or 15(d) of The Securities Exchange Act of 1934 Date of Report (Date of earliest event
Third Quarter 2014 Earnings Release
 Third Quarter Earnings Release October 23, Jack Koraleski, CEO 1 Third Quarter Record Results Positives Best-Ever Quarter Operating Revenue Operating Income Operating Ratio Earnings Franchise Diversity
Second Quarter 2016 Results
 July 21, 2016 Second Quarter 2016 Earnings Release Lance Fritz Chairman, President & CEO 1 Second Quarter 2016 Results Earnings Per Share Second Quarter $1.43 $1.38 Earnings Per Share -15% Down 15% $1.17
Cautionary Information
 September 6, Cowen & Company 10 th Annual Global Transportation Conference Rob Knight CFO 1 Cautionary Information This presentation and related materials contain statements about the Company s future
Fourth Quarter Earnings Release January 19, 2012
 Fourth Quarter Earnings Release January 19, 2012 Jim Young, Chairman & CEO 1 Union Pacific Achieves Milestones Positives Record Financial Results Achieved in 4 th Quarter and Full Year Employee Safety
1st Quarter 2009 Investors Report
 1st Quarter 2009 Investors Report BURLINGTON NORTHERN SANTA FE CORPORATION INVESTORS' REPORT - UNAUDITED 1 st Quarter 2009 INDEX Page Earnings Press Release 1-3 Consolidated Income Information 4 Consolidated
UNION PACIFIC REPORTS RECORD FOURTH QUARTER AND FULL YEAR EARNINGS Operating Ratio Improves to 79.6 percent. Fourth Quarter 2006 Highlights
 UNION PACIFIC REPORTS RECORD FOURTH QUARTER AND FULL YEAR EARNINGS Operating Ratio Improves to 79.6 percent FOR IMMEDIATE RELEASE: OMAHA, Neb., January 25, 2007 Fourth Quarter 2006 Highlights Record fourth
Cautionary Information
 November 29, 2017 Credit Suisse 5 th Annual Industrials Conference Rob Knight CFO 1 Cautionary Information This presentation and related materials contain statements about the Company s future that are
First Quarter 2017 Results
 April 27, 2017 First Quarter 2017 Earnings Release Lance Fritz Chairman, President & CEO 1 First Quarter 2017 Results Earnings Per Share First Quarter Operating Ratio First Quarter $1.16 +14% $1.32 First
Cautionary Information
 February 14, 2017 Stifel 2017 Transportation & Logistics Conference Rob Knight CFO 1 Cautionary Information This presentation and related materials contain statements about the Company s future that are
Cautionary Information
 March 8, 2017 Raymond James 38 th Annual Institutional Investors Conference Rob Knight CFO 1 Cautionary Information This presentation and related materials contain statements about the Company s future
Fourth Quarter 2012 Earnings Release
 Fourth Quarter Earnings Release January 24, 2013 Jack Koraleski, CEO 1 Union Pacific Achieves Milestones Positives Fourth Quarter and Full Year Financial Results Employee Safety Customer Satisfaction Franchise
Safe Harbor Statement
 Kansas City Southern Third Quarter 2014 Earnings Presentation October 17, 2014 Safe Harbor Statement This presentation contains forward-looking statements within the meaning of the securities laws concerning
J. P. Morgan Aviation, Transportation & Industrials Conference
 J. P. Morgan Aviation, Transportation & Industrials Conference Rob Knight, CFO March 11, 2014 1 Cautionary Information This presentation and related materials contain statements about the Corporation s
Fourth Quarter 2018 Results
 January 24, 2019 Fourth Quarter 2018 Earnings Release Lance Fritz Chairman, President & CEO 1 Fourth Quarter 2018 Results Earnings Per Share Fourth Quarter Operating Ratio Fourth Quarter $9.25 +39% $2.12
Kansas City Southern Reports Record Fourth Quarter and Full-Year 2017 Results
 KCS: Ashley Thorne, 816-983-1530, athorne@kcsouthern.com Fourth Quarter 2017 Results Kansas City Southern Reports Record Fourth Quarter and Full-Year 2017 Results Record fourth quarter revenues of $660
Union Pacific Reports All-Time Quarterly Records
 Union Pacific Reports All-Time Quarterly Records Diluted Earnings per Share up 21 Percent FOR IMMEDIATE RELEASE All-Time Quarterly Records Diluted earnings per share of $1.43 improved 21 percent. Operating
Cautionary Information
 February 13, 2018 Stifel Nicolaus Transportation & Logistics Conference Rob Knight CFO 1 Cautionary Information This presentation and related materials contain statements about the Company s future that
FORWARD LOOKING STATEMENTS
 FORWARD LOOKING STATEMENTS The following investor presentation contains certain forward-looking information within the meaning of applicable securities laws relating, but not limited, to Canadian Pacific
FORWARD LOOKING STATEMENTS
 FORWARD LOOKING STATEMENTS The following investor presentation contains certain forward-looking information within the meaning of applicable securities laws relating, but not limited, to Canadian Pacific
Media Contact: William H. Galligan Phone: 816/
 Media Contact: William H. Galligan Phone: 816/983-1551 bgalligan@kcsouthern.com Kansas City Southern Reports Record Fourth Quarter and Full-Year 2013 Revenues, Carloads and Operating Income Fourth Quarter
Kansas City Southern Reports Record First Quarter Results
 Kansas City Southern Reports Record First Quarter Results First Quarter 2018 Results Record first quarter revenues of $639 million, an increase of 5 from prior year on 1 volume growth Record first quarter
Union Pacific Reports Best-Ever Quarterly Results Diluted Earnings per Share up 13 Percent
 Union Pacific Reports Best-Ever Quarterly Results Diluted Earnings per Share up 13 Percent FOR IMMEDIATE RELEASE Best-Ever Quarterly Records Diluted earnings per share of $2.48 improved 13 percent. Operating
Kansas City Southern Reports Second Quarter 2016
 KCS: William H. Galligan, 816-983-1551, bgalligan@kcsouthern.com Second Quarter 2016 Results Kansas City Southern Reports Second Quarter 2016 Revenue of $569 million, a decrease of 3% from second quarter
FORWARD LOOKING STATEMENTS
 FORWARD LOOKING STATEMENTS The following investor presentation contains certain forward-looking information within the meaning of applicable securities laws relating, but not limited, to Canadian Pacific
Kansas City Southern Reports Record Fourth Quarter and Full-Year 2018 Results
 KCS: Ashley Thorne, 816-983-1530, athorne@kcsouthern.com Kansas City Southern Reports Record Fourth Quarter and Full-Year 2018 Results Fourth Quarter 2018 Results Record fourth quarter revenues of $694
Union Pacific Reports Record First Quarter Diluted Earnings per Share up 17 Percent
 Union Pacific Reports Record First Quarter Diluted Earnings per Share up 17 Percent FOR IMMEDIATE RELEASE First Quarter Records Diluted earnings per share of $2.38 improved 17 percent. Operating revenues
Kansas City Southern Reports Third Quarter Results
 Media Contact: William H. Galligan Phone: 816/983-1551 bgalligan@kcsouthern.com Third Quarter 2015 Results Kansas City Southern Reports Third Quarter Results Revenue of $632 million, a decrease of 7% compared
Kansas City Southern Reports Fourth Quarter and Full-Year 2016
 KCS: William H. Galligan, 816-983-1551, bgalligan@kcsouthern.com Fourth Quarter 2016 Results Kansas City Southern Reports Fourth Quarter and Full-Year 2016 Revenue of $599 million, unchanged from prior
3. FORWARD-LOOKING INFORMATION
 TABLE OF CONTENTS 1. BUSINESS PROFILE 1 2. STRATEGY 1 3. FORWARD-LOOKING INFORMATION 2 4. ADDITIONAL INFORMATION 2 5. FINANCIAL HIGHLIGHTS 3 6. OPERATING RESULTS 3 7. LINES OF BUSINESS 5 8. PERFORMANCE
First Quarter 2015 Financial Results April 20, 2015
 First Quarter 2015 Financial Results April 20, 2015 Forward-Looking Statements The financial results in this presentation were determined on the basis of U.S. GAAP. Please refer to the website www.cn.ca/nongaap
Cautionary Information
 March 13, 2018 JP J.P. MorganAviation Aviation, Transportation & Industrials Conference Rob Knight CFO 1 Cautionary Information This presentation and related materials contain statements about the Company
B a n k o f A m e r i c a M e r r i l l Ly n c h. May 16, 2013 Boston, MA. J i m Ve n a Executive Vice-President & Chief Operating Officer
 B a n k o f A m e r i c a M e r r i l l Ly n c h G lobal Tr ansportation Conference May 16, 2013 Boston, MA J i m Ve n a Executive Vice-President & Chief Operating Officer FORWARD-LOOKING STATEMENTS The
Bank of America Merrill Lynch 2014 Global Transportation Conference
 Bank of America Merrill Lynch 2014 Global Transportation Conference Rob Knight, CFO May 8, 2014 1 Cautionary Information This presentation and related materials contain statements about the Corporation
Second Quarter 2017 Financial Results. July 25, 2017
 Second Quarter 2017 Financial Results July 25, 2017 Forward-Looking Statements Certain statements included in this presentation constitute forward-looking statements within the meaning of the United States
2007 BB&T Transportation Conference
 2007 BB&T Transportation Conference February 15, 2007 Rob Knight, Chief Financial Officer Cautionary Information This press release and related materials contain statements about the Corporation s future
Union Pacific Reports All-Time Quarterly Records Third Quarter Diluted Earnings per Share up 23 Percent
 Union Pacific Reports All-Time Quarterly Records Third Quarter Diluted Earnings per Share up 23 Percent FOR IMMEDIATE RELEASE All-Time Quarterly Records Diluted earnings per share of $1.53 improved 23
Union Pacific Reports Fourth Quarter and Full Year 2015 Results
 NEWS RELEASE Union Pacific Reports Fourth Quarter and Full Year 2015 Results Fourth Quarter Operating Ratio of 63.2 percent FOR IMMEDIATE RELEASE Fourth Quarter Results Diluted earnings per share of $1.31
FORWARD-LOOKING STATEMENTS
 FORWARD-LOOKING STATEMENTS The following investor presentation contains certain forwardlooking information within the meaning of applicable securities laws relating, but not limited, to Canadian Pacific
UNION PACIFIC REPORTS RECORD FOURTH QUARTER AND FULL YEAR EARNINGS. Fourth Quarter 2007 Records. Operating revenue totaled $4.2 billion, up 6 percent.
 UNION PACIFIC REPORTS RECORD FOURTH QUARTER AND FULL YEAR EARNINGS FOR IMMEDIATE RELEASE: Fourth Quarter 2007 Records Operating revenue totaled $4.2 billion, up 6 percent. Operating income grew 7 percent
Cautionary Information
 May 17, 2016 Bank of America Merrill Lynch 2016 Transportation Conference Rob Knight CFO 1 Cautionary Information This presentation and related materials contain statements about the Company s future that
2017 Third Quarter Earnings Conference Call. October 25, 2017
 2017 Third Quarter Earnings Conference Call October 25, 2017 1 Forward-Looking Statements Certain statements in this presentation are forward-looking statements within the meaning of the safe harbor provision
January 25, Jim Young, President & CEO
 January 25, 2007 Jim Young, President & CEO Fourth Quarter Results Diluted Earnings per Share + 62% $1.78 Operating Income In Millions + 52% $810 $533 $1.10 2005 2006 2005 2006 2 Fourth Quarter Highlights
Diluted earnings per share of $1.98 increased 37 percent. Operating income totaled $2.1 billion, up 5 percent.
 NEWS RELEASE Union Pacific Reports Record Second Quarter Results Second Quarter Diluted Earnings per Share up 37 percent FOR IMMEDIATE RELEASE Second Quarter Results Diluted earnings per share of $1.98
CANADIAN PACIFIC ANNOUNCES 2008 RESULTS
 Release: Immediate, January 27, 2009 CANADIAN PACIFIC ANNOUNCES 2008 RESULTS CALGARY Canadian Pacific Railway Limited (TSX/NYSE: CP) announced its fourth-quarter and full-year 2008 results today. Net income
FORM 10-K BNSF RAILWAY COMPANY
 UNITED STATES SECURITIES AND EXCHANGE COMMISSION WASHINGTON, D.C. 20549 FORM 10-K [X] ANNUAL REPORT PURSUANT TO SECTION 13 OR 15(d) OF THE SECURITIES EXCHANGE ACT OF 1934 FOR THE FISCAL YEAR ENDED DECEMBER
UNION PACIFIC REPORTS RECORD FIRST QUARTER Diluted Earnings per Share up 39 Percent
 UNION PACIFIC REPORTS RECORD FIRST QUARTER Diluted Earnings per Share up 39 Percent FOR IMMEDIATE RELEASE First Quarter Records Diluted earnings per share of $1.79 improved 39 percent. Operating revenues
OLD DOMINION FREIGHT LINE REPORTS STRONG GROWTH IN THE THIRD QUARTER WITH INCREASES OF 20.6% IN REVENUE AND 28.6% IN EARNINGS TO $0
 Contact: J. Wes Frye Senior Vice President, Finance and Chief Financial Officer (336) 822-5305 OLD DOMINION FREIGHT LINE REPORTS STRONG GROWTH IN THE THIRD QUARTER WITH INCREASES OF 20.6% IN REVENUE AND
Union Pacific Reports Best-Ever Quarterly Results
 Union Pacific Reports Best-Ever Quarterly Results Diluted Earnings per Share up 13 Percent FOR IMMEDIATE RELEASE Best-Ever Quarterly Records Diluted earnings per share of $2.37 improved 13 percent. Operating
FOR IMMEDIATE RELEASE Contact: J. Wes Frye Senior Vice President, Finance and Chief Financial Officer (336)
") FOR IMMEDIATE RELEASE Contact: J. Wes Frye Senior Vice President, Finance and Chief Financial Officer (336) 822-5305 OLD DOMINION FREIGHT LINE REPORTS FOURTH-QUARTER EARNINGS OF $0.46 PER DILUTED SHARE
FOR IMMEDIATE RELEASE Contact: J. Wes Frye Senior Vice President, Finance and Chief Financial Officer (336) 822-5305 OLD DOMINION FREIGHT LINE REPORTS FOURTH-QUARTER EARNINGS OF $0.46 PER DILUTED SHARE
FORWARD LOOKING STATEMENTS
 FORWARD LOOKING STATEMENTS The following investor presentation contains certain forward-looking information within the meaning of applicable securities laws relating, but not limited, to Canadian Pacific
BAML 2012 Global Transportation Conference May 17, 2012
 BAML 2012 Global Transportation Conference May 17, 2012 Rob Knight, CFO 1 Cautionary Information This presentation and related materials contain statements about the Corporation s future that are not statements
Cautionary Information
 March 6, 2018 Raymond James 39 th Institutional Investors Conference Rob Knight CFO 1 Cautionary Information This presentation and related materials contain statements about the Company s future that are
First Quarter Earnings Release
 First Quarter Earnings Release April 19, 2007 Jim Young, Chairman and CEO First Quarter Results Diluted Earnings per Share Operating Income In Millions + 23% $1.41 + 19% $719 $1.15 $605 2006 2007 2006
UNION PACIFIC REPORTS RECORD QUARTERLY EARNINGS Best-Ever Operating Income and Sub-70 Operating Ratio. All-Time Quarterly Records
 UNION PACIFIC REPORTS RECORD QUARTERLY EARNINGS Best-Ever Operating Income and Sub-70 Operating Ratio FOR IMMEDIATE RELEASE All-Time Quarterly Records Diluted earnings per share improved 52 percent to
FORWARD LOOKING STATEMENTS
 FORWARD LOOKING STATEMENTS The following investor presentation contains certain forward-looking information within the meaning of applicable securities laws relating, but not limited, to Canadian Pacific
Second Quarter 2018 Earnings Call
 Second Quarter 2018 Earnings Call July 27, 2018 1 Forward-Looking Statements This presentation contains forward-looking statements regarding future events and the future performance of Genesee & Wyoming
UNION PACIFIC REPORTS THIRD QUARTER EARNINGS Sets Record Third Quarter Operating Ratio in Tough Economy. Third Quarter 2009 Highlights
 FOR IMMEDIATE RELEASE UNION PACIFIC REPORTS THIRD QUARTER EARNINGS Sets Record Third Quarter Operating Ratio in Tough Economy Third Quarter 2009 Highlights Operating income totaled $967 million, down 20
Cautionary Information
 March 9, 2016 Raymond James 37 th Annual Institutional Investors Conference Rob Knight CFO 1 Cautionary Information This presentation and related materials contain statements about the Company s future
Diluted earnings per share of $2.15 increased 43 percent. Operating ratio of 61.7 percent, flat with third quarter 2017 (see footnote 1).
.") NEWS RELEASE Union Pacific Reports Record Third Quarter Results Third Quarter Diluted Earnings per Share up 43 Percent FOR IMMEDIATE RELEASE Third Quarter Results Diluted earnings per share of $2.15 increased
NEWS RELEASE Union Pacific Reports Record Third Quarter Results Third Quarter Diluted Earnings per Share up 43 Percent FOR IMMEDIATE RELEASE Third Quarter Results Diluted earnings per share of $2.15 increased
Union Pacific Reports First Quarter Results First Quarter Diluted Earnings per Share up 9 Percent
 Union Pacific Reports First Quarter Results First Quarter Diluted Earnings per Share up 9 Percent FOR IMMEDIATE RELEASE First Quarter Results Diluted earnings per share of $1.30 improved 9 percent. Operating
FORWARD LOOKING STATEMENTS
 FORWARD LOOKING STATEMENTS The following investor presentation contains certain forward-looking information within the meaning of applicable securities laws relating, but not limited, to Canadian Pacific
Union Pacific Reports Fourth Quarter and Full Year 2017 Results
 NEWS RELEASE Union Pacific Reports Fourth Quarter and Full Year 2017 Results FOR IMMEDIATE RELEASE Omaha, Neb., January 25, 2018 Union Pacific Corporation (NYSE: UNP) today reported 2017 fourth quarter
In 2017, CP will continue to find opportunities to enhance the productivity, fluidity and safety of its operations.
 Release: Immediate January 18, 2017 CP reports record low operating ratio for fourth quarter and full year amid challenging conditions Calgary, AB - Canadian Pacific Railway Limited (TSX: CP) (NYSE: CP)
2018 FIRST QUARTER CSX EARNINGS CONFERENCE CALL
 2018 FIRST QUARTER CSX EARNINGS CONFERENCE CALL FORWARD LOOKING DISCLOSURE This information and other statements by the company may contain forward-looking statements within the meaning of the Private
OLD DOMINION FREIGHT LINE ANNOUNCES A 21.4% INCREASE IN SECOND-QUARTER EARNINGS PER DILUTED SHARE TO $1.19 ON REVENUE OF $839.
 Contact: Adam Satterfield Senior Vice President, Finance and Chief Financial Officer (336) 822-5721 OLD DOMINION FREIGHT LINE ANNOUNCES A 21.4% INCREASE IN SECOND-QUARTER EARNINGS PER DILUTED SHARE TO
OLD DOMINION FREIGHT LINE, INC. (Exact name of registrant as specified in its charter)
") x UNITED STATES SECURITIES AND EXCHANGE COMMISSION Washington, D.C. 20549 FORM 10-Q QUARTERLY REPORT PURSUANT TO SECTION 13 OR 15(d) OF THE SECURITIES EXCHANGE ACT OF 1934 For the quarterly period ended
x UNITED STATES SECURITIES AND EXCHANGE COMMISSION Washington, D.C. 20549 FORM 10-Q QUARTERLY REPORT PURSUANT TO SECTION 13 OR 15(d) OF THE SECURITIES EXCHANGE ACT OF 1934 For the quarterly period ended
BB&T Transportation Services Conference February 15, 2012
 BB&T Transportation Services Conference February 15, 2012 Rob Knight, CFO 1 Cautionary Information This presentation and related materials contain statements about the Corporation s future that are not
J.P. Morgan Aviation, Transportation & Defense Conference
 J.P. Morgan Aviation, Transportation & Defense Conference Rob Knight, CFO March 6, 2013 1 Cautionary Information This presentation and related materials contain statements about the Corporation s future
Kansas City Southern. Michael W. Upchurch Executive Vice President Finance & CFO. Raymond James Institutional Investors Conference March 7 th, 2016
 Kansas City Southern Michael W. Upchurch Executive Vice President Finance & CFO Raymond James Institutional Investors Conference March 7 th, 2016 Safe Harbor Statement This presentation contains forward-looking
Old Dominion Freight Line Reports 47.3% Increase in Fourth-Quarter Earnings Per Diluted Share to $0.81 on 21.7% Growth in Revenue
 February 5, 2015 Old Dominion Freight Line Reports 47.3% Increase in Fourth-Quarter Earnings Per Diluted Share to $0.81 on 21.7% Growth in Revenue Quarterly Operating Ratio Improves 260 Basis Points to
J.P. Morgan Transportation Conference March 13, 2012
 J.P. Morgan Transportation Conference March 13, 2012 Rob Knight, CFO 1 Cautionary Information This presentation and related materials contain statements about the Corporation s future that are not statements
Old Dominion Freight Line Increases Second- Quarter Revenue 23.0% to $1.03 Billion and Grows Earnings Per Diluted Share 67.2% to $1.
 July 26, 2018 Old Dominion Freight Line Increases Second- Quarter Revenue 23.0% to $1.03 Billion and Grows Earnings Per Diluted Share 67.2% to $1.99 Achieves Company Record Operating Ratio of 78.7% THOMASVILLE,
2016 Kansas City Southern KANSAS CITY SOUTHERN. Bank of America Merrill Lynch Transportation Conference
 KANSAS CITY SOUTHERN Bank of America Merrill Lynch Transportation Conference May 17, 2016 Safe Harbor Statement This presentation contains forward-looking statements within the meaning of the securities
UNION PACIFIC CORPORATION (Exact name of registrant as specified in its charter)
") UNITED STATES SECURITIES AND EXCHANGE COMMISSION Washington, D.C. 20549 FORM 8-K CURRENT REPORT Pursuant to Section 13 or 15(d) of the Securities Exchange Act of 1934 Date of Report (Date of earliest event
UNITED STATES SECURITIES AND EXCHANGE COMMISSION Washington, D.C. 20549 FORM 8-K CURRENT REPORT Pursuant to Section 13 or 15(d) of the Securities Exchange Act of 1934 Date of Report (Date of earliest event
OLD DOMINION FREIGHT LINE FIRST-QUARTER EARNINGS PER DILUTED SHARE INCREASE 12.8% TO $0.53
 Contact: J. Wes Frye Senior Vice President, Finance and Chief Financial Officer (336) 822-5305 OLD DOMINION FREIGHT LINE FIRST-QUARTER EARNINGS PER DILUTED SHARE INCREASE 12.8% TO $0.53 Reports 15.2% Growth
J.P. Morgan Aviation, Transportation & Industrials Conference
 J.P. Morgan Aviation, Transportation & Industrials Conference March 14, ALAN H. SHAW Executive Vice President and Chief Marketing Officer 1 Forward-Looking Statements Certain statements in this presentation
Old Dominion Freight Line Increases Third- Quarter Revenue 21.2% to $1.06 Billion and Grows Earnings Per Diluted Share 71.0% to $2.
 October 25, 2018 Old Dominion Freight Line Increases Third- Quarter Revenue 21.2 to $1.06 Billion and Grows Earnings Per Diluted Share 71.0 to $2.12 Achieves Company Record Operating Ratio of 78.4 THOMASVILLE,
OLD DOMINION FREIGHT LINE, INC.
 UNITED STATES SECURITIES AND EXCHANGE COMMISSION Washington, D.C. 20549 FORM 8-K CURRENT REPORT Pursuant to Section 13 or 15(d) of The Securities Exchange Act of 1934 Date of Report (Date of earliest event
Citi 2013 US and European Industrials Conference
 Citi 2013 US and European Industrials Conference Rob Knight, CFO September 18, 2013 1 Cautionary Information This presentation and related materials contain statements about the Corporation s future that
UNION PACIFIC REPORTS RECORD THIRD QUARTER EARNINGS
 UNION PACIFIC REPORTS RECORD THIRD QUARTER EARNINGS Operating Income Gains 34 Percent FOR IMMEDIATE RELEASE Omaha, Neb., October 18, 2007 Strong Results Marked by All Time Quarterly Records Operating revenue
Diluted earnings per share of $1.50 increased 10 percent. Operating income totaled $2.0 billion, up 3 percent.
 NEWS RELEASE Union Pacific Reports Third Quarter 2017 Results Third Quarter Diluted Earnings per Share up 10 percent FOR IMMEDIATE RELEASE Third Quarter Results Diluted earnings per share of $1.50 increased
Robert Pace CHAIRMAN OF THE BOARD
 Robert Pace CHAIRMAN OF THE BOARD Safety Briefing Jim Larmer SEPTEMBER 10, 2014 Kevin Timmerman APRIL 10, 2015 Notice of Meeting Scrutineers Report on Quorum Consolidated Financial Statements Election
UNION PACIFIC CORPORATION
 UNITED STATES SECURITIES AND EXCHANGE COMMISSION Washington, D.C. 20549 FORM 8-K CURRENT REPORT Pursuant to Section 13 or 15(d) of the Securities Exchange Act of 1934 Date of Report (Date of earliest event
UNION PACIFIC CORPORATION (Exact name of registrant as specified in its charter)
") UNITED STATES SECURITIES AND EXCHANGE COMMISSION Washington, D.C. 20549 FORM 8-K CURRENT REPORT Pursuant to Section 13 or 15(d) of the Securities Exchange Act of 1934 Date of Report (Date of earliest event
UNITED STATES SECURITIES AND EXCHANGE COMMISSION Washington, D.C. 20549 FORM 8-K CURRENT REPORT Pursuant to Section 13 or 15(d) of the Securities Exchange Act of 1934 Date of Report (Date of earliest event
CP reports record fourth-quarter and record full-year results on the strength of its operating model and disciplined approach in the marketplace
 Release: January 18, 2018 CP reports record fourth-quarter and record full-year results on the strength of its operating model and disciplined approach in the marketplace Calgary, AB - Canadian Pacific
Fourth Quarter 2017 Earnings Call
 Fourth Quarter 2017 Earnings Call February 8, 2018 1 Forward-Looking Statements This presentation contains forward-looking statements regarding future events and the future performance of that involve
UNION PACIFIC CORPORATION (Exact name of registrant as specified in its charter)
") UNITED STATES SECURITIES AND EXCHANGE COMMISSION Washington, D.C. 20549 FORM 8-K CURRENT REPORT Pursuant to Section 13 or 15(d) of the Securities Exchange Act of 1934 Date of Report (Date of earliest event
UNITED STATES SECURITIES AND EXCHANGE COMMISSION Washington, D.C. 20549 FORM 8-K CURRENT REPORT Pursuant to Section 13 or 15(d) of the Securities Exchange Act of 1934 Date of Report (Date of earliest event
INVESTING for the LONG HAUL 2018 QUARTERLY REVIEW FOURTH QUARTER
 INVESTING for the LONG HAUL 4 2018 QUARTERLY REVIEW FOURTH QUARTER North America s Railroad NEWS RELEASE CN building strong momentum into 2019 Q4 results driven by solid top-line growth and significantly
Driving Efficiency. November Toronto Ontario
 Driving Efficiency November 13 2008 Toronto Ontario 2008 CP April Investor 22, 2008 Day Forward looking statements The following investor presentation may contain forward-looking statements within the
Diluted earnings per share of $1.68 increased 27 percent. Operating income totaled $1.9 billion, up 8 percent.
 NEWS RELEASE Union Pacific Reports Record First Quarter Results First Quarter Diluted Earnings per Share up 27 percent FOR IMMEDIATE RELEASE First Quarter Results Diluted earnings per share of $1.68 increased
Q EARNINGS REVIEW OCTOBER
 Q3 2014 EARNINGS REVIEW OCTOBER 21, 2014 FORWARD LOOKING STATEMENTS The following investor presentation contains certain forward-looking information within the meaning of applicable securities laws relating,
Cautionary Information
 November 29, 2018 Credit Suisse 6 th Annual Industrials Conference Rob Knight Chief Financial Officer 1 Cautionary Information This presentation and related materials contain statements about the Company
UNION PACIFIC CORPORATION (Exact name of registrant as specified in its charter)
") UNITED STATES SECURITIES AND EXCHANGE COMMISSION Washington, D.C. 20549 FORM 8-K CURRENT REPORT Pursuant to Section 13 or 15(d) of the Securities Exchange Act of 1934 Date of Report (Date of earliest event
UNITED STATES SECURITIES AND EXCHANGE COMMISSION Washington, D.C. 20549 FORM 8-K CURRENT REPORT Pursuant to Section 13 or 15(d) of the Securities Exchange Act of 1934 Date of Report (Date of earliest event
2018 FOURTH QUARTER EARNINGS CONFERENCE CALL. James M. Foote President and Chief Executive Officer
 2018 FOURTH QUARTER EARNINGS CONFERENCE CALL James M. Foote President and Chief Executive Officer FORWARD LOOKING DISCLOSURE This information and other statements by the company may contain forwardlooking
4 th Quarter 2017 Earnings Supplement. February 6, 2018
 4 th Quarter 2017 Earnings Supplement February 6, 2018 Disclaimer This presentation contains statements, estimates and projections which are forward-looking statements (as defined in Section 21E of the
Veritiv Corporation Second Quarter 2016 Financial Results August 9, 2016
 Veritiv Corporation Second Quarter 2016 Financial Results August 9, 2016 Tom Morabito Director of Investor Relations 2 Safe Harbor Provision Certain statements contained in this presentation regarding