9M16 results presentation
|
|
|
- Arthur George
- 6 years ago
- Views:
Transcription

")
1 9M16 results presentation (January September) Madrid, October 26 th 2016

2 9M16 HIGLIGHTS 9M16 FINANCIALS 9M16 AUDIENCE SHARE 24h total individuals Million 9M16 9M15 Var. Total net revenues 711,7 674,7 5,5% Total operating costs 527,2 530,3-0,6% EBITDA adj* 184,4 144,4 27,8% EBITDA margin 25,9% 21,4% EBIT 170,7 131,4 29,9% EBIT margin 24,0% 19,5% Atresmedia TVE FORTA PayTV Others 9M16 ADVERTISING MARKET SHARE NET PROFIT 131,8 113,8 15,8% EPS adjusted** 0,39 0,32 0,07 Free Cash Flow 183,0 161,7 21,3 Net cash position 118,4 205,7 * EBITDA Adj, includes TV rights consumption ** Adjusted excluding the treasury stocks owned at September 30 th Atresmedia Source: Kantar media and Infoadex FORTA PayTV Others 2
3 Broadcasting
: 87% of")

 3,2 48% 52% Pay TV (linear) 16 Pay TV")
 Internet video")
4 9M16 audiovisual consumption Total audio-visual consumption (average minutes per person): 87% of consumption is Free TV (Linear+Non-Linear+OTT) Total TV consumption by age groups: Minutes per day 9M16 TOTAL 247 Free TV (linear) 211 Free TV (nonlinear) 3,2 48% 52% Pay TV (linear) 16 Pay TV (nonlinear) 1,3 Source: Kantar media and ComScore (does not include mobile phones) Internet video 15,7 4


5 Spanish millennials (21-36 years old) Spanish population Audience YTD* 8,9 million people 63,4% of them watch TV everyday Telecinco Antena3 Pay TV Cuatro Total TV consumption: 160minutes La Sexta La 1 Weekly viewing trends* Monday Tuersday Wednesday Thursday Friday Saturday Sunday 2h30 7h00 20,7% 20,6% 20,2% 20,0% 20,3% 21,1% 20,7% 7h00 14h00 13,8% 13,7% 13,6% 13,6% 13,5% 14,3% 13,7% 14h00 17h00 13,8% 13,4% 13,6% 13,5% 13,6% 13,9% 13,7% 17h00 20h30 11,8% 11,6% 11,8% 11,9% 12,0% 12,3% 13,1% 20h30 24h00 14,2% 14,2% 14,2% 13,9% 12,8% 12,3% 14,6% 24h00 2h30 17,9% 17,7% 17,8% 17,5% 16,3% 15,4% 17,6% Source: Kantar media and Barlovento Comunicación *Average audience January 1 st October 18 th 5
6 2016 audience* Mediaset España and its main channel Telecinco lead 24h audience Total individuals Audience share YTD* per groups Audience share per channel 17,1 13,9 13,6 14,7 14,7 13,1 12,8 15,4 13,0 15,1 13,4 11,9 14,7 12,1 12,3 11,8 14,1 12,3 14,6-0,2 13,9 Antena3 12,8 12,7-0,7 Vs. 2015* PayTV -0,9 +0,5 0,0-0,2 +0,3 Others +0,3 10,1 10,2 9,9 10,0 10,2 9,5 9,5 JAN 16 FEB 16 MAR 16 APR 16 MAY 16 JUN 16 JUL 16 AUG 16 SEP 16 OCT 16* YEAR 2016* 10,5 9,4 10,4 10,0 La1 +0,2 Vs. 2015* Source: Kantar media *Average audience January 1 st October 24 th 6
7 Audience share per channel 2016 audience* Telecinco: 26 consecutive months leading 17,1 24h audience Total individuals 15,2 14,6 14,2 14,2 13,5 13,6 13,7 13,6 13,8 13,3 13,8 13,0 15,4 15,3 14,8 13,2 13,4 13,9 15,4 15,2 14,9 15,1 15,1 14,6 14,4 14,0 14,3 13,9 13,2 13,0 13,1 13,4 13,4 13,6 12,6 13,0 15,4 15,1 14,7 14,7 13,4 13,1 13,0 12,8 14,7 12,3 11,9 12,1 11,8 14,1 13,9 12,3 12,8 Antena3 9,3 10,0 9,9 10,0 10,4 10,4 10,2 10,0 9,9 9,9 9,7 9,0 9,0 9,7 10,0 9,7 10,2 10,1 10,2 9,9 10,0 10,2 9,5 9,5 10,5 9,4 10,4 La1 Source: Kantar media *Average audience August 1 st 2014 October 24 th

8 2016: a new HD adventure Mediaset España runs 7 channels MES group of channels targeting Targeted channels audience share 2016 YTD* Total individuais Core target Factoria de Ficcion 3,2% 8,8% Divinity 2,4% 3,6% Energy 1,8% 2,0% Boing 1,5% 12,6% Be Mad** 0,5% 0,9% Source: Kantar media * Average audience January 1 st October 24 th ** Average audience April 22 nd October 24 th ª average 2016 (1/1-24/10/16) commercial target (16-59Y) audience TOTAL targeted channels 9,2% 10,2%ª 8


9 Leaders among all age groups (in particular millennials) Prime time (22h30 0h30) 9M16* audience Mediaset España 9M16* audience Total individuals Monday Tuesday Wednesday Thursday Friday Saturday Sunday 13-24Y Monday Tuesday Wednesday Thursday Friday Saturday Sunday 25-34Y Monday Tuesday Wednesday Thursday Friday Saturday Sunday Source: Kantar media * Average audience January 1 st September 30 th 2016 TI: Total individuals TC: Target commercial years old 9

 6,2m 5 Zipi y Zape 2,4m Historic Spanish")


10 Cinema 2016: another outstanding year 1 A monster calls 17,2m* 2 Cien años de perdón 6,7m 3 Cuerpo de élite 6,5m* YTD* box-office results Ranking of the 2016 most successful Spanish movies KIKI, el amor se hace Gross Box office ( ) 6,2m 5 Zipi y Zape 2,4m Historic Spanish box-office results Gross Box office ( ) Year 1 8 apellidos 57,7m 2014 vascos 2 The Imposible 42,3m apellidos 36,2m 2015 catalanes 4 Los Otros 27,2m The Orphanage 25,0m 2007 Million Source: Rentrak as of October 26 th 2016; only movies released in 2016; *movies actually in the theatres 10


11 Internet September 2016: the beginning of the new season Total videos viewed (million) Total pages viewed (million) Average number of visits per user 11
12 Internet September 16: Mediaset España has the most loyal unique viewers Video views ranking per media company Total minutes (million) Minutes per unique viewer h21minutes per person: our best record Average time spent ranking per media company Total minutes (million) Average minutes per unique viewer Source: ComsCore and Omniture Data: average September
13 Advertising


 Television* Internet Radio")

14 9M16 Total advertising market Advertising market evolution Market share per media Outdoor Cinema Radio Internet Television +1,2pp Printed media Performance by media 9M16 vs. 9M15 (m ) Television* Internet Radio Cinema Outdoor Million Source: Infoadex Internet data only includes graphic formats Printed media * FreeTV: +87,1m 14
15 Total TV advertising market Total TV investment quarterly evolution * 9M16: +6,4% * vs. same period of the previous year Source: Infoadex 15


 C/GRP s 9M16 30.5% -2.6% +16.4% +3.")

16 9M16 Mediaset España advertising revenues & share Own media s advertising revenues TV Advertising market share 670,0 626,5 Others TV Commercial strategy Audience Var % Seconds GRP (20 ) C/GRP s 9M % -2.6% +16.4% +3.3% +3.6% Million 3Q % -2.3% +22.2% +1.0% +1.2% Source: Infoadex, Kantar media and Publiespaña 16
17 advertising market share by quarters Quarter by quarter Mediaset España increases the gap vs its main competitor Source: Infoadex * During 2 nd and 3 rd quarter 2014, Mediaset España broadcasted the Football World Cup 17

 Automotive Finance Retail Telecoms")

18 9M16 TV advertising market by sectors Sector breakdown (% on total adv. Sales) Sector growth (%) (9M16 vs. 9M15) Automotive Finance Retail Telecoms Automotive Others Retail Health & Beauty Food Others Food Telecoms Finance Health & Beauty 9M16 TV market evolution: +6.4% Source: Infoadex 18

19 Financial results
20 9M16 consolidated financial results Growing margins and profitability EBIT margin* Million 9M16 9M15 VAR % +29,9% Net advertising revenues 667,1 634,5 5,1% Other revenues 44,6 40,2 10,8% Total net revenues 711,7 674,7 5,5% Total operating costs 527,2 530,3-0,6% Personnel 78,0 78,1-0,2% TV rights amortisation 131,8 131,4 0,3% Other operating costs 317,4 320,8-1,0% EBITDA adj (1) 184,4 144,4 27,8% PPA Amortisations 6,0 6,0 - Amortisations & depreciations 7,8 7,0 11,8% EBIT 170,7 131,4 29,9% Pre-Tax profit 168,3 147,2 14,4% Net profit reported 131,8 113,8 15,8% EPS* 0,39 0,32 21,3% EBITDA adj/ Total net revenues 25,9% 21,4% +4,5pp EBIT/ Total net revenues 24,0% 19,5% +4,5pp NET PROFIT Reported/ Total net revenues 18,5% 16,9% +1,7pp * EBIT/Total net revenues Net profit +15,8% ** ** (1) Recurring EBITDA Adj, includes TV rights consumption * Adjusted excluding the treasury stocks owned as of September 30 th ** EPS ( ) adjusted excluding treasury stocks as of Sept. 30 th 20
21 Total net revenues 2 nd best reported result since 2009 Million 21
22 Cost management 175m savings in 6Y (-25%) Million **Pro-forma consolidated P&L accounts under IFRS of Mediaset España s Group and Sogecuatro s Group 22


23 A growth story: 9M Steadily achieving pre-crisis levels 3Q EBITDA margin* 9M EBITDA margin* Average: 5,3% Average: 17,0% * EBITDA/Total net revenues 23
24 EBITDA margin* A growth story: Steadily reaching pre-crisis levels Average: 16,2% * EBITDA/Total net revenues 24
25 A growth story: 9M Steadily moving towards pre-crisis levels 9M Net profit Average: 65,1m Million 25

26 9M16 Consolidated cash flow High free cash flow generation Million Diff. in 9M16 9M15 million Initial cash position 192,4 265,7-73,3 Free cash flow 183,0 161,7 21,3 Cash flow from operations 299,9 278,7 21,2 The golden rule of MES: Free cash flow conversion 95,8% 112,0% 99,2% Net investments -158,6-150,3-8,3 Change in net working capital 41,7 33,3 8,4 Change in equity 1,5 0,9 0,6 Financial Investments -92,7-177,2 84,5 Dividends received 1,7 2,1-0,4 Dividend payments -167,4-47,5-119,9 Total net cash flow -74,0-60,0-14,0 Final net cash position 118,4 205,7-87,3 FCF: 183,0m 192,4 375,4 Million Free cash flow/ebit 107,2% 123,1% Million 26


27 Net investments Million 9M16: M15:


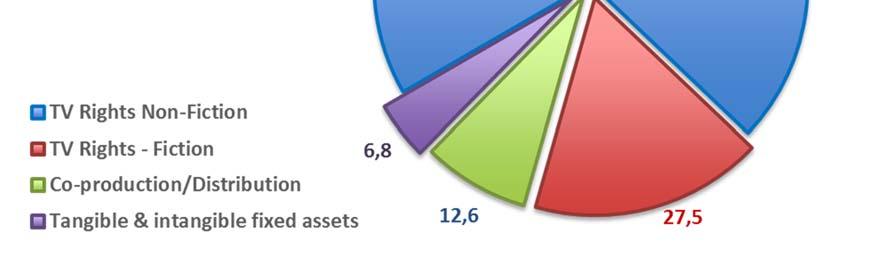
28 Balance sheet Solid balance and high shareholder s remuneration Million 9M16 FY 2015 Fixed assets 573,7 581,1 -Financial 317,0 317,8 -Non financial 256,7 263,3 Audiovisual rights and pre-payments 220,6 201,2 -TV, third party rights 170,4 163,8 -TV, Spanish fiction rights 28,3 22,8 -Co-production / distribution 21,9 14,6 Tax credit 111,8 134,5 TOTAL NON-CURRENT ASSETS 906,1 916,9 286,3 258,8 Current assets 201,9 257,7 Financial investments and cash 134,6 211,6 TOTAL CURRENT ASSETS 336,4 469,3 TOTAL ASSETS 1.242, ,2 SHAREHOLDERS' EQUITY 944, ,9 Non-current provisions 9,3 10,4 Non-current payables 8,8 8,5 Non-current financial liabilities 13,0 7,5 TOTAL NON-CURRENT LIABILITIES 31,1 26,4 Current payables 264,1 278,2 Current financial liabilities 3,2 11,6 TOTAL CURRENT LIABILITIES 267,3 289,8 TOTAL LIABILITIES 1.242, ,2 28

29 Back-up
30 9M16 consolidated P&L account (I) Million 9M16 9M15 Var % EBITDA margin* Gross Advertising Revenues 693,0 659,2 5,1% - Mediaset España's medias 670,0 626,5 6,9% - Third party's medias 22,9 32,7-29,9% Commission -25,9-24,8 4,3% Net Advertising revenues 667,1 634,5 5,1% Other Revenues 44,6 40,2 10,8% TOTAL NET REVENUES 711,7 674,7 5,5% +27.8% Personnel 78,0 78,1-0,2% TV Rights amortisation 131,8 131,4 0,3% Other operating costs 317,4 320,8-1,0% Total operating costs (1) 527,2 530,3-0,6% EBITDA adj* 184,4 144,4 27,8% EBITDA adj*/net REVENUES 25,9% 21,4% +4,5pp * EBITDA adj./total net revenues * EBITDA Adj, includes TV rights consumption 30
31 9M16 consolidated P&L account (II) Million 9M16 9M15 Var % EBITDA adj* 184,4 144,4 27,8% PPA amortisation (2) 6,0 6,0 0,0% Depreciation tangible assets & provisions (3) 7,8 7,0 11,8% Total Costs (1+2+3) 541,0 543,3-0,4% EBIT 170,7 131,4 29,9% EBIT/NET REVENUES 24,0% 19,5% +4,5pp EBIT margin* +29,9% Equity consolidated results -1,7 15,7 Financial results -0,7 0,0 EBT 168,3 147,2 14,4% Income taxes -36,7-33,6 9,3% Minority interest 0,2 0,2-0,4% NET PROFIT 131,8 113,8 15,8% EPS 0,39 0,32 21,3% NET PROFIT/NET REVENUES 18,5% 16,9% +1,7pp * EBIT/Total net revenues * EBITDA Adj, includes TV rights consumption ** adjusted excluding the treasury stocks owned at September 30 th 31
32 The virtuous circle of Mediaset España **Pro-forma consolidated P&L accounts under IFRS of Mediaset España s Group and Sogecuatro s Group Source: Kantar media (24h total individual audience share) and Infoadex Million 32


33 3Q16 consolidated P&L account (I) Million 3Q16 3Q15 Total costs -3,3% Gross Advertising Revenues 185,0 186,0 - Mediaset España's medias 178,8 176,8 - Third party's medias 6,2 9,3 Discounts -7,0-5,5 Net Advertising revenues 178,0 180,5 Other Revenues 12,1 15,6 TOTAL NET REVENUES 190,1 196,1 Personnel 26,1 27,0 TV Rights Amortisation 39,3 47,4 Other Operating Costs 100,4 97,0 Total costs (1) 165,7 171,3 EBITDA adj* 24,4 24,8 EBITDA adj*/net revenues 12,9% 12,7% EBITDA adj. margin* * EBITDA Adj, includes TV rights consumption * EBITDA adj./total net revenues 33
34 3Q16 consolidated P&L account (II) Million 3Q16 3Q15 EBITDA adj* 24,4 24,8 PPA amortisation (2) 2,0 2,0 Depreciation tangible assets & provisions (3) 1,9 2,4 Total Costs (1+2+3) 169,6 175,7 EBIT 20,5 20,4 EBIT/Net revenues 10,8% 10,4% EBIT margin* Equity Consolidated Results -2,6-0,5 Financial results -0,3-0,3 EBT 17,6 19,7 Income Taxes -3,6-3,7 Minority Interest 0,1 0,0 NET PROFIT 14,1 16,0 EPS Adjusted** 0,04 0,05 NET PROFIT/NET REVENUES 7,4% 8,2% * EBIT/Total net revenues * EBITDA Adj, includes TV rights consumption ** adjusted excluding the treasury stocks owned at September 30 th 34
35 Execution of Buyback plans Year 2014 Milestones Treasury shares and market acquisition Shares n. Average price Total 34,583, M 2015 Market acquisition 25,597, M 2016 Market acquisition 9,963, M TOTAL 70,143, M Year Milestones Shares n. Total investment in treasury shares: 689.9M (vs. 650M plan announced) Value as of cancelation date*: M Shareholders structure after April 13 th 2016 Pre 2015 Existing shares 406,861, Shares cancelled at the AGM on April 15 th 2015 (40,686,142) 49,79% 2016 Shares cancelled at the AGM on April 13 th 2016 (29,457,794) 50,21% New share count Cancelation of 70,143,936 shares 336,717,490 0,00% Mediaset SpA Treasury shares Free float * Cancellation date: date of the corresponding AGM (April 13 th 2016 and April 15 th 2015) 35
36 2016 audience 24h total individuals YTD* 33,7 17,1 Total day (24h) 29,0 29,3 28,1 28,1 30,1 30,7 30,7 27,4 27,5 27,0 26,2 31,4 25,8 29,5 25,4 30,3 26,9 29,9 27,4 30,4 27,0 13,9 13,6 14,7 14,7 13,1 12,8 15,4 13,0 15,1 13,4 11,9 14,7 12,1 12,3 11,8 14,1 12,3 13,9 14,6 12,8 12,7 Antena3 16,7 16,6 16,6 16,5 17,0 16,0 17,1 19,7 16,1 16,5 16,8 JAN 16 FEB 16 MAR 16 APR 16 MAY 16 JUN 16 JUL 16 AUG 16 SEP 16 OCT 16* YEAR 2016* 10,1 10,2 10,5 10,4 10,2 9,9 10,0 10,0 9,5 9,5 9,4 JAN 16 FEB 16 MAR 16 APR 16 MAY 16 JUN 16 JUL 16 AUG 16 SEP 16 OCT 16* YEAR 2016* 21,0 La1 7,7 7,3 6,6 8,0 6,5 7,6 7,4 6,9 7,5 6,7 7,4 6,9 6,6 7,2 6,9 JAN 16 FEB 16 MAR 16 APR 16 MAY 16 JUN 16 JUL 16 AUG 16 SEP 16 OCT 16* YEAR 2016* 7,1 6,8 6,3 6,8 6,7 5,9 7,2 7,0 6,4 7,5 7,3 6,5 7,4 7,1 6,6 La Sexta 14,4 13,6 14,9 13,1 11,5 11,7 15,2 13,6 10,8 10,7 16,0 16,2 14,2 14,8 11,3 11,4 18,0 11,8 9,8 10,0 12,5 11,5 10,8 14,3 14,1 12,3 10,3 12,2 15,7 13,3 13,1 JAN 16 FEB 16 MAR 16 APR 16 MAY 16 JUN 16 JUL 16 AUG 16 SEP 16 OCT 16* YEAR 2016* Prime time (20h30-00h) 10,9 Antena3 La1 Source: Kantar media; * Audience average: 1/1-24/10/16 36
37 8,6 8,2 8,5 8, audience 24h total individuals YTD* 9,1 9,7 9,9 10,4 9,8 9,6 9,2 3,1 2,8 3,0 3,0 3,1 3,4 3,5 3,6 3,4 3,3 3,2 7,2 7,1 7,2 1,9 1,7 1,8 1,7 1,8 6,9 6,7 1,9 1,7 1,7 7,1 7,4 7,6 7,6 JAN 16 FEB 16 MAR 16 APR 16 MAY 16 JUN 16 JUL 16 AUG 16 SEP 16 OCT 16* YEAR 2016* 7,2 7,1 Neox Nova Mega A3series 2,1 1,8 1,9 1,8 1,8 1,9 2,0 1,8 1,8 1,8 Mega 2,6 2,5 2,5 2,5 2,4 2,4 2,3 2,3 2,3 2,3 2,3 2,3 2,2 2,2 2,1 2,1 2,1 2,0 2,0 2,6 2,5 2,4 2,4 2,4 2,4 Neox 2,3 2,2 2,2 Nova JAN 16 FEB 16 MAR 16 APR 16 MAY 16 JUN 16 JUL 16 AUG 16 SEP 16 OCT 16* YEAR 2016* 2,2 2,2 2,3 2,2 2,2 2,5 2,6 2,4 2,2 2,1 2,3 Clan 0,7 0,7 0,8 0,8 0,7 0,7 0,7 0,5 0,5 0,5 0,1 0,9 0,7 0,8 0,8 0,7 0,5 0,7 0,3 AtresSeries 1,5 1,2 1,4 1,4 1,4 1,4 1,1 1,0 1,1 1,0 1,6 1,1 1,7 1,2 1,5 1,4 1,2 1,2 1,3 1,5 1,1 1,1 Disney JAN 16 FEB 16 MAR 16 APR 16 MAY 16 JUN 16 JUL 16 AUG 16 SEP 16 OCT 16* Source: Kantar media * Audience average: 1/1-24/10/16 YEAR 2016* JAN 16 FEB 16 MAR 16 APR 16 MAY 16 JUN 16 JUL 16 AUG 16 SEP 16 OCT 16* YEAR 2016* 37


38 2016 audience, multichannel strategy 24h total individuals & core target audience YTD* FdF: young adult s channel Divinity: ladies' channel Boing: children s channel Be Mad: HD channel Energy: men s channel Source: Kantar media * Audience average: 1/1-24/10/16 38
39 9M16 Group s programming mix In-house production vs. library in terms of broadcasted hours * In-house production Third party rights * Broadcasting since April 21 st


40 9M16 Telecinco s programming mix In-house production vs. library in terms of broadcasted hours Production with independent companies (9M15: 46.3%) Produced by Mediaset España (9M15: 24.2%) Production with participated companies: (9M15: 29.5%) 9M15 La fábrica de la tele Mandarina Super sport 9M16 40
41 Disclaimer Investor Relations Department Phone: Fax: inversores@mediaset.es WEB: Statements contained in this document, particularly the ones regarding any Mediaset España possible or assumed future performance, are or may be forward looking statements and in this respect they involve some risks and uncertainties. Mediaset España actual results and developments may differ materially from the ones expressed or implied by the above statements depending on a variety of factors. Any reference to past performance of Mediaset España shall not be taken as an indication of future performance. The content of this document is not, and shall not be considered as, an offer document or an offer or solicitation to subscribe for, buy or sell any stock. The shares of Mediaset España may not be offered or sold in the United States of America except pursuant to an effective registration statement under the U.S. Securities Act of 1933, as amended, or pursuant to a valid exemption from registration 41

")
42 9M16 results presentation (January September) Madrid, October 26 th 2016
Better together! 1Q18 Results presentation. (January- March) Madrid, April 19 th 2018
 Madrid, April 19 th 2018") Better together! 1Q18 Results presentation (January- March) Madrid, April 19 th 2018 MEDIASET ESPAÑA 1Q18 RESULTS AT A GLANCE Million 1Q18 FINANCIALS 1Q18 1Q17 1Q18 AUDIENCE SHARE 24h total individuals
Better together! 1Q18 Results presentation (January- March) Madrid, April 19 th 2018 MEDIASET ESPAÑA 1Q18 RESULTS AT A GLANCE Million 1Q18 FINANCIALS 1Q18 1Q17 1Q18 AUDIENCE SHARE 24h total individuals
1H14 financials. 1H14 audience share. 1H14 market share. 24h Total individuals. 1H14 1H13 Var. +1.4pp. Millions
 1H14 financials 1H14 audience share +1.4pp 24h Total individuals Millions 1H14 1H13 Var. Total net revenues 468,0 427,0 9,6% Total operating costs 379,9 371,5 2,3% EBITDA adj* 88,1 55,5 58,6% EBITDA margin
1Q14 financials. 1Q14 audience share. 1Q14 market share. 24h Total individuals. +1.1pp. Millions. 1Q14 1Q13 Var.
 1Q14 financials 1Q14 audience share +1.1pp 24h Total individuals Millions 1Q14 1Q13 Var. Total net revenues 200,4 196,6 1,9% Total operating costs 173,5 173,5 0,0% EBITDA adj* 26,9 23,1 16,7% EBITDA margin
1Q13 24h Audience share. 1Q13 financials. 1Q13 TV Advertising market share. 1Q13 1Q12 Var.
 1Q13 24h Audience share 1Q13 financials Millions 1Q13 1Q12 Var. Total net revenues 196,6 218,0-9,8% Total operating costs 173,5 193,6-10,4% EBITDA adj* 23,1 24,4-5,5% EBITDA margin 11,7% 11,2% EBIT 18,8
First half 2017 results presentation (January-June 2017) Madrid, July 26 th 2017
 Madrid, July 26 th 2017") First half 2017 results presentation (January-June 2017) Madrid, July 26 th 2017 MEDIASET ESPAÑA 1H17 RESULTS AT A GLANCE Million 1H17 AUDIENCE SHARE 1H17 FINANCIALS 24h total individuals 1H17 1H16 Var.
First half 2017 results presentation (January-June 2017) Madrid, July 26 th 2017 MEDIASET ESPAÑA 1H17 RESULTS AT A GLANCE Million 1H17 AUDIENCE SHARE 1H17 FINANCIALS 24h total individuals 1H17 1H16 Var.
1Q14 financials. 1Q14 audience share. 1Q14 market share. 24h Total individuals. +1.1pp. Millions. 1Q14 1Q13 Var.
 1Q14 financials 1Q14 audience share +1.1pp 24h Total individuals Millions 1Q14 1Q13 Var. Total net revenues 200,4 196,6 1,9% Total operating costs 173,5 173,5 0,0% EBITDA adj* 26,9 23,1 16,7% EBITDA margin
9 months 2017 results presentation
 Better together! 9 months 2017 results presentation Madrid, October 18 th 2017 MEDIASET ESPAÑA 9M17 RESULTS AT A GLANCE Million 9M17 AUDIENCE SHARE 9M17 FINANCIALS 24h total individuals 9M17 9M16 Var.
FY12 24h Audience share. FY12 financials. FY12 TV Advertising market share. FY12 FY11 Var % Others
 FY12 24h Audience share FY12 financials Millions FY12 FY11 Var % TOTAL NET REVENUES 886,7 1.009,3-12,1% Total operating costs 821,8 816,5 0,7% Recurring EBITDA adj* 64,9 192,9-66,3% Recurring EBITDA margin
GESTEVISION TELECINCO S.A.
 GESTEVISION TELECINCO S.A. SPAIN WINS ON TELECINCO COMPANY PRESENTATION Deutsche Bank European TMT Conference London, September 9-10 th 2010 1 GROUP ( million) 1H10 1H09 VAR. % Total Net Revenues ( mn)
January September 2015
 FIIRST NIINE MONTHS RESULTS January September 2015 Madrid 28th October, 2015 CONTENTS: Financial and operating highlights 1) Profit and loss account 2) Cash flow generation 3) Summary balance sheet 4)
January June Madrid July 29 th, 2015 CONTENTS:
 FIIRST HALF RESULTS January June 2015 Madrid July 29 th, 2015 CONTENTS: Financial and operating highlights 1. Profit and loss account 2. Cash flow generation 3. Summary balance sheet 4. Audience share
2007 FIRST HALF RESULTS (January- June)
") G E S T E V I S I Ó N T E L E C I N C O S. A. 26th July 2007 2007 FIRST HALF RESULTS (January- June) 1 First Half 2007, Leadership in Audience, Advertising and Profitability 1H06 1H07 Var. % Audience Share,
G E S T E V I S I Ó N T E L E C I N C O S. A. 26th July 2007 2007 FIRST HALF RESULTS (January- June) 1 First Half 2007, Leadership in Audience, Advertising and Profitability 1H06 1H07 Var. % Audience Share,
FULL YEAR RESULTS January December 2013
 FULL YEAR RESULTS January December 2013 Madrid - February 27 th, 2013 CONTENTS: Financial and operating highlights 1. Profit and loss account 2. Cash flow generation 3. Summary balance sheet 4. Audience
G E S T E V I S I Ó N T E L E C I N C O S. A First quarter results (January March) Madrid, May 8 th
 Madrid, May 8 th") G E S T E V I S I Ó N T E L E C I N C O S. A. 2008 First quarter results (January March) Madrid, May 8 th 2008 1 Leadership in Audience, Advertising and Profitability 1T 08 1T 07 VAR. % Total Net Revenues
G E S T E V I S I Ó N T E L E C I N C O S. A. 2008 First quarter results (January March) Madrid, May 8 th 2008 1 Leadership in Audience, Advertising and Profitability 1T 08 1T 07 VAR. % Total Net Revenues
G E S T E V I S I Ó N T E L E C I N C O S. A. 16th October 2007 COMPANY PRESENTATION
 G E S T E V I S I Ó N T E L E C I N C O S. A. 16th October 2007 COMPANY PRESENTATION 1 First Half 2007, Leadership in Audience, Advertising and Profitability 1H06 1H07 Var. % Audience Share, 9M07 20.3
2006 THIRD QUARTER RESULTS (January September)
") G E S T E V I S I Ó N T E L E C I N C O S. A. 24th October 2006 2006 THIRD QUARTER RESULTS (January September) 1 Highlights* of Third Quarter Results (January September) 2006 Total net revenues: 700.9
G E S T E V I S I Ó N T E L E C I N C O S. A. 24th October 2006 2006 THIRD QUARTER RESULTS (January September) 1 Highlights* of Third Quarter Results (January September) 2006 Total net revenues: 700.9
RESULTS YEAR 2007 (January December)
") RESULTS YEAR 2007 (January December) Madrid 28 February, 2007 CONTENTS: 1. Financial and operating highlights 2. Profit and loss account 3. Cash flow generation 4. Summary balance sheet 5. Audience share
RESULTS YEAR 2007 (January December) Madrid 28 February, 2007 CONTENTS: 1. Financial and operating highlights 2. Profit and loss account 3. Cash flow generation 4. Summary balance sheet 5. Audience share
2004 FULL YEAR RESULTS
 G e s t e v i s i ó n T e l e c i n c o S. A. 1st March 2005 2004 FULL YEAR RESULTS (January December) Highlights of the year 2004 Total net revenues: 789.88 million ( + 22.8% vs. 2003) Cost control: Total
RESULTS FIRST QUARTER 2008 (January March) 1
 1") RESULTS FIRST QUARTER 2008 (January March) 1 Madrid 8 May, 2008 CONTENTS: 1. Financial and operating highlights 2. Profit and loss account 3. Cash flow generation 4. Summary balance sheet 5. Audience share
RESULTS FIRST QUARTER 2008 (January March) 1 Madrid 8 May, 2008 CONTENTS: 1. Financial and operating highlights 2. Profit and loss account 3. Cash flow generation 4. Summary balance sheet 5. Audience share
2004 First Half Results
 G e s t e v i s i ó n T e l e c i n c o S. A. 28th July 2004 2004 First Half Results Highlights of the First Half 2004 Record total net revenues: 403.9 million ( + 26.3%) Cost control: total costs 237.8
2015 Full Year Results Presentation. Milan, 22nd March 2016
 2015 Full Year Results Presentation Milan, 22nd March 2016 Broadcasting & Advertising ITALY FY 2015 Economic scenario & advertising market HIGHLIGHTS MACRO ECONOMIC KEY INDICATORS ARE SLIGHTLY BUT CONTINUOUSLY
Mediaset Roadshow. 18 th 21 st April 2016
 Mediaset Roadshow 18 th 21 st April 2016 FY 2015 Broadcasting & Advertising ITALY FY 2015 Economic scenario & advertising market HIGHLIGHTS MACRO ECONOMIC KEY INDICATORS ARE SLIGHTLY BUT CONTINUOUSLY IMPROVING
FY 2016 Results Presentation. Milan, 19 th April 2017
 FY 2016 Results Presentation Milan, 19 th April 2017 Advertising MEDIASET CONFIDENCE FY 2016 INDEXES Advertising CONSUMERS, revenues MANUFACTURERS growth & vs RETAILERS Total advertising market Total ad
2007 Full Year Results
 Antena 3 Group 2007 Full Year Results Madrid, 21 st February 2007 Legal Notice The information contained in this presentation has not been independently verified and is, in any case, subject to negotiation,
2008 First Half Results Presentation. Milan, 31 st July 2008
 2008 First Half Results Presentation Milan, 31 st July 2008 1 Broadcasting 2 MEDIASET 24Hours Audience Share January-May 2007 2008 INDIVIDUALS 42.1% 40.9% 41.1% 40.5% COMMERCIAL TARGET (15-64 Years) 37.9%
Fedele Confalonieri Chairman
 1 Fedele Confalonieri Chairman 2 MEDIASET GROUP P&L Consolidated Results (Euro ml.) 2008 2009 Net Consolidated Revenues 4,199.5 3,882.9 Operating Profit 983.6 601.5 Net Profit 459.0 272.4 Dividend per
GESTEVISION TELECINCO S.A. THE LEADING TV MEDIA GROUP IN SPAIN
 GESTEVISION TELECINCO S.A. THE LEADING TV MEDIA GROUP IN SPAIN December 21 st 2009 1 TRANSACTION SUMMARY Telecinco to acquire 100% of the business of Cuatro and 22% of Digital+ from Grupo Prisa Grupo Prisa
1H 2017 Results Presentation. Milan, 26 th September 2017
 1H 2017 Results Presentation Milan, 26 th September 2017 Audience & Advertising gen-15 feb-15 mar-15 apr-15 mag-15 giu-15 lug-15 ago-15 set-15 ott-15 nov-15 dic-15 gen-16 feb-16 mar-16 apr-16 mag-16 giu-16
January- December 2009 Results. Grupo Prisa. Annual Results January- December February 19th // Investor Relations
 Grupo Prisa Annual Results January- December 2009 February 19th 2010 1 JANUARY- DECEMBER 2009 PRISA OBTAINED AN EBITDA OF 623.75 MILLION IN 2009. The operating profit (EBIT) reached 368.98 million. Net
AND THE WINNER IS G E S T E V I S I Ó N T E L E C I N C O S.A.
 AND THE WINNER IS G E S T E V I S I Ó N T E L E C I N C O S.A. 2006 Results Presentation Madrid, 2nd March 2007 Year 2006, Leadership in Audience, Advertising and Profitability Total Net Revenues ( mn)
ENVIABLE BALANCE SHEET
 Madrid, 24 June 2014 Following the sector s most successful IPO and its listing on the IBEX 35 six months later MEDIASET ESPAÑA IS CELEBRATING THE TENTH ANNIVERSARY OF ITS LISTING ON THE STOCK MARKET AS
2014 HALF-YEAR RESULTS 29 July 2014
 2014 HALF-YEAR RESULTS 29 July 2014 DISCLAIMER Statements contained in this document, particularly those concerning forecasts on future M6 Group performance, are forward-looking statements that are potentially
9M10 Results 12 November 2010
 Results 12 November 2010 Highlights for VOC brand strategy gradually showing up in numbers: market share gains: circulation gap of ABC to El Mundo
Roadshow Presentation October 2003
 Roadshow Presentation October 2003 Legal notice This presentation has been prepared by Antena 3 de Televisión S.A. (the Company) solely for use at the company presentation held in connection with the proposed
The leading European entertainment network
 The leading European entertainment network Agenda INTRODUCTION Business Review Financial Review Outlook The leading European entertainment network RTL Group Half year highlights 2011 REVENUE EUR 2.75 billion
RCS MediaGroup. First Half 2015 Results. Milan, August 25, 2015
 RCS MediaGroup First Half 2015 Results Milan, August 25, 2015 Agenda Highlights Market & Business Trends First Half 2015 Results Business Units Backup 2 1H 2015 Delivery Report Profitability Continued
January-March 2010 Results. Grupo Prisa. Quarterly Results January- March th May, // Investor Relations
 Grupo Prisa Quarterly Results January- March 2010 13th May, 2010 1 JANUARY- MARCH 2010 PRISA OBTAINED AN EBITDA OF 144.47 MILLION IN THE FIRST QUARTER OF 2010 (+3.9%). THE OPERATING PROFIT (EBIT) INCREASED
2012: FIRST HALF RESULTS 25 July 2012
 2012: FIRST HALF RESULTS 25 July 2012 DISCLAIMER Statements contained in this document, particularly those concerning forecasts on future Groupe M6 performance, are forward-looking statements that are
Second-Quarter 2010 Results FOR IMMEDIATE RELEASE
 Second-Quarter 2010 Results FOR IMMEDIATE RELEASE Highlights Consolidated Net Sales grew 14%, and Operating Segment Income increased 9.1% Television Broadcasting Net Sales increased 9.8%, and Operating
Antena 3 Group First Quarter Results 26th April 2007
 Antena 3 Group 2007 First Quarter Results 26th April 2007 Legal Notice The information contained in this presentation has not been independently verified and is, in any case, subject to negotiation, changes
TELECINCO'S BOARD OF DIRECTORS AGREES ON A CAPITAL INCREASE AND FIRES THE STARTING PISTOL FOR THE CREATION OF A MAJOR AUDIOVISUAL GROUP
 Madrid, 18 th November 2010 Today Telecinco our controlled company has disclosed the following press release: This document and its contents are not intended for investors in Australia, Canada, the US
First-Quarter 2008 Results FOR IMMEDIATE RELEASE
 First-Quarter 2008 Results FOR IMMEDIATE RELEASE Highlights Consolidated net sales increased 16.4, and operating segment income increased 11.1 in nominal terms Television Broadcasting net sales increased
Resultados enero-marzo Quarterly results January- March th April //Información para accionistas e inversores
 Resultados enero-marzo 2007 Quarterly results January- March 2007 19th April 2007 1 www.prisa.es //Información para accionistas e inversores NOTE 1: GROUP STRUCTURE Grupo Prisa s activities are organized
2009 Nine Months Results. New York 23/24 November 2009
 2009 Nine Months Results New York 23/24 November 2009 Agenda Who we are Market trends Efficiency Enhancement Program 2009: Nine Months Results and EEP Update Details by Business Unit 2 RCS MediaGroup Positioning
Resultados enero-marzo Quarterly Results January- September October 22nd //Información para accionistas e inversores
 Resultados enero-marzo 2007 Quarterly Results January- September 2007 October 22nd 2007 1 www.prisa.es //Información para accionistas e inversores JANUARY- SEPTEMBER 2007 January- September 2007 Results
2009 First Half Financial Results. September 2009
 2009 First Half Financial Results September 2009 Agenda Who we are Market trends Efficiency Enhancement Program 2009: 1st Half Results and EEP Update Details by Business Unit 2 RCS Positioning ITALY ITALY
2012 Half-Year Results NextRadioTV Group. 25 July 2012
 2012 Half-Year Results NextRadioTV Group 25 July 2012 1 Contents 1. Introduction 3 2. Highlights 5 3. Presentation of results 14 4. Outlook 22 5. Appendices 31 2 1. Introduction 3 4 2. Highlights 5 Key
RCS MediaGroup. Q Results. Mediobanca Italian CEO Conference Milan, June 25, 2015
 RCS MediaGroup Results Mediobanca Italian CEO Conference Milan, June 25, 2015 Agenda Highlights Market & Business Trends Results Business Units Back up 2 Delivery Report Profitability Continued improvement
SKY NETWORK TELEVISION ANNUAL RESULTS 2004
 SKY NETWORK TELEVISION ANNUAL RESULTS 2004 Subscribers 500,000 400,000 300,000 200,000 100,000 0 Jun-04 Jun-03 Jun-02 Jun-01 Jun-00 Jun-99 Jun-98 Jun-97 Jun-96 Jun-95 Jun-94 Jun-93 Jun-92 Jun-91 Wholesale
The leading European entertainment network
 The leading European entertainment network Agenda INTRODUCTION o Business Review o Financial Review o Outlook The leading European entertainment network 2 RTL Group Full year highlights 2011 REVENUE EUR
Business Review & FY12 Financial Results
 Business Review & FY12 Financial Results Apr 12, 2013 www.dyh.com.tr Notice The financial statements are reclassed for presentation purposes, the CMB format is also available through ISE and DYH websites.
Interim Financial Report as at 31st March 2017
 Interim Financial Report as at 31st March 2017 MEDIASET S.p.A. - via Paleocapa, 3-20121 Milan Share Capital Euros 614,238,333.28 fully paid up Tax Code, VAT number and inscription number in the Milan Enterprises
Disclaimer. For further information, please contact our Investor Relations Department. Federica De Medici
 YE 2006 Results Disclaimer Statements contained in this document, particularly the ones regarding any RCS MediaGroup possible or assumed future performance, are or may be forward looking statements and
1H RESULTS PRESENTATION Madrid, 2014
 1H RESULTS PRESENTATION Madrid, 2014 Disclaimer In addition to figures prepared in accordance with IFRS, PRISA presents non-gaap financial performance measures, e.g., EBITDA, EBITDA margin, adjusted EBITDA,
Mediaset Group. Quarterly Report as at 30 September 2014
 Mediaset Group Quarterly Report as at 30 September 2014 MEDIASET S.p.A. - via Paleocapa, 3-20121 Milan Share Capital Euros 614,238,333.28 fully paid up Tax Code, VAT number and inscription number in the
MEDIASET ESPAÑA COMUNICACIÓN, S.A. Financial Statements and Management Report for the year ended December 31, 2017 TABLE OF CONTENTS
 MEDIASET ESPAÑA COMUNICACIÓN, S.A. Financial Statements and Management Report for the year ended December 31, 2017 TABLE OF CONTENTS 1. Balance sheet at December 31, 2017 2. Income statement for the year
Quarterly report as at 30 September 2012
 MEDIASET GROUP Quarterly report as at 30 September 2012 MEDIASET S.p.A. - via Paleocapa, 3-20121 Milan Share Capital Euros 614,238,333.28 fully paid up Tax Code, VAT number and inscription number in the
An Analysis of Liberty Acquisition/Grupo Prisa. Value Investing Congress October 13, 2010
 An Analysis of Liberty Acquisition/Grupo Prisa Value Investing Congress October 13, 2010 T2 Partners Management L.P. Manages Hedge Funds and Mutual Funds and is a Registered Investment Advisor The General
Results for January - September November 2008
 Results for January - September 2008 11 November 2008 Unbeatable Position for Capturing Growth Financial strength and business strength Capacity for strategy execution Sound financial position Flexible
July Half-Year Results NextRadioTV Group
 July 2015 2015 Half-Year Results NextRadioTV Group Contents 1. Introduction 3 2. HY1 highlights 5 3. Presentation of results 16 4. Outlook 22 5. Appendices 30 1. Introduction 3 Key figures ( millions)
Sixth Investor Conference
 Sixth Investor Conference ASCENDING & DESCENDING Santiago Fernández Valbuena London, October 11 th 2007 2 Disclaimer This presentation contains statements that constitute forward looking statements in
Investor Presentation May 2017
 Investor Presentation May 2017 Safe Harbour Disclosure - Forward-looking Statements 2 Leading Canadian Media and Content Company Great portfolio of assets Leader in Canadian broadcasting Globally recognized
Q Results. Milano, May 14th 2014
 Q1 2014 Results Milano, May 14th 2014 Agenda Market Trends & Digital Business Q1 2014 Results Business Units Focus 2 Continued delivery of Plan Shift towards digital business Increasing weight of digital
Results Presentation The Year Ended March 31, Tokyo Broadcasting System Holdings, Inc. May 11, 2017
 Results Presentation The Year Ended Tokyo Broadcasting System Holdings, Inc. May 11, 2017 List of Consolidated Companies Tokyo Broadcasting System Holdings, Inc. Consolidated company in the broadcasting,
Mediaset Group. Interim Financial Report as at 31 March 2014
 Mediaset Group Interim Financial Report as at 31 March 2014 MEDIASET S.p.A. - via Paleocapa, 3-20121 Milan Share Capital Euros 614,238,333.28 fully paid up Tax Code, VAT number and inscription number in
Deal Overview July 2013
 Deal Overview July 2013 Executive Summary SPT Networks has an opportunity to acquire Chellomedia s (a subsidiary of Liberty Global) operating business unit in the Latin America region, Chello Latin America
MEDIASET ESPAÑA COMUNICACIÓN, S.A. AND SUBSIDIARIES
 MEDIASET ESPAÑA COMUNICACIÓN, S.A. AND SUBSIDIARIES for the year ended December 31, 2016, prepared in accordance with International Financial Reporting Standards (IFRS-EU) as adopted by the European Union,
RCS MediaGroup First Half Results. J.P. Morgan Italian Conference Milano, September 29, 2014
 RCS MediaGroup 2014 First Half Results J.P. Morgan Italian Conference Milano, September 29, 2014 Agenda Highlights Market & Business Trends 2014 First Half Results Business Units Focus 2 1H 2014 Delivery
Agenda. I. FY11 Highlights 4 II. Publishing 8 III. Broadcasting 13. V. Investments & Financing 24 VI. Outlook 27
 Business Review & FY11 Financial Results Apr 11, 2011 www.dyh.com.tr Notice The financial statements are reclassed for presentation purposes, the CMB format is also available through ISE and DYH websites.
Results Presentation The First Half of the Year Ending March 31, Tokyo Broadcasting System Holdings, Inc. November 5, 2015
 Results Presentation The First Half of the Year Ending Tokyo Broadcasting System Holdings, Inc. November 5, 2015 0 List of Consolidated Companies Tokyo Broadcasting System Holdings, Inc. Consolidated company
MEDIASET BOARD APPROVES THE GROUP S 2013 FINANCIAL STATEMENTS
 PRESS RELEASE MEDIASET BOARD APPROVES THE GROUP S 2013 FINANCIAL STATEMENTS In an economic climate that remains negative, the Mediaset Group generated cash, produced profit and reduced its indebtedness
An Inflexion Point in the Company 1H 2015 RESULTS PRESENTATION. Madrid, 22 nd July 2015
 An Inflexion Point in the Company 1H 2015 RESULTS PRESENTATION Madrid, 22 nd July 2015 Disclaimer In addition to figures prepared in accordance with IFRS, PRISA presents non-gaap financial performance
Investor presentation September 2005
 Investor presentation September 2005 Consolidated figures according to International Financial Reporting Standards (IFRS) IMPROVING ECONOMIC PICTURE Construction drives growth of industrial output Retail
Deutsche Bank - 6 Italian Conference. Milano, 17 may 2005
 Deutsche Bank - 6 Italian Conference Milano, 17 may 2005 Disclaimer Statements contained in this document, particularly the ones regarding any RCS MediaGroup possible or assumed future performance, are
ALNT ALANTRA PARTNERS SA 12.90/10.NOV.2017 MULTIPLY ABOUT COMPANY (BME:ALNT) CLASSIFICATION : INSTITUTIONAL BROKERAGE INVESTMENT RATIONALE KEY RISKS
 CLASSIFICATION : INSTITUTIONAL BROKERAGE INVESTMENT RATIONALE KEY RISKS") ALNT ALANTRA PARTNERS SA 12.90/10.NOV.2017 ABOUT COMPANY (BME:ALNT) Alantra Partners S.A. is an investment banking and asset management firm. The company is an independent financial advisor in mid-market
ALNT ALANTRA PARTNERS SA 12.90/10.NOV.2017 ABOUT COMPANY (BME:ALNT) Alantra Partners S.A. is an investment banking and asset management firm. The company is an independent financial advisor in mid-market
Interim Financial Report at 30 June 2018
 Interim Financial Report at 30 June 2018 This Interim Report has been translated from the original issued in italian into English language solely for the convenience of international readers. MEDIASET
Financial & Business Highlights For the Year Ended June 30, 2017
 Financial & Business Highlights For the Year Ended June, 17 17 16 15 14 13 12 Profit and Loss Account Operating Revenue 858 590 648 415 172 174 Investment gains net 5 162 909 825 322 516 Other 262 146
The leading European Entertainment network
 The leading European Entertainment network Agenda 1 2 3 4 2014 9 month 2014 highlights Group financials Business segments Outlook 2014 2 1 2 3 4 Significant progress made in digital o o One of the largest,
Grupo PRISA. Quarterly results January-September 2006
 Grupo PRISA Quarterly results January-September 2006 October 20th 2006 NOTE 1 Prisa globally consolidates Sogecable since April 1, 2006. The consolidation of Sogecable changes significantly the Group s
MEDIASET S BOARD OF DIRECTORS APPROVES 2017 RESULTS
 PRESS RELEASE Mediaset Board of Directors Meeting 24 April 2018 MEDIASET S BOARD OF DIRECTORS APPROVES 2017 RESULTS Consolidated results Net revenues: 3,631.0 million Operating profit (EBIT): 316.5 million
MARCH M T W T F S S
 0 0 JANUARY 0 0 0 FEBRUARY 0 0 MARCH 0 0 0 JANUARY 0 0 0 FEBRUARY 0 0 MARCH 0 0 0 APRIL 0 0 0 JULY 0 0 0 MAY 0 0 0 AUGUST 0 0 0 JUNE 0 0 0 SEPTEMBER 0 0 0 APRIL 0 0 0 JULY 0 0 0 MAY 0 0 0 AUGUST 0 0 0
OTE Corporate Presentation
 OTE Corporate Presentation BNP Paribas 9th Annual High Yield & Leveraged Finance Conference 2013 Tuesday, January 15 th 2013 1 OTE Group Overview 2 The Group today OTE is the leading integrated telecommunications
MORGAN STANLEY TMT CONFERENCE
 MORGAN STANLEY TMT CONFERENCE Barcelona, Friday 16th November 2007 Ignacio Santillana, COO 1 : INDEX Grupo Prisa: - New issues. - Main highlights. Group Strategy. Business evolution update. 2 : GRUPO PRISA
Cost Estimation of a Manufacturing Company
 Cost Estimation of a Manufacturing Company Name: Business: Date: Economics of One Unit: Manufacturing Company (Only complete if you are making a product, such as a bracelet or beauty product) Economics
27 July 2018 Interim Results
 27 July 2018 Interim Results for the half year ended 30 June 2018 Disclaimer This presentation may contain forward-looking statements, including forward-looking statements within the meaning of the United
FINANCIAL & BUSINESS REVIEW FOR THE 9-MONTH PERIOD ENDED 30 SEPTEMBER NOVEMBER 2013
 FINANCIAL & BUSINESS REVIEW FOR THE 9-MONTH PERIOD ENDED 30 SEPTEMBER 2013 18 NOVEMBER 2013 1 TABLE OF CONTENTS Section Content Page MEDIA PRIMA BERHAD Section 1 Overview 3-6 Section 2 Performance Review
RCS MediaGroup FY Results. Milano, 19 Marzo, 2015
 RCS MediaGroup FY Results Milano, 19 Marzo, 2015 Agenda Highlights Market & Business Trends FY Results Outlook and Strategic Opportunities Business Units Back up 2 Delivery Report Profitability Ebitda
Domino s Pizza UK & IRL plc Interim Results for the 26 weeks ended 2 July _interim_results
 Interim Results for the 26 weeks ended 2 July 2006 The Team Stephen Hemsley, Chief Executive Chris Moore, Chief Operating Officer Lee Ginsberg, Finance Director 2 Financial Highlights System sales up 18.3%
Fiscal 2014 Q3 Results
 Stephen MacPhail, President & CEO Doug Jamieson, Executive Vice-President & CFO Derek Green, President, CI Investments Steven Donald, President, Assante Wealth Management November 6, 2014 Important Information
2008 financial performance of the Group
 financial performance of the Group Investor presentation April 2009 financial performance of the Group PLN mln 4Q Revenues 335.9 (4.7%) 1 277.7 0.4% Operating cost, incl.: 361.3 12.3% 1 233.1 7. - provisions
FY 2015 RESULTS PRESENTATION. Madrid, 29 th February 2016
 FY 2015 RESULTS PRESENTATION Madrid, 29 th February 2016 Disclaimer In addition to figures prepared in accordance with IFRS, PRISA presents non-gaap financial performance measures, e.g., EBITDA, EBITDA
4th quarter and full year FY16 results. 22 nd March 2016
 4th quarter and full year FY16 results 22 nd March 2016 Disclaimer This document contains certain forward-looking statements with respect to Astro Malaysia Holdings Berhad s ( Astro ) financial condition,
FY 2011 Results. February 28th, 2012
 FY 2011 Results February 28th, 2012 Disclaimer In addition to figures prepared in accordance with IFRS, PRISA presents non-gaap financial performance measures, e.g., EBITDA, EBITDA margin, adjusted EBITDA,
Financial Results FY nd Quarter. November 15, 2016 Nippon Television Holdings, Inc.
 Financial Results FY 2016 2nd Quarter November 15, 2016 Nippon Television Holdings, Inc. This presentation may include forward-looking statements. Actual results, however, could differ significantly as
Power Accountants Association Annual Meeting Potential Impacts from Oct 2015 Rate Change
 Power Accountants Association Annual Meeting Potential Impacts from Oct 2015 Rate Change Material Provided by: Chris Mitchell Chris Mitchell Management Consultants (CMMC) mail@chrismitchellmc.com 5/14/2015
TV Today Network BUY. Go with the market leader. CMP Target Price `297 `363. Initiating Coverage Media. 3-year price chart
 Initiating Coverage Media August 4, 216 TV Today Network Go with the market leader TV Today Network (TTNL) is one of India's leading Hindi-English news television networks. The company's operating segments
Strategy 2013 highlights. Business. segments
 1 1 2 3 4 2014 Full-year Group Business Outlook 2014 Strategy 2013 highlights financials segments update 2 1 2 3 4 Revenue Cash conversion rate YoY growth: +6.9% EBITA Margin YoY growth: +4.7% Reported
FY18 RESULTS PRESENTATION. February 26 th, 2019
 FY18 RESULTS PRESENTATION February 26 th, 2019 0 Disclaimer The information contained in this presentation has not been independently verified and is, in any case, subject to negotiation, changes and modifications.
Rebalanced ITV delivers continued good growth Interim Results 2016
 Rebalanced ITV delivers continued good growth Interim Results 2016 27 July 2016 Agenda Key Messages and H1 Highlights Adam Crozier Half Year Financial Results Ian Griffiths Strategic Outlook Adam Crozier
ITV plc Final Results th March 2009
 ITV plc Final Results 2008 4th March 2009 1 Introduction Michael Grade Executive Chairman 2 Agenda Introduction and overview Financial review Current trading and strategic update Michael Grade Ian Griffiths