FY12 24h Audience share. FY12 financials. FY12 TV Advertising market share. FY12 FY11 Var % Others
|
|
|
- Oswald Armstrong
- 5 years ago
- Views:
Transcription


1


2 FY12 24h Audience share FY12 financials Millions FY12 FY11 Var % TOTAL NET REVENUES 886, ,3-12,1% Total operating costs 821,8 816,5 0,7% Recurring EBITDA adj* 64,9 192,9-66,3% Recurring EBITDA margin 7,3% 19,1% EBIT 48,8 164,5-70,3% EBIT margin 5,5% 16,3% FY12 TV Advertising market share NET PROFIT 50,1 110,5-54,6% NET PROFIT ADJ.** 65,3 143,4-54,4% EPS ADJ 0,161 0,353 Net cash position 73,7 26,5 Others *Recurring EBITDA Adj, includes TV rights consumption and excludes one off items ** Adjusted Net profit excludes all impacts from non cash items like PPA amortization (on Cuatro and Digital+) Source: Kantar media and Publiespaña 2
3 BROADCASTING


4 TTV Consumption steadily increases: +36minutes during the last 12 years Source: Kantar media Data: average January 1 st December 31 st 4
5 TTV Consumption steadily increases among all age groups Source: Kantar media 5

6 MEDIASET is the group of channels which increases its audience the most in 2012 in total individuals and even more so when considering the commercial target FY h Total individuals audience share FY h Commercial target audience share Vs ,7 +1,1 0,6 3,4 Vs ,8 +0,6 0,5 3,1 Source: Kantar media Data: average January 1 st December 31 st 2012 Commercial target: Audience group comprising of individuals from 16 to 59 living in communities of over 10,000 inhabitants and across middle and upper social classes 6


7 Telecinco and Cuatro are leaders vs. their main commercial competitors FY12 24h total individuals audience share FY12 24h commercial target audience share Vs ,3 0,1 +1,0 0,8 0,6 2,3 Vs ,5 0,2 +0,9 1,2 0,5 2,0 % Days won FY12 24h total individuals % Days won FY12 24h total individuals Source: Kantar media; Data: average January 1 st December 31 st 2012 Commercial target: Audience group comprising of individuals from 16 to 59 living in communities of over 10,000 inhabitants and across middle and upper social classes 7
8 Telecinco is leader in prime time audience both in total individuals and commercial target FY12 Prime Time (20:30) total individuals audience share FY12 Prime Time (20:30) commercial target audience share Vs ,2 0,2 0,1 0,7 1,0 2,6 Vs ,3 0,4 +0,1 1,0 1,0 2,4 Source: Kantar media; Data: average January 1 st December 31 st 2012 Commercial target: Audience group comprising of individuals from 16 to 59 living in communities of over 10,000 inhabitants and across middle and upper social classes 8


9 Telecinco leads the ranking of the most successful programs broadcasted by commercial channels PROGRAM CHANNEL THOUSAND SHARE 1 FUTBOL: EU ROCOPA EXTRA TI ME T ,8 2 FUTBOL: EUROCOPA T ,1 3 LA VOZ T ,0 4 FUTBOL: EUROPA LEAGUE T ,3 5 FORMULA 1: GP A ,1 6 LA QUE SE AVECI NA T ,7 7 MI GI TANA T ,7 8 AÍ DA T ,6 9 FUTBOL: COPA DEL REY T ,0 10 TU CARA ME SUENA A ,2 Source: Kantar media 9

10 Mediaset España channels are perfectly positioned per audience share target FEMALE MALE Source: Kantar media 10


11 MEDIASET s multichannel strategy: each channel delivers excellent results in its core target FDF: young adult s channel Divinity: ladies channel Boing: children s channel Nueve: ladies channel La7: young adult s channel Energy: men s channel Source: Kantar media Data: average audience January 1 st February 26 th 2013 TI: Audience 24h total individuals 11
12 January s audience shows different trends during the holiday period vs. the rest of the month 24h Total individuals audience share by Groups 28,3% 28,2% 24h Total individuals audience share by Channels 13,3% 13,4% 16,8% 10,5% 8,9% 8,9 Average 2013* Average 2013* Source: Kantar media * Data average January 1 st February 26 th
13 Mediaset España is leader in all of the most appealing audience targets Source: Kantar media; Data: average February 1 st February 26 th


14 Top 5 media web pages 12M 2012 Unique users Pages viewed marca.es 30,26 792,48 elmundo.es 29,24 377,77 20minutos.es 17,22 90,90 abc.com 15,04 109,40 telecinco.es 13,04 278,76 Top 5 TV web pages 12M 2012 Unique users Pages viewed telecinco.es 13,04 278,76 rtve.es 12,77 187,08 antena3tv.es 9,66 169,49 mitele.es 4,04 12,98 cuatro.com 3,58 21,56 TV groups user s 2012 monthly evolution Mediaset España s web pages lead in both unique users and page viewed versus their main competitors. The Voice and Mitele apps lead the rankings both in Apple store and Android In August TVE were leaders thanks to the Olympic games. Source: OJD Nielsen 14


15 Top programs viewed on mitele.es platform, Spanish contents are the most watched PROGRAM CHANNEL TOTAL VIDEOS MONTHLY VIDEO AVG 1 LA QUE SE AVECINA T AI DA T LA VOZ T LOS SERRANO T CUARTO MI LENI O CUATRO LIVE PROGRAM CHANNEL TOTAL VIDEOS MONTHLY VIDEO AVG 1 BIG BROTHER 24H T FUTBOL: EUROCUP T TENNIS: ROLAND GARROS CUATRO LA VOZ T MOTO GP T Source: Weborama and Nielsen 15


16 MEDIASET s movies are n.1 in Spanish box office The most successful Spanish movie in history with more than 42,5m gross box office Spanish animated most successful movie, with more than 18m gross box office Winner of 5 Goya Winner of 3 Goya 1 Oscar nomination Source: Rentrak 16
17 ADVERTISING


18 FY12 advertising market 15,8% Millions FY12 market share per media Cinema Outdoor Radio Internet Press/ Magazines FY12 performance by media Television Internet Cinema Radio Outdoor Television Press/ Magazines Source: Publiespaña 18

 C/GRP s Revenues Var %")


19 Mediaset España multiplexes advertising revenues Millions FY12 market share Others FY12 commercial strategy Audience Var % Seconds GRP (20 ) C/GRP s Revenues Var % 18,3% -0,1% +10,5% +4,9% ,1% +18,0% +28,4% +8,4% ,7% +50,6% -19,1% +28,4% ,1% +6,8% +15,8% +6,2% -20,9% 816,8m -15,9% Source: Kantar media and Publiespaña 19

 Finance Retail Telecoms")


20 TV advertising market by sectors FY12 sector breakdown (% on total adv. sales) Finance Retail Telecoms Automotive Others Food Health & Beauty % Sector growth (FY12 vs. FY11) Finance Retail Automotive Health & Beauty Food Others Telecoms Source: Publiespaña 20
21 FINANCIAL RESULTS
22 FY12 consolidated financial results FY12 FY11 VAR % Total net revenues 886, ,3-12,1% Total recurring costs 821,8 816,5 0,7% Personnel 109,3 103,9 5,1% TV Rights Amortisation 210,5 227,7-7,6% Other Operating Costs 502,1 484,9 3,5% Recurring EBITDA adj (1) 64,9 192,9-66,3% Non recurring costs - 12,7 n.a. EBITDA adj (1) 64,9 180,2-64,0% PPA Amortisations 8,0 8,0 0,0% Amortisations & Depreciations 8,1 7,7 6,3% EBIT 48,8 164,5-70,3% Pre-Tax Profit 52,3 151,1-65,4% Net Profit Reported 50,1 110,5-54,6% EPS 0,123 0,272 Net Profit Adjusted (2) 65,3 143,4-54,4% Millions Recurring EBITDA adj/ Total net revenues 7,3% 19,1% EBITDA adj/ Total net revenues 7,3% 17,9% EBIT/ Total net revenues 5,5% 16,3% NET PROFIT Reported/ Total net revenues 5,7% 10,9% NET PROFIT Adjusted/ Total net revenues 7,4% 14,2% (1) Recurring EBITDA Adj, includes TV rights consumption (2) Adjusted Net profit excludes all impacts from non cash items like PPA amortization (on Cuatro and Digital+) 22


23 Mediaset España achieves 140m cost savings, in 3Y, thanks to its cost control expertise 139,5M * Millions *Pro forma consolidated P&L accounts under IFRS of Telecinco s Group and Sogecuatro s Group 23


24 FY12 consolidated cash flow Millions FY12 FY11 Diff. in million Initial Cash Position 26,5-28,0 54,5 Free Cash Flow 40,2 117,8-77,6 Cash Flow from Operations 272,7 377,6-104,9 Net Investments -192,0-241,7 49,7 Change in Net Working Capital -40,6-18,1-22,4 Change in Equity 1,2 46,8-45,6 Millions Net cash position +47,3m Financial Investments 39,0 28,1 10,9 Dividends received 22,1 1,9 20,2 Dividend payments -55,3-140,2 84,9 Total Net Cash Flow 47,3 54,5-7,3 Final Cash Position 73,7 26,5 47,3 24


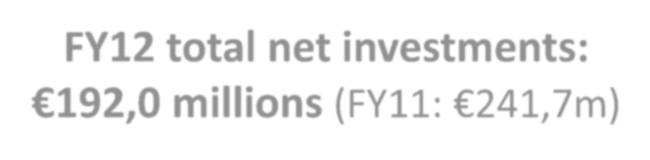
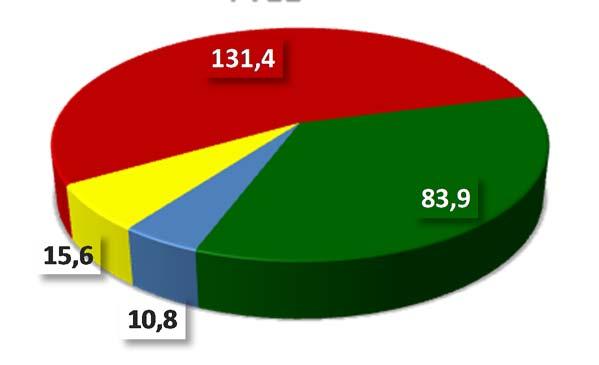
25 Millions FY12 total net investments: 192,0 millions (FY11: 241,7m) FY12 FY11 25


26 The virtuous circle of MEDIASET ESPAÑA 139,5m * +1,3pp* +2,8pp* +101,7m * * Vs FY10 **Pro forma consolidated P&L accounts under IFRS of Telecinco s Group and Sogecuatro s Group Source: Kantar media, Infoadex and Publiespaña 24h Total individuals audience share Millions 26
27 BACK UP
28 FY12 consolidated P&L account (I) FY12 FY11 Var % Gross Advertising Revenues 857, ,3-14,8% - Multiplex Mediaset España 816,8 971,5-15,9% - Other 40,6 34,9 16,4% Discounts -50,6-58,9-14,0% Net Advertising revenues 806,7 947,5-14,9% Other Revenues 80,0 61,9 29,3% TOTAL NET REVENUES 886, ,3-12,1% Personnel 109,3 103,9 5,1% TV Rights Amortisation 210,5 227,7-7,6% Other Operating Costs 502,1 484,9 3,5% Total costs (1) 821,8 816,5 0,7% EBITDA adj Ex non recurring items 64,9 192,9-66,3% EBITDA/NET REVENUES 7,3% 19,1% Millions Non recurring items (2) 0,0 12,7 n.a. EBITDA adj* 64,9 180,2-64,0% * EBITDA Adj, includes TV rights consumption 28
29 FY12 consolidated P&L account (II) FY12 FY11 Var % EBITDA adj* 64,9 180,2-64,0% PPA amortisation (3) 8,0 8,0 0,0% Depreciation tangible assets & provisions (4) 8,1 7,7 6,3% Total Costs ( ) 837,9 844,8-0,8% EBIT 48,8 164,5-70,3% EBIT/NET REVENUES 5,5% 16,3% Equity Consolidated Results 7,5-18,4 n.a. Financial results -4,0 5,0 n.a. EBT 52,3 151,1-65,4% Income Taxes -2,8-38,5 n.a. Minority Interest 0,6-2,1 n.a. NET PROFIT 50,1 110,5-54,6% NET PROFIT ADJ.** 65,3 143,4-54,4% EPS 0,123 0,272 EPS Adjusted** 0,161 0,353 NET PROFIT/NET REVENUES 5,7% 10,9% NET PROFIT ADJ/NET REVENUES 7,4% 14,2% Millions * EBITDA Adj, includes TV rights consumption ** Adjusted Net profit excludes all impacts from non cash items like PPA amortization (on Cuatro and Digital+) 29
30 FY12 consolidated balance sheet FY Fixed assets 1.047, ,1 -Financial 759,8 825,9 -Non Financial 287,8 297,2 Audiovisual Rights and Pre-payments 230,9 261,0 -TV, Third Party Rights 180,9 186,5 -TV, Spanish Fiction Rights 30,4 29,3 -Co-production / distribution 19,6 45,1 Pre-paid taxes 176,4 158,1 TOTAL NON-CURRENT ASSETS 1.454, ,2 Current assets 219,5 302,9 Financial investments and cash 92,8 114,4 TOTAL CURRENT ASSETS 312,3 417,3 TOTAL ASSETS 1.767, ,4 Shareholders' equity 1.420, ,8 Non-current provisions 24,3 29,3 Non-current payables 6,8 5,5 Non-current financial liabilities 0,0 0,1 TOTAL NON-CURRENT LIABILITIES 31,2 34,9 Millions Current payables 296,1 410,9 Current financial liabilities 19,0 87,8 TOTAL CURRENT LIABILITIES 315,1 498,7 TOTAL LIABILITIES 1.767, ,4 30
31 4Q12 consolidated P&L account (I) 4Q12 4Q11 Var % Gross Advertising Revenues 225,1 275,9-18,4% - Multiplex Mediaset España 211,4 264,8-20,2% - Other 13,7 11,1 23,2% Discounts -13,3-16,3-18,6% Net Advertising revenues 211,8 259,6-18,4% Other Revenues 45,1 18,1 149,6% TOTAL NET REVENUES 256,9 277,7-7,5% Personnel 29,7 27,4 8,4% TV Rights Amortisation 80,7 67,7 19,3% Other Operating Costs 122,2 134,1-8,9% Total costs (1) 232,6 229,1 1,5% EBITDA adj Ex non recurring items 24,3 48,6-49,9% EBITDA/NET REVENUES 9,5% 17,5% Millions Non recurring items (2) 0,0 0,0 0,0% EBITDA adj* 24,3 48,6-49,9% * EBITDA Adj, includes TV rights consumption 31
32 4Q12 consolidated P&L account (II) 4Q12 4Q11 Var % EBITDA adj* 24,3 48,6 PPA amortisation (3) 2,0 2,0 0,0% Depreciation tangible assets & provisions (4) 1,2 2,2-42,8% Total Costs ( ) 235,8 233,3 1,1% EBIT 21,1 44,5-52,5% EBIT/NET REVENUES 8,2% 16,0% Equity Consolidated Results -2,7-18,8 n.a. Financial results -0,3 0,5 n.a. EBT 18,1 26,1-30,8% Income Taxes -8,8-15,7 n.a. Minority Interest 0,1-2,2 n.a. NET PROFIT 9,4 8,3 13,9% NET PROFIT ADJ.** 13,2 29,8-55,7% EPS 0,023 0,020 EPS Adjusted** 0,032 0,073 NET PROFIT/NET REVENUES 3,7% 3,0% NET PROFIT ADJ/NET REVENUES 5,1% 10,7% Millions * EBITDA Adj, includes TV rights consumption ** Adjusted Net profit excludes all impacts from non cash items like PPA amortization (on Cuatro and Digital+) 32


33 Mediaset España multiplexes advertising revenues Millions 4Q12 market share Others 4Q12 commercial strategy Audience Var % Seconds GRP (20 ) C/GRP s Revenues Var % 18,4% +0,2% -6,9% -0,6% ,3% +22,9% +7,7% -2,2% ,7% +30,5% -11,3% +23,3% ,4% +7,5% -1,7% -0,4% -19,9% 211,4m -20,2% Source: Kantar media and Publiespaña 33


34 24h Total individuals audience share * * Source: Kantar media * Data average February 1 st 26 th 34
35 24h Total individuals audience share * * * * Source: Kantar media * Data average February 1 st 26 th 35


36 MEDIASET s multichannel strategy: each channel delivers excellent results in its core target FDF: young adult s channel Boing: children s channel Divinity: ladies channel La7: young adult s channel Energy: men s channel Source: Kantar media Data: average audience January 1 st December 31 st 2012 TI: audience 24h total individuals 36

37 Programming mix in FY12 In house production vs. Library in terms of broadcasted hours Third party rights In house production 37


38 Programming mix in FY12 In house production vs. Library in terms of broadcasted hours FY11 FY12 42,0% Productions with independent companies FY12: 37,0% 26,0% Produced by Atlas & Mediaset Esp. FY12: 25,0% 31,9% FY12: 38,0% Productions with participating companies: La fabrica de la tele Mandarina Big Bang 38
39 Investor Relations Department Phone: Fax: inversores@telecinco.es WEB: Statements contained in this document, particularly the ones regarding any Mediaset España possible or assumed future performance, are or may be forward looking statements and in this respect they involve some risks and uncertainties. Mediaset España actual results and developments may differ materially from the ones expressed or implied by the above statements depending on a variety of factors. Any reference to past performance of Mediaset España shall not be taken as an indication of future performance. The content of this document is not, and shall not be considered as, an offer document or an offer or solicitation to subscribe for, buy or sell any stock. The shares of Mediaset España may not be offered or sold in the United States of America except pursuant to an effective registration statement under the U.S. Securities Act of 1933, as amended, or pursuant to a valid exemption from registration 39
40
1Q13 24h Audience share. 1Q13 financials. 1Q13 TV Advertising market share. 1Q13 1Q12 Var.
 1Q13 24h Audience share 1Q13 financials Millions 1Q13 1Q12 Var. Total net revenues 196,6 218,0-9,8% Total operating costs 173,5 193,6-10,4% EBITDA adj* 23,1 24,4-5,5% EBITDA margin 11,7% 11,2% EBIT 18,8
1H14 financials. 1H14 audience share. 1H14 market share. 24h Total individuals. 1H14 1H13 Var. +1.4pp. Millions
 1H14 financials 1H14 audience share +1.4pp 24h Total individuals Millions 1H14 1H13 Var. Total net revenues 468,0 427,0 9,6% Total operating costs 379,9 371,5 2,3% EBITDA adj* 88,1 55,5 58,6% EBITDA margin
1Q14 financials. 1Q14 audience share. 1Q14 market share. 24h Total individuals. +1.1pp. Millions. 1Q14 1Q13 Var.
 1Q14 financials 1Q14 audience share +1.1pp 24h Total individuals Millions 1Q14 1Q13 Var. Total net revenues 200,4 196,6 1,9% Total operating costs 173,5 173,5 0,0% EBITDA adj* 26,9 23,1 16,7% EBITDA margin
9M16 results presentation
 9M16 results presentation (January September) Madrid, October 26 th 2016 9M16 HIGLIGHTS 9M16 FINANCIALS 9M16 AUDIENCE SHARE 24h total individuals Million 9M16 9M15 Var. Total net revenues 711,7 674,7 5,5%
Better together! 1Q18 Results presentation. (January- March) Madrid, April 19 th 2018
 Madrid, April 19 th 2018") Better together! 1Q18 Results presentation (January- March) Madrid, April 19 th 2018 MEDIASET ESPAÑA 1Q18 RESULTS AT A GLANCE Million 1Q18 FINANCIALS 1Q18 1Q17 1Q18 AUDIENCE SHARE 24h total individuals
Better together! 1Q18 Results presentation (January- March) Madrid, April 19 th 2018 MEDIASET ESPAÑA 1Q18 RESULTS AT A GLANCE Million 1Q18 FINANCIALS 1Q18 1Q17 1Q18 AUDIENCE SHARE 24h total individuals
First half 2017 results presentation (January-June 2017) Madrid, July 26 th 2017
 Madrid, July 26 th 2017") First half 2017 results presentation (January-June 2017) Madrid, July 26 th 2017 MEDIASET ESPAÑA 1H17 RESULTS AT A GLANCE Million 1H17 AUDIENCE SHARE 1H17 FINANCIALS 24h total individuals 1H17 1H16 Var.
First half 2017 results presentation (January-June 2017) Madrid, July 26 th 2017 MEDIASET ESPAÑA 1H17 RESULTS AT A GLANCE Million 1H17 AUDIENCE SHARE 1H17 FINANCIALS 24h total individuals 1H17 1H16 Var.
GESTEVISION TELECINCO S.A.
 GESTEVISION TELECINCO S.A. SPAIN WINS ON TELECINCO COMPANY PRESENTATION Deutsche Bank European TMT Conference London, September 9-10 th 2010 1 GROUP ( million) 1H10 1H09 VAR. % Total Net Revenues ( mn)
January June Madrid July 29 th, 2015 CONTENTS:
 FIIRST HALF RESULTS January June 2015 Madrid July 29 th, 2015 CONTENTS: Financial and operating highlights 1. Profit and loss account 2. Cash flow generation 3. Summary balance sheet 4. Audience share
G E S T E V I S I Ó N T E L E C I N C O S. A First quarter results (January March) Madrid, May 8 th
 Madrid, May 8 th") G E S T E V I S I Ó N T E L E C I N C O S. A. 2008 First quarter results (January March) Madrid, May 8 th 2008 1 Leadership in Audience, Advertising and Profitability 1T 08 1T 07 VAR. % Total Net Revenues
G E S T E V I S I Ó N T E L E C I N C O S. A. 2008 First quarter results (January March) Madrid, May 8 th 2008 1 Leadership in Audience, Advertising and Profitability 1T 08 1T 07 VAR. % Total Net Revenues
FULL YEAR RESULTS January December 2013
 FULL YEAR RESULTS January December 2013 Madrid - February 27 th, 2013 CONTENTS: Financial and operating highlights 1. Profit and loss account 2. Cash flow generation 3. Summary balance sheet 4. Audience
9 months 2017 results presentation
 Better together! 9 months 2017 results presentation Madrid, October 18 th 2017 MEDIASET ESPAÑA 9M17 RESULTS AT A GLANCE Million 9M17 AUDIENCE SHARE 9M17 FINANCIALS 24h total individuals 9M17 9M16 Var.
2007 FIRST HALF RESULTS (January- June)
") G E S T E V I S I Ó N T E L E C I N C O S. A. 26th July 2007 2007 FIRST HALF RESULTS (January- June) 1 First Half 2007, Leadership in Audience, Advertising and Profitability 1H06 1H07 Var. % Audience Share,
G E S T E V I S I Ó N T E L E C I N C O S. A. 26th July 2007 2007 FIRST HALF RESULTS (January- June) 1 First Half 2007, Leadership in Audience, Advertising and Profitability 1H06 1H07 Var. % Audience Share,
January September 2015
 FIIRST NIINE MONTHS RESULTS January September 2015 Madrid 28th October, 2015 CONTENTS: Financial and operating highlights 1) Profit and loss account 2) Cash flow generation 3) Summary balance sheet 4)
G E S T E V I S I Ó N T E L E C I N C O S. A. 16th October 2007 COMPANY PRESENTATION
 G E S T E V I S I Ó N T E L E C I N C O S. A. 16th October 2007 COMPANY PRESENTATION 1 First Half 2007, Leadership in Audience, Advertising and Profitability 1H06 1H07 Var. % Audience Share, 9M07 20.3
2006 THIRD QUARTER RESULTS (January September)
") G E S T E V I S I Ó N T E L E C I N C O S. A. 24th October 2006 2006 THIRD QUARTER RESULTS (January September) 1 Highlights* of Third Quarter Results (January September) 2006 Total net revenues: 700.9
G E S T E V I S I Ó N T E L E C I N C O S. A. 24th October 2006 2006 THIRD QUARTER RESULTS (January September) 1 Highlights* of Third Quarter Results (January September) 2006 Total net revenues: 700.9
2004 FULL YEAR RESULTS
 G e s t e v i s i ó n T e l e c i n c o S. A. 1st March 2005 2004 FULL YEAR RESULTS (January December) Highlights of the year 2004 Total net revenues: 789.88 million ( + 22.8% vs. 2003) Cost control: Total
2004 First Half Results
 G e s t e v i s i ó n T e l e c i n c o S. A. 28th July 2004 2004 First Half Results Highlights of the First Half 2004 Record total net revenues: 403.9 million ( + 26.3%) Cost control: total costs 237.8
RESULTS YEAR 2007 (January December)
") RESULTS YEAR 2007 (January December) Madrid 28 February, 2007 CONTENTS: 1. Financial and operating highlights 2. Profit and loss account 3. Cash flow generation 4. Summary balance sheet 5. Audience share
RESULTS YEAR 2007 (January December) Madrid 28 February, 2007 CONTENTS: 1. Financial and operating highlights 2. Profit and loss account 3. Cash flow generation 4. Summary balance sheet 5. Audience share
GESTEVISION TELECINCO S.A. THE LEADING TV MEDIA GROUP IN SPAIN
 GESTEVISION TELECINCO S.A. THE LEADING TV MEDIA GROUP IN SPAIN December 21 st 2009 1 TRANSACTION SUMMARY Telecinco to acquire 100% of the business of Cuatro and 22% of Digital+ from Grupo Prisa Grupo Prisa
RESULTS FIRST QUARTER 2008 (January March) 1
 1") RESULTS FIRST QUARTER 2008 (January March) 1 Madrid 8 May, 2008 CONTENTS: 1. Financial and operating highlights 2. Profit and loss account 3. Cash flow generation 4. Summary balance sheet 5. Audience share
RESULTS FIRST QUARTER 2008 (January March) 1 Madrid 8 May, 2008 CONTENTS: 1. Financial and operating highlights 2. Profit and loss account 3. Cash flow generation 4. Summary balance sheet 5. Audience share
2015 Full Year Results Presentation. Milan, 22nd March 2016
 2015 Full Year Results Presentation Milan, 22nd March 2016 Broadcasting & Advertising ITALY FY 2015 Economic scenario & advertising market HIGHLIGHTS MACRO ECONOMIC KEY INDICATORS ARE SLIGHTLY BUT CONTINUOUSLY
Mediaset Roadshow. 18 th 21 st April 2016
 Mediaset Roadshow 18 th 21 st April 2016 FY 2015 Broadcasting & Advertising ITALY FY 2015 Economic scenario & advertising market HIGHLIGHTS MACRO ECONOMIC KEY INDICATORS ARE SLIGHTLY BUT CONTINUOUSLY IMPROVING
Fedele Confalonieri Chairman
 1 Fedele Confalonieri Chairman 2 MEDIASET GROUP P&L Consolidated Results (Euro ml.) 2008 2009 Net Consolidated Revenues 4,199.5 3,882.9 Operating Profit 983.6 601.5 Net Profit 459.0 272.4 Dividend per
AND THE WINNER IS G E S T E V I S I Ó N T E L E C I N C O S.A.
 AND THE WINNER IS G E S T E V I S I Ó N T E L E C I N C O S.A. 2006 Results Presentation Madrid, 2nd March 2007 Year 2006, Leadership in Audience, Advertising and Profitability Total Net Revenues ( mn)
2008 First Half Results Presentation. Milan, 31 st July 2008
 2008 First Half Results Presentation Milan, 31 st July 2008 1 Broadcasting 2 MEDIASET 24Hours Audience Share January-May 2007 2008 INDIVIDUALS 42.1% 40.9% 41.1% 40.5% COMMERCIAL TARGET (15-64 Years) 37.9%
2007 Full Year Results
 Antena 3 Group 2007 Full Year Results Madrid, 21 st February 2007 Legal Notice The information contained in this presentation has not been independently verified and is, in any case, subject to negotiation,
9M10 Results 12 November 2010
 Results 12 November 2010 Highlights for VOC brand strategy gradually showing up in numbers: market share gains: circulation gap of ABC to El Mundo
January- December 2009 Results. Grupo Prisa. Annual Results January- December February 19th // Investor Relations
 Grupo Prisa Annual Results January- December 2009 February 19th 2010 1 JANUARY- DECEMBER 2009 PRISA OBTAINED AN EBITDA OF 623.75 MILLION IN 2009. The operating profit (EBIT) reached 368.98 million. Net
2009 First Half Financial Results. September 2009
 2009 First Half Financial Results September 2009 Agenda Who we are Market trends Efficiency Enhancement Program 2009: 1st Half Results and EEP Update Details by Business Unit 2 RCS Positioning ITALY ITALY
Business Review & FY12 Financial Results
 Business Review & FY12 Financial Results Apr 12, 2013 www.dyh.com.tr Notice The financial statements are reclassed for presentation purposes, the CMB format is also available through ISE and DYH websites.
FY 2016 Results Presentation. Milan, 19 th April 2017
 FY 2016 Results Presentation Milan, 19 th April 2017 Advertising MEDIASET CONFIDENCE FY 2016 INDEXES Advertising CONSUMERS, revenues MANUFACTURERS growth & vs RETAILERS Total advertising market Total ad
1H 2017 Results Presentation. Milan, 26 th September 2017
 1H 2017 Results Presentation Milan, 26 th September 2017 Audience & Advertising gen-15 feb-15 mar-15 apr-15 mag-15 giu-15 lug-15 ago-15 set-15 ott-15 nov-15 dic-15 gen-16 feb-16 mar-16 apr-16 mag-16 giu-16
Q Results. Milano, May 14th 2014
 Q1 2014 Results Milano, May 14th 2014 Agenda Market Trends & Digital Business Q1 2014 Results Business Units Focus 2 Continued delivery of Plan Shift towards digital business Increasing weight of digital
RCS MediaGroup. Q Results. Mediobanca Italian CEO Conference Milan, June 25, 2015
 RCS MediaGroup Results Mediobanca Italian CEO Conference Milan, June 25, 2015 Agenda Highlights Market & Business Trends Results Business Units Back up 2 Delivery Report Profitability Continued improvement
RCS MediaGroup First Half Results. J.P. Morgan Italian Conference Milano, September 29, 2014
 RCS MediaGroup 2014 First Half Results J.P. Morgan Italian Conference Milano, September 29, 2014 Agenda Highlights Market & Business Trends 2014 First Half Results Business Units Focus 2 1H 2014 Delivery
2012: FIRST HALF RESULTS 25 July 2012
 2012: FIRST HALF RESULTS 25 July 2012 DISCLAIMER Statements contained in this document, particularly those concerning forecasts on future Groupe M6 performance, are forward-looking statements that are
2009 Nine Months Results. New York 23/24 November 2009
 2009 Nine Months Results New York 23/24 November 2009 Agenda Who we are Market trends Efficiency Enhancement Program 2009: Nine Months Results and EEP Update Details by Business Unit 2 RCS MediaGroup Positioning
Agenda. I. FY11 Highlights 4 II. Publishing 8 III. Broadcasting 13. V. Investments & Financing 24 VI. Outlook 27
 Business Review & FY11 Financial Results Apr 11, 2011 www.dyh.com.tr Notice The financial statements are reclassed for presentation purposes, the CMB format is also available through ISE and DYH websites.
Results for January - September November 2008
 Results for January - September 2008 11 November 2008 Unbeatable Position for Capturing Growth Financial strength and business strength Capacity for strategy execution Sound financial position Flexible
January-March 2010 Results. Grupo Prisa. Quarterly Results January- March th May, // Investor Relations
 Grupo Prisa Quarterly Results January- March 2010 13th May, 2010 1 JANUARY- MARCH 2010 PRISA OBTAINED AN EBITDA OF 144.47 MILLION IN THE FIRST QUARTER OF 2010 (+3.9%). THE OPERATING PROFIT (EBIT) INCREASED
RCS MediaGroup. First Half 2015 Results. Milan, August 25, 2015
 RCS MediaGroup First Half 2015 Results Milan, August 25, 2015 Agenda Highlights Market & Business Trends First Half 2015 Results Business Units Backup 2 1H 2015 Delivery Report Profitability Continued
TELECINCO'S BOARD OF DIRECTORS AGREES ON A CAPITAL INCREASE AND FIRES THE STARTING PISTOL FOR THE CREATION OF A MAJOR AUDIOVISUAL GROUP
 Madrid, 18 th November 2010 Today Telecinco our controlled company has disclosed the following press release: This document and its contents are not intended for investors in Australia, Canada, the US
ENVIABLE BALANCE SHEET
 Madrid, 24 June 2014 Following the sector s most successful IPO and its listing on the IBEX 35 six months later MEDIASET ESPAÑA IS CELEBRATING THE TENTH ANNIVERSARY OF ITS LISTING ON THE STOCK MARKET AS
First Half Results 2016
 First Half Results 2016 Grupo Media Capital, SGPS, S.A. NOTE: Free translation for information purposes only. In the event of discrepancies, the Portuguese language version prevails TVI 12th consecutive
Antena 3 Group First Quarter Results 26th April 2007
 Antena 3 Group 2007 First Quarter Results 26th April 2007 Legal Notice The information contained in this presentation has not been independently verified and is, in any case, subject to negotiation, changes
Roadshow Presentation October 2003
 Roadshow Presentation October 2003 Legal notice This presentation has been prepared by Antena 3 de Televisión S.A. (the Company) solely for use at the company presentation held in connection with the proposed
FY 2015 RESULTS PRESENTATION. Madrid, 29 th February 2016
 FY 2015 RESULTS PRESENTATION Madrid, 29 th February 2016 Disclaimer In addition to figures prepared in accordance with IFRS, PRISA presents non-gaap financial performance measures, e.g., EBITDA, EBITDA
Grupo PRISA. Quarterly results January-September 2006
 Grupo PRISA Quarterly results January-September 2006 October 20th 2006 NOTE 1 Prisa globally consolidates Sogecable since April 1, 2006. The consolidation of Sogecable changes significantly the Group s
1Q 2013 INVESTOR PRESENTATION
 1Q 2013 INVESTOR PRESENTATION APRIL 2013 FORWARD-LOOKING STATEMENTS The following discussion contains forward-looking statements, including those about Nielsen s outlook and prospects, in the meaning of
RCS MediaGroup FY Results. Milano, 19 Marzo, 2015
 RCS MediaGroup FY Results Milano, 19 Marzo, 2015 Agenda Highlights Market & Business Trends FY Results Outlook and Strategic Opportunities Business Units Back up 2 Delivery Report Profitability Ebitda
2014 HALF-YEAR RESULTS 29 July 2014
 2014 HALF-YEAR RESULTS 29 July 2014 DISCLAIMER Statements contained in this document, particularly those concerning forecasts on future M6 Group performance, are forward-looking statements that are potentially
MORGAN STANLEY TMT CONFERENCE
 MORGAN STANLEY TMT CONFERENCE Barcelona, Friday 16th November 2007 Ignacio Santillana, COO 1 : INDEX Grupo Prisa: - New issues. - Main highlights. Group Strategy. Business evolution update. 2 : GRUPO PRISA
Disclaimer. For further information, please contact our Investor Relations Department. Federica De Medici
 YE 2006 Results Disclaimer Statements contained in this document, particularly the ones regarding any RCS MediaGroup possible or assumed future performance, are or may be forward looking statements and
Deal Overview July 2013
 Deal Overview July 2013 Executive Summary SPT Networks has an opportunity to acquire Chellomedia s (a subsidiary of Liberty Global) operating business unit in the Latin America region, Chello Latin America
COFINA, SGPS, S.A. Public Company
 COFINA, SGPS, S.A. Public Company Head Office: Rua do General Norton de Matos, 68, r/c Porto Fiscal Number 502 293 225 Share Capital: 25,641,459 Euros ANNUAL FINANCIAL INFORMATION FY15 (Unaudited) The
Interim Financial Report as at 31st March 2017
 Interim Financial Report as at 31st March 2017 MEDIASET S.p.A. - via Paleocapa, 3-20121 Milan Share Capital Euros 614,238,333.28 fully paid up Tax Code, VAT number and inscription number in the Milan Enterprises
2012 Half-Year Results NextRadioTV Group. 25 July 2012
 2012 Half-Year Results NextRadioTV Group 25 July 2012 1 Contents 1. Introduction 3 2. Highlights 5 3. Presentation of results 14 4. Outlook 22 5. Appendices 31 2 1. Introduction 3 4 2. Highlights 5 Key
MEDIASET BOARD APPROVES THE GROUP S 2013 FINANCIAL STATEMENTS
 PRESS RELEASE MEDIASET BOARD APPROVES THE GROUP S 2013 FINANCIAL STATEMENTS In an economic climate that remains negative, the Mediaset Group generated cash, produced profit and reduced its indebtedness
Grupo PRISA. January-June 2006 Results
 Grupo PRISA JanuaryJune 2006 Results July 24, 2006 JanuaryJune 2006 Results NOTA 1 Prisa globally consolidates Sogecable since April 1, 2006. The consolidation of Sogecable changes significantly the Group
1H16 Results 26 July 2016
 Results 26 July 2016 1 Disclaimer This document contains forward-looking statements regarding intention, expectations or estimates of the Company or its management at the date of issue thereof, relating
The leading European entertainment network
 The leading European entertainment network Agenda INTRODUCTION Business Review Financial Review Outlook The leading European entertainment network RTL Group Half year highlights 2011 REVENUE EUR 2.75 billion
GESTEVISION TELECINCO S.A. VII Seminario de Media. 19 de enero de 2010
 GESTEVISION TELECINCO S.A. VII Seminario de Media 19 de enero de 2010 1 GROUP ( million) 9M09 9M08 VAR. % Total Net Revenues ( mn) 432.2 734.9-41.2% Audience Share, Jan 1 st December 31 st 2009 16.4% 16.2%
1Q18 Results. Investors Presentation. Ernesto Mauri CEO Oddone Pozzi CFO. Segrate, 15 May 2018 GRUPPO MONDADORI
 1Q18 Results Investors Presentation Ernesto Mauri CEO Oddone Pozzi CFO Segrate, 15 May 2018 AGENDA 1. 1Q 2018 Results 2. 1Q 2018 Business 3. 1Q 2018 Headcount 4. FY 2018 Outlook Disclaimer Beginning from
Quarterly report as at 30 September 2012
 MEDIASET GROUP Quarterly report as at 30 September 2012 MEDIASET S.p.A. - via Paleocapa, 3-20121 Milan Share Capital Euros 614,238,333.28 fully paid up Tax Code, VAT number and inscription number in the
Resultados enero-marzo Quarterly Results January- September October 22nd //Información para accionistas e inversores
 Resultados enero-marzo 2007 Quarterly Results January- September 2007 October 22nd 2007 1 www.prisa.es //Información para accionistas e inversores JANUARY- SEPTEMBER 2007 January- September 2007 Results
ALNT ALANTRA PARTNERS SA 12.90/10.NOV.2017 MULTIPLY ABOUT COMPANY (BME:ALNT) CLASSIFICATION : INSTITUTIONAL BROKERAGE INVESTMENT RATIONALE KEY RISKS
 CLASSIFICATION : INSTITUTIONAL BROKERAGE INVESTMENT RATIONALE KEY RISKS") ALNT ALANTRA PARTNERS SA 12.90/10.NOV.2017 ABOUT COMPANY (BME:ALNT) Alantra Partners S.A. is an investment banking and asset management firm. The company is an independent financial advisor in mid-market
ALNT ALANTRA PARTNERS SA 12.90/10.NOV.2017 ABOUT COMPANY (BME:ALNT) Alantra Partners S.A. is an investment banking and asset management firm. The company is an independent financial advisor in mid-market
FY 2011 Results. February 28th, 2012
 FY 2011 Results February 28th, 2012 Disclaimer In addition to figures prepared in accordance with IFRS, PRISA presents non-gaap financial performance measures, e.g., EBITDA, EBITDA margin, adjusted EBITDA,
Deutsche Bank - 6 Italian Conference. Milano, 17 may 2005
 Deutsche Bank - 6 Italian Conference Milano, 17 may 2005 Disclaimer Statements contained in this document, particularly the ones regarding any RCS MediaGroup possible or assumed future performance, are
1H16 Results Investor Presentation
 1H16 Results Investor Presentation Ernesto Mauri, CEO Oddone Pozzi, CFO Segrate, July 28th 2016 AGENDA 1-1H16 Highlights 2-1H16 Results 3 - FY 2016 Outlook 1H16 Highlights Transformational deals Consolidated
First Quarter 2014 Results
 First Quarter 2014 Results Grupo Media Capital, SGPS, S.A. NOTE: Free translation for information purposes only. In the event of discrepancies, the Portuguese language version prevails Leader for the 10th
SPE has Built a Strong and Meaningful Networks Presence in India
 SPE has Built a Strong and Meaningful Networks Presence in India SPE launched its network presence in India 17 years ago with SET Between 2000-2007, SET faced multiple challenges In early 2009, new management
Vocento, S.A. and Subsidiaries. Results for January-March May 2016
 Vocento, S.A. and Subsidiaries Results for January-March 2016 11 May 2016 Breakdown of business areas of VOCENTO in 1Q16 El Correo La Verdad El Diario Vasco El Norte de Castilla El Diario Montañés Ideal
GESTEVISION TELECINCO S.A. NINE MONTHS RESULTS (January September) October 29 th 2009
 October 29 th 2009") GESTEVISION TELECINCO S.A. NINE MONTHS RESULTS (January September) October 29 th 2009 1 GROUP ( million) 9M09 9M08 VAR. % Total Net Revenues ( mn) 432.2 734.9-41.2% Total Operating Costs 343.3 405.5-15.3%
GESTEVISION TELECINCO S.A. NINE MONTHS RESULTS (January September) October 29 th 2009 1 GROUP ( million) 9M09 9M08 VAR. % Total Net Revenues ( mn) 432.2 734.9-41.2% Total Operating Costs 343.3 405.5-15.3%
The leading European entertainment network
 The leading European entertainment network Agenda INTRODUCTION o Business Review o Financial Review o Outlook The leading European entertainment network 2 RTL Group Full year highlights 2011 REVENUE EUR
The following information contains, or may be deemed to contain, "forward-looking statements" (as defined in the U.S. Private Securities Litigation
 Safe Harbor The following information contains, or may be deemed to contain, "forward-looking statements" (as defined in the U.S. Private Securities Litigation Reform Act of 995). Any statements about
William Blair Growth Stock Conference. June 13, 2012
 NLSN @ William Blair Growth Stock Conference June 13, 2012 Forward Looking Statements The following discussion contains forward-looking statements, including those about Nielsen s outlook and prospects,
GENERAL MEETING 3 MAY Arnaud Lagardère General and Managing Partner
 GENERAL MEETING 3 MAY 2018 Arnaud Lagardère General and Managing Partner CONTENTS 1 OUR MARKETS AND THEIR TRENDS 2 OUR GROUP TODAY 3 OUR STRATEGIC VISION AND AMBITION 2 OUR MARKETS AND OUR GROUP TODAY
MEDIASET ESPAÑA COMUNICACIÓN, S.A. Financial Statements and Management Report for the year ended December 31, 2017 TABLE OF CONTENTS
 MEDIASET ESPAÑA COMUNICACIÓN, S.A. Financial Statements and Management Report for the year ended December 31, 2017 TABLE OF CONTENTS 1. Balance sheet at December 31, 2017 2. Income statement for the year
MEDIASET S BOARD OF DIRECTORS APPROVES 2017 RESULTS
 PRESS RELEASE Mediaset Board of Directors Meeting 24 April 2018 MEDIASET S BOARD OF DIRECTORS APPROVES 2017 RESULTS Consolidated results Net revenues: 3,631.0 million Operating profit (EBIT): 316.5 million
Interim Results 9M th October
 Interim Results 9M 2012 29th October 2012 PRISA REACHED IN THE FIRST NINE MONTHS OF 2012 AN EBITDA OF 403.29 MILLION EUROS (+6.2%) Recurrent EBITDA was 408.77 million Euros (-3.4%) Education and Radio
NLSN 4Q and FY 2011 Investor Presentation
 NLSN 4Q and FY 2011 Investor Presentation Forward Looking Statements The following discussion contains forward-looking statements, including those about Nielsen s outlook and prospects, in the meaning
2016FY Results Presentation
 Presentation Rome, 9 th March 2017 1 FORWARD LOOKING STATEMENTS This presentation contains forward-looking statements regarding future events and the future results of Rai Way that are based on current
Quarterly Results 3Q 2015 October 2015
 Quarterly Results 3Q 2015 October 2015 GROUP RESULTS: JANUARY-SEPTEMBER 2015 Adjusted EBITDA increases by 22% until September, reaching 235 million Euros Strong operating growth driven by: The spanish
February 27, technicolor.com
 February 27, 2019 technicolor.com contains certain statements that constitute "forward-looking statements", including but not limited to statements that are predictions of or indicate future events, trends,
NINE ENTERTAINMENT CO. FY16 FINAL RESULTS
 NINE ENTERTAINMENT CO. FY16 FINAL RESULTS 25 August 2016: Nine Entertainment Co. (ASX: NEC) has reported the Company s final results for the 2016 financial year (FY16). On a Pro Forma basis, the Company
2017 GENERAL MEETING. Arnaud Lagardère General and Managing Partner. 4 May 2017
 2017 GENERAL MEETING Arnaud Lagardère General and Managing Partner 4 May 2017 CONTENTS 1 2 3 4 OUR MARKETS AND TRENDS OUR GROUP TODAY OUR VALUE CREATION STRATEGY OUR PERFORMANCE 5 OUR OUTLOOK 2 OUR MARKETS
2015 ANNUAL RESULTS February 2016
 2015 ANNUAL RESULTS February 2016 PRISA RETURNS TO PROFITABILITY. 5.3 MILLION EUROS NET PROFIT Adjusted EBITDA of 288.7 million (+10.3%) This operating growth is driven by: The growth of the business in
PRESS RELEASE. The Board of Directors Approves the Group s Report on Operations at March 31, 2009
 PRESS RELEASE This press release includes alternative performance indicators not considered under IFRS (EBITDA, Net Debt). These terms are defined in the appendix. The Board of Directors Approves the Group
INVESTOR PRESENTATION
 INVESTOR PRESENTATION IMPORTANT DISCLOSURE This presentation contains estimates and forward-looking statements made pursuant to the safe harbour provisions of the Private Securities Litigation Reform Act
1H18 Results. Investors Presentation. Ernesto Mauri CEO Oddone Pozzi CFO. Segrate, 31 July 2018 GRUPPO MONDADORI
 1H18 Results Investors Presentation Ernesto Mauri CEO Oddone Pozzi CFO Segrate, 31 July 2018 AGENDA 1. 1H 2018 Highlights 2. 1H 2018 Results 3. 1H 2018 Business 4. FY 2018 Outlook Disclaimer Beginning
Full Year Results 2016
 Full Year Results 2016 Grupo Média Capital, SGPS, S.A. NOTE: Free translation for information purposes only. In the event of discrepancies, the Portuguese language version prevails. TVI 12 th consecutive
Report on Operations in the first quarter of 2006
 Report on Operations in the first quarter of 2006 MEDIASET GROUP MEDIASET S.p.A. - via Paleocapa, 3-20121 Milan Share capital EUR 614,238,333.28 wholly paid-in Taxpayer s code, VAT number and registration
FY 2017 Results STAR Conference
 FY 2017 Results STAR Conference Investors Presentation Milan, 27 th and 28 th March 2018 Mondadori in a nutshell Business Books Retail Magazines Italy Magazines France Brands % on 2017 Group sales 2017
An Analysis of Liberty Acquisition/Grupo Prisa. Value Investing Congress October 13, 2010
 An Analysis of Liberty Acquisition/Grupo Prisa Value Investing Congress October 13, 2010 T2 Partners Management L.P. Manages Hedge Funds and Mutual Funds and is a Registered Investment Advisor The General
An Inflexion Point in the Company 1H 2015 RESULTS PRESENTATION. Madrid, 22 nd July 2015
 An Inflexion Point in the Company 1H 2015 RESULTS PRESENTATION Madrid, 22 nd July 2015 Disclaimer In addition to figures prepared in accordance with IFRS, PRISA presents non-gaap financial performance
MEDIASET ESPAÑA COMUNICACIÓN, S.A. AND SUBSIDIARIES
 MEDIASET ESPAÑA COMUNICACIÓN, S.A. AND SUBSIDIARIES for the year ended December 31, 2016, prepared in accordance with International Financial Reporting Standards (IFRS-EU) as adopted by the European Union,
Grupo PRISA JANUARY-MARCH 2003 RESULTS PRISA REVENUES AMOUNTED TO 304 MILLION, INCREASING BY 8.7% IN THE FIRST QUARTER OF THE YEAR
 Grupo PRISA JANUARY-MARCH 2003 RESULTS PRISA REVENUES AMOUNTED TO 304 MILLION, INCREASING BY 8.7 IN THE FIRST QUARTER OF THE YEAR DA came in at 40 milllion, a 0.4 increase over the same period of the previous
Resultados enero-marzo Quarterly results January- March th April //Información para accionistas e inversores
 Resultados enero-marzo 2007 Quarterly results January- March 2007 19th April 2007 1 www.prisa.es //Información para accionistas e inversores NOTE 1: GROUP STRUCTURE Grupo Prisa s activities are organized
Mediaset Group. Interim Financial Report as at 31 March 2014
 Mediaset Group Interim Financial Report as at 31 March 2014 MEDIASET S.p.A. - via Paleocapa, 3-20121 Milan Share Capital Euros 614,238,333.28 fully paid up Tax Code, VAT number and inscription number in