STAYING THE COURSE Annual Report
|
|
|
- Pauline Anderson
- 6 years ago
- Views:
Transcription


1 STAYING THE COURSE... gaining traction Annual Report
2 Premium Brands owns a broad range of leading branded specialty food businesses with manufacturing and distribution facilities located in British Columbia, Alberta, Saskatchewan, Manitoba, Ontario, Quebec, Washington State and Nevada. In addition, the Corporation owns proprietary food distribution and wholesale networks through which it sells both its own products and those of third parties to over 26,000 customers.
3 STAYING THE COURSE... gaining traction Annual Report MISSION 3 Highlights 5 Letter to ShareholderS 7 Management s Discussion & Analysis 24 INDEPENDENT AUDITOR S REPOrt 65 CONSOLIDATED FINANCIAL STATEMENTS 66 Notes to THE Consolidated Financial Statements 71 Investor InformatION 111

4 VARIETY

5 MISSION: To build a great food company through the acquisition and development of specialty branded food businesses and unique proprietary distribution networks. [3]

6 REVENUE for INCREASED by $259 million Earnings before taxes $18.7 million Free cash flow of $38.2 million sales INCREASED by 48% EBITDA for increased by $12.9 million ACQUISITION of PILLER S FINE FOODS GROWTH
7 HIGHLIGHTS (in 000s, except per share amounts) Revenue $ 794, 292 $ 535,243 $ 462,764 $ 449,363 $ 326,441 EBITDA $ 54,944 $ 41,999 $ 40,727 $ 40,626 $ 33,351 Earnings $ 13,099 $ 14,133 $ 18,857 $ 21,383 $ 25,488 Earnings per share $ 0.68 $ 0.79 $ 1.07 $ 1.22 $ 1.46 Total assets $ 614,913 $ 431,853 $ 349,622 $ 307,194 $ 285,654 Net funded debt $ 289,238 $ 177,277 $ 124,764 $ 117,338 $ 106,985 Return on net assets 13.1% 14.0% 14.6% 14.8% 15.8% Free cash flow $ 38,225 $ 32,205 $ 29,280 $ 29,631 $ 26,440 Free cash flow per share $ 2.04 $ 1.82 $ 1.66 $ 1.69 $ 1.52 Dividend declared per share $ $ $ $ $ Payout ratio 59.3% 65.3% 70.7% 69.5% 77.6% REVENUE (in 000s of $) EBITDA (in 000s of $) FREE CASH FLOW (in 000s of $) FREE CASH FLOW (per share) ($) 800,000 50,000 30, ,000 25, ,000 20, ,000 15, ,000 20,000 10, ,000 10,000 5, [5]


8 QUALITY

9 LETTER TO SHAREHOLDERS Staying the course Gaining traction was another successful year in terms of moving us closer to our goal of being Canada s leading specialty food company. Not only were we able to once again deliver solid returns for our shareholders, we were also able to complete a number of strategic initiatives, which firmly positions us to continue to deliver superior returns in the future. These initiatives, which I will discuss in more detail later, included four very strategic acquisitions and solidifying national footprints for several of our businesses. Over the last five years, an investment in Premium Brands has generated a compounded annual return of over 20% Between dividends and share price appreciation, our long-term shareholders earned a return on their Premium Brands shares of approximately 28% in. This compares to a drop of approximately 9% in the S&P/TSX Composite Index over the same time period. Over the last five years, an investment in Premium Brands has generated a compounded annual return of over 20% through a combination of dividends and capital appreciation, while the S&P/ TSX Composite Index has essentially been flat, generating an approximate compounded annual return of only 1%. In Premium Brands also continued to distribute a significant amount of cash to its shareholders, paying out over $21 million in dividends, representing a dividend rate of 29.4 cents per share per quarter or $1.176 per share for the year. Since declaring its first shareholder distribution in July 2005, Premium Brands has paid out over $130 million to its shareholders, which is greater than our market capitalization when we started to implement our specialty foods focused business plan in In terms of our financial performance in, we are generally pleased with our businesses results. As compared with, our sales increased by 48% to $794 million, our EBITDA increased by 31% to $54.9 million, our free cash flow increased by 19% to $38 million, and our dividend to free cash flow ratio (payout ratio) fell to 59%. More important, however, are the strategic initiatives we completed in, which have positioned us to generate an expected $75 million to $80 million in EBITDA in 2012, and correspondingly, higher free cash flow and a lower payout ratio. The list of benefits and attributes on Grimm s Fine Foods products is long, and that s because Grimm s focuses on what their customers want. They bring the fine art of yesterday s European foods and preparation methods to the table, and mix it with new world ingredients, standards and principles. Many of Grimm s meat products are gluten and lactose free, and all are made without the addition of by-products. Not only will customers find a great variety of Grimm s meat products offered at deli counters and grocery stores, they will also find the Grimm s name on fine cheeses, fresh pasta and sauces, salads, tortillas and wraps. With ingredients that are selected for their taste and quality, Grimm s Fine Foods are easy to choose - and easy to enjoy. [7]


10 GOURMET
11 Staying the Course Premium Brands beginnings trace back to 2001 when the current management team began selling the Company s legacy commodity based food businesses and reinvesting the capital in the specialty food space. Since then we have completed in excess of 45 acquisitions and our sales and EBITDA run rates have increased six fold and seven fold, respectively. Furthermore, we have established a number of leading business platforms, all of which are capitalizing on emerging consumer trends. On a national basis, our business platforms in the fresh and prepared sandwiches, deli meats and seafood categories are Canada s leaders. We also own Canada s only coast-to-coast refrigerated direct-to-store delivery (DSD) service to the convenience store industry. In terms of our legacy markets in western Canada and the U.S. Pacific Northwest, our businesses include western Canada s leading protein distributor to the foodservice industry, western Canada s leading artisan bakery, western Canada s leading distributor of products to the concessionary industry and the U.S. Pacific Northwest s fastest growing deli meats company. We also have investments in a number of smaller specialty food companies that are very well positioned to benefit from emerging consumer trends....there is a tremendous amount of diversity in what consumers are looking for in their food choices relative to just 10 or 15 years ago. In addition to acquisitions, we have also invested heavily in renewing our capital base and infrastructure. This investment has been focused on ensuring our operations are not only efficient, but also flexible enough to cater to the demands of our customers and the ever changing needs of today s consumers. As a result, our plants and operations tend to be smaller, but have lean overheads and feature state-of-the-art production lines and processes. The flexibility of our operations provides us with a distinct competitive advantage in the specialty food segment relative to larger food companies who typically have more rigidly designed production facilities focused on mass production. Consumers today are much more knowledgeable and demanding about their food choices. They also tend to live hectic life styles that are not conducive to the traditional home cooked family meals of the past. As a result there is a tremendous amount of diversity in what consumers are looking for in their food choices relative to just 10 or 15 years ago. Correspondingly, the old paradigm of large scale, long production run plants is becoming increasingly challenged in our industry. At Duso s, they care as much about the people as they do about the quality of food. The Duso Family has been working together for two generations to produce fresh pasta that they are proud to serve to their own families and offer to you. Duso s shares a responsibility to local markets, communities, and the environment. Duso s supports its community by buying local ingredients whenever possible, sponsoring little league teams, and contributing to the Food Bank. Duso s practices social responsibility and actively looks for ways to reduce its environmental footprint. Many food manufacturers test their inbound water because it is used in production. Duso s takes it a step further by testing outbound water as well, Duso s can ensure that it is not sending anything harmful back out into the environment. Duso s hopes to pass along its strong values of integrity to upcoming generations, who will continue the tradition of providing families with authentic, fresh, natural pasta and sauces. [9]


12 FRESH
13 A similar shift is happening in the foodservice segment where restaurant operators are looking for ways to differentiate themselves from their competitors by demanding customized product solutions. Again, the old paradigm of one standard fits all is quickly disappearing. We believe that our national network of smaller and more flexible manufacturing facilities, commissaries and custom portion cutting operations ideally positions us to provide relevant food solutions to our growing customer base. Combine these facilities with our differentiation based distribution networks, which access over 26,000 customers, and we are uniquely positioned to provide both food retailers and foodservice operators with complete product and service solutions that meet the demands of today s ever changing world. Whether it s from our new state-of-the-art artisan bakery in Langley, BC; our modern premium burger production facility in Calgary, AB; our modern custom portion cutting operations in Richmond, BC, Calgary, AB and Edmonton, AB; our state-of-the-art sandwich assembly plant in Reno, Nevada; or one of the state-of-the-art deli plants of our newly acquired Piller s business in Ontario, we are positioning Premium Brands as the go-to custom solution food provider for the specialty foods industry across Canada and the western U.S. We are now into our third five year plan since we began implementing our specialty food based strategies in 2001, and while our sales and cash flow targets have increased exponentially and our specific initiatives have continually evolved, the one constant has been our focus on nurturing a culture of entrepreneurship that promotes leadership, independent initiative, and accountability while rewarding performance. Similar to how we have built into our production related strategies the flexibility to adapt to a constantly changing consumer environment, our entrepreneurial based management strategies ensure our management teams are close to their markets, understand their customers, and can identify and react to new challenges and opportunities quickly and efficiently. In short, we are very well prepared for whatever direction the future takes....we are positioning Premium Brands as the go-to custom solution food provider for the specialty foods industry across Canada and the western U.S. Roger Paquette founded Hub City Fisheries, along with ten other investors (most of whom were fishermen themselves), in 1980 in Nanaimo, BC. Initially, Hub City Fisheries handled only one product the prized herring roe for a large Japanese trading company. Within a few years, the Hub brand became one of the premier names in the Japanese market. By 1986, the Paquette family had become the sole owners of Hub City Fisheries, and had expanded their product line to include other fish species. At present, they are fully diversified in the west coast fishery: they lead the retail market in fresh hand-peeled shrimp meat for delis in B.C.; and also in troll caught sockeye salmon for the premier sushi market in Japan. Additionally, their halibut and cod markets continue to grow substantially each year, and they perform equally as well with many other fish species. [11]


14 SPECIALTY
15 Gaining Traction Looking forward, there were a number of initiatives undertaken in that are not yet fully reflected in our results and, correspondingly, illustrate some of our untapped potential. Piller s Fine Foods Acquisition In September we completed our largest, and likely most accretive, acquisition yet with the purchase of Ontario based Piller s Fine Foods. In addition to featuring an iconic and leading Canadian brand and having an excellent management team, Piller s owns and operates some of the top deli meats production facilities in North America. We are not aware of any other specialty deli company in North America that has invested more energy and capital in its operations and facilities than Piller s. Piller s business, which is primarily based in eastern Canada, combined with our market leading Grimm s deli meats business in western Canada, provides us with a national deli meats platform. Piller s business, which is primarily based in eastern Canada, combined with our market leading Grimm s deli meats business in western Canada, provides us with a national deli meats platform. This platform will feature two of Canada s top deli meats brands, modern and flexible production facilities located across Canada, and a talented and seasoned management team with tremendous depth. For 2012 we expect this acquisition to generate significant incremental EBITDA and free cash flow through a combination of its legacy business and through synergies with other divisions in our deli meats platform. We have already seen the launch of Piller s branded products in western Canada by our Grimm s sales and distribution organization, while Piller s facilities are gearing up to produce Grimm s branded products to be sold across Canada. In 1957, Wilhelm Huber opened a small butcher shop in Waterloo, ON using family recipes and traditional European meat processing methods. Two years later, his brothers, Edward and Heinrich, joined the company, which eventually became Piller s Sausages and Delicatessens Limited. From those humble beginnings, Piller s grew to become one of North America s largest producers of European sausages and delicatessen meats, famous for award-winning products, such as Black Forest ham and air-dried salamis. To this day, after five generations of sausage makers, Piller s continues to be a family operated business that still uses the same natural aging, curing, and smoking processes that had customers lining up outside Wilhelm Huber s butcher shop 50 years ago. [13]

16 CONVENIENCE
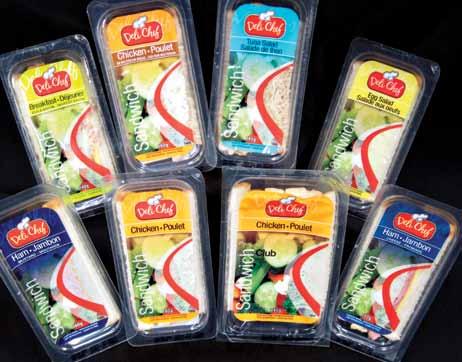
17 Les Aliments Deli Chef Acquisition In early we acquired Deli Chef from a large Canadian multinational food company. At the time of the purchase Deli Chef had two sandwich manufacturing facilities: one in Gatineau, QC and the other in Toronto, ON; a central distribution centre in Laval, QC; a 14 truck convenience store DSD network in southern Ontario; and a 44 truck convenience store DSD network in Quebec. Prior to the transaction, Deli Chef had fallen on hard times and was incurring significant losses. During we made a number of changes to Deli Chef s business including merging its DSD networks with our Direct Plus DSD network, which resulted in the creation of a national DSD platform for the convenience store industry. We also closed its significantly underutilized Gatineau sandwich plant and transferred its production to our Toronto and Edmonton based sandwich facilities, thereby creating an efficient and effective national sandwich platform. By the latter part of Deli Chef was back on track and beginning to generate positive EBITDA....the new Deli Chef facility...will feature the most advanced food safety and packaging technology standards in the industry. For 2012 we still have a few enhancements to make to Deli Chef s business, including the recently announced construction of a new 20,000 square foot state-of-the-art sandwich production facility that will be adjacent to its central distribution facility in Laval, QC. This facility is due to be operational in the summer of 2012 and will feature the most advanced food safety and packaging technology standards in the industry. Overall, we remain very confident that Deli Chef will meet the objectives we set when it was acquired. Les Aliments Deli Chef originated in Quebec in 1982 under the name Les Aliments Martel. In January 2008, Les Aliments Mar-tel was sold to a large Canadian corporation. In February, it became Les Aliments Deli Chef, a division of Premium Brands Holdings Corporation. Known commonly as Deli Chef, it manufactures sandwiches, subs, and pitas, and also distributes snacks: biscuits, muffins, strudels, Audrey pastries, buns, Danishes, donuts, cakes, tarts, brownies, cheese products and granola bars. The diversity of Deli Chef s products enables it to respond effectively to the demands of extensive markets in Ontario, Quebec and the Maritimes. Deli Chef currently employs over 160 employees in four different facilities located in Ontario and Quebec. It serves over 5,400 clients, including large format stores, gas stations, and convenience stores. Deli Chef also supplies its products to the Canadian Army. [15]


18 EXPERIENCE
19 Because you never know when your inner meatatarian will strike. Pridcorp Acquisition At the end of we acquired the business of Preferred Regional Independent Distributors Corporation (Pridcorp). At the time of the acquisition Pridcorp oversaw a network of 41 regional independent DSD distributors to the convenience store industry, which was the only DSD network of any significance competing with our Direct Plus DSD network. The Pridcorp transaction will play a major part in getting the Direct Plus business back on track in In conjunction with this purchase, we entered into exclusive distribution agreements with 25 of the independent distributors that had been part of Pridcorp s DSD network and began integrating these distributors into our Direct Plus DSD network. We are well into this process, which once complete, will result in a number of benefits in 2012 including: access to new convenience store markets in eastern Canada that Direct Plus DSD did not previously service; lower critical mass in a number of regions through route consolidation; and expanded product offerings on our corporate Direct Plus trucks of products previously distributed exclusively by the Pridcorp DSD network. Our Direct Plus business has been struggling in recent years due to reduced consumer demand in the convenience store channel as a result of a range of issues including: a weak economic environment; rising fuel costs; pay at the pump legislation; and changing consumer needs. The Pridcorp transaction will play a major part in getting the Direct Plus business back on track in Why McSweeney s? Because McSweeney s offers meat snacks that are perfect on the go or at home. Because McSweeney s is Canadian and proud of it. Because McSweeney s meat snacks are naturally smoked and come in a variety of gluten free options. Because McSweeney s knows you work hard and play harder, and deserve a premium meat snack. [17]


20 ARTISAN
21 New Artisan Bakery During our Stuyver s bakery group initiated the construction of a new state-of-the-art artisan bread and bun bakery. This facility, which is set to begin commercial production in April 2012, will be unique to Canada and will combine a craftsman s approach to baking with the scale and efficiencies needed to meet the demands of larger retail and foodservice customers. The bakery is engineered for flexibility and will enable Stuyver s to provide customized product solutions to its customers. The bakery is engineered for flexibility and will enable Stuyver s to provide customized product solutions to its customers. Furthermore, its design incorporates the technology and freezing capacities needed to expand Stuyver s geographic reach into central Canada and the U.S. New Premium Burger Facility In mid- our Centennial Foodservice group completed construction of a state-of-the-art premium burger production facility adjacent to its custom cutting operation in Calgary, AB. This facility has significantly improved Centennial s ability to provide its customers with unique product solutions in the rapidly growing gourmet burger product category. These highlights are just a few of the many projects initiated by our various entrepreneurial management teams in that will drive growth in our top and bottom lines in future years and position us to continue to generate superior returns for our shareholders. The story of Stuyver s is one of new beginnings. The company s original founder began the business in 1985, with a humble start in a small 1,200 square foot bakery in North Vancouver, BC. Stuyver s slowly started to develop a reputation for respecting old world baking traditions and using original Dutch recipes. As of April 2012, Stuyver s brand new facility in Langley, BC enables it to take a craftsman s approach to baking bread, while harnessing state-ofthe-art technology to create unique-looking products, keep pace with the demand of large-scale customers, and most importantly, ensure that it gets the same high-quality output from every batch it produces. The philosophy underlying Stuyver s new facility is that great bread is the result of carefully controlling every step of the baking process. [19]


22 PEOPLE
23 Summary In conclusion, I would like to thank all of our employees for their dedication and hard work. As I have said many times, our biggest and most important competitive advantage is our talented and hardworking people. I would also like to thank our long-term shareholders for their ongoing support. We fully understand that our primary objective as managers of your capital is the creation of shareholder value. Looking forward, we can t promise you a 28% return every year, but we do expect to continue to deliver above average returns by staying the course and by balancing the pursuit of profitable growth opportunities while diligently managing the risks inherent in our business. Sincerely, George Paleologou President and CEO [21]


24 COMMUNITY
25 COMMUNITY & SUSTAINABILITY Community Involvement As part of Premium Brands strategy: 34% of donations went towards charities that focused on helping youth and family 66% of donations were geared towards charitable organizations that promote sports & entertainment Donated to over 50 local charities across Canada Supported two national charities: the Children s Miracle Network and the Prostate Cancer Society. Global Resources Initiative (GRI) The GRI reporting framework is a standardized version of sustainability reports that enables organizations to report on identical indicators. The eleven GRI s that have been chosen fall under the Economic, Environmental, and Labour Practices categories. Premium Brands will formulate dashboards to report these metrics to its stakeholders. Energy Audits Keystone Environmental has been conducting baseline energy audits at Premium Brands from which they will recommend energy reducing solutions, cost savings options, and a template to better track usage. They have found that divisions like Made-Rite have reduced energy consumption by unit of production by 51%, Hempler s by 38% and Noble House by 12%. Moving forward the focus of 2012 will be to see more reductions throughout all of the divisions of Premium Brands. Fleet Management With the newly added division, National DSD (Direct Service Distribution), Premium Brands has restructured the fleet to meet stricter emission standards. By summer 2012, 60% of the national DSD fleet will meet 2007 emission standards while 40% will meet emission standards. emission standards call for less emission coming out of exhaust tailpipes from engine idle than pollutants found in ambient air in most downtown cities. Priorities for the Year 2012 Reduce energy usage and costs while maintaining efficiency by hiring an energy manager who will be available to all the divisions at Premium Brands. Reduce electricity/water/gas usage and lower costs by using the baseline analysis from the Premium Brands energy audits. Create a dashboard for measuring our strategy and attacking pending issues in all business aspects (Quality Assurance, Human Resources, Operations) through Global Resource Initiative (GRI) reporting. Implement a purchasing policy for Centennial Foodservice as requested by our customers and suppliers. The policy will be used to make sustainable purchasing decisions, and, in turn, reduce costs. Increase corporate giving initiatives by focusing on national organizations (Canadian Cancer Society, Children s Miracle Network) while continuing to support local communities and charities. 40% of corporate giving will be directed towards youth & family. For every $1 that Premium Brands contributes, $2 will be raised by the charity through their event (a 2% increase from ). For every $1 that Premium Brands contributes, $1.04 will be raised by the employees of Premium Brands for the charity (a 2% increase from ). [23]
26 MANAGEMENT S DISCUSSION & ANALYSIS For the 14 and 53 Weeks Ended December 31, The following Management s Discussion and Analysis (MD&A) is a review of the financial performance and position of Premium Brands Holdings Corporation (the Company or Premium Brands), formerly known as Premium Brands Income Fund (the Fund), and is current to March 14, It should be read in conjunction with the Company s audited consolidated financial statements and the notes thereto, which are prepared in accordance with International Financial Reporting Standards (IFRS). These documents, as well as additional information on the Company and the Fund, are filed electronically through the System for Electronic Document Analysis and Retrieval (SEDAR) and are available online at All amounts are expressed in Canadian dollars except as noted otherwise. BUSINESS OVERVIEW Premium Brands is a food focused holding company investing in: Manufacturers and wholesalers of specialty food products with strong proprietary brands and leading niche market positions. Specialty food products are food products that are purchased by consumers based primarily on factors other than price, such as quality, convenience, product consistency, health and/or lifestyle. Examples of its specialty food products include meat snacks such as pepperoni, beef jerky and kippered beef; snack foods such as fresh and individually wrapped pastries and cookies; concession products such as popcorn, hot and frozen beverage supplies and ice cream accessories; fresh and pre-packaged sandwiches; delicatessen items such as European-style deli meats; cheeses, fresh salads, wraps and specialty crackers; and premium smoked sausages. The Company s focus on this segment of the food industry is based on the ability of specialty food companies, in general terms, to earn higher and more consistent selling margins and to avoid competing with major food manufacturers that produce and distribute mainstream food products on a larger scale. Differentiated food distribution businesses. Differentiated food distribution businesses are businesses that provide customers with unique services (such as in-store merchandising, product promotions, equipment leasing and equipment servicing) and product solutions (such as exclusive branded products and custom portion cutting) in addition to the normal logistical solutions provided by a distribution business. The Company s current distribution businesses service approximately 26,000 customers, including convenience stores, gas bars, restaurants, delicatessens, small specialty grocery chains, hotels and institutions, across most of Canada. The Company s focus on this segment of the food industry is based on the ability of these companies, in general terms, to generate higher margins by differentiating themselves from distributors who are primarily focused on logistics. In addition, by owning these differentiated distribution businesses the Company is able to generate and sustain additional margin by providing its specialty food manufacturing businesses with proprietary access to a diversified customer base. SELECT ANNUAL INFORMATION The following is a summary of select annual consolidated financial information. All amounts, except EBITDA and RONA, are derived from the Company s audited consolidated financial statements for each of the three most recently completed financial years and are prepared in accordance with either IFRS for amounts relating to the fiscal years December 31, and December 25, ; or Canadian generally accepted accounting principles (GAAP) for amounts relating to the fiscal year December 26, [24]
27 The calculation of RONA is shown below. See Results of Operations for the calculation of EBITDA (in millions of dollars except per share amounts) 53 weeks Dec 31, 52 weeks Dec 25, 52 weeks Dec 29, 2009 Revenue EBITDA Earnings before acquisition transaction costs, restructuring costs and income taxes Earnings (1) Basic earnings per share (1) Diluted earnings per share (1) Total assets Long-term financial liabilities (2) RONA 13.1% 14.0% 14.6% Dividends / distributions declared per share / unit (1) See note 3 of the Company s audited consolidated financial statements for a discussion on the differences between IFRS and GAAP. (2) Excludes deferred financing costs and puttable interest in subsidiaries. Revenue and Earnings The Company has consistently grown its revenue over the last three years through a combination of acquisitions and organic growth initiatives (see Results of Operations Revenue). The Company has also continued to grow its EBITDA over the last three years, however, at a lower rate due primarily to: (i) the impact of record high costs in and for food commodities used in the production of certain finished goods (see Results of Operations Gross Profit); and (ii) the acquisitions of Deli Chef and SJ, both of which were generating negative EBITDA when the Company purchased them (see Liquidity and Capital Resources Corporate Investments). The Company s earnings over the last three years have been relatively volatile due to a number of factors including: (i) fluctuations in acquisition transaction and restructuring costs as these are event driven (see Liquidity and Capital Resources Corporate Investments and Results of Operations Restructuring Costs); (ii) the Company s 2009 consolidated financial statements being prepared in accordance with GAAP while its and consolidated financial statements were prepared in accordance with IFRS (see note 3 of the Company s audited consolidated financial statements); (iii) volatility associated with the fair market valuation of a variety of the Company s assets such as foreign currency and interest rate swap contracts, puttable interests in subsidiaries, and acquired businesses; and (iv) an unusual income tax provision recovery in resulting from the recognition of certain deferred tax assets (see Results of Operations Income Taxes Deferred Income Tax Provision). Total Assets The Company s consistent trend of increasing total assets reflects both its continuing investment in existing businesses as well as the acquisition of new specialty food manufacturing and differentiated food distribution businesses. Long-term Financial Liabilities The Company s consistent trend of increasing long-term financial liabilities is due to long-term debt being the primary funding source for its business acquisitions (see Liquidity and Capital Resources Corporate Investments) and project capital expenditures (see Liquidity and Capital Resources Capital Expenditures). In and, the Company invested $239.5 million in new businesses and project capital expenditures, $186.0 million of which was financed with debt. [25]
28 MANAGEMENT S DISCUSSION & ANALYSIS (continued) For the 14 and 53 Weeks Ended December 31, RONA Return on adjusted net assets (RONA) is not defined under IFRS and, as a result, may not be comparable to similarly titled measures presented by other publicly traded entities, nor should it be construed as an alternative to other earnings measures determined in accordance with IFRS. The Company believes RONA is a useful indicator of the performance of its operations relative to the assets employed. The following table provides the calculation of RONA for each of the last three fiscal years: (in thousands of dollars) 53 weeks Dec 31, 52 weeks Dec 25, 52 weeks Dec 29, 2009 Return: EBITDA (1) 54,944 41,999 40,727 Maintenance capital expenditures (2,880) (1,713) (2,026) 52,064 40,286 38,701 Average adjusted net assets (2) : Opening net assets 335, , ,637 Closing net assets excluding net assets of businesses acquired during the year 360, , ,952 Average net assets before including businesses acquired during the year (3) 347, , ,795 Weighted net assets of businesses acquired during the year (4) 48,752 27, , , ,795 RONA (5) 13.1% 14.0% 14.6% (1) See Results of Operations EBITDA. (2) Net assets are calculated as total assets less deferred income tax assets, accounts payable and accrued liabilities. (3) Calculated as the sum of the opening net assets and the closing net assets (excluding net assets of businesses acquired during the year) divided by two. (4) Based on weighting the net assets of each business acquired during the current fiscal year by a factor based on the number of days in the fiscal year that the Company owned the applicable business in relation to the total number of days in the fiscal year. (5) Calculated as return divided by average adjusted net assets. The Company s RONA over the last five years has averaged 14.5% which is near its long term targeted rate of 15%. In the Company s RONA fell to 13.1% primarily due to: (i) the acquisitions of Deli Chef and SJ, both of which were generating negative cash flow when the Company purchased them; (ii) the impact of record high costs for a variety of input commodities on the selling margins of several of the Company s businesses (see Results of Operations Gross Profit); and (iii) below normal performance of the Company s distribution businesses operating in the convenience store and restaurant channels due to an overall weaker than average economic environment in western Canada (see Results of Operations Revenue). Excluding Deli Chef and SJ, the Company s RONA for was 13.7%. [26]
29 RESULTS OF OPERATIONS The Company reports on two reportable segments, Retail and Foodservice, as well as corporate costs (Corporate). The Retail segment includes the Company s specialty food manufacturing businesses (such as Harvest, Grimm s, Hygaard, Quality Fast Foods, Hempler s, Made-Rite Meats, Creekside, Stuyver s, Duso s, SK Food Group, Deli Chef, SJ Irvine and Piller s) and its Direct Plus Food Group s retail distribution businesses. The Retail segment s external sales are primarily to: (i) retailers, including delicatessens, small specialty grocery chains, convenience stores, gas bars, large national and regional grocery chains and warehouse clubs; and (ii) cafés selling convenience type grab-and-go foods such as fresh pre-made sandwiches and pastries. The Foodservice segment includes the Company s Centennial Foodservice, B&C Food Distributors, Harlan Fairbanks, Worldsource, E1even, Wescadia (formerly South Seas), Maximum Seafood and Hub City Fisheries businesses. With the exception of Worldsource, Maximum Seafood and Hub City Fisheries, all of these businesses are primarily focused on foodservice customers such as restaurants, concessions, bars, caterers, hotels, recreation facilities, schools and hospitals. With respect to Maximum Seafood and Hub City Fisheries, these businesses have been included in the Foodservice segment on the basis that (i) many of their customers are distributors who sell their products to foodservice customers; and (ii) these businesses are working closely with Centennial Foodservice and B&C Food Distributors in the implementation of the Company s national seafood strategies. With respect to Worldsource, it has been included in the Foodservice segment on the basis that it is substantially integrated, particularly with respect to the procurement of raw materials, with Centennial Foodservice. Corporate consists primarily of the Company s head office activities, including strategic leadership, finance and information systems. Extra Week of Operations The Company s fiscal year ends on the last Saturday of the calendar year. As a result its fiscal year is generally 52 weeks, however, every five to six years the Company has a fiscal year that is 53 weeks due to the calendar year being slightly longer than 52 weeks. In the Company s fiscal year was 53 weeks resulting in an extra week of operations as compared to. The Company estimates the impact of the extra week of operations on its sales and EBITDA to be $15.6 million ($11.9 million if recent acquisitions are excluded) and $0.1 million, respectively. The nominal impact on the Company s EBITDA relative to the higher sales impact is due to: (i) the year-end holiday season and generally poor weather in December resulting in the extra week being a relatively poor sales week; and (ii) despite the poor sales week the Company still incurred a full week of costs for items such as plant, sales, distribution and administrative overhead. [27]
30 MANAGEMENT S DISCUSSION & ANALYSIS (continued) For the 14 and 53 Weeks Ended December 31, Revenue (in thousands of dollars except percentages) Revenue by segment: 14 weeks Dec 31, % (1) 13 weeks Dec 25, % (1) 53 weeks Dec 31, % (1) 52 weeks Dec 25, Retail 157, % 76, % 442, % 248, % Foodservice 92, % 79, % 352, % 287, % Consolidated 250, % 155, % 794, % 535, % (1) Expressed as a percentage of the corresponding segment s revenue % (1) Retail s revenue for the fourth quarter of as compared to the fourth quarter of increased by $81.4 million or 106.5% due to: (i) the acquisitions of SK Food Group in the fourth quarter of, Deli Chef in the first quarter of, SJ in the second quarter of and Piller s in the third quarter of (see Liquidity and Capital Resources Corporate Investments) which resulted in $68.8 million in incremental sales for the quarter; (ii) organic growth of $9.1 million representing an organic growth rate of approximately 11.9%; and (iii) $5.0 million in incremental sales in Retail s legacy businesses resulting from an extra week of operations in (see Results of Operations Extra Week of Operations). Partially offsetting these increases was the loss of approximately $1.5 million in sales of third party products sourced in the U.S. due to suppliers choosing to directly market these products to Canadian retailers. Retail s strong organic growth for the quarter, which was well above the Company s targeted range of 6% to 8%, was partly due to a $6.4 million increase in frozen wrap and breakfast sandwich sales driven in part by a very successful fall promotion with a major café chain. Retail s sales to convenience stores, which have been contracting on a year over year comparative basis for the last couple of years, were flat for the quarter as an improved economic environment, particularly in western Canada, helped to offset the negative impact that several factors, including record high gas prices, are having on consumer spending in this channel. Retail s revenue for increased by $194.2 million or 78.3% as compared to primarily due to: (i) the acquisitions of Duso s and SK Food Group in and Deli Chef, SJ and Piller s in, which resulted in incremental sales of $184.9 million; (ii) organic growth across a range of products and customers of $9.3 million representing an organic growth rate of approximately 3.7%; and (iii) $5.0 million in incremental sales in Retail s legacy businesses resulting from an extra week of operations in (see Results of Operations Extra Week of Operations). Partially offsetting these increases was: (i) a $1.9 million decrease in revenue in the first quarter of due to one-time sales in resulting from the Company s involvement with the Vancouver Winter Olympics; and (ii) the loss of approximately $3.1 million in sales of third party products sourced in the U.S. due to suppliers choosing to directly market these products to Canadian retailers. Retail s low organic growth rate for, which was below the Company s targeted range of 6% to 8%, was primarily due to: (i) lower sales of barbeque focused products during the first two quarters of due to extremely poor weather across western Canada; and (ii) a $3.0 million decrease in sales to convenience stores in the first three quarters of due to reduced consumer spending in this channel that was the result of a variety of factors including continued consumer concerns about the uncertainty of the economic environment and record high gas prices. [28]
31 Looking forward (see Forward Looking Statements), the Company expects Retail s organic growth rate for 2012 to be within its targeted range of 6% to 8%. This is based on a number of assumptions including: (i) the successful implementation of a variety of new product and new customer based initiatives; (ii) the continuation of the positive trends the Company is seeing with respect to consumer spending in the convenience store channel; (iii) the successful integration of independent distributors from the Pridcorp Network (see Liquidity and Capital Resources Corporate Investments Pridcorp Acquisition) into Retail s convenience store DSD network; and (iv) limited price inflation based on the cost of most of the food commodities used by Retail, many of which rose to record levels in, stabilizing in Foodservice s revenue for the fourth quarter of as compared to the fourth quarter of increased by $13.2 million or 16.6% due to: (i) $6.3 million in incremental sales in Foodservice s legacy businesses resulting from an extra week of operations in (see Results of Operations Extra Week of Operations); (ii) organic growth of $5.2 million representing an organic growth rate of 7.0%; and (iii) the acquisition of Hub City Fisheries in the fourth quarter of which resulted in $1.9 million in incremental sales. These increases were partially offset by a $0.2 million decrease in Worldsource s food brokerage sales due to reduced trading opportunities. Foodservice s organic growth, which was within the Company s targeted range of 6% to 8%, was driven by a combination of: (i) higher sales to its core hotel, restaurant and institutional customers as a result of several factors including improved consumer spending in this channel; and (ii) increased wholesale seafood sales resulting partially from a competitor in the Greater Toronto Area shutting down its business. Foodservice s revenue for as compared to increased by $64.8 million or 22.6% due to: (i) the acquisitions of Maximum Seafood and Hub City Fisheries in which resulted in $41.9 million in incremental sales; (ii) organic growth of $17.2 million representing an organic growth rate of 6.4%; (iii) $6.3 million in incremental sales in Foodservice s legacy businesses resulting from an extra week of operations in (see Results of Operations Extra Week of Operations); and (iv) increased Worldsource sales of $0.1 million. These increases were partially offset by a $0.7 million decrease in revenue due to one-time sales in the first quarter of resulting from the Company s involvement with the Vancouver Winter Olympics. Looking forward (see Forward Looking Statements) the Company expects Foodservice s organic growth rate for 2012 to be within its targeted range of 6% to 8%. This is based on a number of assumptions including: (i) a continuation of the positive trends the Company is seeing with respect to consumer spending in the foodservice channel; (ii) western Canada s economy continuing to improve; and (iii) some price inflation based on continuing increases in certain beef commodity inputs. Gross Profit 14 weeks % 13 weeks % 53 weeks % 52 weeks % (1) (1) (1) (1) Dec 31, Dec 25, Dec 31, Dec 25, (in thousands of dollars except percentages) Gross profit by segment: Retail 37, % 20, % 113, % 75, % Foodservice 16, % 14, % 66, % 56, % Consolidated 53, % 35, % 179, % 131, % (1) Expressed as a percentage of the corresponding segment s revenue Retail s gross profit as a percentage of its revenue (gross margin) for the fourth quarter of as compared to the fourth quarter of decreased primarily due to the acquisitions of SK Food Group in and SJ and Piller s in (see Liquidity and Capital Resources Corporate Investments) as these businesses generate lower average gross margins as compared to Retail s other businesses. [29]
32 MANAGEMENT S DISCUSSION & ANALYSIS (continued) For the 14 and 53 Weeks Ended December 31, Excluding SK Food Group, SJ and Piller s, Retail s gross margin (legacy gross margin) for the fourth quarter of improved slightly to 29.5% as compared to 29.1% in the fourth quarter of. While Retail s legacy gross margin did show some improvement during the quarter on a year over year basis, it is still below the Company s targeted range of 32% to 33% due to record high costs for a variety of input commodities including poultry, pork, beef, and flour. Retail s gross margin for as compared to decreased primarily due to: (i) the acquisitions of SK Food Group, SJ and Piller s; and (ii) a number of Retail s businesses being impacted for much of by rising costs for a variety of input commodities. Throughout the Company implemented a number of initiatives, including selling price increases and product packaging changes, to address the impact of higher costs on its margins. Excluding SK Food Group, SJ and Piller s, Retail s gross margin for was 30.6% as compared to 30.9% for. Looking forward (see Forward Looking Statements), for 2012 Retail expects its gross margin, after accounting for the impact of recent acquisitions, to trend towards its targeted range of 25% to 26% based on: (i) Retail s continuing implementation of a variety of margin enhancement initiatives, including targeted selling price increases, new product development, packaging changes and improving plant efficiencies; and (ii) the costs of some of the input commodities that have impacted its margins over the last year stabilizing, albeit at historically high levels. Foodservice s gross margin for the fourth quarter of as compared to the fourth quarter of was down slightly due to: (i) sales mix changes, namely increased sales of lower margin frozen seafood products; and (ii) continued record high costs for certain input commodities. Foodservice s gross margin for as compared to decreased primarily due to: (i) the acquisitions of Maximum Seafood and Hub City Fisheries part way through as these businesses generate lower average gross margins as compared to Foodservice s other businesses; and (ii) rising input costs for a variety of input commodities, in general, and for beef based products, in particular. Excluding Maximum Seafood and Hub City Fisheries, Foodservice s gross margin for was 18.7% as compared to 18.4% in. Looking forward (see Forward Looking Statements), Foodservice expects its gross margin to remain stable to slightly up for 2012 as compared to based on the benefits of its various margin improvement initiatives, which include selling price increases, improved operating efficiencies resulting from higher sales volumes and the introduction of a new hamburger patty program (see Liquidity and Capital Resources Capital Expenditures), being largely offset by increases in the cost of certain beef input commodities. Selling, General and Administrative Expenses (SG&A) (in thousands of dollars except percentages) SG&A by segment: 14 weeks Dec 31, % (1) 13 weeks Dec 25, % (1) 53 weeks Dec 31, % (1) 52 weeks Dec 25, Retail 25, % 12, % 72, % 44, % Foodservice 11, % 10, % 45, % 39, % Corporate 1,619 1,392 6,200 5,790 Consolidated 39, % 24, % 124, % 89, % (1) Expressed as a percentage of the corresponding segment s revenue % (1) [30]
33 Retail s SG&A in the fourth quarter of as compared to the fourth quarter of increased by $13.6 million primarily due to: (i) the acquisitions of SK Food Group in and Deli Chef, SJ and Piller s in (see Liquidity and Capital Resources Corporate Investments) which resulted in an increase of $12.4 million; (ii) incremental SG&A in Retail s legacy businesses resulting from an extra week of operations in (see Results of Operations Extra Week of Operations); and (iii) higher freight and fuel costs resulting from fuel price increases. These increases were partially offset by lower distribution costs resulting from the rationalization of certain areas of Retail s direct-to-store delivery network. Retail s SG&A for as compared to increased by $28.0 million primarily due to: (i) the acquisitions of Duso s and SK Food Group in and the acquisitions of Deli Chef, SJ and Piller s in which resulted in an increase in Retail s SG&A of $27.4 million; (ii) incremental SG&A in Retail s legacy businesses resulting from an extra week of operations in (see Results of Operations Extra Week of Operations); and (iii) higher freight and fuel costs resulting from fuel price increases. These increases were partially offset by: (i) a decrease in one-time costs associated with the Company s involvement in the Vancouver Winter Olympics in ; and (ii) lower distribution costs resulting from the rationalization of certain areas of Retail s direct-to-store delivery network. Excluding acquisitions, Retail s SG&A as a percentage of revenue for was approximately 19.0% as compared to 18.8% for. Foodservice s SG&A in the fourth quarter of as compared to the fourth quarter of increased by $0.9 million primarily due to: (i) incremental SG&A in Foodservice s legacy businesses resulting from an extra week of operations in (see Results of Operations Extra Week of Operations); (ii) the acquisition of Hub City Fisheries in the fourth quarter of which accounted for $0.1 million of the increase; and (iii) higher freight and fuel costs resulting from fuel price increases. Foodservice s SG&A for as compared to increased by $6.7 million primarily due to: (i) the acquisitions of Maximum Seafood and Hub City Fisheries in which accounted for $4.6 million of the increase; (i) incremental SG&A in Foodservice s legacy businesses resulting from an extra week of operations in (see Results of Operations Extra Week of Operations); (ii) the recognition in the second quarter of of a $0.5 million gain on the sale of a redundant property; and (iii) higher freight and fuel costs resulting from fuel price increases. Excluding acquisitions and the $0.5 million gain on the sale of a redundant property in the second quarter of, Foodservice s SG&A as a percentage of revenue for was approximately 13.9% as compared to 14.1% for. EBITDA EBITDA is not defined under IFRS and, as a result, may not be comparable to similarly titled measures presented by other publicly traded entities, nor should it be construed as an alternative to other earnings measures determined in accordance with IFRS. The Company believes that EBITDA is a useful indicator of the amount of normalized income generated by operating businesses controlled by the Company before taking into account its financing strategies, consumption of capital and intangible assets, taxable position and the ownership structure of non-wholly owned businesses. EBITDA is also used in the calculation of certain financial debt covenants associated with the Company s senior credit facilities (see Liquidity and Capital Resources Debt Financing Activities). [31]
PREMIUM BRANDS HOLDINGS CORPORATION. For the 13 and 26 Weeks Ended June 30, 2012
 PREMIUM BRANDS HOLDINGS CORPORATION Management s Discussion and Analysis For the 13 and 26 Weeks Ended June 30, 2012 The following Management s Discussion and Analysis (MD&A) is a review of the financial
PREMIUM BRANDS HOLDINGS CORPORATION ANNOUNCES FOURTH QUARTER RESULTS
 PREMIUM BRANDS HOLDINGS CORPORATION ANNOUNCES FOURTH QUARTER RESULTS VANCOUVER, B.C., March 13, 2014. Premium Brands Holdings Corporation (TSX: PBH), a leading producer, marketer and distributor of branded
PREMIUM BRANDS HOLDINGS CORPORATION ANNOUNCES FOURTH QUARTER 2014 RESULTS AND INCREASE IN DIVIDEND
 PREMIUM BRANDS HOLDINGS CORPORATION ANNOUNCES FOURTH QUARTER RESULTS AND INCREASE IN DIVIDEND VANCOUVER, B.C., March 12, 2015. Premium Brands Holdings Corporation (TSX: PBH), a leading producer, marketer
PREMIUM BRANDS HOLDINGS CORPORATION ANNOUNCES RECORD SECOND QUARTER 2017 RESULTS AND DECLARES THIRD QUARTER 2017 DIVIDEND
 PREMIUM BRANDS HOLDINGS CORPORATION ANNOUNCES RECORD SECOND QUARTER RESULTS AND DECLARES THIRD QUARTER DIVIDEND VANCOUVER, B.C., August 14,. Premium Brands Holdings Corporation (TSX: PBH), a leading producer,
PREMIUM BRANDS HOLDINGS CORPORATION ANNOUNCES 2009 SECOND QUARTER RESULTS
 PREMIUM BRANDS HOLDINGS CORPORATION ANNOUNCES 2009 SECOND QUARTER RESULTS VANCOUVER, B.C., August 6, 2009. Premium Brands Holdings Corporation (TSX: PBH), a leading producer, marketer and distributor of
PREMIUM BRANDS HOLDINGS CORPORATION
 PREMIUM BRANDS HOLDINGS CORPORATION Management s Discussion and Analysis For the 13 and 39 Weeks Ended September 30, 2017 The following Management s Discussion and Analysis (MD&A) is a review of the financial
PREMIUM BRANDS INCOME FUND ANNOUNCES RECORD SECOND QUARTER SALES AND EARNINGS
 PREMIUM BRANDS INCOME FUND ANNOUNCES RECORD SECOND QUARTER SALES AND EARNINGS VANCOUVER, B.C., August 6, 2008. Premium Brands Income Fund (TSX: PBI.UN), a leading producer, marketer and distributor of
PREMIUM BRANDS HOLDINGS CORPORATION ANNOUNCES RECORD THIRD QUARTER 2017 RESULTS AND DECLARES FOURTH QUARTER 2017 DIVIDEND
 PREMIUM BRANDS HOLDINGS CORPORATION ANNOUNCES RECORD THIRD QUARTER RESULTS AND DECLARES FOURTH QUARTER DIVIDEND VANCOUVER, B.C., November 14,. Premium Brands Holdings Corporation (TSX: PBH), a leading
PREMIUM BRANDS HOLDINGS CORPORATION ANNOUNCES RECORD SECOND QUARTER SALES AND EARNINGS AND DECLARES THIRD QUARTER DIVIDEND
 PREMIUM BRANDS HOLDINGS CORPORATION ANNOUNCES RECORD SECOND QUARTER SALES AND EARNINGS AND DECLARES THIRD QUARTER DIVIDEND VANCOUVER, B.C., August 13,. Premium Brands Holdings Corporation (TSX: PBH), a
PREMIUM BRANDS HOLDINGS CORPORATION
 PREMIUM BRANDS HOLDINGS CORPORATION Management s Discussion and Analysis For the 13 and 26 Weeks Ended June 30, 2018 The following Management s Discussion and Analysis (MD&A) is a review of the financial
PREMIUM BRANDS HOLDINGS CORPORATION
 PREMIUM BRANDS HOLDINGS CORPORATION Management s Discussion and Analysis For the 13 Weeks Ended March 31, The following Management s Discussion and Analysis (MD&A) is a review of the financial performance
PREMIUM BRANDS HOLDINGS CORPORATION ANNOUNCES RECORD FIRST QUARTER 2017 RESULTS AND DECLARES SECOND QUARTER 2017 DIVIDEND
 PREMIUM BRANDS HOLDINGS CORPORATION ANNOUNCES RECORD FIRST QUARTER RESULTS AND DECLARES SECOND QUARTER DIVIDEND VANCOUVER, B.C., May 15,. Premium Brands Holdings Corporation (TSX: PBH), a leading producer,
PREMIUM BRANDS INCOME FUND. First Quarter 2007
 PREMIUM BRANDS INCOME FUND Management s Discussion and Analysis First Quarter 2007 OVERVIEW Premium Brands owns a broad range of leading branded specialty food businesses with manufacturing and distribution
PREMIUM BRANDS HOLDINGS CORPORATION ANNUAL INFORMATION FORM
 PREMIUM BRANDS HOLDINGS CORPORATION ANNUAL INFORMATION FORM For the fiscal year ended December 30, 2017 March 14, 2018 Premium Brands Holdings Corporation Annual Information Form Table of Contents ABOUT
PREMIUM BRANDS HOLDINGS CORPORATION
 PREMIUM BRANDS HOLDINGS CORPORATION Interim Condensed Consolidated Financial Statements First Quarter Thirteen weeks and (Unaudited) NOTICE OF NO AUDITOR REVIEW OF INTERIM CONDENSED CONSOLIDATED FINANCIAL
PREMIUM BRANDS HOLDINGS CORPORATION
 PREMIUM BRANDS HOLDINGS CORPORATION Interim Condensed Consolidated Financial Statements Second Quarter Thirteen and twenty-six weeks and (Unaudited) NOTICE OF NO AUDITOR REVIEW OF INTERIM CONDENSED CONSOLIDATED
PREMIUM BRANDS HOLDINGS CORPORATION
 PREMIUM BRANDS HOLDINGS CORPORATION Interim Condensed Consolidated Financial Statements First Quarter Thirteen weeks and (Unaudited) NOTICE OF NO AUDITOR REVIEW OF INTERIM CONDENSED CONSOLIDATED FINANCIAL
PREMIUM BRANDS HOLDINGS CORPORATION
 PREMIUM BRANDS HOLDINGS CORPORATION Consolidated Financial Statements Fiscal Years Ended and March 12, 2014 Independent Auditor s Opinion To the Shareholders of Premium Brands Holdings Corporation We have
Chairman s Report to Unitholders
 Chairman s Report to Unitholders On behalf of the Trustees of the A&W Revenue Royalties Income Fund (the Fund), I am pleased to report the results of the year ended December 31, 2016. The Fund enjoyed
Premium Brands Income Fund. Consolidated Financial Statements December 31, 2008 and 2007 (in thousands of Canadian dollars)
") Consolidated Financial Statements (in thousands of Canadian dollars) PricewaterhouseCoopers LLP Chartered Accountants PricewaterhouseCoopers Place 250 Howe Street, Suite 700 Vancouver, British Columbia
Consolidated Financial Statements (in thousands of Canadian dollars) PricewaterhouseCoopers LLP Chartered Accountants PricewaterhouseCoopers Place 250 Howe Street, Suite 700 Vancouver, British Columbia
Dec. 31, Dec. 31, 2007 Change
 NEWS RELEASE George Weston Limited Provides Preliminary Unaudited Financial Update for the 2008 Fourth Quarter and Fiscal Year Ended December 31, 2008 (1). TORONTO, ONTARIO February 24, 2009 George Weston
PREMIUM BRANDS INCOME FUND. Second Quarter 2009
 PREMIUM BRANDS INCOME FUND Interim Consolidated Financial Statements Second Quarter 2009 Twenty-six weeks ended June 27, 2009 and June 28, 2008 (Unaudited) Premium Brands Income Fund NOTICE OF NO AUDITOR
Maple Leaf Foods Reports Results for Fourth Quarter TSX: MFI
 Maple Leaf Foods Reports Results for Fourth Quarter 2013 TSX: MFI www.mapleleaffoods.com TORONTO, Feb. 27, 2014 /CNW/ - Maple Leaf Foods Inc. (TSX: MFI) today reported its financial results for the fourth
High Liner Foods. Q Investor Presentation. February 2019
 High Liner Foods Q4 2018 Investor Presentation February 2019 Disclaimer Certain statements made in this presentation are forward-looking and are subject to important risks, uncertainties and assumptions
PREMIUM BRANDS HOLDINGS CORPORATION
 PREMIUM BRANDS HOLDINGS CORPORATION Interim Condensed Consolidated Financial Statements First Quarter Thirteen Weeks Ended March 31, and April 1, (Unaudited) NOTICE OF NO AUDITOR REVIEW OF INTERIM CONDENSED
PREMIUM BRANDS HOLDINGS CORPORATION. Third Quarter 2009
 PREMIUM BRANDS HOLDINGS CORPORATION Interim Consolidated Financial Statements Third Quarter 2009 Thirty nine weeks ended September 26, 2009 and September 27, 2008 (Unaudited) Premium Brands Holdings Corporation
Note: Adjusted Earnings per Share measures are defined as basic earnings per share adjusted for the impact of restructuring and other related costs.
 Maple Leaf Foods Inc. Management s Discussion and Analysis For the first quarter ended March 31, 2009 Financial Overview Financial and operational highlights for the first quarter include: Adjusted Earnings
Jefferies Consumer Conference June 2016
 Jefferies Consumer Conference SAFE HARBOR STATEMENT Safe Harbor Statement under the Private Securities Litigation Reform Act of 1995: Statements in this presentation regarding the business of The Chefs
Third Quarter 2018 Management s Discussion and Analysis November 6, 2018
 Third Quarter 2018 Management s Discussion and Analysis November 6, 2018 TABLE OF CONTENTS About Stuart Olson Inc.... 2 Third Quarter 2018 Overview... 4 Strategy... 6 2018 Outlook... 8 Results of Operations...
Report to Shareholders
 Year ended 2015 Report to Shareholders Management s Discussion and Analysis Q4 2015 Table of Contents 1. Financial and operating summary...3 2. Segment results... 10 3. Quarterly financial data... 22 4.
Pizza Pizza Limited Management s Discussion and Analysis
 Pizza Pizza Limited Management s Discussion and Analysis This Management s Discussion and Analysis ( MD&A ) of financial conditions and results of operations of Pizza Pizza Limited ( PPL ) covers the 13-week
Management s Discussion & Analysis
 Freshii Inc. Management s Discussion & Analysis For the 13 week period ended March 26, 2017 (Expressed in US Dollars) MANAGEMENT S DISCUSSION AND ANALYSIS OF FINANCIAL CONDITION AND RESULTS OF OPERATIONS
Third Quarter Report to Shareholders
 Third Quarter Report to Shareholders Thirteen and thirty-nine weeks ended MANAGEMENT'S DISCUSSION AND ANALYSIS For the thirteen and thirty-nine weeks ended (All amounts are in United States dollars unless
The Second Cup Ltd. Management s Discussion and Analysis
 CAUTION REGARDING FORWARD-LOOKING STATEMENTS Certain statements in this ( MD&A ) may constitute forward-looking statements within the meaning of applicable securities legislation. The terms the Company,
INVESTOR PRESENTATION Henry Demone, CEO; Paul Jewer, CFO Heather Keeler-Hurshman, Investor Relations. November 2014
 INVESTOR PRESENTATION Henry Demone, CEO; Paul Jewer, CFO Heather Keeler-Hurshman, Investor Relations November 2014 Disclaimer Certain statements made in this presentation are forward-looking and are subject
Quarterly Report to Shareholders George Weston Limited 24 Weeks Ended June 18, 2011
 Q2 2011 Quarterly Report to Shareholders George Weston Limited 24 Weeks Ended June 18, 2011 FORWARD LOOKING STATEMENTS This Quarterly Report for George Weston Limited ( GWL ) and its subsidiaries (collectively,
Maple Leaf Foods Investor Presentation Fourth Quarter and Fiscal 2007 Financial Results
 Maple Leaf Foods Investor Presentation Fourth Quarter and Fiscal 2007 Financial Results Some of the statements in this presentation may constitute forward-looking information and future results could differ
McCormick & Company, Inc.
 McCormick & Company, Inc. Bernstein Strategic Decisions Conference May 30, 2018 FORWARD-LOOKING INFORMATION Certain information contained in this release, including statements concerning expected performance
The Second Cup Ltd. Management s Discussion and Analysis
 The following ( MD&A ) has been prepared as of October 31, and is intended to assist in understanding the financial performance and financial condition of The Second Cup Ltd. ( Second Cup or the Company
PREMIUM BRANDS HOLDINGS CORPORATION. Consolidated Financial Statements
 PREMIUM BRANDS HOLDINGS CORPORATION Consolidated Financial Statements Fiscal Years Ended and March 15, 2018 Independent Auditor s Report To the Shareholders of Premium Brands Holdings Corporation We have
CARA OPERATIONS LIMITED Management s Discussion and Analysis For the years ended December 27, 2015 and December 30, 2014
 CARA OPERATIONS LIMITED Management s Discussion and Analysis For the years ended December 27, 2015 and December 30, 2014 The following Management s Discussion and Analysis ( MD&A ) for Cara Operations
RECIPE UNLIMITED CORPORATION (formerly Cara Operations Limited) Management s Discussion and Analysis For the 13 and 26 weeks ended July 1, 2018
 Management s Discussion and Analysis For the 13 and 26 weeks ended July 1, 2018") RECIPE UNLIMITED CORPORATION (formerly Cara Operations Limited) Management s Discussion and Analysis For the 13 and 26 weeks ended July 1, 2018 The following Management s Discussion and Analysis ( MD&A
RECIPE UNLIMITED CORPORATION (formerly Cara Operations Limited) Management s Discussion and Analysis For the 13 and 26 weeks ended July 1, 2018 The following Management s Discussion and Analysis ( MD&A
PREMIUM BRANDS HOLDINGS CORPORATION. Consolidated Financial Statements
 PREMIUM BRANDS HOLDINGS CORPORATION Consolidated Financial Statements Fiscal Years Ended and PwC refers to PricewaterhouseCoopers LLP, an Ontario limited liability partnership. Consolidated Balance Sheets
DOLLARAMA REPORTS STRONG RESULTS FOR FOURTH QUARTER AND FULL YEAR FISCAL 2017
 For immediate distribution DOLLARAMA REPORTS STRONG RESULTS FOR FOURTH QUARTER AND FULL YEAR FISCAL 24% increase in quarterly diluted net earnings per common share 10% increase in quarterly cash dividend
CARA OPERATIONS LIMITED Management s Discussion and Analysis For the 13 weeks ended April 1, 2018
 CARA OPERATIONS LIMITED Management s Discussion and Analysis For the 13 weeks ended April 1, 2018 The following Management s Discussion and Analysis ( MD&A ) for Cara Operations Limited ( Cara or the Company
Management s Discussion and Analysis of Financial Condition and Results of Operations of Sleep Country Canada Holdings Inc. 3 Overview...
 Management s Discussion and Analysis of Financial Condition and Results of Operations of Sleep Country Canada Holdings Inc. 1 Basis of Presentation... 1 2 Forward-looking Information... 1 3 Overview...
Investors: Michael D. Neese VP, Investor Relations (804)
") NEWS RELEASE For Immediate Release August 17, 2016 Investors: Michael D. Neese VP, Investor Relations (804) 287-8126 michael.neese@pfgc.com Media: Joe Vagi Manager, Corporate Communications (804) 484-7737
NEWS RELEASE For Immediate Release August 17, 2016 Investors: Michael D. Neese VP, Investor Relations (804) 287-8126 michael.neese@pfgc.com Media: Joe Vagi Manager, Corporate Communications (804) 484-7737
CARA OPERATIONS LIMITED Management s Discussion and Analysis For the 13 and 39 weeks ended September 24, 2017
 CARA OPERATIONS LIMITED Management s Discussion and Analysis For the 13 and 39 weeks ended September 24, 2017 The following Management s Discussion and Analysis ( MD&A ) for Cara Operations Limited ( Cara
NEWS RELEASE For Immediate Release March 19, 2019
 NEWS RELEASE For Immediate Release March 19, 2019 Investor Contact: Media Contact: Michael D. Neese Trisha Meade VP, Investor Relations Communications & Engagement Manager (804) 287-8126 (804) 285-5390
Investor Presentation June Henry Demone, CEO Kelly Nelson, CFO
 Investor Presentation June 2013 Henry Demone, CEO Kelly Nelson, CFO Disclaimer Certain statements made in this presentation are forward-looking and are subject to important risks, uncertainties and assumptions
Management s Discussion and Analysis of Financial Condition and Results of Operations of Sleep Country Canada Holdings Inc.
 Management s Discussion and Analysis of Financial Condition and Results of Operations of Sleep Country Canada Holdings Inc. 1 B a s is of P re se nt ation... 1 2 F o r w a r d - l o o ki n g I n f o r
THE POWER OF FIRST QUARTER REPOR T S ENDED AUGU
 THE POWER OF FIRST QUARTER REPOR T S ENDED AUGU QUARTERLY REPORT TO SHAREHOLDERS Empire Company Limited ( Empire or the Company ) is a Canadian company headquartered in Stellarton, Nova Scotia. Empire
The J. M. Smucker Company
 The J. M. Smucker Company ACQUISITION OF BIG HEART PET BRANDS February 3, 2015 Forward Looking Statement This presentation contains forward-looking statements that are subject to known and unknown risks
DOLLARAMA REPORTS FOURTH QUARTER AND FISCAL YEAR 2018 RESULTS
 For immediate distribution DOLLARAMA REPORTS FOURTH QUARTER AND FISCAL YEAR RESULTS Diluted net earnings per share increased by 17% during the fourth quarter Quarterly cash dividend increased to $0.12
2014 INTRAFISH SEAFOOD INVESTOR FORUM Paul Jewer, CFO. May 20, 2014 New York
 2014 INTRAFISH SEAFOOD INVESTOR FORUM Paul Jewer, CFO May 20, 2014 New York Disclaimer Certain statements made in this presentation are forward-looking and are subject to important risks, uncertainties
INVESTOR PRESENTATION - RBC CAPITAL MARKETS PAUL JEWER, EVP & CFO
 INVESTOR PRESENTATION - RBC CAPITAL MARKETS KEITH DECKER, PRESIDENT & CEO PAUL JEWER, EVP & CFO HEATHER KEELER-HURSHMAN, VP, IR November 2016 DISCLAIMER: Certain statements made in this presentation are
2014 Annual Report. George Weston Limited
 2014 Annual Report George Weston Limited Footnote Legend (1) See non-gaap financial measures beginning on page 52. (2) For financial definitions and ratios refer to the Glossary beginning on page 138.
CALAVO GROWERS, INC. ANNOUNCES SHARPLY HIGHER FISCAL 2015 FIRST QUARTER RESULTS
 For: Contact: Calavo Growers, Inc. Lee E. Cole Chairman, President and CEO (805) 525-1245 CALAVO GROWERS, INC. ANNOUNCES SHARPLY HIGHER FISCAL 2015 FIRST QUARTER RESULTS ------------- First Quarter Highlights
EDGAR Submission Header Summary
 EDGAR Submission Header Summary Submission Type 10-Q Live File on Return Copy on Submission Contact RDG Filings Submission Contact Phone Number 1-415-643-6080 Exchange NASD Confirming Copy off Filer CIK
Franchise Sales of $204.0 million for the first quarter of 2018 increased by 0.8% versus one year ago
 For Immediate Release Toronto Stock Exchange: BPF.UN BOSTON PIZZA ROYALTIES INCOME FUND ANNOUNCES 2018 FIRST QUARTER RESULTS INCLUDING SYSTEM-WIDE GROSS SALES OF $265.5 MILLION FOR THE PERIOD, AN INCREASE
TOROMONT ANNOUNCES 2017 RESULTS AND INCREASE IN QUARTERLY DIVIDEND
 For immediate release TOROMONT ANNOUNCES 2017 RESULTS AND INCREASE IN QUARTERLY DIVIDEND Toronto, Ontario (February 22, 2018) - Toromont Industries Ltd. (TSX: TIH) today reported financial results for
Performance Food Group Company Reports Third-Quarter Fiscal 2016 Results: Provides Full-Year Fiscal 2016 Adjusted EBITDA Growth Outlook of 10% to 12%
 NEWS RELEASE For Immediate Release May 4, 2016 Investors: Michael D. Neese VP, Investor Relations (804) 287-8126 michael.neese@pfgc.com Media: Joe Vagi Manager, Corporate Communications (804) 484-7737
GOLDMAN SACHS 17 TH ANNUAL AGRIBUSINESS CONFERENCE. February 26, 2013
 GOLDMAN SACHS 17 TH ANNUAL AGRIBUSINESS CONFERENCE February 26, 2013 DENNIS LEATHERBY, CFO FORWARD-LOOKING STATEMENTS Certain information contained in this presentation may constitute forward-looking statements,
Pinnacle Foods Reports Second Quarter Fiscal 2017 Results Company Maintains Full Year Guidance at Low End of Range
 Pinnacle Foods Reports Second Quarter Fiscal 2017 Results Company Maintains Full Year Guidance at Low End of Range Parsippany, NJ, July 27, 2017 - Pinnacle Foods Inc. (NYSE: PF) today reported its financial
HIGH LINER FOODS CIBC 2017 RETAIL AND CONSUMER SMALL CAP FORUM. June 14, Keith Decker, President & CEO
 HIGH LINER FOODS CIBC 2017 RETAIL AND CONSUMER SMALL CAP FORUM June 14, 2017 Keith Decker, President & CEO DISCLAIMER Certain statements made in this presentation are forward-looking and are subject to
Home Capital Reports Annual and Q4 Earnings, Share Buyback and Dividend Increase
 Home Capital Reports Annual and Q4 Earnings, Share Buyback and Dividend Increase Diluted Q4 2015 earnings per share of $1.00; adjusted diluted earnings per share of $1.02 Planned share buyback of up to
Management s Discussion and Analysis
 1. Forward Looking Statements 5 2. Overview 6 3. Vision 6 4. Operating and Financial Strategies 7 5. Key Performance Indicators 8 6. Overall Financial Performance 9 6.1 Business Developments 9 6.2 Consolidated
BMO 2017 High Yield Conference Toronto October 5, parkland.ca
 BMO 2017 High Yield Conference Toronto October 5, 2017 parkland.ca FORWARD LOOKING STATEMENT DISCLAIMER & NOTE ON NON GAAP MEASURES Certain information included herein is forward-looking. Many of these
CARA OPERATIONS LIMITED Management s Discussion and Analysis For the years ended December 25, 2016 and December 27, 2015
 CARA OPERATIONS LIMITED Management s Discussion and Analysis For the years ended December 25, 2016 and December 27, 2015 The following Management s Discussion and Analysis ( MD&A ) for Cara Operations
Management s Discussion and Analysis
 1. 2. 3. 4. 5. 6. 7. 8. 9. 10. 11. 12. 13. 14. 15. 16. 17. 18. 19. 20. 21. 22. 23. Forward-Looking Statements Overview Strategic Framework Key Financial Performance Indicators Overall Financial Performance
Q Management s Discussion and Analysis May 2, 2017
 Q1 2017 Management s Discussion and Analysis May 2, 2017 TABLE OF CONTENTS Restatement of Comparative Results... 2 First Quarter 2017 Overview... 2 Outlook... 3 Risks... 4 About Stuart Olson Inc.... 5
THIRD QUARTER 2018 REVIEW & INVESTOR OVERVIEW NOVEMBER 8, 2018
 THIRD QUARTER 2018 REVIEW & INVESTOR OVERVIEW NOVEMBER 8, 2018 REGARDING FORWARD-LOOKING STATEMENTS Statements contained in this press release that are not historical facts are forward-looking statements.
Industry: Food Retail Current Stub Value: $3.84 Main Asset(s): Loblaws and Weston Foods
: Loblaws and Weston Foods") To: From: Queen s Capital Advisory Board Kelvin Li Date: July 28, 2015 Re: George Weston Ltd. (TSX:WN) [Weston Foods Stub] COMPANY PROFILE INVESTMENT PROFILE Industry: Food Retail Current Stub Value: $3.84
To: From: Queen s Capital Advisory Board Kelvin Li Date: July 28, 2015 Re: George Weston Ltd. (TSX:WN) [Weston Foods Stub] COMPANY PROFILE INVESTMENT PROFILE Industry: Food Retail Current Stub Value: $3.84
Financial Highlights (1)
") Loblaw Companies limited 2013 Annual Report Financial review Financial Highlights (1) As at or for the periods ended December 28, 2013 and December 29, 2012 2013 2012 (2) 2011 (3) (millions of Canadian
Loblaw Companies limited 2013 Annual Report Financial review Financial Highlights (1) As at or for the periods ended December 28, 2013 and December 29, 2012 2013 2012 (2) 2011 (3) (millions of Canadian
2014 ANNUAL REPORT. Letter to Shareholders. Brookfield Residential Properties Inc.
 Brookfield Residential Properties Inc. 2014 ANNUAL REPORT Letter to Shareholders Brookfield Residential delivered excellent performance again in 2014. Following a strong fourth quarter, income before income
GENERAL MILLS REPORTS STRONG FISCAL 2019 THIRD-QUARTER RESULTS AND UPDATES FULL-YEAR GUIDANCE
 News/Information FOR IMMEDIATE RELEASE Investor Relations P. O. Box 1113 Minneapolis, MN 55440 March 20, Contact: (analysts) Jeff Siemon: 763-764-2301 (media) Rob Litt: 763-764-6364 GENERAL MILLS REPORTS
High Liner Foods RBC Capital Markets Consumer & Retail Conference. May 30, 2018
 High Liner Foods 2018 RBC Capital Markets Consumer & Retail Conference May 30, 2018 Rod Hepponstall, President & CEO Paul Jewer, EVP & CFO Heather Keeler-Hurshman, VP Investor Relations Disclaimer Certain
DATA COMMUNICATIONS MANAGEMENT CORP. ANNOUNCES FOURTH QUARTER AND YEAR END FINANCIAL RESULTS FOR 2016
 For Immediate Release DATA COMMUNICATIONS MANAGEMENT CORP. ANNOUNCES FOURTH QUARTER AND YEAR END FINANCIAL RESULTS FOR 2016 HIGHLIGHTS FISCAL 2016 Refinement of sales leadership team, and enhancements
McCormick & Company, Inc. 2nd Quarter 2017 Financial Results and Outlook June 29, 2017
 McCormick & Company, Inc. 2nd Quarter 2017 Financial Results and Outlook June 29, 2017 1 The following slides accompany a June 29, 2017 presentation to investment analysts. This information should be read
Management s Discussion and Analysis. Consolidated Financial Statements
 Management s Discussion and Analysis Consolidated Financial Statements Introduction.... 12 1. Company Overview.... 13 2. Financial Objectives... 17 3. Outlook... 18 4. Recent Developments... 18 5. Performance...
McCormick & Company, Inc. 1 st Quarter 2018 Financial Results and Outlook
 McCormick & Company, Inc. 1 st Quarter 2018 Financial Results and Outlook March 27, 2018 The following slides accompany a March 27, 2018, earnings release conference call. This information should be read
CAMPBELL REPORTS FIRST-QUARTER RESULTS
 FOR IMMEDIATE RELEASE INVESTOR CONTACT: MEDIA CONTACT: Ken Gosnell Thomas Hushen (856) 342-6081 (856) 342-5227 ken_gosnell@campbellsoup.com thomas_hushen@campbellsoup.com CAMPBELL REPORTS FIRST-QUARTER
SECURITIES AND EXCHANGE COMMISSION Washington, D.C FORM 10-Q
 10-Q 1 a07-22518_110q.htm 10-Q SECURITIES AND EXCHANGE COMMISSION Washington, D.C. 20549 FORM 10-Q (Mark one) QUARTERLY REPORT PURSUANT TO SECTION 13 OR 15(d) OF THE SECURITIES AND EXCHANGE ACT OF 1934
CARA OPERATIONS LIMITED Management s Discussion and Analysis For the years ended December 31, 2017 and December 25, 2016
 CARA OPERATIONS LIMITED Management s Discussion and Analysis For the years ended December 31, 2017 and December 25, 2016 The following Management s Discussion and Analysis ( MD&A ) for Cara Operations
Tim Hortons Inc. announces 2011 first quarter results: Earnings per share up 7.5% to $0.48
 May 12, 2011 Tim Hortons Inc. announces 2011 first quarter results: Earnings per share up 7.5% to $0.48 OAKVILLE, ON, May 12, 2011 /PRNewswire via COMTEX/ -- (Unaudited. All amounts in Canadian dollars
HIGH LINER FOODS INVESTOR PRESENTATION. June Keith Decker, President & CEO Paul Jewer, Executive VP & CFO Heather Keeler-Hurshman, VP IR
 HIGH LINER FOODS INVESTOR PRESENTATION June 2017 Keith Decker, President & CEO Paul Jewer, Executive VP & CFO Heather Keeler-Hurshman, VP IR DISCLAIMER Certain statements made in this presentation are
Consumer Price Index report
 MBS Reports C o n s u m e r P r i c e I n d e x R e p o r t, J u n e 2 0 1 8 1 Consumer Price Index report J u n e 2 0 1 8 Highlights The Manitoba all-items Consumer Price Index (CPI) rose 2.7% on a year-over-year
First Quarter 2018 Management s Discussion and Analysis May 2, 2018
 First Quarter 2018 Management s Discussion and Analysis May 2, 2018 TABLE OF CONTENTS About Stuart Olson Inc.... 2 First Quarter 2018 Overview... 4 Strategy... 6 Outlook... 8 Results of Operations... 9
GENERAL MILLS. Fiscal 2018 Third Quarter Results. March 21, 2018
 GENERAL MILLS Fiscal 2018 Third Quarter Results March 21, 2018 A Reminder on Forward-looking Statements This presentation contains forward-looking statements within the meaning of the Private Securities
MANAGEMENT S DISCUSSION AND ANALYSIS OF FINANCIAL CONDITION AND RESULTS OF OPERATIONS FOR THE THREE AND TWELVE-MONTH PERIODS ENDED DECEMBER 31, 2010
 MANAGEMENT S DISCUSSION AND ANALYSIS OF FINANCIAL CONDITION AND RESULTS OF OPERATIONS FOR THE THREE AND TWELVE-MONTH PERIODS ENDED DECEMBER 31, 2010 The following management s discussion and analysis of
CARA OPERATIONS LIMITED Management s Discussion and Analysis For the 13 and 39 weeks ended September 27, 2015
 CARA OPERATIONS LIMITED Management s Discussion and Analysis For the 13 and 39 weeks ended September 27, 2015 The following Management s Discussion and Analysis ( MD&A ) for Cara Operations Limited ( Cara
Press Release For immediate release
 Uni-Select reports growth in sales and EBITDA (1) for its Q4 and full year 2017: Press Release For immediate release Sales up 42.6% to $415.0 million in Q4 and up 21.0% to $1,448.3 million for 2017 due
November 10, 2014 For Immediate Release
 MARTINREA INTERNATIONAL INC. Releases Third Quarter Results and Announces Dividend, Record Quarterly Revenues, Solid Profits November 10, 2014 For Immediate Release Toronto, Ontario Martinrea International
Management s discussion and analysis ( MD&A ) May 17, 2017
 May 17, 2017") Management s discussion and analysis ( MD&A ) May 17, 2017 The following discussion and analysis is a review of the financial condition and operating results of Just Energy Group Inc. ( JE or Just Energy
Management s discussion and analysis ( MD&A ) May 17, 2017 The following discussion and analysis is a review of the financial condition and operating results of Just Energy Group Inc. ( JE or Just Energy
Pinnacle Foods Reports Strong 1st Quarter Fiscal 2017 Results Company Reaffirms Guidance for the Year
 Pinnacle Foods Reports Strong 1st Quarter Fiscal Results Company Reaffirms Guidance for the Year Parsippany, NJ, April 27, - Pinnacle Foods Inc. (NYSE: PF) today reported strong results for the first quarter
CALAVO GROWERS, INC. ANNOUNCES RECORD FISCAL 2016 THIRD QUARTER RESULTS
 For: Contact: Calavo Growers, Inc. Lee E. Cole Chairman and CEO (805) 525-1245 CALAVO GROWERS, INC. ANNOUNCES RECORD FISCAL 2016 THIRD QUARTER RESULTS --------------- Third Quarter Highlights Include:
Three-month period ended June 30, 2013 compared with the three-month period ended June 30, 2012
 MANAGEMENT S DISCUSSION & ANALYSIS Three-month period ended June 30, 2013 compared with the three-month period ended June 30, 2012 The following Management s Discussion and Analysis ( MD&A ) and the Company
MANAGEMENT S DISCUSSION AND ANALYSIS OF FINANCIAL CONDITION AND RESULTS OF OPERATIONS
 MANAGEMENT S DISCUSSION AND ANALYSIS OF FINANCIAL CONDITION AND RESULTS OF OPERATIONS For the Three and Nine Months Ended September 30, 2010 As of November 8, 2010 MANAGEMENT S DISCUSSION AND ANALYSIS
Aritzia Reports Third Quarter 2018 Financial Results
 NEWS RELEASE Aritzia Reports Third Quarter 2018 Financial Results VANCOUVER, January 10, 2018 Aritzia Inc. ("Aritzia" or the "Company") (TSX: ATZ), an innovative design house of exclusive fashion brands,
Consumer Price Index. Highlights. Manitoba second highest among provinces. MBS Reports C o n s u m e r P r i c e I n d e x, M a r c h
 MBS Reports C o n s u m e r P r i c e I n d e x, M a r c h 2 0 1 9 1 Consumer Price Index M a r c h 2 0 1 9 Highlights The Manitoba all-items Consumer Price Index (CPI) increased 2.3% on a year-overyear