Quarterly Financial Information
|
|
|
- Paul Dickerson
- 6 years ago
- Views:
Transcription
1 Quarterly Financial Information [105000] Management commentary...2 [110000] General information about financial statements...18 [210000] Statement of financial position, current/non-current...20 [310000] Statement of comprehensive income, profit or loss, by function of expense...22 [410000] Statement of comprehensive income, OCI components presented net of tax...23 [520000] Statement of cash flows, indirect method...25 [610000] Statement of changes in equity - Accumulated Current...27 [610000] Statement of changes in equity - Accumulated Previous...30 [700000] Informative data about the Statement of financial position...33 [700002] Informative data about the Income statement...34 [700003] Informative data - Income statement for 12 months...35 [800001] Breakdown of credits...36 [800003] Annex - Monetary foreign currency position...38 [800005] Annex - Distribution of income by product...39 [800007] Annex - Financial derivate instruments...40 [800100] Notes - Subclassifications of assets, liabilities and equities...50 [800200] Notes - Analysis of income and expense...54 [800500] Notes - List of notes...55 [800600] Notes - List of accounting policies...65 [813000] Notes - Interim financial reporting...83 Footnotes of 91
2 [105000] Management commentary Management commentary [text block] HIGHLIGHTS GRUMA s performance during 3Q17 remained in line with the company s expectations for the year in terms of both results and the programs and investments that support capturing growth opportunities and profitability in the long-term. On a consolidated basis, sales volume was flat; net sales and EBITDA were also relatively flat, despite the effect of peso appreciation on Gruma USA figures. EBITDA margin was 16.4%, similar to last year. Sales and EBITDA from non-mexican operations represented 72% and 69%, respectively, of consolidated figures. The company reported US$1.1 billion of debt at quarter-end, US$311 million more than at the end of 2Q17. Net Debt/EBITDA ratio was 1.4x. Financial Highlights (Ps. millions) 3Q17 3Q16 Var Sales volume (thousand metric tons) % Net sales 17,135 17,209 (0.4)% Operating income 2,312 2,423 (5)% Operating margin 13.5% 14.1% (60 bp) EBITDA 2,802 2,806 (0.2)% EBITDA margin 16.4% 16.3% 10 bp Majority net income 1,659 1,535 8% Debt (US$ millions) Sep 17 Sep 16 Var ($) Var (%) Jun 17 Var ($) Var (%) 1, % % 2 of 91
3 Disclosure of nature of business [text block] Since 1949, GRUMA, S.A.B. de C.V., is one of the world's leading tortilla and corn flour producers. With leading brands in most of its markets, GRUMA has operations in the United States, Mexico, Central America, Europe, Asia and Oceania. Disclosure of management's objectives and its strategies for meeting those objectives [text block] Our strategy is to focus on our core business corn flour and tortilla as well as to expand our product portfolio towards the flatbreads category in general. We will continue taking advantage of the increasing popularity of Mexican food and, more importantly, tortillas, in the U.S., European, Asian and Oceanian markets. We will also continue taking advantage of the adoption of tortillas by the consumers of several regions of the world for the preparation of different recipes other than Mexican food. Our strategy includes the following key elements: Expand in the Retail and Food Service Tortilla Markets Where We Currently Have a Presence and to New Regions: We believe that the size and growth of the U.S. retail and food service tortilla markets offer significant opportunities for expansion. Enter and Expand in the Tortilla and Flatbread Markets in Other Regions of the World: We believe that tortilla and flatbread markets in other continents such as Europe, Asia and Oceania offer us significant opportunities. We believe our current operations in Europe will enable us to better serve markets there and in the Middle East. Our presence in Asia and Oceania will enable us to offer our customers in those regions fresh products and respond more quickly to their needs. Maintain Gruma Corporation s MISSION and GUERRERO Tortilla Brands as the First and Second National Brands in the United States and to Position our Mission Brand in Other Regions: We intend to achieve this by increasing our efforts at building brand name recognition, and by further expanding and utilizing Gruma Corporation s distribution network, first in Gruma Corporation s existing markets, where we believe there is potential for further growth, and second, in regions where Gruma Corporation currently does not have a significant presence but where we believe strong demand for tortillas already exists. 3 of 91
4 Encourage Transition from the Traditional Cooked-Corn Method to the Dry Corn Flour Method as Well as New Uses for Corn Flour: We pioneered the dry corn flour method for the production of tortilla and other corn-based products.we continue to view the transition from the traditional method to the dry corn flour method of making tortillas and other corn-based products, as the primary opportunity for increased corn flour sales. We are also working to expand the use of corn flour in the manufacture of different types of products. Expand and Leverage the Mission Brand Name Globally to Achieve Economies of Scale: We intend to continue to launch the Mission brand name in markets where we have reached critical mass to leverage our premium brand name and consolidate profitability. Invest in our Core Business and Focus on Optimizing Operational Matters: Recently we have experienced renewed growth in the U.S., European, Asian and Oceanian tortilla markets. We intend to focus our investment program on our core business to enable us to meet future demand, consolidate our leading position in the industry and continue delivering a return to shareholders that is above the cost of capital. Disclosure of entity's most significant resources, risks and relationships [text block] Our financial condition and results of operations may be influenced by some of the following factors: the level of demand for tortillas and corn flour; increase or decrease in the Hispanic population in the United States; increases in Mexican food consumption by the non-hispanic population in the United States; and the use of tortillas in non-mexican cuisine in the United States, Europe, Asia and Oceania; the cost and availability of corn and wheat; the cost of energy and other related products; our acquisitions, plant expansions and divestitures; the effect of government initiatives and policies; the effect from variations of interest rates and exchange rates; volatility in corn and wheat prices and energy costs; competition from tortilla manufacturers, especially in the United States; competition in the corn flour business; and general economic conditions in the countries in which we operate and worldwide. Disclosure of results of operations and prospects [text block] 4 of 91
5 GRUMA REPORTS THIRD QUARTER 2017 RESULTS HIGHLIGHTS GRUMA s performance during 3Q17 remained in line with the company s expectations for the year in terms of both results and the programs and investments that support capturing growth opportunities and profitability in the long-term. On a consolidated basis, sales volume was flat; net sales and EBITDA were also relatively flat, despite the effect of peso appreciation on Gruma USA figures. EBITDA margin was 16.4%, similar to last year. Sales and EBITDA from non-mexican operations represented 72% and 69%, respectively, of consolidated figures. The company reported US$1.1 billion of debt at quarter-end, US$311 million more than at the end of 2Q17. Net Debt/EBITDA ratio was 1.4x. Financial Highlights (Ps. millions) 3Q17 3Q16 Var Sales volume (thousand metric tons) % Net sales 17,135 17,209 (0.4)% Operating income 2,312 2,423 (5)% Operating margin 13.5% 14.1% (60 bp) EBITDA 2,802 2,806 (0.2)% EBITDA margin 16.4% 16.3% 10 bp Majority net income 1,659 1,535 8% Debt (US$ millions) Sep 17 Sep 16 Var ($) Var (%) Jun 17 Var ($) Var (%) 1, % % 5 of 91
6 CONSOLIDATED RESULTS OF OPERATIONS 3Q17 versus 3Q16 Sales volume was flat at 993 thousand metric tons, reflecting volumes at Gruma USA that were similar to last year, while GIMSA s growth was offset by reductions at Gruma Centroamérica and Gruma Europe. Net sales were flat at Ps.17,135 million. Price increases and volume growth at GIMSA, and a better sales mix at Gruma USA were able to offset the impact from the peso appreciation during the quarter. Cost of sales as a percentage of net sales increased to 62.6% from 61.4%. The peso appreciation made Gruma USA, the highest gross margin operation within GRUMA, to comprise a lower proportion of the consolidated figures and thus increase the consolidated cost of sales to sales ratio. In absolute terms, cost of sales increased 1% to Ps.10,723 million in connection with volume growth at GIMSA. Selling, general and administrative expenses (SG&A) as a percentage of net sales improved to 24% from 25.3% resulting from improvements at GIMSA, Gruma Europe and other smaller operations. Also, the consolidated improvement came from the lower proportion of Gruma USA, the operation with the highest ratio of SG&A to sales within GRUMA, in connection with the peso appreciation. In absolute terms, SG&A decreased 6% to Ps.4,104 million, mainly arising from the peso appreciation effect on Gruma USA figures and, to a lesser extent, reductions at several operations, including Gruma Centroamérica, Gruma Europe, Technology and corporate offices. Other income, net, was Ps.5 million compared to income of Ps.141 million. The reduction resulted primarily in connection with (1) reversed impairment losses of Ps.78 million in 3Q16 related to the reopening of a plant in Central Mexico, a facility that had been closed since 1999; and (2) extraordinary gains on corn hedging during 3Q16. Operating income decreased 5% to Ps.2,312 million, driven primarily by (1) the peso appreciation effect at foreign subsidiaries and; (2) reductions at GIMSA due to the aforementioned reversed impairment losses and corn hedging gains last year. Operating margin declined to 13.5% from 14.1%, also affected by the reversed impairment losses and corn hedging gains. EBITDA was flat at Ps.2,802 million. EBITDA margin was 16.4%, similar to last year. Net comprehensive financing cost was Ps.63 million, Ps.17 million more in connection with (1) lower gains on foreign exchange rate hedging related to corn procurement at GIMSA; and (2) higher financial expenses due to higher debt. Most of this was offset by financial income related to recovered tax on assets. Income taxes were Ps.591 million, 22% less due mostly to a lower effective tax rate and, to a lesser extent, lower pre-tax income. The 26.3% effective tax rate resulted from the use of tax-loss-carryforwards by Gruma Holding when receiving dividends from Gruma USA at an exchange rate that was higher than during the quarter. 6 of 91
7 Majority net income was Ps.1,659 million, 8% more due mainly to higher ownership of GIMSA in connection with the recent repurchase of GIMSA s public stake and the minority interest at GIMSA s plants. SUBSIDIARY RESULTS OF OPERATIONS 3Q17 versus 3Q16 Gruma USA Sales volume was flat at 342 thousand metric tons. The tortilla business rose 1%, partially affected by recent hurricanes in Texas and Florida. The growth was driven by the retail channel, where volume benefited primarily from (1) growth of our Super Soft flour tortillas; and (2) the nationwide launch of our Street Taco tortilla (a small tortilla especially used for tacos) in September Corn flour sales volume decreased 2% due mainly to (1) transfer of a customer currently supplied by GIMSA; (2) weaker demand from food service customers in light of strong introductions made last year; and (3) disruptions from hurricanes in Texas and Florida during August and September. Net sales increased 2% to Ps.9,400 million reflecting a change in the sales mix within the retail tortilla business favoring higher-priced SKUs, such as the aforementioned Super Soft flour tortillas, the Street Taco tortilla and, in general, the healthier alternatives line, which during 2Q17 launched shelf-stable organic tortillas. Cost of sales as a percentage of net sales improved to 56.6% from 56.7% driven largely by (1) a change in the sales mix toward higher margin SKUs at the retail tortilla business; and (2) lower raw-material costs. Most of these benefits were offset by higher operational costs, part of this related to the aforementioned weather conditions, and part related to the use of temporary employees. Also, the company continued reporting higher costs related to the new plant in the Dallas area (including higher leases, accelerated depreciation for assets of the current Dallas tortilla plant, and transition costs); some of these costs will be eliminated once the new plant starts operations and the former plant is closed. In absolute terms, cost of sales increased 2% to Ps.5,321 million. SG&A as a percentage of net sales increased to 29.2% from 28.6% due mainly to higher intercompany shipments to meet demand in light of the aforementioned hurricanes that temporarily interrupted production at some of our plants. In absolute terms, SG&A rose 4% to Ps.2,742 million driven by the aforementioned intercompany shipments and by higher sales commissions and marketing expenses in connection with growth at the tortilla business and the sales mix change toward higher-priced SKUs. Operating income was fairly flat at Ps.1,334 million. Operating margin declined to 14.2% from 14.6%. 7 of 91
8 EBITDA increased 1% to Ps.1,615 million. EBITDA margin declined to 17.2% from 17.4%. GIMSA Sales volume rose 4% to 512 thousand metric tons driven mainly by (1) wholesalers who are expanding their distribution; (2) higher demand from the largest snack producers in Mexico; and (3) exports to our U.S. operations. Net sales grew 8% to Ps.4,864 million primarily in connection with (1) the effect of price increases implemented during 2016 and the beginning of 2017; and (2) the aforementioned sales volume growth. Cost of sales as a percentage of net sales improved to 72.4% from 72.6%. The effect of higher costs related to corn, energy and other inputs was offset by the aforementioned price increases. In absolute terms, cost of sales rose 8% to Ps.3,523 million due to the aforementioned higher costs and sales volume growth. SG&A as a percentage of net sales improved to 15.5% from 16.2% due to better absorption. In absolute terms, SG&A rose 3% to Ps.755 million due mostly to (1) higher sales commissions in connection with volume growth; (2) higher freight costs, resulting from higher tariffs, and higher sales volume to customers where the company absorbs this expense. Other income, net, of Ps.8 million, represents a decline of Ps.127 million, mostly resulting from (1) reversed impairment losses of Ps.78 million in 3Q16 related to the reopening of a plant in Central Mexico, a facility that had been closed since 1999; and (2) extraordinary gains on corn hedging during 3Q16. Operating income decreased 8% to Ps.594 million and operating margin declined to 12.2% from 14.2% principally driven by the aforementioned reversed impairment losses and corn hedging gains last year. EBITDA increased 5% to Ps.790 million. EBITDA margin declined to 16.2% from 16.7%. For additional information, please see GIMSA Third Quarter 2017 Results available through GRUMA s website, Gruma Europe Sales volume decreased 9% to 84 thousand metric tons, driven by the corn flour business, mostly related to (1) reductions in Turkey due to delays on corn import permits; and (2) lower sales in Ukraine related to the company s decision to stop selling to a client due to cash flow issues. The tortilla business rose 1% in connection with (1) higher retail sales in France due to increased store coverage; (2) increased consumption of kebabs, particularly in Germany; and (3) market share gains in Russia in connection with increased coverage. Part of this growth was offset by reductions in the U.K. due to a tougher competitive environment. 8 of 91
9 Net sales rose 1% to Ps.1,235 million despite the aforementioned decline in sales volume, due mainly to (1) the change in the sales mix toward the tortilla business; (2) better sales mix within the tortilla business toward the retail channel and better management of allowances, especially in Russia; and (3) the appreciation of the euro against the dollar. Cost of sales as a percentage of net sales improved to 75.5% from 77.3% reflecting primarily production efficiencies at the tortilla business, which resulted in lower costs for raw materials and labor. In absolute terms, cost of sales decreased 1% to Ps.932 million in connection with the decline in sales volume and the aforementioned production efficiencies. SG&A as a percentage of net sales improved to 19.2% from 20.8% and in absolute terms decreased 7% to Ps.237 million mainly due to efficiencies resulting in headcount reductions, particularly in the tortilla business. In absolute terms, the reduction was also driven by the aforementioned decline in sales volume. Operating income was Ps.71 million, compared to Ps.39 million, and operating margin rose to 5.7% from 3.2%, resulting mainly from the aforementioned production efficiencies and headcount reductions at the tortilla business. EBITDA increased 36% to Ps.121 million, and EBITDA margin improved to 9.8% from 7.3%. Gruma Centroamérica Sales volume decreased 19% to 46 thousand metric tons due mainly to (1) extraordinary sales of corn last year; (2) lower corn flour sales to government channels in Guatemala; and (3) aggressive competition for corn flour. Net sales declined 15% to Ps.1,021 million, mainly due to the aforementioned decrease in sales volume. Net sales declined at a lower pace than sales volume despite the strong peso, due principally to (1) price increases implemented in 4Q16; (2) a change in sales mix toward tortilla, hearts of palm and snacks; and (3) lower sales of corn that have a significantly lower price per ton. Cost of sales as a percentage of net sales increased to 61.3% from 60.8% mostly driven by (1) higher energy and raw material costs, especially corn and rice, as well as (2) a change in the sales mix toward flanker brands in corn flour, and snacks. In absolute terms, cost of sales declined 14% to Ps.626 million in connection with the aforementioned decrease in sales volume, and the peso appreciation. 9 of 91
10 SG&A as a percentage of net sales increased to 31.1% from 29.3% due to lower absorption. In absolute terms, SG&A declined 10% to Ps.317 million principally resulting from the stronger peso and the aforementioned decrease in sales volume. Operating income decreased 37% to Ps.77 million, and operating margin declined to 7.5% from 10.2% due mainly to the aforementioned sales volume decrease and higher costs. In addition, operating income declined because of the appreciation of the peso. EBITDA declined 28% to Ps.107 million. EBITDA margin decreased to 10.5% from 12.4%. Other Subsidiaries and Eliminations Operating income declined Ps.47 million to Ps.236 million. This resulted mainly from the negative peso appreciation effect largely related to Gruma USA, as figures for this subsidiary are reported under convenience translation and the foreign exchange impact is shown under Other Subsidiaries and Eliminations. CONFERENCE CALL The third quarter conference call will be held on Thursday, October 19, 2017 at 11:30 am Eastern Time (10:30 am Central/ Mexico City Time). To access the call, please dial: domestic US +1 (855) , international +1 (631) ACCOUNTING PROCEDURES The consolidated figures have been prepared in accordance with the International Financial Reporting Standards (IFRS). Results for foreign subsidiaries are translated to Mexican pesos applying the historical exchange rate. Nevertheless, under the section Subsidiary Results of Operations and the table of Financial Highlights by Subsidiary of this report, figures for Gruma USA and Gruma Europe were translated to Mexican pesos using a convenience translation with the exchange rate of Ps.18.13/dollar as of September 30, The differences between the use of convenience translation and the historical exchange rate are reflected under "Other Subsidiaries and Eliminations. 10 of 91
11 ABOUT GRUMA Since 1949, GRUMA, S.A.B. de C.V., is one of the world's leading tortilla and corn flour producers. With leading brands in most of its markets, GRUMA has operations in the United States, Mexico, Central America, Europe, Asia and Oceania. GRUMA is headquartered in San Pedro Garza García, Mexico, and has approximately 20,000 employees and 72 plants. In 2016, GRUMA had net sales of US$3.6 billion, of which 75% came from non-mexican operations. For further information, please visit This report may contain certain forward-looking statements and information relating to GRUMA, S.A.B. de C.V., and its subsidiaries (collectively, GRUMA ) that are based on the beliefs of its management as well as assumptions made by and information then available to GRUMA. Such statements reflect the views of GRUMA with respect to future events and are subject to certain risks, uncertainties, and assumptions. Many factors could cause the actual results, performance, or achievements of GRUMA to be materially different from historical results or any future results, performance, or achievements that may be expressed or implied by such forward-looking statements. Such factors include, among others, changes in economic, political, social, governmental, business, or other factors globally or in Mexico, the United States, Latin America, or any other countries in which GRUMA does business, and world corn and wheat prices. If one or more of these risks or uncertainties materializes, or underlying assumptions are proven incorrect, actual results may vary materially from those described herein as anticipated, believed, estimated, expected, or targeted. GRUMA does not intend, and undertakes no obligation, to publicly update or revise any forward-looking statements, whether as a result of new information, future events, or otherwise. Financial position, liquidity and capital resources [text block] FINANCIAL POSITION September 2017 versus June 2017 Balance Sheet Highlights Total assets were Ps.57,849 million, an increase of 7% primarily reflecting rises in (1) property, plant and equipment, related to the company s capital expenditures program; (2) higher inventories related to corn procurement; and (3) higher other accounts receivable related to tax recoveries. Higher cash balances were also reflected at quarter-end. Total liabilities were Ps.34,779 million, 19% more resulting mainly from higher debt related to (1) the use of approximately US$185 million for the repurchase of GIMSA s public stake and about US$25 million for 11 of 91
12 minority stakes at GIMSA plants; (2) higher corn inventories at GIMSA; and (3) capital expenditures during the quarter. Shareholders equity was Ps.23,070 million, 7% less than at June 2017 in connection with the repurchase of GIMSA shares, due to the excess of cost over book value. Debt Profile GRUMA s debt was US$1.1 billion, US$311 million more than at June Approximately 84% of GRUMA s debt was dollar-denominated. Debt (US$ millions) Sep 17 Sep 16 Var ($) Var (%) Jun 17 Var ($) Var (%) 1, % % Debt Maturity Profile (US$ millions) CAPITAL EXPENDITURE PROGRAM GRUMA s capital expenditures totaled US$95 million during 3Q17, allocated mostly to (1) the United States, in connection with the construction of a tortilla plant in Dallas, the expansion of the tortilla plant in Florida, and the expansion of the corn flour plant in Indiana; (2) Mexico, related to the acquisition of land for future projects and the construction of a tortilla plant in Puebla; (3) Europe, in connection with the acquisition of land for future projects, the construction of a tortilla plant in Russia, packaging automation at the flatbread 12 of 91
13 plant in England, and the expansion of the tortilla plant in the Netherlands. Also, there were technology upgrades across most subsidiaries. RECENT EVENTS During 3Q17 GRUMA acquired most (99%) of the 14.5% of GIMSA s public stake. This effort was aimed at the delisting of GIMSA from the public market in the short-term. Also, during 3Q17, GRUMA and GIMSA acquired the minority interests that remained at some of GIMSA s plants. The amount applied for this during 3Q17 was US$25 million. 13 of 91
14 14 of 91
15 15 of 91
16 Internal control [text block] We carried out an evaluation under the supervision and with the participation of our management, including our Chief Executive Officer, Chief Financial Officer and Chief Administrative Officer, of the effectiveness of the design and operation of our disclosure controls and procedures. There are inherent limitations to the effectiveness of any system of disclosure controls and procedures, including the possibility of human error and the circumvention or overriding of the controls and procedures. Accordingly, even effective disclosure controls and procedures can only provide reasonable assurance of achieving their control objectives. Based upon our evaluation, our Chief Executive Officer, Chief Financial Officer and Chief Administrative Officer concluded that our disclosure controls and procedures were effective to provide reasonable assurance that information required to be disclosed by us in the reports that we file or submit is recorded, processed, summarized and reported within the time periods specified in the applicable rules and forms, and that it is accumulated and communicated to our management, including our Chief Executive Officer, Chief Financial Officer and Chief Administrative Officer, as appropriate to allow timely decisions regarding required disclosure. Likewise, the effectivity of our internal control processes ober the financial information is annually audited by PricewaterhouseCoopers, S.C. Our management is responsible for establishing and maintaining adequate internal control over financial reporting. Under the supervision and with the participation of our management, including our Board of Directors, Chief Executive Officer, Chief Financial Officer, Chief Administrative Officer and other personnel, we conducted an evaluation of the effectiveness of our internal control over financial reporting based on the framework in Internal Control Integrated Framework (v.2013) by the Committee of Sponsoring Organizations of the Treadway Commission. Our internal control over financial reporting is a process designed to provide reasonable assurance regarding the reliability of financial reporting and the preparation of financial statements for external purposes in accordance with IFRS as issued by IASB. Our internal control over financial reporting includes those policies and procedures that (i) pertain to the maintenance of records that, in reasonable detail, accurately and fairly reflect the transactions and dispositions of our assets; (ii) provide reasonable assurance that transactions are recorded as necessary to permit preparation of financial statements in accordance with IFRS, and that our receipts and expenditures are being made only in accordance with authorizations of our management and directors; and (iii) provide reasonable assurance regarding prevention or timely detection of unauthorized acquisition, use, or disposition of our assets that could have a material effect on our financial statements. Because of its inherent limitations, internal control over financial reporting may not prevent or detect misstatements. Also, projections of any evaluation of effectiveness to future periods are subject to the risk that controls may become inadequate because of changes in conditions, or that the degree of compliance with the policies or procedures may deteriorate. Based on our evaluation under the framework in Internal Control Integrated Framework (v.2013), our management concluded that our internal control over financial reporting was effective. 16 of 91
17 There has been no change in our internal control over financial reporting that has materially affected, or is reasonably likely that could materially affect, our internal control over financial reporting. Disclosure of critical performance measures and indicators that management uses to evaluate entity's performance against stated objectives [text block] Management evaluates operating and financial indicators to measure improvement or deterioration of the company's performance; the main operating indicators include profitability as a percentage of sales and those demonstrating profitability of investment such as EBITDA, ROIC, ROE and ROA; liquidity, leverage and hedging ratios are also assessed. 17 of 91
18 [110000] General information about financial statements Ticker: GRUMA Period covered by financial statements: al Date of end of reporting period: Name of reporting entity or other means of identification: Description of presentation currency: Level of rounding used in financial statements: : GRUMA, S.A.B. de C.V. MXN MILES DE PESOS Yes Number of quarter: 3 Type of issuer: ICS Explanation of change in name of reporting entity or other means of identification from end of preceding reporting period: Description of nature of financial statements: Disclosure of general information about financial statements [text block] Follow-up of analysis [text block] IN ACCORDANCE WITH THE RULES OF PROCEDURE OF THE MEXICAN STOCK EXCHANGE, ARTICLE SECTION VIII, WE INFORM YOU THAT ACTINVER, BANK OF AMERICA MERRILL LYNCH, BARCLAYS, BBVA, BTG PACTUAL, CITI, DEUTSCHE BANK, GBM, GOLDMAN SACHS, HSBC, INTERACCIONES, J.P.MORGAN, MORGAN STANLEY, SANTANDER, SCOTIABANK, UBS AND VECTOR, AMONG OTHER, GIVE ANALYSIS COVERAGE OF THE COMPANY S SECURITIES. 18 of 91
19 19 of 91
20 [210000] Statement of financial position, current/non-current Concept Statement of financial position [abstract] Assets [abstract] Current assets [abstract] Close Current Quarter Close Previous Exercise Cash and cash equivalents 3,695,405,000 5,466,530,000 Trade and other current receivables 8,723,328,000 7,935,515,000 Current tax assets, current 715,759, ,543,000 Other current financial assets 132,111, ,501,000 Current inventories 10,616,795,000 8,682,347,000 Current biological assets 0 0 Other current non-financial assets 0 0 Total current assets other than non-current assets or disposal groups classified as held for sale or as held for distribution to owners 23,883,398,000 23,109,436,000 Non-current assets or disposal groups classified as held for sale or as held for distribution to owners 0 0 Total current assets 23,883,398,000 23,109,436,000 Non-current assets [abstract] Trade and other non-current receivables 176,813, ,092,000 Current tax assets, non-current 30,801,000 38,508,000 Non-current inventories 0 0 Non-current biological assets 0 0 Other non-current financial assets 0 68,000 Investments accounted for using equity method 0 0 Investments in subsidiaries, joint ventures and associates 6,397,000 7,266,000 Property, plant and equipment 26,772,319,000 26,313,385,000 Investment property 0 0 Goodwill 3,437,549,000 3,665,126,000 Intangible assets other than goodwill 424,311, ,528,000 Deferred tax assets 3,066,199,000 2,671,991,000 Other non-current non-financial assets 51,046,000 45,549,000 Total non-current assets 33,965,435,000 33,248,513,000 Total assets 57,848,833,000 56,357,949,000 Equity and liabilities [abstract] Liabilities [abstract] Current liabilities [abstract] Trade and other current payables 10,112,590,000 9,723,507,000 Current tax liabilities, current 311,402, ,198,000 Other current financial liabilities 3,509,090,000 3,784,085,000 Other current non-financial liabilities 0 0 Current provisions [abstract] Current provisions for employee benefits 0 0 Other current provisions 107,982, ,075,000 Total current provisions 107,982, ,075,000 Total current liabilities other than liabilities included in disposal groups classified as held for sale 14,041,064,000 14,245,865,000 Liabilities included in disposal groups classified as held for sale 0 0 Total current liabilities 14,041,064,000 14,245,865,000 Non-current liabilities [abstract] Trade and other non-current payables 34,096,000 37,060,000 Current tax liabilities, non-current 0 0 Other non-current financial liabilities 16,910,228,000 12,229,868, of 91
21 Concept Close Current Quarter Close Previous Exercise Other non-current non-financial liabilities 0 0 Non-current provisions [abstract] Non-current provisions for employee benefits 736,193, ,173,000 Other non-current provisions 554,024, ,945,000 Total non-current provisions 1,290,217,000 1,391,118,000 Deferred tax liabilities 2,502,968,000 2,753,772,000 Total non-current liabilities 20,737,509,000 16,411,818,000 Total liabilities 34,778,573,000 30,657,683,000 Equity [abstract] Issued capital 5,363,595,000 5,363,595,000 Share premium 0 0 Treasury shares 0 0 Retained earnings 16,764,512,000 16,223,897,000 Other reserves 947,734,000 2,284,597,000 Total equity attributable to owners of parent 23,075,841,000 23,872,089,000 Non-controlling interests (5,581,000) 1,828,177,000 Total equity 23,070,260,000 25,700,266,000 Total equity and liabilities 57,848,833,000 56,357,949, of 91
22 [310000] Statement of comprehensive income, profit or loss, by function of expense Concept Profit or loss [abstract] Profit (loss) [abstract] Accumulated Current Year Accumulated Previous Year Quarter Current Year Quarter Previous Year Revenue 52,249,446,000 49,387,732,000 17,134,553,000 17,209,001,000 Cost of sales 32,459,256,000 30,381,912,000 10,723,344,000 10,572,570,000 Gross profit 19,790,190,000 19,005,820,000 6,411,209,000 6,636,431,000 Distribution costs 10,531,394,000 9,971,627,000 3,441,496,000 3,491,970,000 Administrative expenses 2,373,257,000 2,602,212, ,286, ,013,000 Other income 0 212,075,000 4,892, ,280,000 Other expense 50,024, Profit (loss) from operating activities 6,835,515,000 6,644,056,000 2,312,319,000 2,422,728,000 Finance income 388,568, ,317, ,516, ,884,000 Finance costs 1,241,626, ,956, ,235, ,553,000 Share of profit (loss) of associates and joint ventures accounted for using equity method Profit (loss) before tax 5,982,457,000 6,427,417,000 2,249,600,000 2,377,059,000 Tax income (expense) 1,548,508,000 1,990,868, ,890, ,869,000 Profit (loss) from continuing operations 4,433,949,000 4,436,549,000 1,658,710,000 1,620,190,000 Profit (loss) from discontinued operations Profit (loss) 4,433,949,000 4,436,549,000 1,658,710,000 1,620,190,000 Profit (loss), attributable to [abstract] Profit (loss), attributable to owners of parent 4,373,318,000 4,218,923,000 1,659,004,000 1,535,453,000 Profit (loss), attributable to non-controlling interests 60,631, ,626,000 (294,000) 84,737,000 Earnings per share [text block] Earnings per share [abstract] Earnings per share [line items] Basic earnings per share [abstract] Basic earnings (loss) per share from continuing operations Basic earnings (loss) per share from discontinued operations Total basic earnings (loss) per share Diluted earnings per share [abstract] Diluted earnings (loss) per share from continuing operations Diluted earnings (loss) per share from discontinued operations Total diluted earnings (loss) per share of 91
23 [410000] Statement of comprehensive income, OCI components presented net of tax Concept Statement of comprehensive income [abstract] Accumulated Current Year Accumulated Previous Year Quarter Current Year Quarter Previous Year Profit (loss) 4,433,949,000 4,436,549,000 1,658,710,000 1,620,190,000 Other comprehensive income [abstract] Components of other comprehensive income that will not be reclassified to profit or loss, net of tax [abstract] Other comprehensive income, net of tax, gains (losses) from investments in equity instruments Other comprehensive income, net of tax, gains (losses) on revaluation Other comprehensive income, net of tax, gains (losses) on remeasurements of defined benefit plans Other comprehensive income, net of tax, change in fair value of financial liability attributable to change in credit risk of liability Other comprehensive income, net of tax, gains (losses) on hedging instruments that hedge investments in equity instruments Share of other comprehensive income of associates and joint ventures accounted for using equity method that will not be reclassified to profit or loss, net of tax 0 (45,000,000) 0 (22,500,000) Total other comprehensive income that will not be reclassified to profit or loss, net of tax 0 (45,000,000) 0 (22,500,000) Components of other comprehensive income that will be reclassified to profit or loss, net of tax [abstract] Exchange differences on translation [abstract] Gains (losses) on exchange differences on translation, net of tax Reclassification adjustments on exchange differences on translation, net of tax Other comprehensive income, net of tax, exchange differences on translation Available-for-sale financial assets [abstract] Gains (losses) on remeasuring available-for-sale financial assets, net of tax Reclassification adjustments on available-for-sale financial assets, net of tax Other comprehensive income, net of tax, available-for-sale financial assets Cash flow hedges [abstract] Gains (losses) on cash flow hedges, net of tax (14,421,000) 84,377,000 (15,737,000) 12,992,000 Reclassification adjustments on cash flow hedges, net of tax Amounts removed from equity and included in carrying amount of non-financial asset (liability) whose acquisition or incurrence was hedged highly probable forecast transaction, net of tax Other comprehensive income, net of tax, cash flow hedges (14,421,000) 84,377,000 (15,737,000) 12,992,000 Hedges of net investment in foreign operations [abstract] Gains (losses) on hedges of net investments in foreign operations, net of tax (1,328,490,000) 1,339,557,000 (820,918,000) 636,683,000 Reclassification adjustments on hedges of net investments in foreign operations, net of tax Other comprehensive income, net of tax, hedges of net investments in foreign operations Change in value of time value of options [abstract] (1,328,490,000) 1,339,557,000 (820,918,000) 636,683,000 Gains (losses) on change in value of time value of options, net of tax Reclassification adjustments on change in value of time value of options, net of tax Other comprehensive income, net of tax, change in value of time value of options Change in value of forward elements of forward contracts [abstract] Gains (losses) on change in value of forward elements of forward contracts, net of tax Reclassification adjustments on change in value of forward elements of forward contracts, net of tax Other comprehensive income, net of tax, change in value of forward elements of forward of 91
24 Concept contracts Change in value of foreign currency basis spreads [abstract] Accumulated Current Year Accumulated Previous Year Quarter Current Year Quarter Previous Year Gains (losses) on change in value of foreign currency basis spreads, net of tax Reclassification adjustments on change in value of foreign currency basis spreads, net of tax Other comprehensive income, net of tax, change in value of foreign currency basis spreads Share of other comprehensive income of associates and joint ventures accounted for using equity method that will be reclassified to profit or loss, net of tax (43,858,000) 33,364,000 (30,067,000) 33,362,000 Total other comprehensive income that will be reclassified to profit or loss, net of tax (1,386,769,000) 1,457,298,000 (866,722,000) 683,037,000 Total other comprehensive income (1,386,769,000) 1,412,298,000 (866,722,000) 660,537,000 Total comprehensive income 3,047,180,000 5,848,847, ,988,000 2,280,727,000 Comprehensive income attributable to [abstract] Comprehensive income, attributable to owners of parent 2,992,597,000 5,621,862,000 2,081,264,000 3,453,761,000 Comprehensive income, attributable to non-controlling interests 54,583, ,985,000 (1,289,276,000) (1,173,034,000) 24 of 91
25 [520000] Statement of cash flows, indirect method Concept Statement of cash flows [abstract] Cash flows from (used in) operating activities [abstract] Accumulated Current Year Accumulated Previous Year Profit (loss) 4,433,949,000 4,436,549,000 Adjustments to reconcile profit (loss) [abstract] Discontinued operations 0 0 Adjustments for income tax expense 1,548,508,000 1,990,868,000 Adjustments for finance costs 0 0 Adjustments for depreciation and amortisation expense 1,493,438,000 1,357,277,000 Adjustments for impairment loss (reversal of impairment loss) recognised in profit or loss 4,900,000 (77,964,000) Adjustments for provisions 0 0 Adjustments for unrealised foreign exchange losses (gains) (172,317,000) 213,080,000 Adjustments for share-based payments 0 0 Adjustments for fair value losses (gains) 733,805,000 (577,397,000) Adjustments for undistributed profits of associates 0 0 Adjustments for losses (gains) on disposal of non-current assets (32,373,000) (37,302,000) Participation in associates and joint ventures 0 0 Adjustments for decrease (increase) in inventories (2,496,579,000) (363,262,000) Adjustments for decrease (increase) in trade accounts receivable (1,168,530,000) 11,514,000 Adjustments for decrease (increase) in other operating receivables (154,616,000) (123,690,000) Adjustments for increase (decrease) in trade accounts payable (5,998,000) 1,713,875,000 Adjustments for increase (decrease) in other operating payables 75,718, ,078,000 Other adjustments for non-cash items 0 0 Other adjustments for which cash effects are investing or financing cash flow 0 0 Straight-line rent adjustment 0 0 Amortization of lease fees 0 0 Setting property values 0 0 Other adjustments to reconcile profit (loss) (2,331,445,000) (2,163,811,000) Total adjustments to reconcile profit (loss) (2,505,489,000) 2,510,266,000 Net cash flows from (used in) operations 1,928,460,000 6,946,815,000 Dividends paid 0 0 Dividends received 0 0 Interest paid (560,208,000) (434,430,000) Interest received (16,530,000) (8,578,000) Income taxes refund (paid) 0 0 Other inflows (outflows) of cash 0 0 Net cash flows from (used in) operating activities 2,472,138,000 7,372,667,000 Cash flows from (used in) investing activities [abstract] Cash flows from losing control of subsidiaries or other businesses 0 0 Cash flows used in obtaining control of subsidiaries or other businesses 0 0 Other cash receipts from sales of equity or debt instruments of other entities 0 0 Other cash payments to acquire equity or debt instruments of other entities 0 0 Other cash receipts from sales of interests in joint ventures 0 0 Other cash payments to acquire interests in joint ventures 0 0 Proceeds from sales of property, plant and equipment 255,766, ,012,000 Purchase of property, plant and equipment 3,988,414,000 3,451,509,000 Proceeds from sales of intangible assets 0 0 Purchase of intangible assets 97,001,000 1,176,000 Proceeds from sales of other long-term assets of 91
26 Concept Accumulated Current Year Accumulated Previous Year Purchase of other long-term assets 0 0 Proceeds from government grants 0 0 Cash advances and loans made to other parties 0 0 Cash receipts from repayment of advances and loans made to other parties 0 0 Cash payments for future contracts, forward contracts, option contracts and swap contracts 0 0 Cash receipts from future contracts, forward contracts, option contracts and swap contracts 0 0 Dividends received 0 0 Interest paid 0 0 Interest received 16,530,000 8,578,000 Income taxes refund (paid) 0 0 Other inflows (outflows) of cash (1,986,000) 64,000 Net cash flows from (used in) investing activities (3,815,105,000) (3,247,031,000) Cash flows from (used in) financing activities [abstract] Proceeds from changes in ownership interests in subsidiaries that do not result in loss of control 0 0 Payments from changes in ownership interests in subsidiaries that do not result in loss of control 0 0 Proceeds from issuing shares 0 0 Proceeds from issuing other equity instruments 0 0 Payments to acquire or redeem entity's shares 0 0 Payments of other equity instruments 0 0 Proceeds from borrowings 25,163,344,000 3,120,764,000 Repayments of borrowings 19,235,548,000 4,483,465,000 Payments of finance lease liabilities 0 0 Proceeds from government grants 0 0 Dividends paid 894,710, ,984,000 Interest paid 431,011, ,075,000 Income taxes refund (paid) 0 0 Other inflows (outflows) of cash (4,408,900,000) (813,672,000) Net cash flows from (used in) financing activities 193,175,000 (2,758,432,000) Net increase (decrease) in cash and cash equivalents before effect of exchange rate changes (1,149,792,000) 1,367,204,000 Effect of exchange rate changes on cash and cash equivalents [abstract] Effect of exchange rate changes on cash and cash equivalents (621,333,000) 458,090,000 Net increase (decrease) in cash and cash equivalents (1,771,125,000) 1,825,294,000 Cash and cash equivalents at beginning of period 5,466,530,000 2,919,054,000 Cash and cash equivalents at end of period 3,695,405,000 4,744,348, of 91
27 [610000] Statement of changes in equity - Accumulated Current Components of equity [axis] Sheet 1 of 3 Issued capital Share premium Treasury shares Retained earnings Revaluation surplus Reserve of exchange differences on translation Reserve of cash flow hedges Reserve of gains and losses on hedging instruments that hedge investments in equity instruments Reserve of change in value of time value of options Statement of changes in equity [line items] Equity at beginning of period 5,363,595, ,223,897, ,204,021,000 80,576, Changes in equity [abstract] Comprehensive income [abstract] Profit (loss) ,373,318, Other comprehensive income (43,858,000) 0 (1,330,528,000) (6,335,000) 0 0 Total comprehensive income ,329,460,000 0 (1,330,528,000) (6,335,000) 0 0 Issue of equity Dividends recognised as distributions to owners ,847,839, Increase through other contributions by owners, equity Decrease through other distributions to owners, equity Increase (decrease) through other changes, equity Increase (decrease) through treasury share transactions, equity Increase (decrease) through changes in ownership interests in subsidiaries that do not result in loss of control, equity (1,941,006,000) Increase (decrease) through share-based payment transactions, equity Amount removed from reserve of cash flow hedges and included in initial cost or other carrying amount of non-financial asset (liability) or firm commitment for which fair value hedge accounting is applied Amount removed from reserve of change in value of time value of options and included in initial cost or other carrying amount of non-financial asset (liability) or firm commitment for which fair value hedge accounting is applied Amount removed from reserve of change in value of forward elements of forward contracts and included in initial cost or other carrying amount of non-financial asset (liability) or firm commitment for which fair value hedge accounting is applied Amount removed from reserve of change in value of foreign currency basis spreads and included in initial cost or other carrying amount of non-financial asset (liability) or firm commitment for which fair value hedge accounting is applied Total increase (decrease) in equity ,615,000 0 (1,330,528,000) (6,335,000) 0 0 Equity at end of period 5,363,595, ,764,512, ,493,000 74,241, of 91
28 Components of equity [axis] Sheet 2 of 3 Reserve of change in value of forward elements of forward contracts Reserve of change in value of foreign currency basis spreads Reserve of gains and losses on remeasuring available-for-sale financial assets Reserve of sharebased payments Reserve of remeasurements of defined benefit plans Amount recognised in other comprehensive income and accumulated in equity relating to non-current assets or disposal groups held for sale Reserve of gains and losses from investments in equity instruments Reserve of change in fair value of financial liability attributable to change in credit risk of liability Reserve for catastrophe Statement of changes in equity [line items] Equity at beginning of period Changes in equity [abstract] Comprehensive income [abstract] Profit (loss) Other comprehensive income Total comprehensive income Issue of equity Dividends recognised as distributions to owners Increase through other contributions by owners, equity Decrease through other distributions to owners, equity Increase (decrease) through other changes, equity Increase (decrease) through treasury share transactions, equity Increase (decrease) through changes in ownership interests in subsidiaries that do not result in loss of control, equity Increase (decrease) through share-based payment transactions, equity Amount removed from reserve of cash flow hedges and included in initial cost or other carrying amount of non-financial asset (liability) or firm commitment for which fair value hedge accounting is applied Amount removed from reserve of change in value of time value of options and included in initial cost or other carrying amount of non-financial asset (liability) or firm commitment for which fair value hedge accounting is applied Amount removed from reserve of change in value of forward elements of forward contracts and included in initial cost or other carrying amount of non-financial asset (liability) or firm commitment for which fair value hedge accounting is applied Amount removed from reserve of change in value of foreign currency basis spreads and included in initial cost or other carrying amount of non-financial asset (liability) or firm commitment for which fair value hedge accounting is applied Total increase (decrease) in equity Equity at end of period of 91
29 Components of equity [axis] Sheet 3 of 3 Reserve for equalisation Reserve of discretionary participation features Other comprehensive income Other reserves Equity attributable to owners of parent Non-controlling interests Equity Statement of changes in equity [line items] Equity at beginning of period ,284,597,000 23,872,089,000 1,828,177,000 25,700,266,000 Changes in equity [abstract] Comprehensive income [abstract] Profit (loss) ,373,318,000 60,631,000 4,433,949,000 Other comprehensive income (1,336,863,000) (1,380,721,000) (6,048,000) (1,386,769,000) Total comprehensive income (1,336,863,000) 2,992,597,000 54,583,000 3,047,180,000 Issue of equity Dividends recognised as distributions to owners ,847,839, ,847,839,000 Increase through other contributions by owners, equity Decrease through other distributions to owners, equity Increase (decrease) through other changes, equity Increase (decrease) through treasury share transactions, equity Increase (decrease) through changes in ownership interests in subsidiaries that do not result in loss of control, equity (1,941,006,000) (1,888,341,000) (3,829,347,000) Increase (decrease) through share-based payment transactions, equity Amount removed from reserve of cash flow hedges and included in initial cost or other carrying amount of non-financial asset (liability) or firm commitment for which fair value hedge accounting is applied Amount removed from reserve of change in value of time value of options and included in initial cost or other carrying amount of non-financial asset (liability) or firm commitment for which fair value hedge accounting is applied Amount removed from reserve of change in value of forward elements of forward contracts and included in initial cost or other carrying amount of non-financial asset (liability) or firm commitment for which fair value hedge accounting is applied Amount removed from reserve of change in value of foreign currency basis spreads and included in initial cost or other carrying amount of non-financial asset (liability) or firm commitment for which fair value hedge accounting is applied Total increase (decrease) in equity (1,336,863,000) (796,248,000) (1,833,758,000) (2,630,006,000) Equity at end of period ,734,000 23,075,841,000 (5,581,000) 23,070,260, of 91
30 [610000] Statement of changes in equity - Accumulated Previous Components of equity [axis] Sheet 1 of 3 Issued capital Share premium Treasury shares Retained earnings Revaluation surplus Reserve of exchange differences on translation Reserve of cash flow hedges Reserve of gains and losses on hedging instruments that hedge investments in equity instruments Reserve of change in value of time value of options Statement of changes in equity [line items] Equity at beginning of period 5,363,595, ,154,288, ,985,000 23,302, Changes in equity [abstract] Comprehensive income [abstract] Profit (loss) ,218,923, Other comprehensive income (11,636,000) 0 1,330,198,000 84,377, Total comprehensive income ,207,287, ,330,198,000 84,377, Issue of equity Dividends recognised as distributions to owners ,498, Increase through other contributions by owners, equity Decrease through other distributions to owners, equity Increase (decrease) through other changes, equity Increase (decrease) through treasury share transactions, equity Increase (decrease) through changes in ownership interests in subsidiaries that do not result in loss of control, equity Increase (decrease) through share-based payment transactions, equity Amount removed from reserve of cash flow hedges and included in initial cost or other carrying amount of non-financial asset (liability) or firm commitment for which fair value hedge accounting is applied Amount removed from reserve of change in value of time value of options and included in initial cost or other carrying amount of non-financial asset (liability) or firm commitment for which fair value hedge accounting is applied Amount removed from reserve of change in value of forward elements of forward contracts and included in initial cost or other carrying amount of non-financial asset (liability) or firm commitment for which fair value hedge accounting is applied Amount removed from reserve of change in value of foreign currency basis spreads and included in initial cost or other carrying amount of non-financial asset (liability) or firm commitment for which fair value hedge accounting is applied Total increase (decrease) in equity ,341,789, ,330,198,000 84,377, Equity at end of period 5,363,595, ,496,077, ,823,183, ,679, of 91
31 Components of equity [axis] Sheet 2 of 3 Reserve of change in value of forward elements of forward contracts Reserve of change in value of foreign currency basis spreads Reserve of gains and losses on remeasuring available-for-sale financial assets Reserve of sharebased payments Reserve of remeasurements of defined benefit plans Amount recognised in other comprehensive income and accumulated in equity relating to non-current assets or disposal groups held for sale Reserve of gains and losses from investments in equity instruments Reserve of change in fair value of financial liability attributable to change in credit risk of liability Reserve for catastrophe Statement of changes in equity [line items] Equity at beginning of period Changes in equity [abstract] Comprehensive income [abstract] Profit (loss) Other comprehensive income Total comprehensive income Issue of equity Dividends recognised as distributions to owners Increase through other contributions by owners, equity Decrease through other distributions to owners, equity Increase (decrease) through other changes, equity Increase (decrease) through treasury share transactions, equity Increase (decrease) through changes in ownership interests in subsidiaries that do not result in loss of control, equity Increase (decrease) through share-based payment transactions, equity Amount removed from reserve of cash flow hedges and included in initial cost or other carrying amount of non-financial asset (liability) or firm commitment for which fair value hedge accounting is applied Amount removed from reserve of change in value of time value of options and included in initial cost or other carrying amount of non-financial asset (liability) or firm commitment for which fair value hedge accounting is applied Amount removed from reserve of change in value of forward elements of forward contracts and included in initial cost or other carrying amount of non-financial asset (liability) or firm commitment for which fair value hedge accounting is applied Amount removed from reserve of change in value of foreign currency basis spreads and included in initial cost or other carrying amount of non-financial asset (liability) or firm commitment for which fair value hedge accounting is applied Total increase (decrease) in equity Equity at end of period of 91
32 Components of equity [axis] Sheet 3 of 3 Reserve for equalisation Reserve of discretionary participation features Other comprehensive income Other reserves Equity attributable to owners of parent Non-controlling interests Equity Statement of changes in equity [line items] Equity at beginning of period ,287,000 17,034,170,000 1,559,716,000 18,593,886,000 Changes in equity [abstract] Comprehensive income [abstract] Profit (loss) ,218,923, ,626,000 4,436,549,000 Other comprehensive income ,414,575,000 1,402,939,000 9,359,000 1,412,298,000 Total comprehensive income ,414,575,000 5,621,862, ,985,000 5,848,847,000 Issue of equity Dividends recognised as distributions to owners ,498,000 46,609, ,107,000 Increase through other contributions by owners, equity Decrease through other distributions to owners, equity Increase (decrease) through other changes, equity Increase (decrease) through treasury share transactions, equity Increase (decrease) through changes in ownership interests in subsidiaries that do not result in loss of control, equity Increase (decrease) through share-based payment transactions, equity Amount removed from reserve of cash flow hedges and included in initial cost or other carrying amount of non-financial asset (liability) or firm commitment for which fair value hedge accounting is applied Amount removed from reserve of change in value of time value of options and included in initial cost or other carrying amount of non-financial asset (liability) or firm commitment for which fair value hedge accounting is applied Amount removed from reserve of change in value of forward elements of forward contracts and included in initial cost or other carrying amount of non-financial asset (liability) or firm commitment for which fair value hedge accounting is applied Amount removed from reserve of change in value of foreign currency basis spreads and included in initial cost or other carrying amount of non-financial asset (liability) or firm commitment for which fair value hedge accounting is applied Total increase (decrease) in equity ,414,575,000 4,756,364, ,376,000 4,936,740,000 Equity at end of period ,930,862,000 21,790,534,000 1,740,092,000 23,530,626, of 91
33 [700000] Informative data about the Statement of financial position Concept Close Current Quarter Close Previous Exercise Informative data of the Statement of Financial Position [abstract] Capital stock (nominal) 5,363,595,000 5,363,595,000 Restatement of capital stock 0 0 Plan assets for pensions and seniority premiums 0 0 Number of executives 0 0 Number of employees 6,701 6,690 Number of workers 13,646 13,243 Outstanding shares 432,749, ,749,079 Repurchased shares 0 0 Restricted cash 0 0 Guaranteed debt of associated companies of 91
34 [700002] Informative data about the Income statement Concept Informative data of the Income Statement [abstract] Accumulated Current Year Accumulated Previous Year Quarter Current Year Quarter Previous Year Operating depreciation and amortization [1] 1,498,338,000 [2] 1,279,313, ,352, ,653, of 91
35 [700003] Informative data - Income statement for 12 months Concept Current Year Previous Year Informative data - Income Statement for 12 months [abstract] Revenue 71,067,998,000 64,551,621,000 Profit (loss) from operating activities 9,313,162,000 8,568,054,000 Profit (loss) 6,231,336,000 1,845,525,000 Profit (loss), attributable to owners of parent 6,076,434,000 1,533,660,000 Operating depreciation and amortization [3] 2,061,582,000 [4] 1,845,542, of 91
36 [800001] Breakdown of credits Banks [abstract] Foreign trade Institution [axis] Foreign institution (yes/no) Contract signing date Expiration date Interest rate Current year Until 1 year Until 2 years Domestic currency Time interval [axis] Until 3 years Until 4 years Until 5 years or more Denomination [axis] Current year Until 1 year Until 2 years Foreign currency Time interval [axis] Until 3 years Until 4 years Until 5 years or more TOTAL Banks - secured TOTAL Commercial banks 1.BANCO BLADEX SI FIJO 1.86% ,585, MERCANTIL COMMERCE BANK SI FIJO 2.01% ,560, BANCO BLADEX SI FIJO 1.77% ,390, BBVA ESPAÑA SI FIJO 1.290% ,558,000 8,658,000 7,113,000 1,647, REINDUS SI FIJO 3.950% ,231,000 2,576,000 2,748,000 2,748,000 3,435, SANTANDER ESPAÑA SI VAR. EURIBOR+0.65% ,177,000 5,209,000 5,244,000 5,265,000 1,319, BANCA INTESA SANPAOLO GROUP SI FIJO 1.190% ,999,000 37,999,000 37,985, BANCO POPULAR SI FIJO 2.389% , , , BBVA ESPAÑA SI FIJO 1.53% ,173,000 36,173,000 36,173,000 36,173, ,519, BONO 10Y2024 SI FIJO 4.875% ,200,531, RABOBANK REVOLVENTE SI VAR. L+1.00% ,532,500, BANK OF TOKYO SI FIJO 7.38% 1,000,000, SANTANDER NO FIJO % 850,000, SANTANDER NO FIJO % 80,000, BBVA BANCOMER NO FIJO 7.65% 870,000, SCOTIABANK REVOLVENTE SI VAR. L+0.75% ,175,600, RABOBANK TERM LOAN SI VAR. L+1.00% ,975, ,925, ,925,000 1,709,834,000 TOTAL 2,800,000, ,535,000 90,758, ,223,000 2,673,109, ,758,000 13,556,138,000 Other banks TOTAL Total banks TOTAL 2,800,000, ,535,000 90,758, ,223,000 2,673,109, ,758,000 13,556,138,000 Stock market [abstract] Listed on stock exchange - unsecured TOTAL Listed on stock exchange - secured TOTAL Private placements - unsecured TOTAL Private placements - secured TOTAL Total listed on stock exchanges and private placements TOTAL Other current and non-current liabilities with cost [abstract] 36 of 91
37 Institution [axis] Other current and non-current liabilities with cost Foreign institution (yes/no) Contract signing date Expiration date Interest rate Current year Until 1 year Until 2 years Domestic currency Time interval [axis] Until 3 years Until 4 years Until 5 years or more Denomination [axis] Current year Until 1 year Until 2 years Foreign currency Time interval [axis] Until 3 years Until 4 years Until 5 years or more TOTAL Total other current and non-current liabilities with cost TOTAL Suppliers [abstract] Suppliers VARIOS NO ,460,865, VARIOS EXT NO ,511,587, TOTAL 0 1,460,865, ,511,587, Total suppliers TOTAL 0 1,460,865, ,511,587, Other current and non-current liabilities [abstract] Other current and non-current liabilities VARIOS CORTO PLAZO NO 0 170,755, TOTAL 0 170,755, Total other current and non-current liabilities TOTAL 0 170,755, Total credits TOTAL 2,800,000,000 1,631,620, ,535,000 3,602,345, ,223,000 2,673,109, ,758,000 13,556,138, of 91
![[800003] Annex - Monetary foreign currency position Disclosure of monetary foreign currency position [text block] The closing exchange rates used for preparing the financial information are as](/docs-images/75/72519556/images/38-1.jpg "follows: Foreign currency position [abstract] Monetary assets [abstract] Dollars Dollar equivalent in pesos Currencies [axis] Other currencies equivalent in dollars Other currencies equivalent in")
38 [800003] Annex - Monetary foreign currency position Disclosure of monetary foreign currency position [text block] The closing exchange rates used for preparing the financial information are as follows: Foreign currency position [abstract] Monetary assets [abstract] Dollars Dollar equivalent in pesos Currencies [axis] Other currencies equivalent in dollars Other currencies equivalent in pesos Total pesos Current monetary assets 309,082,000 5,603,657, ,318,000 3,269,162,000 8,872,819,000 Non-current monetary assets 907,000 16,444,000 2,933,000 53,170,000 69,614,000 Total monetary assets 309,989,000 5,620,101, ,251,000 3,322,332,000 8,942,433,000 Liabilities position [abstract] Current liabilities 276,062,000 5,005,004, ,316,000 1,945,639,000 6,950,643,000 Non-current liabilities 949,317,000 17,211,117,000 23,296, ,354,000 17,633,471,000 Total liabilities 1,225,379,000 22,216,121, ,612,000 2,367,993,000 24,584,114,000 Net monetary assets (liabilities) (915,390,000) (16,596,020,000) 52,639, ,339,000 (15,641,681,000) 38 of 91
39 [800005] Annex - Distribution of income by product MASECA Income type [axis] National income Export income Income of subsidiaries abroad Total income HARINA DE MAIZ 13,978,535, ,978,535,000 MASECA, MISSION, GUERRERO H. DE MAIZ, TORTILLAS, OTROS ,270,911,000 38,270,911,000 TOTAL 13,978,535, ,270,911,000 52,249,446, of 91
40 [800007] Annex - Financial derivate instruments Management discussion about the policy uses of financial derivate instruments, explaining if these policies are allowed just for coverage or for other uses like trading [text block] -Derivative financial instruments contracting policies. Gruma s policies regarding financial instruments establish that the acquisition of any derivative financial instruments agreement must be associated with the hedging of an underlying operation of the company, such as the purchase of inventory or fuel consumption (commodities), interest payment at a determined rate, foreign currency payments at an exchange rate, among others. Gruma has a Risks Management policy that details the procedure to authorize their contracting. -General description of the objectives to use derivative financial instruments. The availability and price of corn and other agricultural commodities are subject to important fluctuations due to factors that are beyond our control, such as the weather, planting seasons, agricultural programs and government policies (both national and foreign), changes in the global supply/demand created by population growth, competitors and global production of similar harvests. The objective of using derivative financial instruments is to reduce the aforementioned risks. Likewise, in the normal course of business, Gruma enters into transactions in which it could be exposed to risks for changes in the interest rates or for fluctuations of exchange rates. The variations in the exchange rates can result from changes in the economic conditions, tax and monetary policies, volatile conditions, global markets liquidity, international and local political events, among others. In order to minimize these risks Gruma has entered into certain financial instruments. -Instruments used and hedging or negotiation strategies implemented. We hedge a part of our production requirements through futures and options contracts in order to minimize the risk generated by the fluctuations in the price and supply of corn, natural gas and diesel, risk that exists as an ordinary part of our business. Additionally, Gruma has entered into certain financial instruments such as interest rate swaps and foreign exchange financial instruments (FX). 40 of 91
41 -Allowed negotiation markets and eligible counterparties. In order to minimize the counterparty solvency risk, Gruma enters into derivative financial instruments only with major national and international financial institutions using mainly, when applicable depending on the derivative instrument used, the standard International Swaps and Derivatives Association, Inc. ( ISDA ) authorized forms and long form confirmation agreements. -Policies on the appointment of calculation or valuation agents. Gruma appoints the counterparties as calculation agents who periodically send the account statements of the open positions of the financial instruments. -Policies on margins, collaterals, credit lines, VAR. The Central Risks Committee of Gruma establishes that the derivative financial transactions may be performed with collaterals or using credit lines for that purpose. The majority of the executed transactions establish certain obligations on behalf of the Issuer to guarantee, from time to time, the differential between fair value and the credit line (risk margin) established with the respective financial institutions, consequently the timely compliance of those obligations are assured. Additionally, it is made clear that, upon failure to fulfill the obligations of providing collateral, the counterparty will have the right, but not the obligation, to early terminate the transactions in place, and to demand the corresponding consideration pursuant to the agreed terms. In addition and in order to maintain a risk exposure level within the boundaries authorized by the Central Risks Committee and the Audit Committee, the Corporate Treasury department reports, in a weekly and monthly manner, the information about the Derivative Financial Instruments to such organs, respectively, and quarterly to the Board of Directors. As of this date, Gruma has margin calls with their counterparty for $162,527 thousand pesos. -Internal control procedures to manage the exposure to market and liquidity risks. The Finance Department of each region in which the company has operations, evaluates the changes in the exposure of the derivative financial instruments and periodically informs them to the Corporate Financial & Planning Management, and the latter informs the General Management and the Central Risks Committee when the market conditions have materially changed. The execution of the derivative financial instruments is authorized pursuant to the guidelines set forth in the Risks Management policy of the company. -Existence of an independent third party who reviews the aforementioned procedures. The procedures are reviewed in the external audit process performed by PricewaterhouseCoopers, S.C. annually. 41 of 91
42 -Information regarding the authorization of the use of derivatives and if there is a committee in charge of giving those authorizations and the derivatives risk management. All derivative financial transactions must be previously authorized by a Divisional Risks Committee and by the Central Risks Committee which is formed by members of the senior management and approved by the Audit Committee and the Board of Directors. General description about valuation techniques, standing out the instruments valuated at cost or fair value, just like methods and valuation techniques [text block] -Description of methods, valuation techniques and valuation frequency: Derivative financial instruments that are not reported as hedging instruments for accounting purposes are initially recorded at fair value, and at the end of each reporting period they are remeasured at their fair value. The result of this valuation is recognized in the income statement. All accounting records comply with applicable regulations and are based on the official financial statements of each Financial Institution. For derivative financial instruments that qualify as cash flow hedges, the effects of changes in the fair value of such derivative financial instrument are included within the other comprehensive income in equity, based on an evaluation of the hedge effectiveness. Such changes in the fair value are reclassified to income in the period when the firm commitment or projected transaction is realized. Derivative financial instruments that qualify as fair value hedges are initially recorded at fair value and the effects of changes in the fair value are recorded in the income statement, together with any changes in the fair value of the hedged asset or liability that are attributable to the hedged risk. -Clarification concerning if the valuation is performed by an independent third party or if it is an internal valuation and on which cases one or the other valuation is used. If it is performed by a third party, if his arranger, seller or counterparty of the derivative financial instrument is mentioned. Gruma determines the fair value based on recognized market prices. When not quoted in markets, fair value is determined using valuation techniques commonly used in the financial sector. Fair value reflects the credit risk of the instrument and includes adjustments to consider the credit risk of the Company or the counterparty, when applicable. Regarding purchases of corn, natural gas and diesel futures the market values of the US Chicago and New York futures exchanges are taken as reference, through the specialized Financial Institutions engaged for such purposes. These valuations are made periodically. 42 of 91
43 -For hedging instruments, explanation of the method used to determine the effectiveness of the same, identifying the current available hedging level of the global position. Effectiveness of hedges is determined when the changes in fair value or cash flows of the underlying operation are offset by changes in fair value or cash flows of the hedging instrument in a ratio that falls within an inverse correlation range from 80% to 125%. When a hedge is no longer effective as well as when the hedge does not comply with the documentation requirements set forth in the International Financial Reporting Standards the results of the valuation of the financial instruments at their fair value are recognized in the income statement. As of September 30, 2017, the open positions of financial instruments of corn that qualified as hedges had 100% of effectiveness. Management discussion about intern and extern sources of liquidity that could be used for attending requirements related to financial derivate instruments [text block] -Discussion about the internal and external sources of liquidity that could be used to attend the requirements related to derivative financial instruments. There is potential liquidity requirements under our derivative financial instruments described in Section II below. Gruma plans to use its available cash flow as well as other available liquidity sources to satisfy such liquidity requirements. Changes and management explanation in principal risk exposures identified, as contingencies and events known by the administration that could affect future reports [text block] -Description of the changes in the exposure to major identified risks, its management and contingencies that could affect it in future reports. The availability and price of corn and other agricultural commodities are subject to important fluctuations due to factors that are beyond our control, such as the weather, planting seasons, agricultural programs and government policies (both national and foreign), changes in the global supply/demand created by population growth, competitors and global production of similar harvests. We hedge a part of our production requirements through futures contracts and options in 43 of 91
44 order to reduce the risk generated by the fluctuations in price and supply of corn, natural gas and diesel, risks that exist in the normal course of our business. Gruma carried out forward and options transactions with the intention of hedging the currency risk of the Mexican peso with respect to the U.S. dollar, related with the price of corn purchases for domestic and imported harvest. The fair value of these derivative instruments can decrease or increase in the future before the instruments expire. The variations in the exchange rate can result from changes in the economic conditions, tax and monetary policies, volatile conditions, global markets liquidity, international and local political events, among others. -Disclosure of eventualities, such as changes on the value of the underlying asset, which cause it to differ from the one originally agreed, that modify it, or that the hedging level has changed, pursuant to which the issuer is required to assume new obligations or affect its liquidity: Gruma carried out forward and options transactions with the intention of hedging the currency risk of the Mexican peso with respect to the U.S. dollar, related with the price of corn purchases for domestic and imported harvest. The fair value of these derivative instruments can decrease or increase in the future before the instruments expire. The variations in the exchange rate can result from changes in the economic conditions, tax and monetary policies, volatile conditions, global markets liquidity, international and local political events, among others. -Include Influence on results or cash flow of the mentioned derivative transactions: As of September 30, 2017, the open positions of corn and fuels financial instruments were valued at their fair value. The financial instruments of corn that qualified as hedges for accounting purposes represented a loss of $88,048 thousand pesos which was applied to other comprehensive income in equity. As of September 30, 2017 the Company did not have open positions of corn financial instruments that did not qualify as hedges for accounting. The open positions of fuels financial instruments that did not qualify as hedges for accounting purposes represented a gain of $10,048 thousand pesos which was applied to the income statement. As of September 30, 2017, the foreign exchange derivative financial instruments were valuated at fair value. The open positions of these instruments that qualified as hedges for accounting purposes represented a gain of approximately $40,235 thousand pesos was applied to other comprehensive income in equity 44 of 91
45 As of September 30, 2017, the open positions of these instruments that did not qualify as hedges for accounting represented a gain of $13,374 thousand pesos, which was reflected on the income statement. -Description and number of the derivative financial instruments that had expired during the quarter and those which its position has been closed. As of September 30, 2017, the Company reclassified the amount of $8,302 thousand pesos from comprehensive income and recognized it as part of inventory. This amount refers to the gain from the closed operations for corn hedges, in which the grain, subject to these hedges, was received. Additionally, the corn hedges terminated during the period and for which no corn has been received, originated a gain of $134,934 thousand pesos, which was recognized in comprehensive income, and will be transferred to inventory once the corn is received. The operations that concluded during the third quarter of 2017, for financial instruments of corn and fuels, recognized in income, represented a gain of $60,681 thousand pesos. As of September 30, 2017, the favorable effect in the results of the concluded transactions of these instruments is of $94,505 thousand pesos. The operations that concluded during the third quarter of 2017 regarding the foreign exchange financial instruments originated a loss of $227,133 thousand pesos which was reflected on the income statement. As of September 30, 2017, the unfavorable effect in the results of the concluded transactions of these instruments is of $579,553 thousand pesos. -Description and number of the margin calls presented during the quarter. As of September 30, 2017, the company has revolving funds denominated margin calls for $162,527 thousand pesos. The margin calls are required upon the variations in the prices of the underlying asset as collateral in favor of the counterparty in order to reduce the risk of nonpayment in an event of default. -Disclosure of any breach that has been presented to the respective agreements. The company has complied with all obligations under its derivative financial instruments agreements. Quantitative information for disclosure [text block] I. Characteristics of the derivative financial instruments as of the date of this report. 45 of 91


46 Summary of Derivative Financial Instruments as of September 30, 2017 Amounts in Thousands of Pesos Corn and Fuels Derivative Financial Instruments Exchange Rate Derivative Financial Instruments * The sole purpose of the Company s acquisition of derivative financial instruments is hedging market and liquidity risks, notwithstanding, the accounting rules require specific documentation and evidence to classify a derivative financial instrument as a hedging instrument, and consequently the company classified its derivative financial instruments as negotiation instruments. -As of September 30, 2017, the financial instruments transactions of corn and fuels in long positions represented a loss of $78,000 thousand pesos and the financial instruments transactions of exchange rate represented a gain of $53,609 thousand pesos in long positions. -As of September 30, 2017 the Company has revolving funds denominated margin calls for $162,527 thousand pesos, required upon variations in prices of the underlying asset as collateral in favor of the counterparty in order to reduce the risk of non-payment in an event of default. As of September 30, 2017, the Company reclassified the amount of $8,302 thousand pesos from comprehensive income and recognized it as part of inventory. This amount refers to the gain from 46 of 91

47 the closed operations for corn hedges, in which the grain, subject to these hedges, was received. Additionally, the corn hedges terminated during the period and for which no corn has been received, originated a gain of $134,934 thousand pesos, which was recognized in comprehensive income, and will be transferred to inventory once the corn is received. The operations that concluded during the third quarter of 2017, for financial instruments of corn and fuels, recognized in income, represented a gain of $60,681 thousand pesos. As of September 30, 2017, the favorable effect in the results of the concluded transactions of these instruments is of $94,505 thousand pesos. The operations that concluded during the third quarter of 2017 regarding the foreign exchange financial instruments originated a loss of $227,133 thousand pesos, which was reflected on the income statement. As of September 30, 2017, the unfavorable effect in the results of the concluded transactions of these instruments is of $579,553 thousand pesos. II. Sensitivity analysis Corn and Fuels Derivative Financial Instruments: According to the position as of September 30, 2017, a hypothetical 10 percent loss of the fuels value would result in an additional adverse effect of $21,275 thousand pesos (for non-qualifying contracts). This sensitivity analysis is determined based on the underlying assets values obtained from the valuation performed as of September 30, Exchange Rate Derivative Financial Instruments: Based on our position as of September 30, 2017, a hypothetical appreciation of 10% of the Mexican peso against the United States dollar would result in an additional unfavorable effect of $129,839 thousand pesos (for non-qualifying contracts). This sensitivity analysis is based in the value of the underlying assets given in the valuation made by the counterparty as of September 30, 2017, which includes the effects on the exchange rate variables, time and volatility. 47 of 91


48 * The sole purpose of the Company s acquisition of derivative financial instruments is hedging market and liquidity risks, notwithstanding, the accounting rules require specific documentation and evidence to classify a derivative financial instrument as a hedging instrument, and consequently the company classified its derivative financial instruments as negotiation instruments. -For derivative financial instruments with negotiation purposes or those whose ineffectiveness of the hedge must be acknowledged, description of the method applied in determining the expected losses or the price sensitivity of the derivatives, including volatility. The potential losses of the derivative financial instruments were determined pursuant to the underlying assets value and their volatility, under a sensibility analysis considering a 10%, 25% and 50% loss in the underlying assets value. -Presentation of a sensitivity analysis for such transactions that includes, at least, the following elements: a) Identification of the risks that may create losses in the issuer for derivative transactions. b) Identification of the instruments that would create such losses. The fair value of corn and fuels derivative financial instruments can decrease or increase in the future before the date of maturity of the instruments. These variations can be the result of factors that are beyond our control, such as the weather, planting seasons, agricultural programs and government policies (both national and foreign), changes in the global supply/demand created by population growth, competitors and global production of similar harvests. The fair value of the foreign exchange financial instruments can decrease or increase in the future before the expiration date of said instruments. These variations in the exchange rate can be the result of changes in the economic, fiscal policies or monetary conditions, volatility, liquidity in global markets, international or local political events, among others. -Presentation of 3 scenarios (probable, possible and remote or stress) that can create negative circumstances for the issuer, identifying the assumptions and factors taken into consideration in their execution. a) Possible scenario with a variation of at least 25% in the underlying asset s Price and remote scenario with a variation of at least 50%. The sensitivity chart already contains this information. -Estimation of the potential loss reflected in the income statement and cash flow for each scenario. 48 of 91
49 For the derivative financial instruments of corn and fuels, based on our position as of September 30, 2017, a hypothetical change of 10%, 25% and 50% loss in market prices applied to the fair value of the instruments would result in an additional charge to income for $21,275, $53,187 and $106,374 thousands of pesos, respectively. For the foreign exchange financial instruments, based on our position as of September 30, 2017, a hypothetical change of 10%, 25% and 50% of appreciation of the Mexican peso against the United States dollar would result in an additional charge of $129,829, $324,597 and $649,193 thousand pesos, respectively. -For hedging financial instruments, indicate the stress level or the variation of the underlying assets under which the effectiveness measures result sufficient. Effectiveness of hedges are determined when the changes in fair market value or cash flows of the underlying operation are offset by changes in fair market value or cash flows of the hedging instrument in a ratio that falls within an inverse correlation range from 80% to 125%. 49 of 91
50 [800100] Notes - Subclassifications of assets, liabilities and equities Concept Subclassifications of assets, liabilities and equities [abstract] Cash and cash equivalents [abstract] Cash [abstract] Close Current Quarter Close Previous Exercise Cash on hand 0 0 Balances with banks 3,574,385,000 5,420,607,000 Total cash 3,574,385,000 5,420,607,000 Cash equivalents [abstract] Short-term deposits, classified as cash equivalents 0 0 Short-term investments, classified as cash equivalents 121,020,000 45,923,000 Other banking arrangements, classified as cash equivalents 0 0 Total cash equivalents 121,020,000 45,923,000 Other cash and cash equivalents 0 0 Total cash and cash equivalents 3,695,405,000 5,466,530,000 Trade and other current receivables [abstract] Current trade receivables 6,497,110,000 6,465,715,000 Current receivables due from related parties 0 0 Current prepayments [abstract] Current advances to suppliers 0 0 Current prepaid expenses 426,218, ,052,000 Total current prepayments 426,218, ,052,000 Current receivables from taxes other than income tax 1,041,261, ,593,000 Current value added tax receivables 1,041,261, ,593,000 Current receivables from sale of properties 0 0 Current receivables from rental of properties 0 0 Other current receivables 758,739, ,155,000 Total trade and other current receivables 8,723,328,000 7,935,515,000 Classes of current inventories [abstract] Current raw materials and current production supplies [abstract] Current raw materials 8,002,191,000 5,967,136,000 Current production supplies 0 0 Total current raw materials and current production supplies 8,002,191,000 5,967,136,000 Current merchandise 0 0 Current work in progress 233,865, ,526,000 Current finished goods 1,190,456,000 1,304,677,000 Current spare parts 616,044, ,576,000 Property intended for sale in ordinary course of business 0 0 Other current inventories 574,239, ,432,000 Total current inventories 10,616,795,000 8,682,347,000 Non-current assets or disposal groups classified as held for sale or as held for distribution to owners [abstract] Non-current assets or disposal groups classified as held for sale 0 0 Non-current assets or disposal groups classified as held for distribution to owners 0 0 Total non-current assets or disposal groups classified as held for sale or as held for distribution to owners 0 0 Trade and other non-current receivables [abstract] Non-current trade receivables 173,529, ,655,000 Non-current receivables due from related parties 0 0 Non-current prepayments 0 0 Non-current lease prepayments 0 0 Non-current receivables from taxes other than income tax of 91
51 Concept Close Current Quarter Close Previous Exercise Non-current value added tax receivables 0 0 Non-current receivables from sale of properties 0 0 Non-current receivables from rental of properties 0 0 Revenue for billing 0 0 Other non-current receivables 3,284,000 5,437,000 Total trade and other non-current receivables 176,813, ,092,000 Investments in subsidiaries, joint ventures and associates [abstract] Investments in subsidiaries 6,397,000 7,266,000 Investments in joint ventures 0 0 Investments in associates 0 0 Total investments in subsidiaries, joint ventures and associates 6,397,000 7,266,000 Property, plant and equipment [abstract] Land and buildings [abstract] Land 1,752,877,000 1,704,641,000 Buildings 6,008,541,000 5,968,793,000 Total land and buildings 7,761,418,000 7,673,434,000 Machinery 13,284,489,000 13,826,420,000 Vehicles [abstract] Ships 0 0 Aircraft 0 0 Motor vehicles 0 0 Total vehicles 0 0 Fixtures and fittings 0 0 Office equipment 0 0 Tangible exploration and evaluation assets 0 0 Mining assets 0 0 Oil and gas assets 0 0 Construction in progress 5,213,249,000 4,307,877,000 Construction prepayments 0 0 Other property, plant and equipment 513,163, ,654,000 Total property, plant and equipment 26,772,319,000 26,313,385,000 Investment property [abstract] Investment property completed 0 0 Investment property under construction or development 0 0 Investment property prepayments 0 0 Total investment property 0 0 Intangible assets and goodwill [abstract] Intangible assets other than goodwill [abstract] Brand names 86,007,000 93,810,000 Intangible exploration and evaluation assets 0 0 Mastheads and publishing titles 0 0 Computer software 164,560,000 77,207,000 Licences and franchises 2,212,000 2,744,000 Copyrights, patents and other industrial property rights, service and operating rights 0 0 Recipes, formulae, models, designs and prototypes 0 0 Intangible assets under development 0 0 Other intangible assets 171,532, ,767,000 Total intangible assets other than goodwill 424,311, ,528,000 Goodwill 3,437,549,000 3,665,126,000 Total intangible assets and goodwill 3,861,860,000 4,025,654,000 Trade and other current payables [abstract] Current trade payables 4,972,452,000 5,204,033, of 91
52 Concept Close Current Quarter Close Previous Exercise Current payables to related parties 0 0 Accruals and deferred income classified as current [abstract] Deferred income classified as current 0 0 Rent deferred income classified as current 0 0 Accruals classified as current 42,742,000 65,205,000 Short-term employee benefits accruals 42,742,000 65,205,000 Total accruals and deferred income classified as current 42,742,000 65,205,000 Current payables on social security and taxes other than income tax 39,993,000 17,841,000 Current value added tax payables 39,993,000 17,841,000 Current retention payables 0 0 Other current payables 5,057,403,000 4,436,428,000 Total trade and other current payables 10,112,590,000 9,723,507,000 Other current financial liabilities [abstract] Bank loans current 3,244,293,000 3,724,718,000 Stock market loans current 0 0 Other current iabilities at cost 0 0 Other current liabilities no cost 170,755,000 52,435,000 Other current financial liabilities 94,042,000 6,932,000 Total Other current financial liabilities 3,509,090,000 3,784,085,000 Trade and other non-current payables [abstract] Non-current trade payables 0 0 Non-current payables to related parties 0 0 Accruals and deferred income classified as non-current [abstract] Deferred income classified as non-current 0 0 Rent deferred income classified as non-current 0 0 Accruals classified as non-current 0 0 Total accruals and deferred income classified as non-current 0 0 Non-current payables on social security and taxes other than income tax 0 0 Non-current value added tax payables 0 0 Non-current retention payables 0 0 Other non-current payables 34,096,000 37,060,000 Total trade and other non-current payables 34,096,000 37,060,000 Other non-current financial liabilities [abstract] Bank loans non-current 16,910,228,000 12,229,868,000 Stock market loans non-current 0 0 Other non-current liabilities at cost 0 0 Other non-current liabilities no cost 0 0 Other non-current financial liabilities 0 0 Total Other non-current financial liabilities 16,910,228,000 12,229,868,000 Other provisions [abstract] Other non-current provisions 554,024, ,945,000 Other current provisions 107,982, ,075,000 Total other provisions 662,006, ,020,000 Other reserves [abstract] Revaluation surplus 0 0 Reserve of exchange differences on translation 873,493,000 2,204,021,000 Reserve of cash flow hedges 74,241,000 80,576,000 Reserve of gains and losses on hedging instruments that hedge investments in equity instruments 0 0 Reserve of change in value of time value of options 0 0 Reserve of change in value of forward elements of forward contracts 0 0 Reserve of change in value of foreign currency basis spreads 0 0 Reserve of gains and losses on remeasuring available-for-sale financial assets of 91
53 Concept Close Current Quarter Close Previous Exercise Reserve of share-based payments 0 0 Reserve of remeasurements of defined benefit plans 0 0 Amount recognised in other comprehensive income and accumulated in equity relating to non-current assets or disposal groups held for sale 0 0 Reserve of gains and losses from investments in equity instruments 0 0 Reserve of change in fair value of financial liability attributable to change in credit risk of liability 0 0 Reserve for catastrophe 0 0 Reserve for equalisation 0 0 Reserve of discretionary participation features 0 0 Reserve of equity component of convertible instruments 0 0 Capital redemption reserve 0 0 Merger reserve 0 0 Statutory reserve 0 0 Other comprehensive income 0 0 Total other reserves 947,734,000 2,284,597,000 Net assets (liabilities) [abstract] Assets 57,848,833,000 56,357,949,000 Liabilities 34,778,573,000 30,657,683,000 Net assets (liabilities) 23,070,260,000 25,700,266,000 Net current assets (liabilities) [abstract] Current assets 23,883,398,000 23,109,436,000 Current liabilities 14,041,064,000 14,245,865,000 Net current assets (liabilities) 9,842,334,000 8,863,571, of 91
54 [800200] Notes - Analysis of income and expense Concept Analysis of income and expense [abstract] Revenue [abstract] Accumulated Current Year Accumulated Previous Year Quarter Current Year Quarter Previous Year Revenue from rendering of services Revenue from sale of goods 52,249,446,000 49,387,732,000 17,134,553,000 17,209,001,000 Interest income Royalty income Dividend income Rental income Revenue from construction contracts Other revenue Total revenue 52,249,446,000 49,387,732,000 17,134,553,000 17,209,001,000 Finance income [abstract] Interest income 30,357,000 23,495,000 11,128,000 9,699,000 Net gain on foreign exchange 172,317, Gains on change in fair value of derivatives 0 436,635,000 9,529, ,985,000 Gain on change in fair value of financial instruments Other finance income 185,894,000 8,187, ,859, ,000 Total finance income 388,568, ,317, ,516, ,884,000 Finance costs [abstract] Interest expense 535,616, ,817, ,253, ,140,000 Net loss on foreign exchange 0 213,080,000 35,608,000 54,250,000 Losses on change in fair value of derivatives 700,542, Loss on change in fair value of financial instruments Other finance cost 5,468,000 63,059,000 8,374,000 11,163,000 Total finance costs 1,241,626, ,956, ,235, ,553,000 Tax income (expense) Current tax 2,010,210,000 2,172,627, ,638, ,581,000 Deferred tax (461,702,000) (181,759,000) (139,748,000) (39,712,000) Total tax income (expense) 1,548,508,000 1,990,868, ,890, ,869, of 91
55 [800500] Notes - List of notes Disclosure of notes and other explanatory information [text block] Since the information presented herein refers to interim financial information, the Company opted to prepare its information according to IAS 34 (Option 1). Disclosure of accrued expenses and other liabilities [text block] Other liabilities mainly includes: Employee benefits payable and promotion and advertising payable. Disclosure of associates [text block] The Company has no investment in associated companies. Disclosure of auditors' remuneration [text block] Audit fees are disclosed at the end of the period. Disclosure of authorisation of financial statements [text block] The consolidated financial statements were authorized by the Chief Administrative Office of the Company on October 11, of 91
56 Disclosure of available-for-sale financial assets [text block] The Company has no assets available for sale. Disclosure of basis of preparation of financial statements [text block] -BASIS OF MEASUREMENT The consolidated financial statements have been prepared on the basis of historical cost, except for the fair value of certain financial instruments as described in the policies shown below (See accounting policy of financial instruments). The preparation of financial statements requires that management make judgments, estimates and assumptions that affect the application of accounting policies and the reported amounts of assets, liabilities, income and expenses. Actual results could differ from those estimates. Disclosure of biological assets, agriculture produce at point of harvest and government grants related to biological assets [text block] The Company does not have this type of assets. Disclosure of borrowings [text block] See section [800001] - Breakdown of credits. 56 of 91
57 Disclosure of business combinations [text block] See section [800600] Accounting policy for Business combinations. Disclosure of cash and cash equivalents [text block] See section [800100] Cash and cash equivalents entry. Disclosure of commitments and contingent liabilities [text block] The Company has commitments to purchase commodities, raw material and machinery and equipment that are disclosed at the end of the year. Disclosure of contingent liabilities [text block] As of September 30, 2017, the Company does not have contingent liabilities to be disclosed. Disclosure of cost of sales [text block] See Disclosure of results of operations and prospects in section [105000]. 57 of 91
![Disclosure of credit risk [text block] The Company s management establishes the maximum credit risk according to its policies.](/docs-images/75/72519556/images/58-0.jpg "The Company assures the compliance of the credit limits established and, therefore, no important losses from trade accounts receivable are expected.")
![Disclosure of debt instruments [text block] Debt Profile GRUMA s debt was US$1.1 billion, US$311 million more than at June 2017.](/docs-images/75/72519556/images/58-1.jpg "Approximately 84% of GRUMA s debt was dollar-denominated.")
58 Disclosure of credit risk [text block] The Company s management establishes the maximum credit risk according to its policies. The Company assures the compliance of the credit limits established and, therefore, no important losses from trade accounts receivable are expected. Disclosure of debt instruments [text block] Debt Profile GRUMA s debt was US$1.1 billion, US$311 million more than at June Approximately 84% of GRUMA s debt was dollar-denominated. Debt (US$ millions) Sep 17 Sep 16 Var ($) Var (%) Jun 17 Var ($) Var (%) 1, % % Debt Maturity Profile (US$ millions) Disclosure of derivative financial instruments [text block] 58 of 91
59 See [800007] Annex - Financial derivate instruments. Disclosure of discontinued operations [text block] -DISCONTINUED OPERATIONS A)LOSS OF CONTROL OF VENEZUELA The Ministry of Popular Power for Internal Relations and Justice published on January 22, 2013 Administrative Providence number dated January 21, 2013 (the Providence ) in the Official Gazette of the Bolivarian Republic of Venezuela (the Republic ). Given this Providence, GRUMA determined that it had lost control of the subsidiaries in Venezuela: Molinos Nacionales, C.A. ( MONACA ) and Derivados de Maíz Seleccionado, DEMASECA, C.A. ( DEMASECA ). Following the principles set by IFRS, the Company lost the ability to affect the variable returns and concluded that it had lost the control of MONACA and DEMASECA on January 22, 2013, consequently, the Company ceased the consolidation of the financial information of MONACA and DEMASECA as of this date. B) IMPAIRMENT OF THE INVESTMENT IN VENEZUELA At December 31, 2015 and 2014, GRUMA performed impairment tests on the investments in MONACA and DEMASECA to determine a potential recoverable amount The impairment test performed in the fourth quarter of 2015, resulted in an impairment loss of Ps.4,362,108, which was recognized in consolidated income for the year ended December 31, 2015 as Loss from discontinued operations. The historical value of the net investment in MONACA and DEMASECA at January 22, 2013, the date when the Company ceased the consolidation of the financial information of these entities, was Ps.2,913,760 and Ps.195,253, respectively. At December 31, 2016 and 2015, certain subsidiaries of GRUMA have accounts receivable with the Venezuelan companies for a total amount of Ps. 1,564,665 and Ps.1,253,095, respectively, which were fully impaired and are included as part of the impairment loss recognized in income as of this dates. 59 of 91
60 Disclosure of dividends [text block] The General Ordinary Shareholders Meeting held on April 29, 2016, among other matters, approved the following: To pay a cash dividend in the amount of Ps ,158.00, equivalent to Ps.2.00 for each of the ,079 issued and outstanding shares, with voting rights, which aggregate amount will be paid from the Taxable Net Income for dividends and income generated as of December 31, This payment will be made in cash in four installments, each for Ps.0.50, on July 08 and October 07, 2016, January 10 and April 07, The General Ordinary Shareholders Meeting held on April 28, 2017, among other matters, approved the following: To pay a cash dividend in the amount of Ps.1, ,567.00, equivalent to Ps.4.27 for each of the ,079 issued and outstanding shares, with voting rights, which aggregate amount will be paid from the Taxable Net Income for dividends and income generated as of December 31, This payment will be made in cash in four installments, each for Ps , on July 18 and October 17, 2017, January 16 and April 17, Disclosure of expenses [text block] See Disclosure of results of operations and prospects in section [105000]. Disclosure of fair value of financial instruments [text block] See [800007] Annex - Financial derivate instruments. 60 of 91
61 Disclosure of finance income (cost) [text block] See Disclosure of results of operations and prospects in section [105000]. Disclosure of impairment of assets [text block] During March, 2017, the Company recognized a cost of written-down fixed assets amounting to aproximately Ps.4.9 million in the Mexico division. Disclosure of information about employees [text block] See section [700000] Informative data about the Statement of financial position. Disclosure of issued capital [text block] The Company s outstanding common stock consists of 432,749,079 Series B shares, amounting to Ps.5,363,595 thousand. Disclosure of other operating income (expense) [text block] See Disclosure of results of operations and prospects in section [105000]. 61 of 91
62 Disclosure of property, plant and equipment [text block] See Financial position, liquidity and capital resources in section [105000]. Disclosure of related party [text block] -RELATED PARTIES As of September 30, 2017, the Company did not carry out any transaction with nor had balances with related parties. Disclosure of summary of significant accounting policies [text block] Since the information presented herein refers to interim financial information, the Company opted to prepare its information according to IAS 34 (Option 1). The consolidated financial statements of Gruma, S.A.B. de C.V. and Subsidiaries for all the periods presented have been prepared in accordance with the International Financial Reporting Standards (IFRS) as issued by the International Accounting Standards Board (IASB). The IFRS also include the International Accounting Standards (IAS) in force, as well as all the related interpretations issued by the IFRS Interpretations Committee, including those previously issued by the Standing Interpretations Committee. The Company applied IFRS that were effective at September 30, 2017, with no significant impact on its financial statements. Financial Standards issued and effective for fiscal years 2018 and 2019 Certain new standards have been issued, which are not effective for reporting periods as of December 31, 2017, and the Company has not early adopted them. The Company's assessment of the effects of these new standards is presented below. IFRS 9 - Financial instruments IFRS 9 addresses the classification, measurement and recognition of financial assets and financial liabilities, introduces new rules for hedge accounting and presents a new impairment model for financial assets. 62 of 91
63 Effects in the Company s financial statements: The Company has reviewed its financial assets and financial liabilities and expects that the adoption of this new standard will not have an impact in the classification and measurement of such assets and liabilities. Regarding hedge accounting for derivative financial instruments, the application of the new standard will enable the Company to comply with the requirements in order to qualify this type of operations as hedge accounting. The Company's management does not anticipate that the application of the new hedge accounting standards will have a material impact on its financial statements. With respect to the impairment of financial assets, the expected credit loss model will be used in the calculation of the allowance for doubtful accounts. It is expected that the application of this new methodology in the Company s accounts receivable will not have a significant impact on its financial statements. Date of adoption of the standard: The Company will apply this new standard retrospectively beginning January 1, IFRS 15 - Revenue from contracts with customers IFRS 15, Revenue from contracts with customers, establishes a single comprehensive model for entities to use in accounting for revenue arising from contracts with customers. This new standard will supersede the current revenue recognition guidance, including IAS 18 for contracts of goods and services, and IAS 11 for construction contracts. The core principle of IFRS 15 is that an entity should recognize revenue to depict the transfer of promised goods or services to customers in an amount that reflects the consideration to which the entity expects to be entitled in exchange for those goods or services. The new standard is based on the principle that revenue is recognized when control of the goods or services is transferred to the customer. IFRS 15 is effective for annual periods beginning on or after January 1, IFRS 15 introduces a five-step model framework: f)identify the contract(s) with a customer g)identify the performance obligations in the contract h)determine the transaction price i)allocate the transaction price to the performance obligations in the contract j)recognize revenue when (or as) the entity satisfies a performance obligation. Effects in the Company s financial statements: The Company continues to assess the effect of the adoption of this standard on its financial position or results of operation. Date of adoption of the standard: 63 of 91
64 The Company plans to adopt IFRS 15 retrospectively with the cumulative effect of initially adopting the standard recognized in retained earnings at January 1, As a result, the Company will not apply the requirements of IFRS 15 to the comparative period presented. IFRS 16 - Leases IFRS 16 introduces a comprehensive model for the identification of lease agreements and accounting treatments for both lessors and lessees. This new standard will supersede IAS 17. Distinctions of operating leases (off balance sheet) and finance leases (on balance sheet) are removed for lessee accounting, and are replaced by a model where a right-of-use asset and a corresponding liability have to be recognized for all leases by lessees, except for short-term leases and leases of low value assets. Effects in the Company s financial statements: The Company is currently assessing the requirements from the new standard and their application to the Company s context. Therefore, it is not yet possible to estimate the amount of right-of-use assets and lease liabilities to be recognized as a result of the adoption of the new standard, as well as their effect on the Company's financial statements. Date of adoption of the standard: The Company will apply this new standard beginning January 1, of 91
65 [800600] Notes - List of accounting policies Disclosure of summary of significant accounting policies [text block] Since the information presented herein refers to interim financial information, the Company opted to prepare its information according to IAS 34 (Option 1). The consolidated financial statements of Gruma, S.A.B. de C.V. and Subsidiaries for all the periods presented have been prepared in accordance with the International Financial Reporting Standards (IFRS) as issued by the International Accounting Standards Board (IASB). The IFRS also include the International Accounting Standards (IAS) in force, as well as all the related interpretations issued by the IFRS Interpretations Committee, including those previously issued by the Standing Interpretations Committee. The Company applied IFRS that were effective at September 30, 2017, with no significant impact on its financial statements. Financial Standards issued and effective for fiscal years 2018 and 2019 Certain new standards have been issued, which are not effective for reporting periods as of December 31, 2017, and the Company has not early adopted them. The Company's assessment of the effects of these new standards is presented below. IFRS 9 - Financial instruments IFRS 9 addresses the classification, measurement and recognition of financial assets and financial liabilities, introduces new rules for hedge accounting and presents a new impairment model for financial assets. Effects in the Company s financial statements: The Company has reviewed its financial assets and financial liabilities and expects that the adoption of this new standard will not have an impact in the classification and measurement of such assets and liabilities. Regarding hedge accounting for derivative financial instruments, the application of the new standard will enable the Company to comply with the requirements in order to qualify this type of operations as hedge accounting. The Company's management does not anticipate that the application of the new hedge accounting standards will have a material impact on its financial statements. With respect to the impairment of financial assets, the expected credit loss model will be used in the calculation of the allowance for doubtful accounts. It is expected that the application of this new methodology in the Company s accounts receivable will not have a significant impact on its financial statements. Date of adoption of the standard: The Company will apply this new standard retrospectively beginning January 1, of 91
66 IFRS 15 - Revenue from contracts with customers IFRS 15, Revenue from contracts with customers, establishes a single comprehensive model for entities to use in accounting for revenue arising from contracts with customers. This new standard will supersede the current revenue recognition guidance, including IAS 18 for contracts of goods and services, and IAS 11 for construction contracts. The core principle of IFRS 15 is that an entity should recognize revenue to depict the transfer of promised goods or services to customers in an amount that reflects the consideration to which the entity expects to be entitled in exchange for those goods or services. The new standard is based on the principle that revenue is recognized when control of the goods or services is transferred to the customer. IFRS 15 is effective for annual periods beginning on or after January 1, IFRS 15 introduces a five-step model framework: f)identify the contract(s) with a customer g)identify the performance obligations in the contract h)determine the transaction price i)allocate the transaction price to the performance obligations in the contract j)recognize revenue when (or as) the entity satisfies a performance obligation. Effects in the Company s financial statements: The Company continues to assess the effect of the adoption of this standard on its financial position or results of operation. Date of adoption of the standard: The Company plans to adopt IFRS 15 retrospectively with the cumulative effect of initially adopting the standard recognized in retained earnings at January 1, As a result, the Company will not apply the requirements of IFRS 15 to the comparative period presented. IFRS 16 - Leases IFRS 16 introduces a comprehensive model for the identification of lease agreements and accounting treatments for both lessors and lessees. This new standard will supersede IAS 17. Distinctions of operating leases (off balance sheet) and finance leases (on balance sheet) are removed for lessee accounting, and are replaced by a model where a right-of-use asset and a corresponding liability have to be recognized for all leases by lessees, except for short-term leases and leases of low value assets. Effects in the Company s financial statements: The Company is currently assessing the requirements from the new standard and their application to the Company s context. Therefore, it is not yet possible to estimate the amount of right-of-use assets and lease liabilities to be recognized as a result of the adoption of the new standard, as well as their effect on the Company's financial statements. 66 of 91
67 Date of adoption of the standard: The Company will apply this new standard beginning January 1, Description of accounting policy for biological assets [text block] The Company does not have this type of assets. Description of accounting policy for business combinations and goodwill [text block] -BUSINESS COMBINATIONS Business combinations are recognized through the acquisition method of accounting. The consideration transferred for the acquisition of a subsidiary is measured as the fair value of the assets transferred, the liabilities incurred by the Company with the previous owners and the equity instruments issued by the Company. The cost of an acquisition also includes the fair value of any contingent payment. The related acquisition costs are recognized in the income statement when incurred. Identifiable assets acquired, liabilities assumed and contingent liabilities in a business combination are measured at fair value at the acquisition date. The Company recognizes any non-controlling interest as the proportional share of the net identifiable assets of the acquired entity. The Company recognizes goodwill when the cost including any amount of non-controlling interest in the acquired entity exceeds the fair value at acquisition date of the identifiable assets acquired and liabilities assumed. When the entity or entities acquired are, before and after the acquisition, ultimately controlled by the same entity, and such control is not temporary, it is assumed that the entities are under common control and therefore, there is no business combination. Transactions and exchanges between entities under common control are recognized on the basis of the carrying value of assets and liabilities transferred on the date of the transaction, and therefore, goodwill is not recognized. 67 of 91
68 Description of accounting policy for derivative financial instruments and hedging [text block] -DERIVATIVE FINANCIAL INSTRUMENTS AND HEDGING ACTIVITIES Derivative financial instruments are initially recognized at fair value and are subsequently re-measured at their fair value; the transaction costs are recognized in the income statement when incurred. Derivative financial instruments are classified as current, except for maturities exceeding twelve months. Fair value is determined based on recognized market prices. When not quoted in markets, fair value is determined using valuation techniques commonly used in the financial sector. Fair value reflects the credit risk of the instrument and includes adjustments to consider the credit risk of the Company or the counterparty, when applicable. The method for recognizing the resulting gain or loss depends on whether the derivative is designated as a hedge and, if so, the nature of the item being hedged. The Company designates derivative financial instruments as follows: -Hedges of the fair value of recognized assets or liabilities or a firm commitment (fair value hedge); -Hedges of a particular risk associated with a recognized asset or liability or a highly probable forecast transaction (cash flow hedge); or -Hedges of a net investment in a foreign operation (net investment hedge). The Company documents at the inception of the transaction the relationship between hedging instruments and hedged items, including objectives, strategies for risk management and the method for assessing effectiveness in the hedge relationship. a. Fair value hedges Changes in the fair value of derivatives that are designated and qualify as fair value hedges are recorded in the income statement, together with changes in the fair value of the hedged asset or liability that are attributable to the hedged risk. b. Cash flow hedges For cash flow hedge transactions, changes in the fair value of the derivative financial instrument are included as other comprehensive income in equity, based on the evaluation of the hedge effectiveness, and are reclassified to the income statement in the periods when the projected transaction is realized. Hedge effectiveness is determined when changes in the fair value or cash flows of the hedged position are compensated with changes in the fair value or cash flows of the hedge instrument in a quotient that ranges between 80% and 125% of inverse correlation. Ineffective portions from changes in the fair value of derivative financial instruments are recognized immediately in the income statement. 68 of 91
69 When a hedging instrument expires or is sold, or when a hedge no longer meets the criteria for hedge accounting, any cumulative gain or loss existing in equity at that time remains in equity and is recognized when the forecasted transaction is ultimately registered in the income statement. c. Net investment hedge Hedges of net investments in foreign operations are accounted for similarly to cash flow hedges. Any gain or loss on the hedging instrument relating to the effective portion of the hedge is recognized in other comprehensive income. The gain or loss relating to the ineffective portion is recognized in the income statement. Gains and losses accumulated in equity are included in the income statement when the foreign operation is partially disposed of or sold. Description of accounting policy for determining components of cash and cash equivalents [text block] -CASH AND CASH EQUIVALENTS Cash and cash equivalents include cash and short term highly liquid investments with original maturities of less than three months. These items are recognized at historical cost, which do not differ significantly from its fair value. Description of accounting policy for earnings per share [text block] -EARNINGS PER SHARE Basic earnings per share is calculated by dividing the profit attributable to equity holders of the Company by the weighted average number of ordinary shares in issue during the year, excluding ordinary shares purchased by the Company and held as treasury shares. Diluted earnings per share is calculated by adjusting the weighted average number of ordinary shares outstanding to assume conversion of all dilutive potential ordinary shares, which include convertible debt and share options. Description of accounting policy for employee benefits [text block] -EMPLOYEE BENEFITS 69 of 91
70 a. Post-employment benefits In Mexico, the Company has the following defined benefit plans: -Single-payment retirement plan, when employees reach the required retirement age, which is 60. -Seniority premium, after 15 years of service. The Company has established trust funds in order to meet its obligations for the seniority premium. Employees do not contribute to these funds. The liability recognized in the balance sheet in respect of defined benefit plans is the present value of the defined benefit obligation, less the fair value of plan assets. The Company determines the net interest expense (income) on the net defined benefit liability (asset) for the period by applying the discount rate used to measure the defined benefit obligation at the beginning of the annual period to the net defined benefit liability (asset). The defined benefit obligation is calculated annually by independent actuaries using the projected unit credit method. The present value of the defined benefit obligation is determined by discounting the estimated cash outflows using discount rates in accordance with IAS-19, that are denominated in the currency in which the benefits will be paid, and that have terms to maturity approximating to the terms of the related liability. Actuarial gains and losses arising from experience adjustments and changes in actuarial assumptions are charged or credited to equity in other comprehensive income in the period in which they arise. Past service costs are recognized immediately in the income statement. In the United States, the Company has saving and investment plans that incorporate voluntary employees 401(k) contributions with matching contributions of the Company in this country. The Company s contributions are recognized in the income statement when incurred. b. Termination benefits Termination benefits are payable when employment is terminated by decision of the Company, before the normal retirement date. The Company recognizes termination benefits as a liability at the earlier of the following dates: (a) when the Company can no longer withdraw the offer of those benefits; and (b) when the Company recognizes restructuring costs that represents a provision and involves the payment of termination benefits. Termination benefits that do not meet this requirement are recognized in the income statement in the period when incurred. c. Short term benefits Short term employee benefits are measured at nominal base and are recognized as expenses as the related service is provided. If the Company has the legal or constructive obligation to pay as a result of a service rendered by the employee in the past and the amount can be estimated, an obligation is recognized for short term bonuses or profit sharing. 70 of 91
71 Description of accounting policy for financial assets [text block] Financial assets Classification In its initial recognition and based on its nature and characteristics, the Company classifies its financial assets in the following categories: (i) financial assets at fair value through profit or loss, (ii) loans and receivables, (iii) financial assets held until maturity, and (iv) available-for-sale financial assets. The classification depends on the purpose for which the financial assets were acquired. Financial assets at fair value through profit or loss A financial asset is classified at fair value through profit or loss when designated as held for trading or classified as such in its initial recognition. A financial asset is classified in this category if acquired principally for the purpose of selling in the short term. Assets in this category are carried at fair value, and directly attributable transaction costs and corresponding changes of fair value are recognized in the income statement. Derivatives are also categorized as held for trading unless they are designated as hedges. Assets in this category are classified as current assets if expected to be settled within 12 months; otherwise, they are classified as non-current. Loans and receivables Loans and receivables are non-derivative financial assets with fixed or determinable payments that are not quoted in an active market. They are included in current assets, except for assets with maturities greater than 12 months. Initially, these assets are carried at fair value plus any transaction costs directly attributable to them; subsequently, these assets are recognized at amortized cost using the effective interest rate method. Financial assets held until maturity When the Company has the intention and capacity to keep debt instruments until maturity, these financial assets are classified as held until maturity. Initially, these assets are carried at fair value plus any transaction costs directly attributable to them; subsequently, these assets are recognized at amortized cost using the effective interest rate method. Available-for-sale financial assets Available-for-sale financial assets are non-derivative financial assets that are designated in this category or not classified in any of the other categories. They are included in current assets, except for assets with maturities greater than 12 months. These assets are initially recognized at fair value plus any transaction costs directly attributable to them; subsequently, these assets are recognized at fair value. If these assets cannot be measured through an active market, then they are measured at cost. Profit or losses from changes in the fair value are 71 of 91
72 recognized in other comprehensive income in the period when incurred. At disposition date, such profit or losses are recognized in income. Interest on available-for-sale securities calculated using the effective interest method is recognized in the income statement as part of interest income. Dividends on available-for-sale equity instruments are recognized in the income statement when the Company s right to receive payments is established. Impairment The Company assesses at each reporting date whether there is any objective evidence that a financial asset or a group of financial assets is impaired. A financial asset or a group of financial assets is considered to be impaired if, and only if, there is objective evidence of impairment as a result of one or more events that have occurred after the initial recognition of the asset (an incurred loss event ) and that loss event has an impact on the estimated future cash flows of the financial asset or the group of financial assets that can be reliably estimated. See the accounting policy for the impairment of accounts receivable. Description of accounting policy for financial instruments [text block] -FINANCIAL INSTRUMENTS Regular purchases and sales of financial instruments are recognized in the balance sheet on the trade date, which is the date when the Company commits to purchase or sell the instrument. Description of accounting policy for financial instruments at fair value through profit or loss [text block] Financial assets at fair value through profit or loss A financial asset is classified at fair value through profit or loss when designated as held for trading or classified as such in its initial recognition. A financial asset is classified in this category if acquired principally for the purpose of selling in the short term. Assets in this category are carried at fair value, and directly attributable transaction costs and corresponding changes of fair value are recognized in the income statement. Derivatives are also categorized as held for trading unless they are designated as hedges. Assets in this category are classified as current assets if expected to be settled within 12 months; otherwise, they are classified as non-current. 72 of 91
73 Financial liabilities at fair value through profit or loss Financial liabilities at fair value through profit or loss include financial liabilities for trading and financial liabilities designated at initial recognition. Description of accounting policy for financial liabilities [text block] Financial liabilities Debt and financial liabilities Debt and financial liabilities that are non-derivatives are initially recognized at fair value, net of transaction costs directly attributable to them: subsequently, these liabilities are recognized at amortized cost. The difference between the net proceeds and the amount payable is recognized in the income statement during the debt term, using the effective interest rate method. Financial liabilities at fair value through profit or loss Financial liabilities at fair value through profit or loss include financial liabilities for trading and financial liabilities designated at initial recognition. Description of accounting policy for foreign currency translation [text block] -FOREIGN CURRENCY a. Transactions in foreign currency Foreign currency transactions are translated into the functional currency of the Company using the exchange rates effective at the dates of the transactions. Monetary assets and liabilities denominated in foreign currencies are translated at year-end exchange rates. The differences that arise from the translation of foreign currency transactions are recognized in the income statement. b. Foreign currency translation 73 of 91
74 The financial statements of the Company s entities are measured using the currency of the main economic environment where each entity operates (functional currency). The consolidated financial statements are presented in Mexican pesos, currency that corresponds to the presentation currency of the Company. The financial position and results of the entities that have a functional currency which differs from the Company s presentation currency are translated as follows: -Assets and liabilities are translated at the closing rate of the period. -Income and expenses are translated at average exchange rates when it has not fluctuated significantly during the period. -Equity is translated at the effective exchange rate in the date when the contributions were made and the earnings were generated. -All resulting exchange differences are recognized in other comprehensive income as a separate component of equity denominated Foreign currency translation adjustments. Previous to the translation to Mexican pesos, the financial statements of foreign subsidiaries with functional currency from a hyperinflationary environment are adjusted by inflation in order to reflect the changes in purchasing power of the local currency. Subsequently, assets, liabilities, equity, income, costs, and expenses are translated to the presentation currency at the closing rate at the end of the period. To determine the existence of hyperinflation, the Company evaluates the qualitative characteristics of the economic environment, as well as the quantitative characteristics established by IFRS of an accumulated inflation rate equal or higher than 100% in the past three years. The Company applies hedge accounting to foreign exchange differences originated between the functional currency of a foreign subsidiary and the functional currency of the Company. Exchange differences resulting from the translation of a financial liability designated as hedge for a net investment in a foreign subsidiary, are recognized in other comprehensive income as a separate component denominated Foreign currency translation adjustments while the hedge is effective. See the accounting of the net investment hedge policy. Description of accounting policy for functional currency [text block] -FUNCTIONAL AND PRESENTATION CURRENCY The consolidated financial statements are presented in Mexican pesos, which is the functional currency of GRUMA. Description of accounting policy for impairment of assets [text block] 74 of 91
75 -IMPAIRMENT OF LONG-LIVED ASSETS The Company performs impairment tests for its property, plant and equipment and intangible assets with finite useful lives, when certain events and circumstances suggest that the carrying value of the assets might not be recovered. Intangible assets with indefinite useful lives and goodwill are subject to impairment tests at least once a year. An impairment loss is recognized for the amount by which the asset s carrying amount exceeds its recoverable amount. The recoverable amount of an asset or cash-generating unit is the higher of an asset s fair value less costs to sell and value in use. To determine value in use, estimated future cash flows are discounted at present value, using a pre-tax discount rate that reflect time value of money and considering the specific risks associated with the asset. For the purposes of assessing impairment, assets are grouped at the lowest levels for which there are separately identifiable cash flows (cash-generating unit). Impairment losses on goodwill are not reversed. For other assets, impairment losses are reversed if a change in the estimates used for determining the recoverable amount has occurred. Impairment losses are reversed to the extent that the book value does not exceed the book value that was determined, net of depreciation or amortization, if no impairment loss was recognized. Description of accounting policy for income tax [text block] -INCOME TAXES The tax expense of the period comprises current and deferred tax. Tax is recognized in the income statement, except to the extent that it relates to items recognized in other comprehensive income or directly in equity. In this case, the tax is also recognized in other comprehensive income or directly in equity, respectively. The current income tax charge is calculated on the basis of the tax laws enacted or substantively enacted at the balance sheet date in the countries where the Company and its subsidiaries operate and generate taxable income. Management periodically evaluates positions taken in tax returns with respect to situations in which applicable tax regulation is subject to interpretation. It establishes provisions where appropriate on the basis of amounts expected to be paid to the tax authorities. Deferred income tax is recognized from the analysis of the balance sheet considering temporary differences arising between the tax bases of assets and liabilities and their carrying amounts. Deferred income tax is determined using tax rates that have been approved or substantially approved at the date of the balance sheet and are expected to apply when the related deferred income tax asset is realized or the deferred income tax liability is settled. Deferred income tax assets are recognized for tax loss carry-forwards not used, tax credits and deductible temporary differences, only to the extent that it is probable that future taxable profit will be available against which the temporary differences can be utilized. In each period-end deferred income tax assets are reviewed and reduced to the extent that it is not probable that the benefits will be realized. 75 of 91
76 Deferred income tax is provided on temporary differences arising on investments in subsidiaries, except where the timing of the reversal of the temporary difference is controlled by the Company and it is probable that the temporary difference will not reverse in the foreseeable future. Deferred tax assets and liabilities are offset if the entity has a legally enforceable right to set off assets against liabilities and are related to income tax levied by the same tax authority on the same taxable entity or different taxable entities where there is an intention to settle the balances on a net basis. Description of accounting policy for intangible assets and goodwill [text block] -INTANGIBLE ASSETS a. Goodwill Goodwill represents the excess of the cost of an acquisition over the fair value of the Company s share of the net identifiable assets of the acquired subsidiary at the date of acquisition. Goodwill is tested annually for impairment, or whenever the circumstances indicate that the value of the asset might be impaired. Goodwill is carried at cost less accumulated impairment losses. Gains and losses on the disposal of an entity include the carrying amount of goodwill related to the entity sold. Goodwill is allocated to cash-generating units for the purpose of impairment testing. The allocation is made to those cash-generating units or groups of cash-generating units that are expected to benefit from the business combination in which the goodwill arose, identified according to operating segment. b. Intangible assets with finite useful lives Intangible assets with finite useful lives are carried at cost less accumulated amortization and impairment losses. Amortization is calculated using the straight-line method over the estimated useful lives of the assets. Estimated useful lives are as follows: Years Non-compete agreements Patents and trademarks Customer lists Software for internal use. 3-7 c. Intangible assets with indefinite useful lives Intangible assets with indefinite useful lives are not amortized, but subject to impairment tests on an annual basis or whenever the circumstances indicate that the value of the asset might be impaired. 76 of 91
77 d. Research and development Research costs are expensed when incurred. Costs from development activities are recognized as an intangible asset when such costs can be measured reliably, the product or process is technically and commercially feasible, future economic benefits will be obtained, and the Company pretends and has sufficient resources in order to complete the development and use or sell the asset. The amortization is recognized in income based on the straight-line method during the estimated useful life of the asset. Development costs that do not qualify as intangible assets are recognized in income when incurred. Description of accounting policy for investment in associates [text block] As of September 30, 2017, the Company has no investments in associated companies. Description of accounting policy for investments in joint ventures [text block] As of September 30, 2017, the Company has no investments in joint ventures. Description of accounting policy for issued capital [text block] -SHARE CAPITAL Ordinary shares are classified as equity. Incremental costs directly attributable to the issue of new shares are shown in equity as a deduction, net of tax, from the proceeds. Description of accounting policy for leases [text block] 77 of 91
78 -LEASES a. Operating leases Leases in which a significant portion of the risks and rewards of ownership are retained by the lessor are classified as operating leases. Payments made under operating leases are recognized in the income statement on a straight-line basis over the period of the lease. b. Finance leases Leases where the Company has substantially all the risks and rewards of ownership, are classified as finance leases. Under finance leases, at the initial date, both assets and liabilities are recognized at the lower of the fair value of the leased property and the present value of the minimum lease payments. In order to discount the minimum payments, the Company uses the interest rate implicit in the lease, if this practicable to determine; if not, the Company s incremental borrowing rate is used. Lease payments are allocated between the interest expense and the reduction of the pending liability. Interest expense is recognized in each period during the lease term so as to produce a constant periodic interest rate on the remaining balance of the liability. Property, plant and equipment acquired under finance leases is depreciated over the shorter of the useful life of the asset and the lease term. Description of accounting policy for measuring inventories [text block] -INVENTORIES Inventories are measured at the lower of cost and net realizable value. Cost is determined using the average cost method. The net realizable value is the estimated selling price of inventory in the normal course of business, less applicable variable selling expenses. The cost of finished goods and production in process includes raw materials, direct labor, other direct costs and related production overheads. Cost of inventories could also include the transfer from comprehensive income of any gains or losses on cash flow hedges for purchases of raw materials. Description of accounting policy for non-current assets or disposal groups classified as held for sale and discontinued operations [text block] 78 of 91
79 -LONG-LIVED ASSETS HELD FOR SALE AND DISCONTINUED OPERATIONS Long-lived assets are classified as held for sale when (a) their carrying amount is to be recovered mainly through a sale transaction, rather than through continuing use, (b) the assets are held immediately for sale and (c) the sale is considered highly probable in its current condition. For the sale to be considered highly probable: Management must be committed to a sale plan. An active program must have begun in order to locate a buyer and to complete the plan. The asset must actively be quoted for its sale at a price that is reasonable to its current fair value; and The sale is expected to be completed within a year starting the date of classification. Non-current assets held for sale are stated at the lower of carrying amount and fair value less costs to sell. Discontinued operations are the operations and cash flows that can be clearly distinguished from the rest of the entity, that either have been disposed of or have been classified as held for sale, and: Represent a line of business or geographical area of operations. Are part of a single coordinated plan to dispose of a line of business or geographical area of operations, or Is a subsidiary acquired exclusively with a view to resale. Description of accounting policy for property, plant and equipment [text block] -PROPERTY, PLANT AND EQUIPMENT Property, plant and equipment are valued at acquisition cost, less accumulated depreciation and recognized impairment losses. Cost includes expenses that are directly attributable to the asset acquisition. Subsequent costs, including major improvements, are capitalized and are included in the carrying value of the asset or recognized as a separate asset, only when it is probable that future economic benefits associated with the specific asset will flow to the Company and the costs can be measured reliably. Repairs and maintenance are recognized in the income statement when incurred. Major improvements are depreciated during the remaining useful life of the related asset. Leasehold improvements are depreciated using the lower of the lease term or useful life. Land is not depreciated. Costs of borrowings, general and specific, of qualifying assets that require a substantial period of time (over one year) for acquisition or construction, are capitalized as part of the acquisition cost of these assets, until such time as the assets are substantially ready for their intended use or sale. 79 of 91
80 Depreciation is calculated over the asset cost less residual value, considering its components separately. Depreciation is recognized in income using the straight-line method and applying annual rates that reflect the estimated useful lives of the assets. The estimated useful lives are summarized as follows: Years Buildings Machinery and equipment Leasehold improvements.. 10 * * The lesser of 10 years or the term of the leasehold agreement. The assets residual values and useful lives are reviewed, and adjusted if appropriate, at the end of each reporting period. Gains and losses from sale of assets result from the difference between revenues of the transaction and the book value of the assets, which is included in the income statement as other expenses, net. Description of accounting policy for provisions [text block] -PROVISIONS Provisions are recognized when (a) the Company has a present legal or constructive obligation as a result of past events; (b) it is probable that an outflow of resources will be required to settle the obligation; and (c) the amount has been reliably estimated. Provisions are measured at the present value of the expenditures expected to be required to settle the obligation using a pre-tax rate that reflects current market assessments of the time value of money and the specific risks of the obligation. The increase in the provision due to the passage of time is recognized as interest expense. Description of accounting policy for recognition of revenue [text block] -REVENUE RECOGNITION Sales are recognized upon shipment of products to, and acceptance by, the Company s customers or when the risk of ownership has passed to the customers. Revenue is recognized at the fair value of the consideration received or receivable, net of returns, discounts, and rebates. Provisions for discounts and rebates to customers, returns and other adjustments are recognized in the same period that the related sales are recorded and are based upon either historical estimates or actual terms. 80 of 91
81 Description of accounting policy for segment reporting [text block] -SEGMENT INFORMATION An operating segment is a component of the Company that engages in business activities from which it may earn revenues and incur expenses, including revenues and expenses relating to transactions with other components of the same entity. Operating results from an operating segment are regularly reviewed by the entity s chief executive officer to make decisions about resources to be allocated to the segment and assess its performance, and for which discrete financial information is available. Description of accounting policy for subsidiaries [text block] -SUBSIDIARIES The subsidiaries are all entities (including structured entities) over which the Company has control. The Company controls an entity when the Company is exposed to, or has rights to, variable returns from its involvement with the entity and has the ability to affect those returns through its power over the entity. The financial statements of subsidiaries are incorporated in the consolidated financial statements starting on the date on which the control begins, until the date such control ceases. Intercompany transactions, balances and unrealized gains on transactions between group companies are eliminated. Unrealized losses are also eliminated. Subsidiaries accounting policies have been changed where necessary to ensure consistency with the policies adopted by the Company. As of September 30, 2017, the main subsidiaries included in the consolidation are: % of ownership Gruma Corporation and subsidiaries Grupo Industrial Maseca, S.A.B. de C.V. and subsidiaries Gruma International Foods, S.L. and subsidiaries Mission Foods México, S. de R.L. de C.V Description of accounting policy for trade and other receivables [text block] 81 of 91
82 -ACCOUNTS RECEIVABLE Trade receivables are initially recognized at fair value and subsequently valued at amortized cost using the effective interest rate method, less provision for impairment. The Company has determined that the amortized cost does not represent significant differences with respect to the invoiced amount from short-term trade receivables, since the transactions do not have relevant associated costs. Allowances for doubtful accounts or impairment represent the Company s estimates of losses that could arise from the failure or inability of customers to make payments when due. These estimates are based on the maturity dates of customers balances, specific credit circumstances and the Company s historical experience on doubtful accounts. Description of accounting policy for transactions with non-controlling interests [text block] -TRANSACTIONS WITH NON-CONTROLLING INTEREST WITHOUT CHANGE OF CONTROL The Company applies a policy of treating transactions with non-controlling interest as transactions with equity owners of the Company. When purchases from non-controlling interest take place, the difference between any consideration paid and the relevant interest acquired of the carrying value of net assets of the subsidiary is recognized as equity transactions; therefore, no goodwill is recognized with these acquisitions. Disposals of non-controlling interests result in gains or losses for the Company and are recorded in equity when there is no loss of control. 82 of 91
83 [813000] Notes - Interim financial reporting Disclosure of interim financial reporting [text block] HIGHLIGHTS GRUMA s performance during 3Q17 remained in line with the company s expectations for the year in terms of both results and the programs and investments that support capturing growth opportunities and profitability in the long-term. On a consolidated basis, sales volume was flat; net sales and EBITDA were also relatively flat, despite the effect of peso appreciation on Gruma USA figures. EBITDA margin was 16.4%, similar to last year. Sales and EBITDA from non-mexican operations represented 72% and 69%, respectively, of consolidated figures. The company reported US$1.1 billion of debt at quarter-end, US$311 million more than at the end of 2Q17. Net Debt/EBITDA ratio was 1.4x. Financial Highlights (Ps. millions) 3Q17 3Q16 Var Sales volume (thousand metric tons) % Net sales 17,135 17,209 (0.4)% Operating income 2,312 2,423 (5)% Operating margin 13.5% 14.1% (60 bp) EBITDA 2,802 2,806 (0.2)% EBITDA margin 16.4% 16.3% 10 bp Majority net income 1,659 1,535 8% 83 of 91
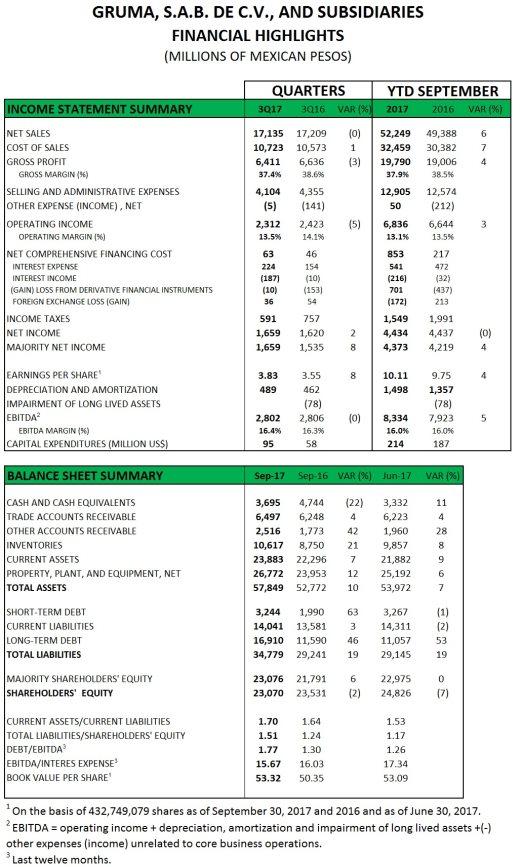
84 84 of 91
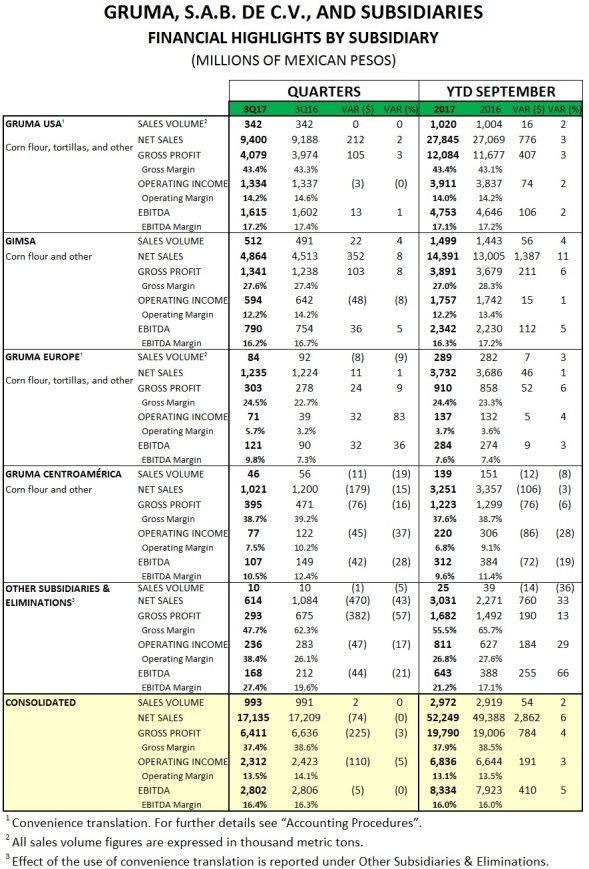
85 85 of 91
Quarterly Financial Information
 Quarterly Financial Information [105000] Management commentary...2 [110000] General information about financial statements...18 [210000] Statement of financial position, current/non-current...20 [310000]
Quarterly Financial Information
 Quarterly Financial Information [105000] Management commentary...2 [110000] General information about financial statements...18 [210000] Statement of financial position, current/non-current...20 [310000]
GRUMA REPORTS FOURTH QUARTER 2017 RESULTS
 Investor Relations ir@gruma.com Tel: 52 (81) 8399-3349 www.gruma.com San Pedro Garza García, N.L., Mexico; February 21, 2018 GRUMA REPORTS FOURTH QUARTER 2017 RESULTS HIGHLIGHTS GRUMA s performance in
GRUMA REPORTS FIRST QUARTER 2017 RESULTS
 HIGHLIGHTS GRUMA REPORTS FIRST QUARTER 2017 RESULTS During the first quarter, GRUMA showed continued growth at its operations with volume increases at all its subsidiaries other than Gruma Centroamérica.
GRUMA REPORTS FIRST QUARTER 2018 RESULTS
 Investor Relations ir@gruma.com Tel: 52 (81) 8399-3349 www.gruma.com San Pedro Garza García, N.L., Mexico; April 25, 2018 HIGHLIGHTS GRUMA REPORTS FIRST QUARTER 2018 RESULTS GRUMA s performance showed
GRUMA REPORTS SECOND QUARTER 2018 RESULTS
 Investor Relations ir@gruma.com Tel: 52 (81) 8399-3349 www.gruma.com San Pedro Garza García, N.L., Mexico; July 25, 2018 GRUMA REPORTS SECOND QUARTER 2018 RESULTS HIGHLIGHTS GRUMA s performance in the
GRUMA REPORTS FOURTH QUARTER 2016 RESULTS
 GRUMA REPORTS FOURTH QUARTER 2016 RESULTS HIGHLIGHTS During the fourth quarter of 2016 GRUMA s performance continued its double-digit upward growth trend across its financial results. Sales volume growth
GRUMA REPORTS SECOND QUARTER 2013 RESULTS
 IR Contact Information: ir@gruma.com (52) 81 8399-3311 and 24 Monterrey, N.L. Mexico; July 24, 2013 www.gruma.com GRUMA REPORTS SECOND QUARTER 2013 RESULTS HIGHLIGHTS The positive performance of GRUMA
THIRD-QUARTER 2007 RESULTS (Peso amounts are stated in millions in constant terms as of September 30, 2007)
") Rogelio Sánchez rsanchezm@gruma.com (52) 81 8399-3312 Lilia Gómez lgomez@gruma.com (52) 81 8399-3324 Monterrey, N.L. Mexico; October 24, 2007 www.gruma.com THIRD-QUARTER 2007 RESULTS (Peso amounts are
Rogelio Sánchez rsanchezm@gruma.com (52) 81 8399-3312 Lilia Gómez lgomez@gruma.com (52) 81 8399-3324 Monterrey, N.L. Mexico; October 24, 2007 www.gruma.com THIRD-QUARTER 2007 RESULTS (Peso amounts are
MEXICAN STOCK EXCHANGE
 STOCK EXCHANGE CODE: GRUPO INDUSTRIAL, S.A.B. DE C.V. STATEMENT OF FINANCIAL POSITION QUARTER: 4 YEAR: 215 REF AT 31 DECEMBER 215 AND 31 DECEMBER 214 (Thousand Pesos) ACCOUNT / SUBACCOUNT ENDING CURRENT
GRUMA SAB DE CV FORM 6-K. (Report of Foreign Issuer) Filed 02/24/11 for the Period Ending 02/23/11
 Filed 02/24/11 for the Period Ending 02/23/11") GRUMA SAB DE CV FORM 6-K (Report of Foreign Issuer) Filed 02/24/11 for the Period Ending 02/23/11 Telephone 528183993300 CIK 0001053947 Symbol GMKKY SIC Code 2090 - Miscellaneous Food Preparations and
GRUMA SAB DE CV FORM 6-K (Report of Foreign Issuer) Filed 02/24/11 for the Period Ending 02/23/11 Telephone 528183993300 CIK 0001053947 Symbol GMKKY SIC Code 2090 - Miscellaneous Food Preparations and
MEXICAN STOCK EXCHANGE
 STOCK EXCHANGE CODE: GRUPO INDUSTRIAL, S.A.B. DE C.V. STATEMENT OF FINANCIAL POSITION QUARTER: 3 YEAR: 215 REF AT 3 SEPTEMBER 215 AND 31 DECEMBER 214 (Thousand Pesos) ACCOUNT / SUBACCOUNT ENDING CURRENT
Message from Management GRUPO LALA REPORTS SECOND QUARTER 2016 RESULTS
 GRUPO LALA REPORTS SECOND QUARTER 2016 RESULTS Mexico City, July 25, 2016 Grupo LALA, S.A.B. de C.V., a Mexican Company focused on healthy and nutritious foods, ( LALA ) (BMV: LALA B), today reported results
UNITED STATES SECURITIES AND EXCHANGE COMMISSION WASHINGTON, D.C FORM 6-K
 UNITED STATES SECURITIES AND EXCHANGE COMMISSION WASHINGTON, D.C. 20549 FORM 6-K REPORT OF FOREIGN ISSUER PURSUANT TO RULES 13a-16 or 15d - 16 UNDER THE SECURITIES EXCHANGE ACT OF 1934 For the month of
Earnings Release 4Q15
 Monterrey, Mexico, May 27, 2016. Grupo Famsa, S.A.B. de C.V. (BMV: GFAMSA), a leading Mexican commercial conglomerate in the retail, consumer credit and savings sectors, announced today its earnings results
GRUPO LALA REPORTS SECOND QUARTER 2015 RESULTS
 GRUPO LALA REPORTS SECOND QUARTER 2015 RESULTS Mexico City, July 28, 2015 Grupo LALA, S.A.B. de C.V., the Mexican Company focused on healthy and nutritious foods, ( LALA ) (BMV: LALAB), today reported
Genomma Lab Internacional Reports First Quarter 2018 Results
 HIGHLIGHTS EBITDA margin for Q1-2018 reached 22.6%, a 90 bps year-on-year increase SGM&A (1) expenses for Q1-2018 decreased by Ps.162.1 million year-on-year, a reflection of cost control initiatives U.S.
GCC REPORTS THIRD QUARTER 2018 RESULTS
 GCC REPORTS THIRD QUARTER 2018 RESULTS Chihuahua, Chihuahua, Mexico, October 23, 2018 Grupo Cementos de Chihuahua, S.A.B. de C.V. (BMV: GCC *), a leading producer of cement and ready-mix concrete in the
GRUPO COMERCIAL CHEDRAUI, S.A.B. DE C.V. RELEVANT RESULTS AND FACTS FOR THE FOURTH QUARTER OF 2017
 GRUPO COMERCIAL CHEDRAUI, S.A.B. DE C.V. RELEVANT RESULTS AND FACTS FOR THE FOURTH QUARTER OF 2017 Consolidated total sales growth of 5% Same store sales growth in Mexico of 4% Consolidated EBITDA growth
RESPONSIBILITY FOR FINANCIAL REPORTING
 RESPONSIBILITY FOR FINANCIAL REPORTING The consolidated financial statements and all financial information contained in the annual report are the responsibility of management. The consolidated financial
GCC REPORTS FIRST QUARTER 2018 RESULTS
 GCC REPORTS FIRST QUARTER 2018 RESULTS Chihuahua, Chihuahua, Mexico, April 24, 2018 Grupo Cementos de Chihuahua, S.A.B. de C.V. (BMV: GCC *), a leading producer of cement and ready-mix concrete in the
GRUPO BIMBO REPORTS FIRST HALF 2016 RESULTS
 GRUPO BIMBO REPORTS FIRST HALF 2016 RESULTS MEXICO CITY, JULY 26, 2016 Grupo Bimbo S.A.B. de C.V. ( Grupo Bimbo or the Company ) (BMV: BIMBO) today reported its results for the six months ended June 30,
SECOND QUARTER 2015 RESULTS
 B SECOND QUARTER 2015 RESULTS MEXICO CITY, JULY 21, 2015 Grupo Bimbo S.A.B. de C.V. ( Grupo Bimbo or the Company ) (BMV: BIMBO) today reported results for the three months ended June 30, 2015.* HIGHLIGHTS
Let s give our soul, heart and being in everything we do. R.I.P. Don Lorenzo Servitje, founder of Grupo Bimbo
 GRUPO BIMBO REPORTS 2016 RESULTS MEXICO CITY, FEBRUARY 23, 2017 Grupo Bimbo, S.A.B. de C.V. ( Grupo Bimbo or the Company ) (BMV: BIMBO) today reported its results for the twelve months ended December 31,
4Q17 EARNINGS RELEASE. Earnings Release 4Q17 1 / 19
 EARNINGS RELEASE 4Q17 1 / 19 Monterrey, Mexico May 4 th, 2018. Grupo Famsa, S.A.B. de C.V. (BMV: GFAMSA), a leading Mexican commercial conglomerate in the retail, consumer and savings sector, announced
Years ended March Consolidated Results
 Financial Section Financial Summary JGAAP Years ended 2009 2010 2011 2012 2013 Consolidated Results (Millions of yen) Revenue 265,754 279,856 292,423 302,088 342,989 Gross profit 237,946 247,211 263,129
Message from Management GRUPO LALA REPORTS FOURTH QUARTER AND FULL YEAR 2016 RESULTS. Earnings 4Q-2016 QUARTER HIGHLIGHTS
 Earnings 4Q-2016 GRUPO LALA REPORTS FOURTH QUARTER AND FULL YEAR 2016 RESULTS QUARTER HIGHLIGHTS Mexico City, February 21, 2017 Grupo LALA, S.A.B. de C.V., a Mexican Company focused on healthy and nutritious
1Q18 EARNINGS RELEASE. Earnings Release 1Q18 1 / 15
 EARNINGS RELEASE 1Q18 1 / 15 Monterrey, Mexico April 27 th, 2018. Grupo Famsa, S.A.B. de C.V. (BMV: GFAMSA), a leading Mexican commercial conglomerate in the retail, consumer and savings sector, announced
2005 FOURTH QUARTER AND FULL-YEAR RESULTS
 2005 FOURTH QUARTER AND FULL-YEAR RESULTS Stock Listing Information NYSE (ADR) Ticker: CX MEXICAN STOCK EXCHANGE Ticker: CEMEX.CPO Ratio of CEMEX.CPO to CX= 10:1 Fourth quarter (1) January - December (1)
GRUPO BIMBO REPORTS THIRD QUARTER 2018 RESULTS MEXICO CITY, OCTOBER 24, 2018
 GRUPO BIMBO REPORTS THIRD QUARTER 2018 RESULTS MEXICO CITY, OCTOBER 24, 2018 We delivered strong third quarter results. We continue to transform our Company to be highly competitive, productive and sustainable
Genomma Lab FOURTH QUARTER AND FULL YEAR 2015 RESULTS
 Mexico City, Mexico, April 27, 2016 Genomma Lab Internacional, S.A.B. de C.V. (BMV: LAB.B) ( Genomma Lab or the Company ), today announced its results for the first quarter ended March 31, 2016. All figures
Report of action Bolsa Mexicana de Valores Ticker Symbol: MEXCHEM*
 Report of action Bolsa Mexicana de Valores Ticker Symbol: MEXCHEM* Contact in Investor Relations: Juan Francisco Sanchez Kramer www.mexichem.com jsanchezk@mexichem.com, phone: (52) 555279 8319 Mexichem
ST IFRS Consolidated Financial Statements Document Preview
 2642 2018 1ST IFRS Consolidated Financial Statements Document Preview Unit: NT$ thousand Accounting Title 2018/03/31 2017/12/31 2017/03/31 Balance Sheet Assets Current assets Description of type of hedge
ASSETS 31 December December 2016
 Condensed Consolidated Interim Balance Sheet as at 31 December 2017 ASSETS 31 December 2017 31 December 2016 Current Assets Cash and Cash Equivalents 7.132 5.159 Financial Investments 736 1.228 Trade Receivables
Responsibility for Financial Reporting
 Responsibility for Financial Reporting The consolidated financial statements and all financial information contained in the annual report are the responsibility of management. The consolidated financial
Half year financial report
 Half year financial report Six-month period ended June 30, 2016 Condensed Consolidated Financial Statements Management Report CEO Attestation Statutory Auditors Review Report Table of contents Condensed
Selected financial information
 FIRST QUARTER 2018 REPORT Sigma is a leading multinational refrigerated food company that produces, markets and distributes quality branded foods, including packaged meats, cheese, yogurt and other refrigerated
GRUPO CEMENTOS DE CHIHUAHUA, S.A.B. DE C.V. (BMV: GCC *) Second quarter 2017 earnings report
 Second quarter 2017 earnings report") GRUPO CEMENTOS DE CHIHUAHUA, S.A.B. DE C.V. (BMV: GCC *) Second quarter 2017 earnings report GCC REPORTS SECOND QUARTER 2017 RESULTS Chihuahua, Chihuahua, Mexico, July 25, 2017 Grupo Cementos de Chihuahua,
GRUPO CEMENTOS DE CHIHUAHUA, S.A.B. DE C.V. (BMV: GCC *) Second quarter 2017 earnings report GCC REPORTS SECOND QUARTER 2017 RESULTS Chihuahua, Chihuahua, Mexico, July 25, 2017 Grupo Cementos de Chihuahua,
Leveraging Our Strengths
 Leveraging Our Strengths First Quarterly Report for the Three Months Ended March 31, 2016 Management s Discussion and Analysis of Financial Conditions and Results of Operations For the three months ended
Selected financial information
 SECOND QUARTER 2018 REPORT Sigma is a leading multinational refrigerated food company that produces, markets and distributes quality branded foods, including packaged meats, cheese, yogurt and other refrigerated
Manulife Financial Corporation Consolidated Financial Statements. For the year ended December 31, 2017
 Manulife Financial Corporation Consolidated Financial Statements For the year ended December 31, 2017 Responsibility for Financial Reporting The accompanying consolidated financial statements of Manulife
Accounting Title 2015/12/ /12/31 Balance Sheet
 Financial Statement Balance Sheet Provided by: MECHEMA CHEMICALS INT CORP. Finacial year: Yearly Accounting Title 2015/12/31 2014/12/31 Balance Sheet Assets Current assets Cash and cash equivalents Total
4Q17 EARNINGS RELEASE. Earnings Release 4Q17 1 / 16
 EARNINGS RELEASE 4Q17 1 / 16 Monterrey, Mexico February 26 th, 2018. Grupo Famsa, S.A.B. de C.V. (BMV: GFAMSA), a leading Mexican commercial conglomerate in the retail, consumer and savings sector, announced
th IFRS Consolidated Financial Statements
 2461 2017 4th IFRS Consolidated Financial Statements Balance Sheet Balance Sheet Unit: NT$ thousand Accounting Title 2017/12/31 2016/12/31 Assets Current assets Cash and cash equivalents Total cash and
Exhibit 99.1 Hydrogenics Corporation
 Exhibit 99.1 2017 Consolidated Financial Statements Management s Responsibility for Financial Reporting Management s Discussion and Analysis of Financial Condition and Results of Operations and the consolidated
HON HAI PRECISION INDUSTRY CO., LTD. AND SUBSIDIARIES CONSOLIDATED SHEETS st IFRS Consolidated Financial Statements
 HON HAI PRECISION INDUSTRY CO., LTD. AND SUBSIDIARIES CONSOLIDATED SHEETS Balance Sheet 2018 1st IFRS Consolidated Financial Statements Accounting Title 2018/03/31 2017/12/31 2017/03/31 Assets Current
Manulife Financial Corporation Consolidated Financial Statements. For the year ended December 31, 2016
 Manulife Financial Corporation Consolidated Financial Statements For the year ended December 31, 2016 Responsibility for Financial Reporting The accompanying consolidated financial statements of Manulife
Vitro Reports Second Quarter 2018 Results
 Vitro Reports Second Quarter 2018 Results 1.1% Year over Year increase in Sales; EBITDA Impacted by Carlisle s Float temporary shutdown San Pedro Garza García, Nuevo León, Mexico, 27 of July -, 2018 Vitro,
Management s Report on Internal Control Over Financial Reporting
 Internal Control Over Financial Reporting Management s Report on Internal Control Over Financial Reporting Management of Brookfield Asset Management Inc. ( Brookfield ) is responsible for establishing
Vitro Reports 3Q 17 Results
 Vitro Reports 3Q 17 Results San Pedro Garza García, Nuevo León, Mexico, October 16, 2017 Vitro, S.A.B. de C.V. (BMV: VITROA), hereinafter Vitro or the Company, a leading glass producer in North America,
2002 First Quarter Results
 2002 First Quarter Results Majority net income increases 1% on back of a 40% drop in financial expense (1) Consolidated Sales: 1Q'02 1Q'01 Var. Net Sales (US$ millions) 1,571.0 1,581.4 (1)% Cement (Thousands
Condensed Consolidated Interim Financial Statements 1Q The Hague, May 11, To help people achieve a lifetime of financial security
 Condensed Consolidated Interim Financial Statements 1Q 2017 The Hague, May 11, 2017 To help people achieve a lifetime of financial security Condensed Consolidated Interim Financial Statements 1Q 2017
FY2017 Consolidated Financial Results (Japanese Accounting Standards) May 14, 2018
 May 14, 2018") Consolidated Financial Results (Japanese Accounting Standards) May 14, 2018 Company name : Nissan Motor Co., Ltd. Code no : 7201 (URL https://www.nissan-global.com/en/ir/)
Consolidated Financial Results (Japanese Accounting Standards) May 14, 2018 Company name : Nissan Motor Co., Ltd. Code no : 7201 (URL https://www.nissan-global.com/en/ir/)
ASSETS 31 March December 2017
 Condensed Consolidated Interim Balance Sheet as at 31 March 2018 Audited ASSETS 31 March 2018 31 December 2017 Current Assets Cash and Cash Equivalents 7.500 7.132 Financial Investments 198 736 Trade Receivables
Tenaris Announces 2018 First Quarter Results
 Giovanni Sardagna Tenaris 1-888-300-5432 www.tenaris.com Tenaris Announces 2018 First Quarter Results The financial and operational information contained in this press release is based on unaudited consolidated
st IFRS Consolidated Financial Statements
 2461 2018 1st IFRS Consolidated Financial Statements Balance Sheet Balance Sheet Unit: NT$ thousand Accounting Title 2018/03/31 2017/12/31 2017/03/31 Assets Current assets Cash and cash equivalents 1,552,283
MEXICAN STOCK EXCHANGE
 WAL - MART DE MEXICO, S.A.B. DE C.V. MEXICAN STOCK EXCHANGE STATEMENT OF FINANCIAL POSITION QUARTER: 1 YEAR: 213 REF AT 31 MARCH 213 AND 31 DECEMBER 212 (Thousand Pesos) ACCOUNT / SUBACCOUNT ENDING CURRENT
INTERNAL CONTROL OVER FINANCIAL REPORTING
 INTERNAL CONTROL OVER FINANCIAL REPORTING MANAGEMENT S REPORT ON INTERNAL CONTROL OVER FINANCIAL REPORTING Management of Brookfield Asset Management Inc. ( Brookfield ) is responsible for establishing
Condensed Consolidated Interim Financial Statements First half year 2018
 Condensed Consolidated Interim Financial Statements First half year 2018 The Hague, August 16, 2018 To help people achieve a lifetime of financial security Condensed Consolidated Interim Financial Statements
IAS Primary Financial Statements (PFS), Financial Reporting for Commercial and Industrial Enterprises,
, Financial Reporting for Commercial and Industrial Enterprises,") 1 iascf-pfs Primary Financial Statements (abstract) (iascf-pfs:iascf.pfs) IAS 1 2 0 iascf-pfs Balance Sheet (abstract) (iascf-pfs:bst) IAS 1 53; IAS 1 7 a 3 0 debit Monetary iascf-pfs Assets (iascf-pfs:ast)
1 iascf-pfs Primary Financial Statements (abstract) (iascf-pfs:iascf.pfs) IAS 1 2 0 iascf-pfs Balance Sheet (abstract) (iascf-pfs:bst) IAS 1 53; IAS 1 7 a 3 0 debit Monetary iascf-pfs Assets (iascf-pfs:ast)
Tenaris Announces 2017 First Quarter Results
 Giovanni Sardagna Tenaris 1-888-300-5432 www.tenaris.com Tenaris Announces 2017 First Quarter Results The financial and operational information contained in this press release is based on unaudited consolidated
Vitro Reports 2Q17 YoY Increases of 146% and 95% in Sales and EBITDA respectively in US Dollars
 Vitro Reports 2Q17 YoY Increases of 146% and 95% in Sales and EBITDA respectively in US Dollars San Pedro Garza García, Nuevo León, Mexico, July 26, 2017 Vitro, S.A.B. de C.V. (BMV: VITROA), hereinafter
FOURTH QUARTER 2017 REPORT
 FOURTH QUARTER 2017 REPORT Sigma is a leading global company in the refrigerated food industry, focused on the production, marketing and distribution of packaged meats, cheese, yogurt and other refrigerated
Tenaris Announces 2017 Third Quarter Results
 Giovanni Sardagna Tenaris 1-888-300-5432 www.tenaris.com Tenaris Announces 2017 Third Quarter Results The financial and operational information contained in this press release is based on unaudited consolidated
Financial Statement Balance Sheet
 Financial Statement Balance Sheet Provided by: RUENTEX INDUSTRIES LIMITED Finacial year: Yearly Unit: NT$ thousand Accounting Title 2016/12/31 2015/12/31 Balance Sheet Assets Current assets Cash and cash
Condensed Consolidated Interim Financial Statements 2Q The Hague, August 10, To help people achieve a lifetime of financial security
 Condensed Consolidated Interim Financial Statements 2Q 2017 The Hague, August 10, 2017 To help people achieve a lifetime of financial security Condensed Consolidated Interim Financial Statements 2Q 2017
Highlights of the third quarter of 2017
 Consolidated Highlights Free cash flow of R$ 500 million in 3Q17, double the amount generated in 2Q17. Selling, general and administrative expenses decrease 18% in 3Q17 compared to 3Q16, corresponding
Vitro Reports 87.1% and 60.3% YoY US dollars Increase in Sales and EBITDA respectively
 Vitro Reports 87.1% and 60.3% YoY US dollars Increase in Sales and EBITDA respectively San Pedro Garza García, Nuevo León, Mexico, April 25, 2017 Vitro, S.A.B. de C.V. (BMV: VITROA), hereinafter Vitro
MEXICAN STOCK EXCHANGE
 STOCK EXCHANGE CODE: AXTEL MEXICAN STOCK EXCHANGE STATEMENT OF FINANCIAL POSITION QUARTER: 1 YEAR: 215 REF AT 31 MARCH 215 AND 31 DECEMBER 214 (Thousand Pesos) ACCOUNT / SUBACCOUNT ENDING CURRENT PREVIOUS
NOTES TO CONSOLIDATED FINANCIAL STATEMENTS
 NOTES TO CONSOLIDATED FINANCIAL STATEMENTS NOTE A. SUMMARY OF SIGNIFICANT ACCOUNTING POLICIES J&J Snack Foods Corp. and Subsidiaries (the Company) manufactures, markets and distributes a variety of nutritional
Report of Independent Registered Public Accounting Firm
 Report of Independent Registered Public Accounting Firm To the Board of Directors and Shareholders of Dell Inc.: In our opinion, the consolidated financial statements listed in the accompanying index present
ELEMENTIA ANNOUNCES SECOND QUARTER RESULTS
 ELEMENTIA ANNOUNCES SECOND QUARTER 2018 1 RESULTS Mexico City, July 25, 2018 - Elementia, S.A.B. de C.V. (BMV: ELEMENT*) ( the Company, or Elementia ) announced today its financial and operating results
Responsibility for Financial Reporting
 Responsibility for Financial Reporting The consolidated financial statements and all financial information contained in the annual report are the responsibility of management. The consolidated financial
ASSETS 30 September December 2017
 Condensed Consolidated Interim Balance Sheet as at Not Reviewed Audited ASSETS 31 December 2017 Current Assets Cash and Cash Equivalents 16.343 7.132 Financial Investments - 736 Trade Receivables -Trade
HON HAI PRECISION INDUSTRY CO., LTD. AND SUBSIDIARIES CONSOLIDATED SHEETS 2016 IFRS Consolidated Financial Statements
 HON HAI PRECISION INDUSTRY CO., LTD. AND SUBSIDIARIES CONSOLIDATED SHEETS 2016 IFRS Consolidated Financial Statements Unit: NT$ thousand Accounting Title 2016/12/31 2015/12/31 Balance Sheet Assets Current
GRUPO CEMENTOS DE CHIHUAHUA, S.A.B. DE C.V. (BMV: GCC *) Second quarter 2015 earnings results
 Second quarter 2015 earnings results") GRUPO CEMENTOS DE CHIHUAHUA, S.A.B. DE C.V. (BMV: GCC *) Second quarter 2015 earnings results GCC REPORTS SECOND QUARTER 2015 RESULTS Chihuahua, Chihuahua, Mexico, July 28, 2015 Grupo Cementos de Chihuahua,
GRUPO CEMENTOS DE CHIHUAHUA, S.A.B. DE C.V. (BMV: GCC *) Second quarter 2015 earnings results GCC REPORTS SECOND QUARTER 2015 RESULTS Chihuahua, Chihuahua, Mexico, July 28, 2015 Grupo Cementos de Chihuahua,
MANAGEMENT S DISCUSSION AND ANALYSIS
 MANAGEMENT S DISCUSSION AND ANALYSIS In addition to historical information, this discussion and analysis contains forward-looking statements. The forward-looking statements contained herein are subject
TransAlta Corporation Consolidated Financial Statements December 31, 2017
 TransAlta Corporation Consolidated Financial Statements December 31, 2017 Consolidated Financial Statements Consolidated Financial Statements Management's Report To the Shareholders of TransAlta Corporation
FOURTH QUARTER RESULTS
 2016 FOURTH QUARTER RESULTS Stock Listing Information NYSE (ADS) Ticker: CX Mexican Stock Exchange Ticker: CEMEXCPO Ratio of CEMEXCPO to CX = 10:1 Investor Relations In the United States: + 1 877 7CX NYSE
GRUPO BIMBO REPORTS FOURTH QUARTER AND FULL YEAR 2014 RESULTS
 Highlights from the quarter: Consolidated net sales rose 10.8%, mainly driven by the Canada Bread acquisition Profit before other income and expenses increased 34.1% reflecting a strong margin expansion
Earnings Release 4Q16
 Monterrey, Mexico, May 4th, 2017 Grupo Famsa, S.A.B. de C.V. (BMV: GFAMSA), a leading Mexican commercial conglomerate in the retail, consumer credit and savings sectors, announced today its earnings results
ASSETS 30 June December 2017
 Condensed Consolidated Interim Balance Sheet as at Audited ASSETS 31 December 2017 Current Assets Cash and Cash Equivalents 11.628 7.132 Financial Investments 395 736 Trade Receivables -Trade Receivables
SG&A % EBIT (2) % Total Net Debt (427) (507) -15.8% * Million US$ Nominal
 % Total Net Debt (427) (507) -15.8% * Million US$ Nominal") Vitro Reports 7.9% YoY Increase in Sales and 16.2% in EBITDA in Mexican Pesos San Pedro Garza García, Nuevo León, Mexico, October 27 th, 2016 Vitro, S.A.B. de C.V. (BMV: VITROA), hereinafter Vitro or the
Vitro Reports 7.9% YoY Increase in Sales and 16.2% in EBITDA in Mexican Pesos San Pedro Garza García, Nuevo León, Mexico, October 27 th, 2016 Vitro, S.A.B. de C.V. (BMV: VITROA), hereinafter Vitro or the
GRUPO BIMBO REPORTS FIRST HALF 2017 RESULTS
 GRUPO BIMBO REPORTS FIRST HALF 2017 RESULTS MEXICO CITY, JULY 25, 2017 Grupo Bimbo, S.A.B. de C.V. ( Grupo Bimbo or the Company ) (BMV: BIMBO) today reported its results for the six months ended June 30,
GrandVision reports HY18 revenue growth of 11.8% at constant exchange rates and comparable growth of 2.8%
 GrandVision reports HY18 revenue of 11.8% at constant exchange rates and comparable of 2.8% Schiphol, the Netherlands 6 August 2018. GrandVision N.V. publishes Half Year and Second Quarter 2018 results.
STYLE INNOVATION SAFETY
 STYLE INNOVATION SAFETY SECOND QUARTERLY REPORT FOR THE SIX MONTHS ENDED JUNE 30, 2014 DOREL INDUSTRIES INC. Management s Discussion and Analysis of Financial Conditions and Results of Operations For the
Grupo Bimbo, S.A.B. de C.V. ( Grupo Bimbo or the Company ) (BMV: BIMBO) today reported its results for the three months ended March 31, 2017.
 (BMV: BIMBO) today reported its results for the three months ended March 31, 2017.") GRUPO BIMBO REPORTS 17 RESULTS MEXICO CITY, APRIL, 26, 2017 Grupo Bimbo, S.A.B. de C.V. ( Grupo Bimbo or the Company ) (BMV: BIMBO) today reported its results for the three months ended March 31, 2017.
GRUPO BIMBO REPORTS 17 RESULTS MEXICO CITY, APRIL, 26, 2017 Grupo Bimbo, S.A.B. de C.V. ( Grupo Bimbo or the Company ) (BMV: BIMBO) today reported its results for the three months ended March 31, 2017.
GENERAL MILLS INC ( GIS ) 10 Q Quarterly report pursuant to sections 13 or 15(d) Filed on 9/22/2010 Filed Period 8/29/2010
 10 Q Quarterly report pursuant to sections 13 or 15(d) Filed on 9/22/2010 Filed Period 8/29/2010") GENERAL MILLS INC ( GIS ) 10 Q Quarterly report pursuant to sections 13 or 15(d) Filed on 9/22/2010 Filed Period 8/29/2010 Table of Contents (Mark One) UNITED STATES SECURITIES AND EXCHANGE COMMISSION
GENERAL MILLS INC ( GIS ) 10 Q Quarterly report pursuant to sections 13 or 15(d) Filed on 9/22/2010 Filed Period 8/29/2010 Table of Contents (Mark One) UNITED STATES SECURITIES AND EXCHANGE COMMISSION
REPORTS AND CONSOLIDATED FINANCIAL STATEMENTS
 REPORTS AND CONSOLIDATED FINANCIAL STATEMENTS 74 Reports 75 Management s Responsibility for Financial Reporting 75 Report of Independent Registered Chartered Accountants 75 Comments by Independent Registered
CLEAR CHANNEL OUTDOOR HOLDINGS, INC.
 UNITED STATES SECURITIES AND EXCHANGE COMMISSION Washington, D.C. 20549 FORM 10-Q (Mark One) QUARTERLY REPORT PURSUANT TO SECTION 13 AND 15(d) OF THE SECURITIES EXCHANGE ACT OF 1934 FOR THE QUARTERLY PERIOD
Financial Results for the Fiscal Year Ended March 31, 2018 [J-GAAP]
![Financial Results for the Fiscal Year Ended March 31, 2018 [J-GAAP]](/thumbs/83/87456247.jpg "Financial Results for the Fiscal Year Ended March 31, 2018 [J-GAAP]") Company Name: Stock exchange listed on: Financial Results for the Fiscal Year Ended March 31, 2018 [J-GAAP] Kintetsu World Express, Inc. (KWE) Tokyo Stock Exchange (First Section) May 11, 2018 Company
Company Name: Stock exchange listed on: Financial Results for the Fiscal Year Ended March 31, 2018 [J-GAAP] Kintetsu World Express, Inc. (KWE) Tokyo Stock Exchange (First Section) May 11, 2018 Company
Consolidated Settlement of Accounts for the First 2 Quarters Ended September 30, 2013 [Japanese Standards]
![Consolidated Settlement of Accounts for the First 2 Quarters Ended September 30, 2013 [Japanese Standards]](/thumbs/92/108990988.jpg "Consolidated Settlement of Accounts for the First 2 Quarters Ended September 30, 2013 [Japanese Standards]") The figures for these Financial Statements are prepared in accordance with the accounting principles based on Japanese law. Accordingly, they do not necessarily match the figures in the Annual Report issued
The figures for these Financial Statements are prepared in accordance with the accounting principles based on Japanese law. Accordingly, they do not necessarily match the figures in the Annual Report issued
GRUPO CEMENTOS DE CHIHUAHUA, S.A.B. DE C.V. (BMV: GCC *) Fourth quarter 2015 earnings results
 Fourth quarter 2015 earnings results") GRUPO CEMENTOS DE CHIHUAHUA, S.A.B. DE C.V. (BMV: GCC *) Fourth quarter 2015 earnings results GCC REPORTS FOURTH QUARTER 2015 RESULTS Chihuahua, Chihuahua, Mexico, January 28, 2016 Grupo Cementos de Chihuahua,
GRUPO CEMENTOS DE CHIHUAHUA, S.A.B. DE C.V. (BMV: GCC *) Fourth quarter 2015 earnings results GCC REPORTS FOURTH QUARTER 2015 RESULTS Chihuahua, Chihuahua, Mexico, January 28, 2016 Grupo Cementos de Chihuahua,
Tenaris Announces 2018 Third Quarter Results
 Giovanni Sardagna Tenaris 1-888-300-5432 www.tenaris.com Tenaris Announces 2018 Third Quarter Results The financial and operational information contained in this press release is based on unaudited consolidated
Fourth Quarter 2014 BMV: GFAMSA
 Monterrey, Mexico, April 27, 2015. Grupo Famsa, S.A.B. de C.V. (BMV: GFAMSA) Report of the Chief Executive Officer of Grupo Famsa, S.A.B. de C.V. on the results of the fourth quarter of 2014 (4Q14), with
Monterrey, Mexico. July 26, 2012 Grupo Famsa, S.A.B. de C.V. (BMV: GFAMSA)
") Second Quarter 2012 BMV: GFAMSA Monterrey, Mexico. July 26, 2012 Grupo Famsa, S.A.B. de C.V. (BMV: GFAMSA) Report from the Chief Executive Officer on Grupo Famsa, S.A.B. de C.V. s second quarter 2012 (2Q12)
Second Quarter 2012 BMV: GFAMSA Monterrey, Mexico. July 26, 2012 Grupo Famsa, S.A.B. de C.V. (BMV: GFAMSA) Report from the Chief Executive Officer on Grupo Famsa, S.A.B. de C.V. s second quarter 2012 (2Q12)
MEXICAN STOCK EXCHANGE
 STOCK EXCHANGE CODE: STATEMENT OF FINANCIAL POSITION QUARTER: 1 YEAR: 213 REF AT 31 MARCH 213 AND 31 DECEMBER 212 (Thousand Pesos) ACCOUNT / SUBACCOUNT ENDING CURRENT PREVIOUS YEAR END Amount Amount 1
Maple Leaf Foods Reports Results for Fourth Quarter TSX: MFI
 Maple Leaf Foods Reports Results for Fourth Quarter 2013 TSX: MFI www.mapleleaffoods.com TORONTO, Feb. 27, 2014 /CNW/ - Maple Leaf Foods Inc. (TSX: MFI) today reported its financial results for the fourth
Form 6-K. Aegon N.V.
 UNITED STATES SECURITIES AND EXCHANGE COMMISSION WASHINGTON, D.C. 20549 Form 6-K Report of Foreign Private Issuer FOR THE SIX MONTHS ENDED JUNE 30, 2017 Commission File Number 001-10882 Aegon N.V. (Translation
3Q18 EARNINGS RELEASE. Earnings Release 3Q18 1 / 16
 EARNINGS RELEASE 3Q18 1 / 16 Monterrey, Mexico, October 25 th, 2018. Grupo Famsa, S.A.B. de C.V. (BMV: GFAMSA), a leading Mexican commercial conglomerate in the retail, consumer and savings sector, announced