TECHNOPOLIS GROUP Q3/2010
|
|
|
- Shon Woods
- 6 years ago
- Views:
Transcription


1 TECHNOPOLIS GROUP Q3/2010

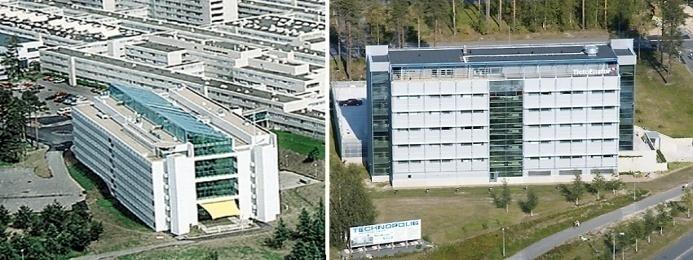
2 Technopolis Group A profitable growth company A real estate-service hybrid Business environments for knowledge-intensive companies Our specialty is the creation, management and growth of innovation environments A scalable concept that we will copy/paste internationally

3 The Technopolis Concept


4 The Technopolis Network customers employing roughly people 17 knowledge-intensive campuses operating as a chain m 2 of space in use and under construction High-quality business environments from 10 m 2 to m 2
5 Highlights Operational environment in Finland is improving, but competition is tough Q3/2010 occupancy has improved to a satisfactory 93,7 %. We expect the year end occupancy rate in Finland to be at least at this level Net sales and EBITDA satisfactory and on target Domestic growth: Projects under construction in HMA, Kuopio and Tampere totaling over m 2 We re now forecasting 2-4 % growth in both sales and earnings Pulkovo commissioned, operating permit received, pre-let rate 40% The Technopolis Ülemiste acquisition was closed on October 7, 2010
6 Key Figures Q3/2010 Net sales EUR 58.4 million (EUR 56.7 million in Q3/2009) EBITDA EUR 31.1 million (EUR 30.0 million) Operating profit rose to EUR 28.6 million (EUR -1.5 million) Financial occupancy rate was 93.7 % (94.3 %) Equity ratio was 38.8 % (38.0 %) Direct result rose to EUR 17.0 million (EUR 15.6 million) Earnings per share (undiluted) were EUR 0.24 (EUR -0.14)

 150 000m 2 of building rights Pro forma annual: Net Sales EUR")

7 Technopolis Ülemiste Ülemiste City is located in Tallinn, the capital of Estonia Over 130 customers employing people Property portfolio of m m 2 of modern facilities (1-5 years) m 2 of building rights Pro forma annual: Net Sales EUR 4.5 million and EBITDA EUR 3.6 million Technopolis holds 51% of Technopolis Ülemiste Enterprise value EUR 63.5 million with loans totaling EUR 43 million
8 Technopolis Sites by Region 6 % 4 % Oulu 10 % 33 % HMA Tampere 12 % Kuopio 13 % 22 % Jyväskylä St. Petersburg Lappeenranta Fair market value of investment properties* and properties under construction MEUR 711 Change in market yield Q vs Q3 2010: %. Change in market yield Q vs Q3 2010: % Fair market value change impact on operating profit: MEUR -1,8 *includes leasing and subleased properties
9 Largest Customers Customer Aalto University ARK Therapeutics Ltd Aspocomp Oulu Ltd Digia Plc Fazer Amica Ltd Honeywell Ltd Ixonos Plc Jyväskylä University Kemira Plc Kesko Plc Customer Kuopio University Logica Suomi Ltd NetHawk Ltd Nokia Plc PKC Group Pöyry Group Sasken Finland Ltd TeliaSonera Finland Plc Tieto Corporation VTT Technical Research Center of Finland - As of the 20 largest customers were renting 39 % of the company s space. - No single company generates more than 8,5 % of the company s rental revenue.
10 Customer Breakdown 5 % Other Industries 10 % 24 % Services 13 % 14 % 17 % Electronics IT Services Public Sector 16 % Software Life Science
11 Pipeline Project Status City Year m 2 MEUR Occupancy St. Pete, Pulkovo Phase 1 Viestikatu Phase 2 commissioned St. Pete ,3 40 % under const. Kuopio ,8 88 % Finn-Medi Campus under const. Tampere ,6 91 % Helsinki-Vantaa Phase 5 B under const. Vantaa ,0 19 % Ruoholahti 2 preparation Helsinki ,7 - Hermia 15 B preparation Tampere ,4 - Viestikatu 3 preparation Kuopio ,7 - Total ,5

12 Pulkovo Phase 1, St. Petersburg Started 8/2008 MEUR 52,3 cost projection m 2 total space Focus on ICT & software 40 % binding pre-lets 95 qualified prospects totaling m 2 Commissioned on September 2010

13 Viestikatu Phase 2, Kuopio Started 1/2010 MEUR 11,8 cost projection m 2 total space 88 % binding pre-lets Projected completion 10/2010

14 Tampere Finn-Medi Campus Started 5/2010 MEUR 29,6 cost projection m 2 total space 91% binding pre-lets Projected completion 11/2011

15 Helsinki-Vantaa, Phase 5 B Started 6/2010 MEUR 6,0 cost projection m 2 total space 19 % binding pre-lets Projected completion 5/2011
16 5,00 4,00 3,00 Eur/Share KEY FIGURES Q3/2010 2, Technopolis Citycon Sponda Klövern
17 Sales & Earnings Net Sales, EUR Million EBITDA, EUR Million & EBITDA % % % 54 Q3/2009 Q3/ Q3/2009 Q3/ % Operating Profit, EUR Million PRO FORMA: Direct Result, EUR Million ,6 30,4-1,80-31,1 Q3/2009-1,5 Q3/ , Q3/2009 Q3/2010 Operating profit without change in fair value Change in fair value of investment properties
18 Financial Occupancy Rate, % 96 % 94 % 92 % 90 % Q3/09 Q4/09 Q1/10 Q2/09 Q3/10
19 Balance Sheet Total Assets & Liabilities, EUR Million Fair Value of Investment Properties, EUR Million Q3/2009 Q3/ Q3/2009 Q3/2010 Average Interest Rate Equity Ratio % 3,0 % 40 2,0 % 38 1,0 % 36 Q3/2009 Q3/2010 Q3/2009 Q3/2010
20 2010 Outlook Economy and markets recovering No longer much uncertainty regarding 2010 market conditions Year end domestic occupancy will be at least 93,7% +2-4 % guidance for both 2010 net sales and EBITDA
21 Strategic Financial Targets to 2015 Growth 10 % on average per annum International sales 25 % of revenues by 2015 Operating centers in 2-3 new European countries EBITDA over 50 % of net sales per year Long-term minimum equity ratio target 35 % Dividend payout % of net profit (excluding valuation changes)
22 Appendices: Additional Data
23 Shareholders on Sept 30, 2010 Major Finnish Shareholders % of share capital Number of Shares Varma Mutual Pension Insurance Company 12, Ilmarinen Mutual Pension Insurance Company 8, City of Oulu 4, City of Tampere 3, OP-Pohjola Group (indirect holding) 7, Jyrki Hallikainen and Kickoff Oy 2, OP Pension Fund 1, The Finnish Cultural Foundation 1, ODIN Finland 1, SITRA Finnish National Fund for Research and Development 1, Total 43, Cities Total 10, Nominee Registered 32, BNP Paribas Investment Partners, indirect holding June 1, 2010 >10,00 > All Shares Total 100,
24 Ownership Structure % of Shares and Votes 1,5 % 4,8 % 2,3 % 3,9 % 1,4 % 7,4 % 78,7 % shares, 2227 owners shares, 1380 owners shares, 207 owners shares, 131 owners shares, 13 owners shares, 22 owners Number of registered shareholders 4002 Ownership concentrated to largest shareholders shares, 22 owners ~65% of holdings domestic and ~35% international or nominee registered At the end of September the market capitalization totaled EUR 259 million Technopolis is included in FTSE EPRA/NAREIT Global Real Estate Index
25 Lease Portfolio Structure 60 % 50 % 40 % 30 % 20 % 10 % 0 % 0-3 months 3-6 months 6-9 months 9-12 months >12 months Q3/2009 Q3/2010 At the end of the period under review, the open-ended leases that could be terminated and renegotiated during the following 12 months covered a total of 47 % (45 % Q3/2009) of the entire property portfolio. As of the end of the period the average lease period was 19 (23) months.
26 Equity Ratio 45,0 % 40,0 % 35,0 % 30,0 % Q3/07 Q3/08 Q3/09 Q3/10
27 Interest Coverage Ratio and Loan to Value Interest Coverage Ratio Loan to Value ,0 % 55,0 % 2 Q3/2009 Q3/ ,0 % Q3/2009 Q3/2010
28 Net Rental Yield % 8,0 % 7,9 % 7,8 % 7,7 % 7,6 % 7,5 % 7,4 % 7,3 % 7,2 % 7,1 % 7,0 % Q1/09 Q2/09 Q3/09 Q4/09 Q1/10 Q2/10 Q3/10 Net Rental Yield % = Total Rental Income from Investment Properties-Direct Costs Fair Market Value of Investment Properties
29 Breakdown of Loans 0 % 9 % 5 % 86 % Bank Loan Commercial papers Leasing Debt Cheque Limit + others Total interest-bearing liabilities EUR million
30 Covenants and Bank Guarantees 15 % 6 % 60 % 19 % Loans Requiring Bank Guarantees with Covenants Loans Requiring Bank Guarantees without Covenants Loans with Covenants Loans without Covenants or Bank Guarantees Total interest-bearing liabilities EUR million
Technopolis Plc Interim Report Q3/2013
 Technopolis Plc Interim Report Q3/2013 Q3/2013 Recap Profitable growth continued, EBITDA up 17.1% Financial occupancy to rise 92.7% in Q4 Signed prelets of 11,400 smq, effective in 2014 Avg. lease up to
Interim Report Q3/2014. October 30, 2014
 Interim Report Q3/2014 October 30, 2014 Q3 Highlights Net sales up 31.3% EBITDA up 38.3%, costs up 20.9%* EPRA Direct result rose 33.5% Occupancy solid at 93.5% Equity ratio 40.6% and LTV 58.1% Divesture
Technopolis Plc Interim Report Q1/2013
 Technopolis Plc Interim Report Q1/2013 Q1/2013 Recap Profitable 2012 growth trend continued in Q1/2013 Oulu and Vilnius acquisitions support 2013 growth Occupancy dropped from 94.3% to 92.2% EUR 75 million
Technopolis Plc Roadshow with Nordea
 Technopolis Plc Roadshow with Nordea Zürich, Geneva and Paris 19-20 June, 2017 Technopolis in Brief We are an international chain of multiuser business campuses established in 1982 in Oulu, Finland We
Technopolis Innova, Jyväskylä, Finland. TECHNOPOLIS GROUP Full Year 2012
 Technopolis Innova, Jyväskylä, Finland TECHNOPOLIS GROUP Full Year 2012 2012 Recap Achieved sales & earnings growth targets Occupancy healthy & increased overall Average lease period increased to 39 months
Results for 1-6/2015. August 20, 2015
 Results for 1-6/2015 August 20, 2015 Q2 in Brief A Strong Performance Occupancy remained strong at 94.1* (93.5)% Net sales up 11.3% & EBITDA up 17.8% EBITDA margin at 56.4 (53.3)% Service revenues up 18.1%
Technopolis Plc. Q3 Interim Report, 2017: Growth Continues into the Second Half. Keith Silverang, CEO October 31, 2017
 Technopolis Plc Q3 Interim Report, 2017: Growth Continues into the Second Half Keith Silverang, CEO Key Messages on Jan-Sep 2o17 Macroeconomic tailwind continues Growth continues at a more moderate pace
A Strong Year for Technopolis
 A Strong Year for Technopolis Full Year 2017 Results Technopolis Plc Keith Silverang, CEO Key Messages on Full Year 2o17 Revised strategy well received execution started immediately Macroeconomic tailwind
A Solid Start to the Year
 A Solid Start to the Year Q1/2018 Results Technopolis Plc Keith Silverang, CEO Key Messages on Q1/2o18 Comparable net sales and EBITDA up over 5%, year-on-year Occupancy rates continued to rise Service
Healthy Operational Performance
 Healthy Operational Performance Half-Year Financial Report 2018 Technopolis Plc Keith Silverang, CEO Key Messages on First Half 2o18 Like-for-like net sales and EBITDA up 3.4% and 4.4%, respectively Occupancy
TECHNOPOLIS PLC FINANCIAL STATEMENTS RELEASE February 1, 2012 at 7:00 p.m.
 TECHNOPOLIS PLC FINANCIAL STATEMENTS RELEASE February 1, 2012 at 7:00 p.m. Technopolis Group Financial Statements for 2011 Highlights of 2011 compared to 2010: - Net sales rose to EUR 92.8 (81.2) million
POHJOLA S CORPORATE BOND SEMINAR
 POHJOLA S CORPORATE BOND SEMINAR Technopolis is Different A Nordic Baltic Approach A focused real estate company with service DNA We develop, own & operate dynamic, smart campuses Profitable growth, geographic
Interim Report 1 Jan 30 Jun August 2008 Kari Inkinen, President and CEO Robert Öhman, CFO
 Interim Report 1 Jan 30 Jun 2008 7 August 2008 Kari Inkinen, President and CEO Robert Öhman, CFO Financial review Market overview Operational review Business areas Appendix 2 Financial review Market overview
Interim Report 1 Jan 31 Mar Kari Inkinen, President and CEO Robert Öhman, CFO
 Interim Report 1 Jan 31 Mar 2008 Kari Inkinen, President and CEO Robert Öhman, CFO Result Q1/2008 Market overview Sponda s operations in Q1/2008 Business areas Appendix 2 Result Q1/2008 Market overview
FINANCIAL STATEMENTS RELEASE February 14, 2014 at 8:00 a.m.
 TECHNOPOLIS PLC FINANCIAL STATEMENTS RELEASE February 14, 2014 at 8:00 a.m. Technopolis Group Statements Report for 2013 A Year of Strong Growth for Technopolis - Net sales rose to EUR 126.3 (107.3) million,
Sponda Financial Results Q November 2015
 Sponda Financial Results Q3 2015 3 November 2015 1. Highlights for the Period Kari Inkinen 2. Strategy Implementation Pia Arrhenius 3. Business environment and Business Update Kari Inkinen 4. Financials
SECURITIES NOTE AND SUMMARY September 2, 2016 TECHNOPOLIS PLC. Offering of. a maximum of 52,282,030 Shares
 SECURITIES NOTE AND SUMMARY September 2, 2016 TECHNOPOLIS PLC Offering of a maximum of 52,282,030 Shares Technopolis Plc (the Company ), a public limited liability company incorporated in Finland, is offering
TECHNOPOLIS GROUP INTERIM REPORT JANUARY 1 SEPTEMBER 30, 2009
 TECHNOPOLIS PLC INTERIM REPORT October 29, 2009 at 11.45 a.m. TECHNOPOLIS GROUP INTERIM REPORT JANUARY 1 SEPTEMBER 30, 2009 Highlights for the period 1 9/2009 compared with 2008 equivalent - Net sales
Interim report 1 Jan - 30 Sep Kari Inkinen CEO
 Interim report 1 Jan - 30 Sep 2007 Kari Inkinen CEO 1 2 Market review GDP growth % Finland Euro Area United States Japan 7 6 5 4 3 2 1 0-1 -2-3 1997 1998 1999 2000 2001 2002 2003 2004 2005 2006* 2007**
Technopolis expects its net sales and EBITDA in 2016 to remain on the same level (+/- 5%) as in 2015.
 as in 2015.") TECHNOPOLIS PLC INTERIM REPORT May 10, 2016 Technopolis Group Interim Report January 1 March 31, 2016 Steady Start to Year, Guidance Unchanged - Net sales EUR 41.1 (41.2) million, down 0.3%. On a constant
TECHNOPOLIS PLC INTERIM REPORT May 10, 2016 Technopolis Group Interim Report January 1 March 31, 2016 Steady Start to Year, Guidance Unchanged - Net sales EUR 41.1 (41.2) million, down 0.3%. On a constant
SATO Interim report
 Interim report 1.1. 30.6.2007 SATO Interim report 1.1. 30.6.2007 Summary of the period 1-6/2007 the Group s turnover was 140.5 (1.1. 30.6.2006: 152.8) million euros profit before taxes was 18.7 (24.8)
Financial Year February 2009 Kari Inkinen, President and CEO Robert Öhman, CFO
 Financial Year 2008 6 February 2009 Kari Inkinen, President and CEO Robert Öhman, CFO Year 2008 in a nutshell Financial position Property market Operational review Year 2009 Appendix 2 Year 2008 in a nutshell
Technopolis Plc Quarterly report January-September 2017
 Technopolis Plc Quarterly report January-September October 31, GROWTH CONTINUES INTO THE SECOND HALF January September Net sales up 5.4% y-o-y to EUR 134.2 (127.3) million EBITDA up 5.4% y-o-y to EUR 74.5
Technopolis expects its net sales and EBITDA in 2016 to remain on the same level (+/- 5%) as in 2015.
 as in 2015.") TECHNOPOLIS PLC INTERIM REPORT October 28, 2016 Technopolis Group Interim Report January 1 September 30, 2016 Positive Earnings Trend - Net sales EUR 127.3 (128.9) million, down 1.2% mainly due to 2015
TECHNOPOLIS PLC INTERIM REPORT October 28, 2016 Technopolis Group Interim Report January 1 September 30, 2016 Positive Earnings Trend - Net sales EUR 127.3 (128.9) million, down 1.2% mainly due to 2015
Financial Results Year February 2013
 Financial Results Year 2012 1 February 2013 Agenda 1. Performance highlights and our priorities Kari Inkinen 2. Market Update Kari Inkinen 3. Financials Erik Hjelt 4. Business Update Kari Inkinen 2 Performance
Financial Report 2014
 392.5 M Market Capitalization 161.7 M Net sales 94.7% Financial Occupancy Rate 53.9% EBITDA Financial Report 2014 0.53 Direct Result/share 1 more than squares Technopolis Plc Financial Report 2014 Contents
Technopolis Plc Q Interim Report
 Technopolis Plc Q3 Interim Report October 25, NEW ERA FOR TECHNOPOLIS January September IFRS Net sales down 2.1% to EUR 131.4 (134.2) million Earnings per share were EUR 0.33 (0.33) Equity per share was
Financial Statements 20 17
 Financial Statements 20 17 2 Financial Statements 2017 Contents Board of Directors Report...3 Five-Year Review...14 Consolidated Income Statement...16 Consolidated Statement of Comprehensive Income...16
SATO Interim report
 SATO Interim report 1.1.-30.9.2008 SATO Interim report 1.1. 30.9.2008 Summary of the period 1-9/2008 (1-9/2007) The Group s turnover was 183.4 million euros (191.7) and operating profit was 54.8 (50.3)
Financial Results Q Kari Inkinen, President and CEO Erik Hjelt, CFO Pia Arrhenius, SVP, IR
 Financial Results Q2 2009 Kari Inkinen, President and CEO Erik Hjelt, CFO Pia Arrhenius, SVP, IR Introduction Market review Business overview Financial overview Appendix 2 Overview of reporting segments
Financial Report 2015
 Financial Report 2015 more than squares Financial Report 2015 1 Technopolis Plc Financial Report 2015 Contents CEO s Review... 3 Technopolis in Brief...4 Our Campuses...8 Oulu...8 Helsinki Metropolitan
Technopolis Plc Quarterly report January-March 2018
 Technopolis Plc Quarterly report January-March 2018 April 25, 2018 SOLID START TO THE YEAR COMPARABLE SALES AND EBITDA UP BY OVER 5% Q1/2018 IFRS Net sales were EUR 42.9 (44.3) million, down 3.1% y-o-y
Interim report 1 Jan -30 Sep Kari Inkinen CEO
 Interim report 1 Jan -30 Sep 2006 Kari Inkinen CEO 1 2 Market review Business conditions for 2006 Finnish GDP growth estimate is just under 5 %. Inflation estimate for 2006 is 1.6 %. Unemployment estimated
SATO Interim report
 Interim report 1.1. 30.9.2007 SATO Interim report 1.1. 30.9.2007 Summary of the period 1-9/2007 (1-9/2006) The Group s turnover was 201.5 (213.6) million euros. Profit before taxes was 27.5 (32.9) million
SATO Interim report
 SATO Interim report 1.1.-30.6.2008 SATO Interim report 1.1. 30.6.2008 Summary of the period 1-6/2008 (1-6/2007) The Group s turnover was 125.8 (129.7) million euros and operating profit was 36.8 (32.2)
Financial Results Q August 2012
 Financial Results Q2 2012 3 August 2012 Agenda 1. Performance highlights and our priorities Kari Inkinen 2. Market Update Kari Inkinen 3. Financials Erik Hjelt 4. Business Update Kari Inkinen 2 1. Performance
Annual General Meeting Sponda Plc. 18 March 2013 Finlandia Hall
 Annual General Meeting Sponda Plc 18 March 2013 Finlandia Hall Composition of the Board of Directors of Sponda Plc Lauri Ratia (Chairman) Arja Talma Erkki Virtanen Raimo Valo Klaus Cawén Tuula Entelä 2
Annual General Meeting Sponda Plc. Finlandia Hall, Helsinki
 Annual General Meeting Sponda Plc 16 March 2011 Finlandia Hall, Helsinki Composition of the Board of Directors of Sponda Plc Lauri Ratia (chairman) Timo Korvenpää (deputy chairman) Klaus Cawén Tuula Entelä
Technopolis Plc Half-Year Financial Report 2018
 Technopolis Plc Half-Year Financial Report August 23, HEALTHY OPERATIONAL PERFORMANCE LIKE-FOR-LIKE SALES AND EBITDA UP BY 3.4% AND 4.4%, RESPECTIVELY January June IFRS Net sales down 3.2% y-o-y to EUR
SATO. large. investments in rented homes
 SATO large investments in rented homes Interim report 1 January 30 June 2011 SATO mission SATO is a provider of good housing strategic aims constantly improving services for the customer average 12% annual
Financial Results Q November 2012
 Financial Results Q3 2012 2 November 2012 Conference call 11.00 am EET Dial-in number: +44 (0)20 3364 5381 Webcast available on our website: Investors > performance > results and presentations Agenda 1.
KTI Market Review. Spring 2018
 KTI Market Review Spring 2018 Transaction volumes remain high Yields bottoming out? Office vacancy rates decreasing Helsinki CBD office rental growth accelerating Residential rents continue increasing
ILMARINEN JANUARY MARCH Press Conference 29 April 2016
 ILMARINEN JANUARY MARCH 2016 Press Conference 29 April 2016 1 Q1/2016: RETURN ON INVESTMENTS Timo Ritakallio, President and CEO 2 INVESTMENT RETURN DEPRESSED BY DECLINE IN SHARE PRICES January March 2016
Financial Results Q May 2012
 Financial Results Q1 2012 4 May 2012 Conference call 11.00 am EET Dial-in number: +44 (0)20 3450 9987 Webcast available at our website: Investors > performance > results and presentations Agenda Performance
Tieto Q4 09. the right track shifting focus. March 2010 London, the UK. Seppo Haapalainen CFO Reeta Kaukiainen VP, Comms&IR. Corporation.
 Tieto Q4 09 Sales down, profitability on the right track shifting focus to growth March 2010 London, the UK 2010 Tieto Corporation Seppo Haapalainen CFO Reeta Kaukiainen VP, Comms&IR 16 600 IT professionals
Audiocast presentation
 Audiocast presentation / CEO, Marcel Kokkeel CFO, Exec. VP Eero Sihvonen 2 / CONSOLIDATION AS NORDIC LEADER Highlights / Stable financial performance Result supported by lower financing expenses Diverging
977 2, % 8,196 8, % Net gearing 27.5% 34.5% 27.5% 34.5% Equity ratio 52.6% 47.8% 52.6% 47.8%
 Digia s fourth quarter 2012: Operating profit slightly better than expected, despite effects of Qt acquisition and one-off costs of finalised personnel negotiations Summary January-December Consolidated
TECHNOPOLIS PLC INTERIM REPORT May 4, Technopolis Group Interim Report January 1 - March 31, Strong increase in net sales and earnings
 TECHNOPOLIS PLC INTERIM REPORT May 4, 2017 Technopolis Group Interim Report January 1 - March 31, 2017 Strong increase in net sales and earnings - Net sales EUR 44.3 (41.1) million, up 7.8% - EBITDA EUR
Financial Statements Release 2018
 14 February 2019 Jani Nieminen, CEO Erik Hjelt, CFO Financial Statements Release 2018 Kojamo plc Agenda Summary of year 2018 Financial development Outlook, financial targets and dividend policy Lauri Korpisen
INTERIM REPORT 1 JANUARY 30 SEPTEMBER SATO s profitable growth continued
 INTERIM REPORT 1 JANUARY 30 SEPTEMBER SATO s profitable growth continued Contents Strategy... 4 SATO Corporation Interim report 1 Jan - 30 Sep... 5 The business climate... 5 President and CEO Erkka Valkila...
Order backlog grows to EUR 1.7 billion, REDI project weakens profitability
 Order backlog grows to EUR 1.7 billion, REDI project weakens profitability Interim report 1-6/2018, SRV Group Plc 19th July 2018 Juha Pekka Ojala, CEO Ilkka Pitkänen, CFO Agenda Urbanisation and SRV H1
Summary. January-June
 Second quarter 2011: Enterprise Solutions Developed positively, extraordinary Items related to Mobile Solutions' restructuring pushed group's bottom line into red Summary January-June - Consolidated net
FINANCIAL STATEMENTS Timo Ritakallio, President and CEO Press Conference 19 Ferbuary 2016
 FINANCIAL STATEMENTS 2015 Timo Ritakallio, President and CEO Press Conference 19 Ferbuary 2016 1 ILMARINEN TAKES CARE OF THE PENSION COVER OF CLOSE TO 900,000 FINNS 500,500 employees 38 400 companies 61
The REDI shopping centre opened in September, pushed earnings into the red. Order backlog EUR 1.7 billion
 The REDI shopping centre opened in September, pushed earnings into the red. Order backlog EUR 1.7 billion Interim report 1-9/2018, SRV Group Plc 25 October 2018 Juha Pekka Ojala, CEO Ilkka Pitkänen, CFO
5 November Interim Report 1-9/2015. Tiina Alahuhta-Kasko 5 November 2015
 5 November 2015 Interim Report 1-9/2015 Tiina Alahuhta-Kasko 5 November 2015 Highlights and key events Q3/2015 H i g h l i g h t s + Additional sales from the new stores + Increase in outlet and discount-driven
Optimizing Shareholder Structure
 Optimizing Shareholder Structure Petra Thorén Senior Vice President Investor Relations Copenhagen June 18, 2008 1 Contents YIT Group Corporate Governance and Shareholder Structure- Some Theory and Research
FOR FINNISH OWNERSHIP
 FOR FINNISH OWNERSHIP ANNUAL REPORT Contents Solidium 2 Solidium in brief 3 Chairman of the Board s review 4 Managing Director s review 6 Solidium s mission and operation Holdings 8 Solidium s investments
Interim Report January March Kari Kauniskangas, President and CEO
 Interim Report January March 2017 Kari Kauniskangas, President and CEO Contents 1 Group development in Q1/2017 2 Housing Finland and CEE 3 Housing Russia 4 Business Premises and Infrastructure 5 Financial
Continuously improved performance in Stockmann Retail and Real Estate Group s operating result negatively impacted by Lindex
 Interim report Q3 2017 2 STOCKMANN S INTERIM REPORT Q3 2017 STOCKMANN plc, Interim report 27.10.2017 at 8:00 EET Continuously improved performance in Stockmann Retail and Real Estate Group s operating
STATEMENT. Evaluation of the fair value of Sponda Oyj s investment properties on 31 March 2009
 STATEMENT Evaluation of the fair value of Sponda Oyj s investment properties on 31 March 2009 0 1 EVALUATION OF THE FAIR VALUE OF SPONDA OYJ S INVESTMENT PROPERTIES Sponda Oyj conducts its own quarterly
Q INTERIM REPORT JANUARY SEPTEMBER
 Q3 2018 INTERIM REPORT JANUARY SEPTEMBER CITYCON Q3/2018: SOLID OPERATING PERFORMANCE CONTINUED AND ADMINISTRATIVE EXPENSES DECLINED SIGNIFICANTLY. Q3/2018 2 Occupancy remained at a high level of 96.1%.
Stock Exchange Release 9 November 2005, 9.00 am
 Sponda Plc Stock Exchange Release 9 November 2005, 9.00 am Sponda Plc s interim report January-September 2005 Sponda s nine-month operating profit improved 42 % on the same period last year. The operating
Business review Record number of new construction projects underway
 Business review 1.1. 31.3.2018 Record number of new construction projects underway 1-3 / 2018 (1-3 / 2017) Total revenue 4 M (2,5 M ) Value of investment properties 268 M (173 M ) Occypancy rate 100 %
AUDIOCAST PRESENTATION Q3/2017
 19.10.2017 AUDIOCAST PRESENTATION Q3/2017 Q3/2017: GOOD OPERATIONAL RESULTS IN SWEDEN AND NORWAY HIGHLIGHTS Q3/2017 4.7% INCREASE IN EPRA EPS TO EUR 0.133 - Overall net rental income growth and lower administrative
Sponda Plc's interim report January-September 2011
 1.1. 30.9.2011 Sponda Plc's interim report January-September 2011 Sponda Plc's total revenue in January-September 2011 was EUR 183.3 million (30 September 2010: EUR 173.6 million). Net operating income
MEUR 4-6/11 4-6/10 1-6/11 1-6/
 1 INTERIM REPORT 1-6/2011 AFFECTO PLC -- INTERIM REPORT -- 2 AUGUST 2011 at 9.30 AFFECTO PLC'S INTERIM REPORT 1-6/2011 GROUP KEY FIGURES MEUR 4-6/11 4-6/10 1-6/11 1-6/10 2010 Net sales 32.6 28.4 62.7 54.2
The Group s adjusted operating result back to profit in Q3
 Interim report Q3 2018 2 STOCKMANN S INTERIM REPORT Q3 2018 STOCKMANN plc, Interim report 26.10.2018 at 8:00 EET The Group s adjusted operating result back to profit in Q3 July-September 2018, continuing
ANNUAL GENERAL MEETING 8 APRIL President Harri Takanen
 ANNUAL GENERAL MEETING 8 APRIL 2010 President Harri Takanen Year 2009 Scanfil plc The Extraordinary General Meeting of Scanfil EMS Oy decided on 30 September 2009 on a capital return of EUR 65 million
Tiimari Plc Stock Exchange Release 12 November 2007 KEY FIGURES OF THE CONTINUED OPERATIONS ON REVIEW PERIOD 1 JANUARY 30 SEPTEMBER 2007:
 Tiimari Oyj Abp Interim Report January 1 - September 30, 2007 12/11/2007 Tiimari Plc Stock Exchange Release 12 November 2007 Tiimari result as expected considering seasonality KEY FIGURES OF THE CONTINUED
Gofore Plc HALF-YEAR REPORT
 Gofore Plc HALF-YEAR REPORT 1 January 30 June 15 August Gofore Plc s Half-year Report 1 January 30 June, GOFORE PLC COMPANY ANNOUNCEMENT 15 AUGUST AT 09:00 EET Gofore Plc s Half-year Report 1 January 30
Financial Year Kari Inkinen CEO
 Financial Year 2005 Kari Inkinen CEO Strategy Target: to increase business volume and profitability Possible development projects are approximately 300 000 m² Development target 50 meur/year Profitability
INTERIM REPORT H1/2018
 INTERIM REPORT H1/2018 MIKA VIRTANEN, CEO ILKKA MIETTINEN, CFO 16 AUGUST 2018 ROBIT A GENUINE GROWTH COMPANY GROWTH COMPANY ~26% p.a. 19 ~150 Organic and structural growth Sales growth of last 12 years
STATEMENT. Evaluation of the fair value of Sponda Plc s investment properties on 31 December 2015
 STATEMENT 0 Evaluation of the fair value of Sponda Plc s investment properties on 31 December 2015 1 EVALUATION OF THE FAIR VALUE OF SPONDA PLC S INVESTMENT PROPERTIES Sponda Plc (hereinafter referred
TERMS AND CONDITIONS OF THE RIGHTS ISSUE
 TERMS AND CONDITIONS OF THE RIGHTS ISSUE Background Citycon Oyj (the Company ) and CPP Investment Board European Holdings S.à r.l ( CPPIBEH ), a wholly owned subsidiary of Canada Pension Plan Investment
RAMIRENT GROUP INTERIM REPORT
 RAMIRENT GROUP Interim report january JUNE 2008 Q2 LIVE AUDIOCAST AND CONFERENCE CALL ON 15 AUGUST, 2008 AT 10:00 AM LOCAL TIME A briefing for investment analysts and the press will be arranged on Friday
January-September 2016 Business Review CEO Heikki Väänänen & CFO Sixten Hjort
 January-September 2016 Business Review CEO Heikki Väänänen & CFO Sixten Hjort Q3 Highlights: profitability improved, net sales at last year s level, negotiations about Anttila store space proceeding Profitability
Sponda Plc Financial Statements Bulletin 9 February 2006, 9.00
 Sponda Plc Financial Statements Bulletin 9 February 2006, 9.00 Sponda Plc s 2005 Financial Statements Bulletin Sponda s result for 2005 distinctly better than in the previous year Sponda s result in 2005
Interim report 1 January 31 March
 2007 Interim report 1 January 31 March 2/15 - INTERIM REPORT JANUARY 1 - MARCH 31, 2007 Net sales totaled MEUR 28.9 (MEUR 26.5), up 9% on the comparison period. Operating profit, MEUR 1.9 (MEUR 1.1), and
CITYCON PRESENTATION Q3/2017
 19.10.2017 CITYCON PRESENTATION Q3/2017 LEADING OWNER, MANAGER AND DEVELOPER OF SHOPPING CENTRES IN THE NORDICS AND BALTICS 49 shopping centres 1) 13 managed/rented assets GLA 1.2 million sq.m. PORTFOLIO
Webcast Presentation. Financial Results 2009
 Webcast Presentation Financial Results 2009 Strategy Citycon wants to be the leading shopping centre owner, operator and developer in the Nordic and Baltic countries. invests in shopping centres and retail
Contents. Board of Directors' Report. Annual Report Financial Indicators. Net Sales. Profit and Profitability
 Annual Report 2016 Contents Board of Directors' Report Financial Indicators Net Sales Profit and Profitability Financing, Cash Flow and Expenditure Research and Development Personnel, Management and Administration
Ilmarinen Mutual Pension Insurance Company
 Firm: Ilmarinen Mutual Pension Insurance Company Ilmarinen Mutual Pension Insurance Company Evaluator Founded in Hidden Hidden Hidden Hidden EU mergers and takeovers (June 30) Headcount: Hidden Assets
Kimmo Alkio President and CEO Lasse Heinonen CFO
 Tieto Q1/2012 Kimmo Alkio President and CEO Lasse Heinonen CFO Summary Financial performance in line with short-term expectations New strategy for 2012 2016 launched and well received Competitive cost
Q INTERIM REPORT JANUARY JUNE
 Q2 2016 INTERIM REPORT JANUARY JUNE 02 Citycon Q2: Stable results, cost savings programme implemented APRIL JUNE 2016 Gross rental income increased to EUR 62.2 million (Q2/2015: 46.6) mainly due to the
FINLAND. Country Snapshots. Second quarter Please click on the appropriate sector to view. Offices Retail Industrial.
 Country s Second quarter 2017 Please click on the appropriate sector to view Offices Retail Industrial About & Contacts Office Market MARKET INDICATORS Market Outlook Prime Rents: Prime Yields: Vacancy
CITYCON PRESENTATION 2017
 8.2.2018 CITYCON PRESENTATION 2017 LEADING OWNER, MANAGER AND DEVELOPER OF SHOPPING CENTRES IN THE NORDICS AND BALTICS 43 shopping centres 1) 12 managed/rented assets GLA approx. 1.2 million sq.m. 165
Markets and customers: Stabilized market with good outsourcing demand
 Tieto Q2 10 Sales still slightly down; strong order intake 21 July 2010 Helsinki, Finland Corporation Hannu Syrjälä President and CEO Seppo Haapalainen CFO Reeta Kaukiainen VP, Comms&IR Markets and customers:
STATEMENT. Evaluation of the fair value of Sponda Plc s investment properties on 31 December 2012
 STATEMENT 0 Evaluation of the fair value of Sponda Plc s investment properties on 31 December 2012 1 EVALUATION OF THE FAIR VALUE OF SPONDA PLC S INVESTMENT PROPERTIES Sponda Plc (hereinafter referred
ORAVA RESIDENTIAL REIT PLC HALF YEAR FINANCIAL REPORT 1 JANUARY 30 JUNE 2018
 ORAVA RESIDENTIAL REIT PLC HALF YEAR FINANCIAL REPORT 1 JANUARY 30 JUNE 2018 1 TABLE OF CONTENTS TABLE OF CONTENTS 2 CEO S COMMENTS: 3 OPERATING ENVIRONMENT 4 Demand in the housing market 4 Supply in the
SRV - Constructively different
 SRV - Constructively different Quarterly Report January- June 2008 Eero Heliövaara August 19th, 2008 SRV JULKINEN Hannu Linnoinen 1 SRV s successful first half of the year Group s operating profit grew
INTERIM REPORT Q Stockmann Group 27 April 2018
 INTERIM REPORT Q1 2018 Stockmann Group 27 April 2018 Q1 2018 IN BRIEF Group s gross margin 55.1% (53.3) Group s adjusted operating result, EUR mill. -24.8 ( 25.1) Stockmann Group Adjusted operating result
The order backlog rose to EUR 1.8 billion, cash flow positive despite the loss-making result
 1 (26) SRV GROUP PLC S FINANCIAL STATEMENT RELEASE 1 JANUARY - 31 DECEMBER 2018 The order backlog rose to EUR 1.8 billion, cash flow positive despite the loss-making result January-December 2018 in brief:
PKC Group Oyj FINANCIAL STATEMENT RELEASE 17 February a.m. PKC GROUP S FINANCIAL STATEMENT RELEASE, 1 January 31 December 2010
 PKC Group Oyj FINANCIAL STATEMENT RELEASE 17 February 2011 8.15 a.m. PKC GROUP S FINANCIAL STATEMENT RELEASE, 1 January 31 December 2010 Consolidated net sales grew 56.6% on the previous year (1-12/2009),
CONSTI GROUP PLC HALF-YEAR FINANCIAL REPORT 1 JANUARY 30 JUNE 2018
 CONSTI GROUP PLC HALF-YEAR FINANCIAL REPORT 1 JANUARY 30 JUNE 2018 CEO Esa Korkeela CFO Joni Sorsanen Contents Highlights and Group performance Cash flow and financial position Market outlook, guidance
Annual General Meeting 2 April, 2009
 Annual General Meeting 2 April, 2009 President and CEO Magnus Rosén 1 2.4.2009 AGM 2009 2009 Ramirent Forward-looking statements A number of forward-looking statements will be made during this presentation.
New strategy well under way, operating profit up in the second quarter
 Interim Report Q2 2015 2 STOCKMANN S INTERIM REPORT Q2 2015 STOCKMANN plc, Interim Report 29.4.2015 at 8.00 EET New strategy well under way, operating profit up in the second quarter April-June 2015: Consolidated
GROUP AUTOMATION JOT
 January September 2 I n t e r i m R e p o r t J O T A U T O M A T I O N G R O U P I N T E R I M R E P O R T January September 2 s nine month net sales increased to 115,7 million euros. During the period
Ramirent US Roadshow September, 2008
 Ramirent US Roadshow 2008 11-12 September, 2008 Kari Kallio, President and CEO Heli Iisakka, CFO Franciska Janzon, IR 1 11-12 Sept, 2008 US Roadshow 2008 2008 Ramirent Ramirent in Brief Leading equipment
Huhtamaki roadshow presentation. Investor Relations Copenhagen Jan 8, 2010
 Huhtamaki roadshow presentation Investor Relations Copenhagen Jan 8, 2010 Huhtamaki in brief A leading manufacturer of consumer and specialty packaging with head office in Espoo, Finland Net sales EUR
Ramirent s Year Kari Kallio, CEO Annual General Meeting 9 April 2008, Pörssisali
 Ramirent s Year 2007 Kari Kallio, CEO Annual General Meeting 9 April 2008, Pörssisali Ramirent in Brief Leading equipment rental company in Northern, Central and Eastern Europe Net Sales of EUR 634 million