SATO. large. investments in rented homes
|
|
|
- Marlene Alexander
- 6 years ago
- Views:
Transcription


1 SATO large investments in rented homes Interim report 1 January 30 June 2011
2 SATO mission SATO is a provider of good housing strategic aims constantly improving services for the customer average 12% annual return for the shareholders value of the investment properties > 3 billion in 2020 vision homes are our passion 50,000 satisfied residents in our homes in 2020 SATO s values customer satisfaction we keep our promises the personnel s expertise skilled personnel is our strength partnership we win by working together profitability profit enables us to build the future FINANCIAL TARGETS To promote business continuity, profitability and growth, the following targets have been set for the equity ratio, dividend payments and investments: SATO business equity ratio at fair values > 25 % dividend of distributable profit > 60 % MEUR 100 of annual investments in rented housing
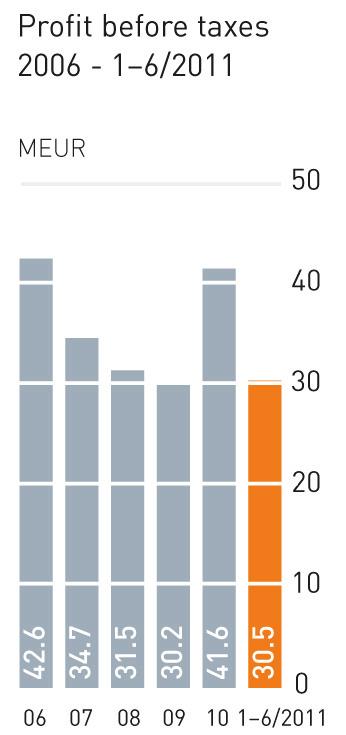
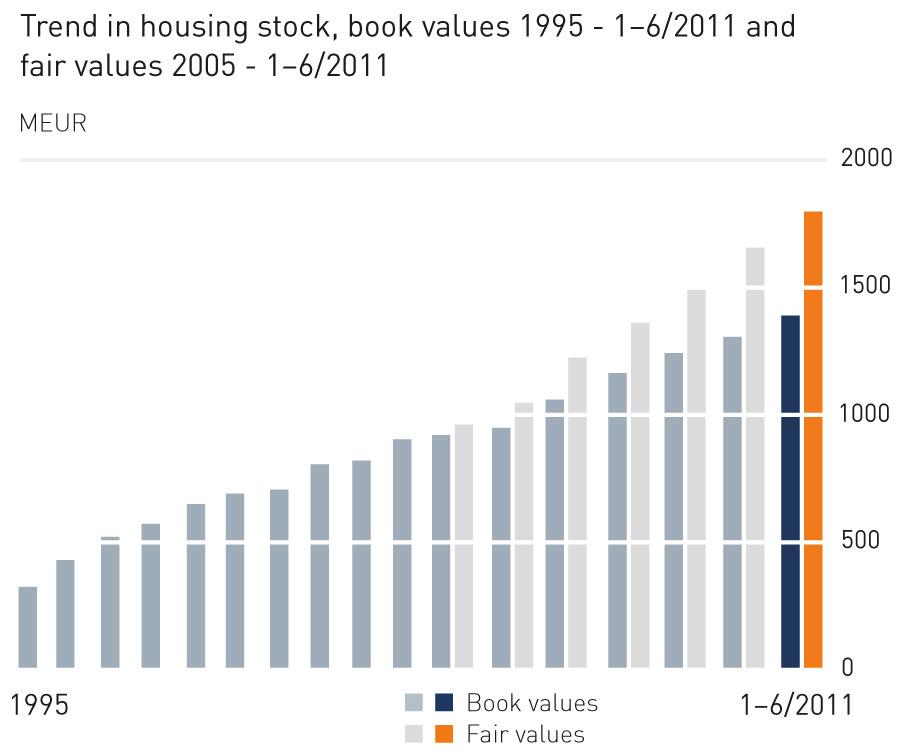
3 SATO interim report 1 Jan.-30 June SUMMARY OF THE PERIOD 1-6/2011 (1-6/2010) Profit before taxes improved and was 30.5 (22.7) million euros, in addition to which the difference in value of the investment properties grew during the period under review by 56.7 (29.8) million euros. The Group s turnover (96.7) million euros, of which rental income 95.8 (88.8) million euros Operating profit 45.9 (41.0) million euros The fair value of the investment properties 1,798 (1,558) million euros Investments in investment properties (53.8) million euros Net assets per share at fair value (9.19) euros Earnings per share 0.44 (0.35) euros THE BUSINESS CLIMATE Demand for rented housing continued to be mostly good, particularly in the Helsinki Metropolitan Area. The trend in rents on average follows the general trend in inflation. Urbanisation, smaller family sizes, the greying population and work-based immigration support expectations for growth in demand for rented housing also in the years ahead. Consumers confidence in the overall economic trend has deteriorated, but their confidence in their own economic trend has continued to be good. Interest rates went up during the period under review, although they continued to be low relative to the long-term average. Demand for owner-occupied housing and the construction of owner-occupied properties continued at a brisk rate. President and CEO Erkka Valkila: We have made successful investments which correspond with the growing demand for rented homes. We have also clearly boosted investments in new housing. Our goal is to grow to be Finland s most important housing investment company. SATO s favourable income trend and the business climate mean promising prospects for growth in business. A good building land inventory and our own housing construction support SATO s growth: we will commission construction of rented homes for our ownership and we will also sell homes as owner-occupied properties. SEGMENT DIVISION In financial reporting, the Group s investment properties are grouped under two segments, namely SATO business and VATRO business. This segmentation increases the transparency of operations and reporting related to the state-supsidised housing stock. SATO business is comprised of investment properties which are restriction-free or have shorter-term restrictions as well as owneroccupied home construction. VATRO business is comprised of investment properties with longer-term restrictions. In accordance with the Group s growth strategy, most of the new investments are allocated to homes included in SATO business and the relative importance of VATRO business in the Group is declining. TURNOVER AND PROFIT The Group s turnover grew relative to the comparison period by 13.1 per cent and was million euros (96.7 million euros ). Rental income accounted for 95.8 (88.9) million euros of turnover. During the period under review, the rental occupancy rate held steady at an excellent level and rental income grew by 7.9 per cent. Of turnover, 92.0 (79.3) million euros was generated by SATO business and 17.4 (17.4) million euros by VATRO business. Operating profit for the period under review was 45.9 (41.0) million euros. The Group s profit before taxes for the period under review was 30.5 (22.7) million euros. Furthermore, the difference in value of the investment properties grew by 56.7 (29.8) million euros. The profit figure includes 8.6 (9.8) million euros for proceeds from divestments. The improvement in profit was influenced mainly by a high rental occupancy rate and good cost management as well as continuing low interest rates. Of the profit before taxes, SATO business accounted for 27.4 (17.3) million euros and VATRO business for 3.1 (5.4) million euros. FINANCIAL STATUS AND FINANCING The consolidated balance sheet total at the end of the period under review totalled 1,577.1 (1,421.5) million euros. Shareholders equity was (256.3) million euros. Net assets, calculated on the fair value of investment properties, were (470.6) million euros. The entire Group s equity ratio, calculated on the book value of investment properties, was 17.9 (18.1) per cent and at fair value it was 29.5 (27.6) per cent. The Group s return on equity was 16.2 (14.0) per cent. Return on investment was 6.7 (6.4) per cent.
4 2 The financial position of the Group and parent company was favourable during the period under review. The Group s liquid assets at the end of the period under review were 26.8 (17.5) million euros. During the period under review, the capital tied up in inventories grew by 11.1 (-9.7) million euros due to the start-up of new projects for sale. Interest-bearing liabilities at the end of the period under review were 1,162.3 (1,032.2) million euros, of which market rate loans totalled (588.5) million euros, pension insurance loans totalled 37.2 (40.9) million euros, interest-subsidised loans totalled 98.2 (100.1) million euros, and state-subsidised loans totalled (198.7) million euros. There were debts in the amount of (104.0) million euros on shares held in housing companies and mutual property holding companies included in investment properties. At the end of the period under review, the average interest rate on loans was 3.2 per cent. During the period under review, long-term loans grew by million euros. Of the capital of market rate loans at the end of the period under review, 74.7 (74.0) per cent was hedged with interest-rate swaps. The average maturity of the swaps was 3.8 (3.3) years. During the period under review, the computational effect of changes in the market value of hedging on the shareholders equity was 2.1 (-7.4) million euros and the effect on net profit was 2.1 (-1.1) million euros. The state-subsidised ARAVA loans, interestsubsidised loans and pension insurance loans are pegged to a long-term reference rate or include an element limiting the interest risk. When these loans are included, the hedged total of the interest-bearing liabilities is 74 (75) per cent. INVESTMENT PROPERTIES The trend in the investment properties value is of key importance to SATO. Housing property is consolidated in areas in which long-term demand for rented housing is growing. Allocations for renovations of properties are based on lifecycle plans and renovation requirement analyses. On 30 June 2011, SATO held a total of 23,176 (22,514) homes, of which 19,074 (18,410) were included in SATO business and 4,102 (4,104) were included in VATRO business. There were 21,889 (21,191) rented homes and 1,287 (1,323) shared ownership apartments. The number of homes increased during the period under review by 346. The book value of the investment properties totalled 1,390.3 (1,268.4) million euros. The fair value of the investment properties totalled 1,798.4 (1,557.8) million euros. During the period under review, the book value of the housing portfolio grew by 84.4 (25.0) million euros and its fair value by (54.8) million euros. The positive difference between the fair value and the book value was (289.4) million euros and it increased during the period under review by 56.7 (29.8) million euros. The differential increased largely due to the effect of the trend in housing rents and prices, and the yield requirement has also been reviewed due to market conditions. In its accounting, SATO applies the historical cost method to investment properties. The change in differential of fair value and book value of investment properties is not posted to the profit and loss account but is stated in a note to the financial statements. INVESTMENTS Investment business lays the foundations for growth. In the past decade, SATO has invested a total of more than a billion euros in rented housing. SATO acquires and commissions the construction of both whole rental properties and individual rented apartments. During the period under review, the Group s gross investments in investment properties were (53.8) million euros. The Group acquired 121 (201) newly built rented homes and 445 (123) previously built homes. The main acquisition was a total of 383 homes in Helsinki, Turku and Oulu acquired from the OP-Pohjola Group for a total purchase price of 60 million euros. Of the investments, 6.6 (5.4) million euros was allocated to renovations. RENTAL BUSINESS Rental business secures a steady trend in cash flow. Rental services are mostly handled by SATO s renting offices. The key indicators for rental business held at an excellent level during the period under review. The financial occupancy rate of the homes averaged 97.9 (97.8) per cent and tenant turnover was 31.2 (28.3) per cent. SATO has consolidated its rental housing in regions with growing demand, which creates a basis for a high rental occupancy rate. The average monthly rent per square metre during the period under review was EUR (12.10) for rental housing and 8.87 (9.11) for shared ownership apartments. The net rental income on the housing portfolio was 53.9 (51.0) million euros. The net rental income annualised on the book value of rental housing was 8.0 (8.1) per cent and 6.3 (6.4) on the fair value. PROPERTY DEVELOPMENT Property development is used to create a basis for investment in SATO s new rented homes and for the development of owner-occupied homes. The attractiveness of the rented homes held is improved and their value is developed by means of renovation. The book value of the building land inventory held at the end of the period under review was 77.2 (64.1) million euros. The value of acquisitions of plots of land during the period under review was 4.3 (0.6) million euros. Plots valued at 4.6 (3.0) million euros were transferred to production. During the period under review 121 (0) rented homes commissioned by SATO were completed and on 30 June 490 (338) homes were under construction. Of these, 423 are being built in the Helsinki Metropolitan Area with interest-subsidised financing on the so-called interim model. During the period under review a total of 13.4 (13.9) million euros was used for renovations of investment properties. A further
5 3 6.6 (5.4) million euros in all of renovation costs was capitalised. During the period under review 23 (31) owner-occupied homes were completed and the construction of 201 (75) was started. There were 367 (157) owner-occupied homes under construction at the end of the period under review. SALES Through divestments of rented housing, SATO carries out its strategic aim to consolidate its investment properties in the five largest urban growth centres in Finland and in St. Petersburg. Sales of new owner-occupied homes are mostly handled as an in-house operation. During the period under review, the Group s holdings of rental housing were divested to the tune of 14.0 (28.3) million euros. A total of 105 (46) new owner-occupied homes were sold at a value of 20.8 (12.3) million euros. Left unsold at the end of the period under review were 236 (74) owneroccupied homes under construction and 4 (3) completed ones. Sales of plots of land totalled 5.9 (3.7) million euros. BUSINESS IN ST. PETERSBURG The housing market in St. Petersburg is equivalent in volume to the entire Finnish housing market. SATO carries out its growth strategy by investing in rented homes in St. Petersburg. Properties are acquired in central locations in the city. The book value of investments in St. Petersburg as at 30 June totalled 66.5 (55.9) million euros. At the end of June, SATO had a total of 93 (51) completed apartments and 85 (61) under construction in St. Petersburg. SATO s investments are new elite and business-class homes, and the apartments are mostly rented in furnished form. The renting is done by the company s own personnel at the regional office in St. Petersburg. PERSONNEL At the end of the period under review, the Group had 142 (129) employees and during the period under review it had an average of 136 (130) employees. RISKS AND UNCERTAINTY FACTORS IN THE NEAR FUTURE General economic uncertainty has increased since the end of the period under review, which may be reflected in the housing and financial markets. The change in the market prices of housing will have an impact on the value of SATO s housing portfolio. A favourable trend in the value of the housing portfolio and the rental attractiveness of the apartments will be secured by concentrating on the urban centres of growth. New owner-occupied housing projects will be launched on the basis of project-specific market surveys. The risks of investment in housing business in St. Petersburg are related to the trend in market prices for housing, currency fluctuations, and changes in the business climate. The amount of investment in St. Petersburg is limited in proportion to the Group s investments in housing as a whole. Changes in interest rates affect SATO s profit through changes in interest expenses and through changes in the market value of interest rate hedging. In line with the Group s financing policy, per cent of the market-rate loans interest positions are hedged. The adequacy of financing is monitored on an ongoing basis by liquidity forecasting. Lawsuits and countersuits between the contracting parties are pending in respect of the implementation and invoicing for the construction project known as Asunto Oy Helsingin Tila. A broader description of the risks can be found in the Group s annual report for the year 2010 and on the website OUTLOOK The trend in the Finnish economy was better than forecast in the early months of the year, but uncertainty about the economic trend has increased recently. This makes interest rates less predictable. Increased construction of rented housing is boosting supply in SATO s business areas, but demand for rented housing is expected to remain good. SATO s net rental income is forecast to improve. The prospects for the investments in rented housing in line with the strategy are seen as good in SATO s business areas, including St. Petersburg. Consumers confidence in their own economic trend was at a favourable level, but it deteriorated in comparison with the average level. SATO will continue to start owner-occupied housing projects if demand for owner-occupied housing holds at the current level. The consolidated profit before taxes for 2011 will be an improvement on last year s figure. Shareholders in SATO Corporation, 28 July 2011 The biggest shareholders and their holdings (per cent) Varma Mutual Pension Insurance Company 39.3 Ilmarinen Mutual Pension Insurance Company 16.0 Suomi Mutual Life Assurance Company 14.8 Tapiola Insurance Group 7.3 Pension Fennia Mutual Insurance Company 5.4 Tapiola Mutual Pension Insurance Company 5.1 Wärtsilä Corporation 3.9 Pohjola Insurance Ltd 2.7 Notalar Oy 2.0 Others 3.5 On 28 July 2011, the total number of SATO shares was 51,001,842 and there were 30 shareholders entered in the book-entry securities register.

6 4 figures


7 5 Information on segments SATO s investment in housing business includes both privately financed and state-subsidised housing property, of which the latter is affected by restrictions set by housing legislation both at the company level and for individual properties. SATO s housing investments are divided into two segments for purposes of financial reporting, SATO business and VATRO business. SATO business includes privately financed homes as well as those state-subsidised and interest-subsidised homes to which property-specific restrictions under legislation on state-subsidised and interest-subsidised loans will end in the period The construction of owner-occupied housing and business operations in St. Petersburg are also included in SATO business. The VATRO business segment includes housing subject to longer-term, property-specific restrictions under legislation on state-subsidised loans. These restrictions will end by roughly the year SATO VATRO SATO VATRO business business Total business business Total MEUR 1-6/ / / / / /2010 Turnover Net rental income Profit before taxes Gross investments in investment properties Book value of the investment properties 1, , , ,268.4 Fair value of the investment properties 1, , , ,557.8 Rented homes (number) 17,787 4,102 21,889 17,087 4,104 21,191 Shared ownership apartments (number) 1, ,287 1, ,323 Completed owner-occupied homes (number)
8 6 Consolidated comprehensive profit and loss account, IFRS 1 April- 1 April- 1 Jan.- 1 Jan.- 1 Jan.- MEUR 30 June June June June Dec.2010 TURNOVER Capital gains/losses on Investment Properties Share of profit in associated companies Other income from business operations Consumption of materials and services Personnel expenses Depreciation, amortization and impairment charges Losses from disposals of Investment Properties Other expenses of business operations OPERATING PROFIT Financial income Financial expenses PROFIT BEFORE TAXES Income taxes PROFIT FOR THE PERIOD OTHER COMPREHENSIVE INCOME ITEMS Cash flow hedges Financial assets available for sale Translation difference Taxes applied to other comprehensive income items Other comprehensive income items for the accounting period after taxes COMPREHENSIVE INCOME FOR THE ACCOUNTING PERIOD, TOTAL Distribution of net profit for financial period To the owners of the parent company To the shareholders without a controlling interest Distribution of comprehensive income To the owners of the parent company To the shareholders without a controlling interest Profit per share calculated on the profit due to the owners of the parent enterprise Earnings per share, Average number of shares, million
9 7 Consolidated balance sheet, IFRS MEUR 30 June June Dec ASSETS Non-current assets Investment Property 1, , ,305.9 Tangible assets Intangible assets Holdings in joint ventures and associated companies Financial assets available for sale Receivables Deferred tax receivables , , ,339.6 Current assets Inventories Accounts receivable and other receivables Tax credits based on the taxable income for the period Cash and cash equivalents ASSETS, TOTAL 1, , ,471.8 SHAREHOLDERS EQUITY AND LIABILITIES Shareholders equity due to the parent company s owners Share capital Fair value reserve Reserve fund Other funds Retained earnings Proportion of shareholders without a controlling interest SHAREHOLDERS EQUITY, TOTAL LIABILITIES Non-current liabilities Deferred tax liabilities Provisions Interest-bearing debt 1, , Current liabilities Accounts payable and other liabilities Income tax liabilities Interest-bearing debt LIABILITIES, TOTAL 1, , ,197.6 SHAREHOLDERS EQUITY AND LIABILITIES. TOTAL 1, , ,471.8
10 8 Consolidated cash flow statement, IFRS 1 Jan. - 1 Jan. - 1 Jan. - MEUR 30 June June Dec Cash flow from operating activities Net profit for period Adjustments: Business activities not involving payment Proceeds from sales of fixed assets Interest expenses and other financial expenses Interest income Dividend income Taxes Cash flow before change in working capital Change in working capital: Change in accounts receivable and other receivables Change in inventories Change in accounts payable and other liabilities Change in reserves Interest paid Interest received Taxes paid Net cash flow from operating activities Cash flow from investing activities Acquisition of subsidiaries less cash and cash equivalents at time of acquisition Sale of subsidiaries less cash and cash equivalents at time of sale Investments in tangible assets Investments in intangible assets Repayments of notes receivable Loans granted Sales of tangible assets Net cash flow from investing activities Cash flow from financing activities Payments received from share issues Repayments (-) / withdrawals (+) of short-term loans Withdrawals of long-term loans Repayments of long-term loans Payments of financial leasing liabilities Dividends paid Net cash flow from financing activities Change in cash and cash equivalents Cash and cash equivalents at the beginning of the period Cash and cash equivalents at the end of the period
11 9 Calculation of changes in Group shareholders equity, 1 Jan. 30 June 2011 Shareholders equity due to the parent company s owners Shareholders Sharewithout a holders controlling equity, Share Revalua- Reserve Other Retained interest total MEUR capital tion fund fund funds profits Total Shareholders equity 1 Jan Comprehensive income for the accounting period, total Dividend payment Share issue Other adjustments Shareholders equity 30 June Calculation of changes in Group shareholders equity, 1 Jan. 30 June 2010 Shareholders equity due to the parent company s owners Shareholders Sharewithout a holders controlling equity, Share Revalua- Reserve Other Retained interest total MEUR capital tion fund fund funds profits Total Shareholders equity 1 Jan Comprehensive income for the accounting period, total Dividend payment Share issue Other adjustments Shareholders equity 30 June
12 10 NOTES TO THE INTERIM REPORT SATO s interim report for the period 1 Jan.-30 June 2011 has been drawn up in compliance with on the IAS 34 Interim Report Standard as approved for use by the EU. The interim report is unaudited. The same accounting conventions were applied in the production of the interim report as in the IFRS consolidated financial statements for the financial year 1 Jan.-31 Dec SATO s operations are managed and monitored in the form of two business areas, namely SATO business and VATRO business. The division into segments is done on the same principle. SATO business includes privately financed investment homes as well as those state-subsidised and interest-subsidised homes to which property-specific restrictions end mostly by 2016, although for some properties they will continue until Construction of owner-occupied housing and investment in housing in St. Petersburg are also included in SATO business. VATRO business includes housing subject to longerterm property-specific restrictions under legislation on state-subsidised loans. These restrictions will end by the year The earnings and expenses shown for the segments are the direct earnings and expenses due to the segments plus those earnings and expenses which are reasonably attributable to the segments. Within SATO, the segments earnings and expenses are also taken to include financial income and expenses, as these are considered to be such a crucial factor in forming the net profit of the segment that leaving them out would not give a fair view of the segments net profit. The assets and liabilities of a segment are such business items as the segment uses in its business operations or are reasonably attributable to the segments. All items are included in the segments assets and liabilities which give rise to items in the profit and loss account which are shown into the segments net profits, including the segments liabilities which are deemed to constitute an important part in describing the segments financial position. The unallocated assets include deferred tax credits as well as the Group s common items. The unallocated debts are comprised mainly of deferred tax liabilities. Investments are comprised of increases in investment properties, tangible fixed assets, and intangible assets which are used in more than one financial year. Pricing between segments is done at appropriate market rate. Calculation of net rental income The net rental income of investment properties is obtained by deducting from the rental income the maintenance expenses, which include annual repair expenses. In calculating the net rental income, the part of the Group s fixed expenses which concerns the maintenance of the investment properties is added to the maintenance expenses. 1. Segment information 1 Jan. 30 June 2011 SATO VATRO SATO Group, MEUR business business Eliminations total External turnover Internal turnover Turnover, total Profits/losses from divestments of Investment Properties Depreciation, amortizations and impairment charges Operating profit Interest income Interest expenses Profit before taxes Net rental income on the housing portfolio Net rental income of rented homes, % of book value (%) Investments Acquisition of land for inventory Depreciation and amortization Impairment charges 0.0 Assets and eliminations allocated to segments, total 1, ,571.4 Investment Properties 1, ,390.3 Cash and cash equivalents Other assets of the segment Holding in joint venture and associated companies Unallocated assets 5.7 Assets, total 1,577.1 Liabilities and eliminations allocated to segments, total 1, ,224.1 Interest-bearing debt ,162.2 Other liabilities of segment Unallocated liabilities 72.9 Liabilities, total 1,297.1
13 11 Segment information 1 Jan. 30 June 2010 SATO VATRO SATO Group, MEUR business business Eliminations total External turnover Internal turnover Turnover, total Profits/losses from divestments of Investment Properties Depreciation, amortizations and impairment charges Operating profit Interest income Interest expenses Profit before taxes Net rental income on the housing portfolio Net rental income of rented homes, % of book value (%) Investments Acquisition of land for inventory Depreciation and amortization Impairment charges Assets and eliminations allocated to segments, total 1, ,400.9 Investment Properties 1, ,268.4 Cash and cash equivalents Other assets of the segment Holding in joint venture and associated companies Unallocated assets 20.6 Assets, total 1,421.5 Liabilities and eliminations allocated to segments, total ,093.9 Interest-bearing debt ,032.2 Other liabilities of segment Unallocated liabilities 71.3 Liabilities, total 1,165.2 Segment information 1 Jan. 31 Dec SATO VATRO SATO Group, MEUR business business Eliminations total External turnover Internal turnover Turnover, total Profits/losses from divestments of Investment Properties Depreciation, amortizations and impairment charges Operating profit Interest income Interest expenses Profit before taxes Net rental income on the housing portfolio Net rental income of rented homes, % of book value (%) Investments Acquisition of land for inventory Depreciation and amortization Impairment charges Assets and eliminations allocated to segments, total 1, ,449.6 Investment Properties 1, ,305.9 Cash and cash equivalents Other assets of the segment Holding in joint venture and associated companies Unallocated assets 22.2 Assets, total 1,471.8 Liabilities and eliminations allocated to segments, total ,127.3 Interest-bearing debt ,067.9 Other liabilities of segment Unallocated liabilities 70.3 Liabilities, total 1,197.6
14 12 2. Investment properties MEUR 30 June June Dec Acquisition cost, 1 Jan. 1, , ,341.8 Additions; new properties Additions; additional investments Decreases Reclassifications Acquisition cost, total 1, , ,423.0 Accumulated depreciation and write-downs, 1 Jan Depreciation Accumulated depreciation and write-downs, total Book value 1, , ,305.9 Fair value 1, , ,657.3 Difference between fair and book value Change in difference in value The value differential increased, largely due to the effect of the trend in housing rents and prices, and the yield requirement has also been reviewed due to market conditions. An external assessor has given a statement on the fair value of SATO s investment properties as at 30 June SATO has chosen for its accounting processing method the historical cost method as per the IAS 40 Investment Properties standard. Investment properties are booked at the original historical cost, which includes transaction costs. Later they are valued at the original historical cost less accumulated depreciation and impairments. The fair values of the investment properties to be shown as notes are determined as a result of the company s own appraisal at the time of preparing the financial statements. At the time the interim financial statements are prepared, the fair values are updated in respect of investments, surrenders and changes in limitation periods. Also, an external specialist makes a statement on the appraisal. 3. Tangible assets MEUR 30 June June Dec Book value at start of period Increases Decreases Depreciation for accounting period Book value at end of period Inventories MEUR 30 June June Dec Housing under construction Completed housing units and commercial space Land areas and land area companies Other inventories Total Notes on shareholders equity Number Invested of shares Share Reserve distributable MEUR (1,000) capital fund equity fund Total Precision calculation of the number of shares: 1 Jan , June ,
15 6. Financial liabilities During the period under review, long-term foreign currency loans in the amount of SEK 1,053.4 million have been taken for so-called owner companies. The currency risk arising from these loans has been hedged to the full amount with interest rate and currency swaps. The hedging covers the currency risk both of interest payments and of repayments of principal. The euro counter-value of the currency loans at the time of the withdrawal of the loan was million euros. The contingent liabilities on shares in housing companies have increased by 29.1 million euros, mostly on the basis of investments during the financial period. For purposes of short-term financing, SATO has the use of a commercial paper programme 100 million euros, committed short-term credit limits 130 million euros and a non-committed current limit 5 million euros. On 30 June 2011, the commercial paper issued amounted to 61.8 million euros Derivatives MEUR 30 June June Dec Interest rate derivatives Interest rate derivatives, par value, of which included in calculation of hedging Interest rate derivatives, fair value, of which included in calculation of hedging Interest and currency swaps, par value Interest and currency swaps, fair value Currency derivatives Forward rate agreements, par value, of which included in calculation of hedging Forward rate agreements, fair value, of which included in calculation of hedging Currency derivatives are used to hedge purchase contracts denominated in foreign currency. 8. Collateral and contingency commitments MEUR 30 June June Dec Debts for which mortgages and pledges have been given as collateral Market loans Mortgages provided Book value of pledged shares Value of corporate mortgages pledged Value of deposits pledged State-subsidised ARAVA loans Mortgages provided Book value of pledged shares Interest-subsidised loans Mortgages provided Book value of pledged shares Debts of housing and mutual property holding companies, secured by mortgages on properties Loans from financial institutions Mortgages provided Other commitments Guarantees Guarantee pledges for others Owner-occupier home purchase commitments Rs-guarantees Mortgages provided to secure payment of rent and street maintenance Property mortgages provided Binding purchase agreements For acquisitions of investment properties Pledges for land use payments on zoned plots Letters of intent on land for which there is a zoning condition
16 14 Within SATO, housing companies which hold so-called owner-occupied apartment are treated for the special purpose as units established for a fixed period, which are not included in the consolidation. The combined total for loans of such housing companies, which are included in shared ownership systems, was MEUR 96.8 on 30 June 2011 (MEUR 99.9 on 30 June 2010). 9. Related party events The Group s related parties are comprised of the parent company, SATO Corporation, and the subsidiaries and associated companies. The owners are also counted as related parties when they have direct or indirect influence, meaning those owners whose holding in SATO is 20% or more are always related parties. When ownership falls below 20%, an owner is considered a related party when he has considerable influence in other ways, for example, through a seat on the Board of Directors. In 2009 and 2010 the shareholders included in related parties were Varma Mutual Pension Insurance Company, Ilmarinen Mutual Pension Insurance Company, Suomi Mutual Life Assurance Company and Wärtsilä Corporation. Related parties are also taken to include the members of the Board of Directors and Corporate Management Groups, including the President and CEO as well as the families of the members of the Board of Directors and Corporate Management Group and the President and CEO, and companies managed by these. The Group s Corporate Management Group is comprised of SATO Corporation s President and CEO; the Vice President for the Helsinki Region and St. Petersburg; the Vice President for the Regions; the Director, Marketing and Communications; and the Chief Financial Officer. The following transactions were effected with related parties: MEUR 30 June June Dec Open balances with shareholders Receivables Debts The terms applied in business with related parties were equal to the terms complied with in business dealings between independent parties. MEUR 30 June June Dec Management perquisites Salaries and other short-term perquisites Other long-term perquisites Total
17 Key indicators 30 June June Dec Return on investment, % Return on equity, % Equity ratio, % Equity ratio, % SATO business Equity ratio, % SATO business at fair values Earnings per share, Net worth per share, - at book values at fair values Number of shares, million * Average number of shares, million Gross investments, MEUR Personnel, average *) The 160,000 shares held by the Group have been deducted from the number of shares. 11. Formulas for key indicators Return on investment, % = (Profit or loss before taxes + interest expense and other financing expenses) x 100 Balance sheet total - non-interest-bearing debts (average during the financial year) Return on equity, % = Equity ratio, % = Earnings per share, = Net worth per share, = (Profit or loss after taxes) x 100 Shareholders equity (average during the financial year) Shareholders equity x 100 Balance sheet total - advances received Net profit for year due to owners of parent company Adjusted number of shares (average during the financial year) (Net worth at balance sheet value - liabilities) x 100 Adjusted number of shares at year-end
18 16 SATO is one of Finland s leading corporate investors in housing. SATO owns a total of some 23,000 rentable homes in Finland s largest centres of urban growth and St. Petersburg. Its investment assets have a fair value of roughly 1.8 billion euros. SATO has set the goal of being the most efficient and progressive player in the market, which facilitates the constant improvement of customer services as well as generating added value for its shareholders. SATO s value proposition: a home the way you want it
19 SATO Corporation Panuntie 4, PO Box 401, FI Helsinki, Finland Tel
SATO Interim report
 SATO Interim report 1.1.-30.6.2008 SATO Interim report 1.1. 30.6.2008 Summary of the period 1-6/2008 (1-6/2007) The Group s turnover was 125.8 (129.7) million euros and operating profit was 36.8 (32.2)
SATO Interim report
 SATO Interim report 1.1.-30.9.2008 SATO Interim report 1.1. 30.9.2008 Summary of the period 1-9/2008 (1-9/2007) The Group s turnover was 183.4 million euros (191.7) and operating profit was 54.8 (50.3)
INTERIM REPORT 1 JANUARY 30 SEPTEMBER SATO s profitable growth continued
 INTERIM REPORT 1 JANUARY 30 SEPTEMBER SATO s profitable growth continued Contents Strategy... 4 SATO Corporation Interim report 1 Jan - 30 Sep... 5 The business climate... 5 President and CEO Erkka Valkila...
SATO Interim report
 Interim report 1.1. 30.9.2007 SATO Interim report 1.1. 30.9.2007 Summary of the period 1-9/2007 (1-9/2006) The Group s turnover was 201.5 (213.6) million euros. Profit before taxes was 27.5 (32.9) million
SATO Interim report
 Interim report 1.1. 30.6.2007 SATO Interim report 1.1. 30.6.2007 Summary of the period 1-6/2007 the Group s turnover was 140.5 (1.1. 30.6.2006: 152.8) million euros profit before taxes was 18.7 (24.8)
There s no place like home. #customerfirst #homeswithcustomerservice #myhomeisthebesthome
 There s no place like home #customerfirst #homeswithcustomerservice #myhomeisthebesthome Q1 INTERIM REPORT 1.1. 31.3.2017 CONTENTS KEY FIGURES... 3 STRATEGY... 4 SATO CORPORATION S INTERIM REPORT 1 JAN
Combating the black economy seen as paramount at VVO
 Interim Report 1 January - 31 March 2012 Combating the black economy seen as paramount at VVO The black economy is one of the greatest challenges in the real estate and construction sector. At VVO, combating
Sato we provide good housing.
 Contents Sato we provide good housing 4 Vision, values and strategy 6 Review by the President and CEO 8 Description of the business climate 10 Investment in housing 14 Housing development and construction
VIKING LINE'S INTERIM REPORT FOR THE PERIOD JANUARY - JUNE 2015
 1 of 11 21/8/ 10:40 µµ Source: Viking Line August 20, 02:00 ET VIKING LINE'S INTERIM REPORT FOR THE PERIOD JANUARY - JUNE Mariehamn, -08-20 08:00 CEST (GLOBE NEWSWIRE) -- Viking Line Abp INTERIM REPORT
Interim Report 1 January 31 March 2005
 > Profit before taxes amounted to EUR 7.8 million (EUR 7.4 million) > Turnover totalled EUR 21.2 million (EUR 21.0 million) > Earnings per share were EUR 0.05 (EUR 0.08) > Demand and occupancy rates for
HALF-YEAR REVIEW JANUARY-JUNE 2018
 HALF-YEAR REVIEW JANUARY-JUNE 2018 1-6/2018 (1-6/2017) Total revenue 8,1 M (5,3 M ) 10 8 6 4 2 0 1-6/2017 1-6/2018 Value of investment properties 301,6 M (205,1 M ) Occupancy rate 100 % Value of portfolio
Continuously improved performance in Stockmann Retail and Real Estate Group s operating result negatively impacted by Lindex
 Interim report Q3 2017 2 STOCKMANN S INTERIM REPORT Q3 2017 STOCKMANN plc, Interim report 27.10.2017 at 8:00 EET Continuously improved performance in Stockmann Retail and Real Estate Group s operating
Interim Report 1 January 30 June 2012
 Interim Report 1 January 30 June 2012 The Finnvera Group s Interim Report for January June 2012 Demand for financing continued to focus on exports and working capital During January June, demand for export
Previously Scanfil estimated that its turnover for 2018 will be EUR million and the operating profit will amount to EUR million.
 Interim Report 1-9/2018 Scanfil Group s Interim Report January September 2018 July September 2018: Stabilizing growth. July September 2018 - Turnover totalled to EUR 131.5 million (Q3 2017: 130.8) - Operating
IFRS. Lifetime Performance. Financial information for 2004 according to IFRS standards
 IFRS Lifetime Performance Financial information for 2004 according to IFRS standards Wärtsilä s financial information for 2004 according to IFRS standards Wärtsilä Corporation has adopted the International
INTERIM REPORT FOR THE PERIOD JANUARY SEPTEMBER 2015
 PRESS RELEASE INTERIM REPORT FOR THE PERIOD JANUARY SEPTEMBER 2015 CONTINUED EARNINGS IMPROVEMENT FOR VIKING LINE Consolidated sales of the Viking Line Group during the period, January 1 September 30,
FINANCIAL STATEMENTS
 FINANCIAL STATEMENTS 2016 CONTENTS Report of the Board of Directors Consolidated income statement, IFRS Consolidated statement of financial position, IFRS Consolidated statement of cash flows, IFRS Consolidated
SCANFIL GROUP S FINANCIAL STATEMENTS FOR 1 JANUARY 31 DECEMBER 2014
 24 FEBRUARY 2015 10.15 A.M. SCANFIL GROUP S FINANCIAL STATEMENTS FOR 1 JANUARY 31 DECEMBER 2014 October December - Turnover totalled EUR 49.6 million (Q4 2013: 45.4), up 9.3% - Operating profit EUR 3.3
Good revenue growth continued; Q3 operating profit somewhat down on Q3 2010
 STOCKMANN GROUP S INTERIM REPORT Q3/2011 Stockmann Group, Interim report 1 January - 30 September 2011 Good revenue growth continued; Q3 operating profit somewhat down on Q3 2010 July - September 2011:
New strategy well under way, operating profit up in the second quarter
 Interim Report Q2 2015 2 STOCKMANN S INTERIM REPORT Q2 2015 STOCKMANN plc, Interim Report 29.4.2015 at 8.00 EET New strategy well under way, operating profit up in the second quarter April-June 2015: Consolidated
Scanfil Plc Financial Report
 Scanfil Plc Financial Report 1 12/2018 Scanfil Group s Financial Statements for 1 January 31 December 2018 Year 2018: Strong growth and profitability development October December 2018 Turnover totalled
SCANFIL GROUP S INTERIM REPORT 1 JANUARY 30 SEPTEMBER 2015
 SCANFIL GROUP S INTERIM REPORT 1 JANUARY 30 SEPTEMBER 2015 28 OCTOBER 2015 9.50 A.M. July September - Turnover totalled EUR 135.8 million (Q3 2014: 56.7), up to 140.0% - Operating profit EUR 5.2 million
Financial Statements Release 1 January 31 December 2017
 THE MORTGAGE SOCIETY OF FINLAND Financial Statements Release 1 January 31 December 2017 The Audited Financial Statements 2017 will be published on 1 March 2018 and The Annual Report during the week 12
Financial Statements Release 1 January 31 December 2016
 THE MORTGAGE SOCIETY OF FINLAND Financial Statements Release 1 January 31 December 2016 The Audited Financial Statements 2016 will be released on 1 March 2017 The 2016 Annual Report will be published on
Notes to the consolidated financial statements
 Notes to the consolidated financial statements Basic information on the company Elisa Corporation ( Elisa or the Group ) engages in telecommunications activities, providing data communications services
Interim Report 1 January 30 September 2013
 Interim Report 1 January 30 September 2013 Board of Directors 31 October 2013 1 VAPO OY INTERIM REPORT 1 JANUARY 30 SEPTEMBER 2013 July-September Group turnover in the July-September period was EUR 107.9
Contents. Financial Statements. Annual Report Consolidated Income Statement. Consolidated Balance Sheet. Consolidated Cash Flow Statement
 Annual Report 2015 Contents Financial Statements Consolidated Income Statement Consolidated Balance Sheet Consolidated Cash Flow Statement Changes in Shareholders' Equity Basic Information on the Group
Func Food Group Financial Release / Q2 2017
 Func Food Group Financial Release / Q2 2017 Func Food Group Financial Release / Q2 2017 Func Food Group / Q2 2017 3 FUNC FOOD GROUP IN BRIEF Func Food Group ( FFG ) is a Nordic wellness company, which
HALF-YEAR FINANCIAL REPORT FOR THE PERIOD JANUARY JUNE 2018
 PRESS RELEASE HALF-YEAR FINANCIAL REPORT FOR THE PERIOD JANUARY JUNE 2018 IMPROVED INCOME DESPITE LOWER SALES Consolidated sales of the Viking Line Group for the period January 1 June 30, 2018 were 225.7
Martela Oyj Interim Report
 Martela Oyj Interim Report 1.1 3.6 27 Turnover MEUR 42, 36, 3, 24, 18, 12, 6,, 3Q 25 4Q 25 1Q 2Q 3Q 4Q 1Q 27 2Q 27 Turnover 25, 29,3 26,9 27,2 28,8 36,8 29,9 3,4 Invoicing by market area MEUR 3 25 2 15
CONTAINERSHIPS GROUP HALF-YEAR REPORT JANUARY-JUNE Business identification code: Domicile: Espoo
 HALF-YEAR REPORT JANUARY-JUNE 2018 Business identification code: 0818358-5 Domicile: Espoo 1 of 15 Containerships plc s half year report H1/2018 H1/2018: Net Sales up almost 15% and Net Profit up EUR 1.7
Municipality Finance Plc Financial Statements Bulletin
 14 February 2018, at 4:00 p.m. Municipality Finance Plc Financial Statements Bulletin 1 JANUARY 31 DECEMBER 2017 2017 in Brief The Group s net interest income grew by 10.9% year-on-year, totalling EUR
Scanfil Group s Financial Statements for 1 January 31 December 2017
 Financial Statements Release 1-12/2017 Scanfil Group s Financial Statements for 1 January 31 December 2017 Year 2017: Strong operating margin benefitted from increased sales and lighter cost structure
FINANCIAL STATEMENTS Q4 2018
 28/02/2019 Key Figures Issuer Sunborn Finance Oyj 1 Oct - 31 1 Jan 31 Dec Dec 2018 2018 Rental income 834 3 338 EBITDA 745 2 833 Investment Property(Spa Hotels) 63 500 Total Equity 7 676 Borrowings 48
Interim Report for January June 2009
 1 (7) Interim Report for January June 2009 Market overview The global economic downturn has significantly decreased the demand for Itella s services. In Finland, the logistic and mail volumes saw a sharp
THE MORTGAGE SOCIETY OF FINLAND
 THE MORTGAGE SOCIETY OF FINLAND FINANCIAL STATEMENTS 2016 156 th operational year TABLE OF CONTENTS BOARD OF DIRECTOR S REPORT... 3 OPERATING ENVIRONMENT... 3 ASSETS AND FUNDING... 4 Liquidity... 4 Other
Financial statements bulletin
 Qt Group Plc Stock Exchange Release, 16 Feb 2018 at 8:00 a.m. Financial statements bulletin 1 January 31 December 2017 Fourth quarter: Net sales increased by 14.3 per cent Fiscal year 2017 Net sales increased
INTERIM REPORT FOR THE PERIOD JANUARY SEPTEMBER 2014 SALES AND EARNINGS DECREASED SOMEWHAT IN SPITE OF HIGHER PASSENGER AND CARGO VOLUMES
 Press release INTERIM REPORT FOR THE PERIOD JANUARY SEPTEMBER 2014 SALES AND EARNINGS DECREASED SOMEWHAT IN SPITE OF HIGHER PASSENGER AND CARGO VOLUMES The number of passengers on Viking Line s vessels
Financial Statements Release 2018
 14 February 2019 Jani Nieminen, CEO Erik Hjelt, CFO Financial Statements Release 2018 Kojamo plc Agenda Summary of year 2018 Financial development Outlook, financial targets and dividend policy Lauri Korpisen
March 31, 2004 Table of contents
 March 31, 2004 Table of contents Managing Director s review page 2 Lending page 3 Funding page 3 Risk management page 4 Capital adequacy and own funds page 4 Credit ratings page 4 Operating result page
Group Key figures (IFRS), MEUR 4-6/ / / / /2016
, MEUR 4-6/ / / / /2016") 1 (9) Destia s Half year financial report January June 2017 DESTIA S OPERATING RESULT CONTINUES TO DEVELOP FAVOURABLY Revenue was MEUR 191.9 (200.1). The operating result improved year-on-year, to MEUR
1 (9) Destia s Half year financial report January June 2017 DESTIA S OPERATING RESULT CONTINUES TO DEVELOP FAVOURABLY Revenue was MEUR 191.9 (200.1). The operating result improved year-on-year, to MEUR
OKO BANK PLC INTERIM REPORT 1 APRIL 30 JUNE 2007 WITH PRESIDENT AND CEO'S COMMENTS
 OKO BANK PLC Company Release 9 August 2007 at 8.00 am OKO BANK PLC INTERIM REPORT 1 APRIL 30 JUNE 2007 WITH PRESIDENT AND CEO'S COMMENTS President and CEO's comments: "In the second quarter, consolidated
RAKENTAJAIN KONEVUOKRAAMO OYJ'S INTERIM REPORT 1-9/2004
 10.11.2004 10:30 RAKENTAJAIN KONEVUOKRAAMO OYJ'S INTERIM REPORT 1-9/2004 RAKENTAJAIN KONEVUOKRAAMO OYJ'S INTERIM REPORT 1-9/2004 - Turnover for Q3/2004: EUR 21.3 million (15.5) - Profit before extraordinary
INTERIM REPORT FOR THE PERIOD JANUARY JUNE 2012 VIKING LINE S SALES INCREASED SOMEWHAT BUT FUEL EXPENSES LOWERED ITS EARNINGS
 Press release INTERIM REPORT FOR THE PERIOD JANUARY JUNE 2012 VIKING LINE S SALES INCREASED SOMEWHAT BUT FUEL EXPENSES LOWERED ITS EARNINGS Consolidated sales of the Viking Line Group during the period
FORTH PORTS PLC ADOPTION OF INTERNATIONAL FINANCIAL REPORTING STANDARDS
 FORTH PORTS PLC ADOPTION OF INTERNATIONAL FINANCIAL REPORTING STANDARDS Forth Ports PLC is adopting International Financial Reporting Standards ("IFRS") with effect from 1st January 2005. It is today publishing
Notes to the consolidated financial statements
 Notes to the consolidated financial statements Accounting policies Basic information VVO is a housing service. The housing rental service uses privately financed and state- housing stock. The s parent
ELISA STOCK EXCHANGE RELEASE 24 OCTOBER 2008 AT 8.30 am ELISA S INTERIM REPORT JANUARY-SEPTEMBER
 ELISA STOCK EXCHANGE RELEASE 24 OCTOBER 2008 AT 8.30 am ELISA S INTERIM REPORT JANUARY-SEPTEMBER Third quarter 2008 Revenue was EUR 374 million (394) EBITDA was EUR 129 million (132), EBIT EUR 77 million
Lemminkäinen Interim Report 1 January 30 June 2013:
 Lemminkäinen Interim Report 1 January 30 June 2013: Profitability challenges especially in international operations; Lemminkäinen to cut costs by EUR 30 million. Lemminkäinen Interim Report 1 Jan 30 June
Interim Report 24 October 2013 at 9:00 a.m.
 s interim report 3/2013 (1 January 30 September 2013) Key points of the interim report Turnover in July September increased by 7.2% and stood at EUR 34.0 million (31.7). In January September, turnover
Municipality Finance Plc Financial Statements Bulletin
 9 February 2016 at 2 p.m. Municipality Finance Plc Financial Statements Bulletin 1 January 31 December 2015 2015 in Brief: The Group s net operating profit amounted to EUR 151.8 million (2014: EUR 144.2
Func Food Group Financial Release / Q1 2018
 Func Food Group Financial Release / Q1 2018 Func Food Group Financial Release / Q1 2018 Func Food Group / Q1 2018 3 FUNC FOOD GROUP IN BRIEF Func Food Group ( FFG ) is a Nordic wellness company, which
Half Year Financial Report
 2018 MARTELA CORPORATION HALF YEAR FINANCIAL REPORT 1 JANUARY 30 JUNE 2018 Half Year Financial Report 1 January 30 June 2018 1 MARTELA CORPORATION S HALF YEAR FINANCIAL REPORT 1 JAN 30 JUNE 2018 The January
SAMPO HOUSING LOAN BANK PLC
 SAMPO HOUSING LOAN BANK PLC ANNUAL REPORT AND ACCOUNTS 2007 SAMPO HOUSING LOAN BANK PLC C O N T E N T S Board of Directors Report 1 Income statement 5 Balance sheet 6 Statement of changes in equity 7 Cash
Interim Report Q2-2013
 Interim Report Q2-2013 1 (16) Tulikivi Corporation Interim report, 1 January - 30 June 2013 8 August 2013, 10.00 a.m - The Tulikivi Group s second-quarter net sales were EUR 10.6 million (EUR 13.2 million,
Sunborn London Oyj HALF YEAR FINANCIAL REPORT 1 January - 30 June 2017
 Sunborn London Oyj HALF YEAR FINANCIAL REPORT 1 January - 30 June 2017 CONTENTS CONTENTS... 2 HALF YEAR REPORT 1 January - 30 June 2017... 3 STATEMENT OF COMPREHENSIVE INCOME... 5 BALANCE SHEET... 6 STATEMENT
Basware expects its net sales and operating profit (EBIT) for 2015 to grow compared to 2014.
 for 2015 to grow compared to 2014.") Interim Report 1 (21) BASWARE INTERIM REPORT JANUARY 1 SEPTEMBER 30, 2015 (IFRS) SUMMARY Revenue developed favourably with key markets growing 95 percent January September 2015: - Net sales EUR 104 200
Interim Report 1 (21) BASWARE INTERIM REPORT JANUARY 1 SEPTEMBER 30, 2015 (IFRS) SUMMARY Revenue developed favourably with key markets growing 95 percent January September 2015: - Net sales EUR 104 200
July-September 2017: Strong operating margin benefitted from increased sales and lighter cost structure
 Interim Report 1-9/2017 Scanfil Group s Interim Report January September 2017 July-September 2017: Strong operating margin benefitted from increased sales and lighter cost structure July September 2017
ORAVA RESIDENTIAL REIT PLC HALF YEAR FINANCIAL REPORT 1 JANUARY 30 JUNE 2018
 ORAVA RESIDENTIAL REIT PLC HALF YEAR FINANCIAL REPORT 1 JANUARY 30 JUNE 2018 1 TABLE OF CONTENTS TABLE OF CONTENTS 2 CEO S COMMENTS: 3 OPERATING ENVIRONMENT 4 Demand in the housing market 4 Supply in the
LEMMINKÄINEN S INTERIM REPORT, 1 JANUARY 30 JUNE
 [1] LEMMINKÄINEN S INTERIM REPORT, 1 JANUARY 30 JUNE 2012: Improvement in comparable earnings for the review period. Strong performance in infrastructure construction in Finland. January-June 2012, compared
Func Food Group Financial Release / Q2 2018
 Func Food Group Financial Release / Q2 2018 Func Food Group Financial Release / Q2 2018 Func Food Group / Q2 2018 3 FUNC FOOD GROUP IN BRIEF Func Food Group ( FFG ) is a Nordic wellness company, which
Nokian Tyres plc Stock exchange bulletin 9 May 2007 at 9:00 a.m.
 Nokian Tyres plc Stock exchange bulletin 9 May 2007 at 9:00 a.m. INTERIM REPORT FOR NOKIAN TYRES PLC JANUARY - MARCH 2007 New products and Russia accelerated growth 1(15) The Group's net sales were up
interim report January 1 March 31, 2011
 Q1 interim report January 1 March 31, 2011 Helsinki, May 5, 2011 Strong first-quarter performance: net sales and operating profit up First quarter 2011 in brief: - Net sales increased 11% to EUR 189.3
Notes to the consolidated financial statements
 Notes to the consolidated financial statements Accounting policies Basic information VVO is a housing service Group. The housing rental service uses privately financed and state-subsidised housing stock.
Interim Report January-June Nordea Bank Finland Plc
 Interim Report January-June 2004 Nordea Bank Finland Plc Interim Report, January-June 2004 Summary The Finnish economy picked up in the first half of 2004. Private consumption growth remained robust underpinned
THE MORTGAGE SOCIETY OF FINLAND
 THE MORTGAGE SOCIETY OF FINLAND FINANCIAL STATEMENTS 2017 157 th operational year TABLE OF CONTENTS BOARD OF DIRECTORS REPORT... 3 CONSOLIDATED INCOME STATEMENT, IFRS... 14 CONSOLIDATED COMPREHENSIVE INCOME
Interim Report, January March 2018 BEWi Group AB (publ), org nr
, org nr") Interim Report, January March, org nr 556972-1128 First Quarter, January March Net sales increased by 14% and amounted to KSEK 491,121 (430,981). Adjusted for currency exchange rates, net sales increased
Interim Report, January March, org nr 556972-1128 First Quarter, January March Net sales increased by 14% and amounted to KSEK 491,121 (430,981). Adjusted for currency exchange rates, net sales increased
Atria Plc Interim Report
 Atria Plc Interim Report 1 January 31 March 2017 1/17 INTERIM REPORT OF ATRIA PLC 1 JANUARY 31 MARCH 2017 Atria records growth in net sales in all business areas January March 2017 - Consolidated net sales
FULL YEAR RESULT
 FULL YEAR RESULT 1.1. 31.12.2017 FULL YEAR RESULT 1.1.-31.12.2017 1 Sponda owns, leases and develops business properties in the Helsinki metropolitan area and the largest cities in Finland. Sponda s reporting
Incap Group Half-Year Financial Report January-June (unaudited)
") Incap Group Half-Year Financial Report January-June 2017 (unaudited) 23 August 2017 Incap Corporation Half-year financial report 23 August 2017 at 8.00 a.m. (EEST) INCAP GROUP HALF-YEAR FINANCIAL REPORT
Incap Group Half-Year Financial Report January-June 2017 (unaudited) 23 August 2017 Incap Corporation Half-year financial report 23 August 2017 at 8.00 a.m. (EEST) INCAP GROUP HALF-YEAR FINANCIAL REPORT
A STRONG THIRD QUARTER FOR KOTIPIZZA GROUP, 25.1% GROWTH IN COMPARABLE EBITDA ON THE PREVIOUS YEAR
 KOTIPIZZA GROUP OYJ INTERIM REPORT 1 FEBRUARY 31 OCTOBER 2015 A STRONG THIRD QUARTER FOR KOTIPIZZA GROUP, 25.1% GROWTH IN COMPARABLE EBITDA ON THE PREVIOUS YEAR August-October 2015 (August-October 2014)
SP MORTGAGE BANK PLC HALF-YEAR REPORT
 2017 2017 201 17 SP MORTGAGE BANK PLC HALF-YEAR REPORT 1 JANUARY-30 JUNE 2017 Sp Mortgage Bank Plc's Half-year Report 1 January - 30 June 2017 Table of contents Board of Directors' Report for 1 January
Amer Sports Corporation Interim Report January March 2018
 1 (28) Amer Sports Corporation INTERIM REPORT April 26, 2018 at 1:00 p.m. Amer Sports Corporation Interim Report January March 2018 NET SALES AND EBIT (The comparative figures have been restated in accordance
June 30, 2004 Table of contents
 June 30, 2004 Table of contents Managing Director s review page 2 Lending page 3 Funding page 3 Risk management and internal audit page 3 Capital adequacy and own funds page 4 Credit ratings page 4 Operating
Second Quarter Results 2013
 Second Quarter Results 2013 12 July 2013 ELISA STOCK EXCHANGE RELEASE 12 JULY 2013 AT 8:30am ELISA S INTERIM REPORT JANUARY - JUNE 2013 Second quarter 2013 PPO companies consolidated as of 1 May 2013 Revenue
YEAR-END REPORT JANUARY DECEMBER 2017
 PRESS RELEASE YEAR-END REPORT JANUARY DECEMBER 2017 VIKING LINE S FULL-YEAR RESULTS DETERIORATED SLIGHTLY, BUT FOURTH QUARTER OPERATING INCOME IMPROVED SIGNIFICANTLY Consolidated sales of the Viking Line
Interim Report 1 January 30 June 2018
 THE MORTGAGE SOCIETY OF FINLAND Interim Report 1 January 30 June 2018 The Interim Report for the period of 1 January to 30 September 2018 will be published on 31 October 2018 The Interim Report does not
Half-Year Report. Second quarter: Business proceeded as planned, full-year outlook unchanged
 Qt Group Plc Stock Exchange Release, 10 August 2017 at 8:00 a.m. Half-Year Report 1 January 2017 30 June 2017 Second quarter: Business proceeded as planned, full-year outlook unchanged April June 2017
SUOMINEN CORPORATION FINANCIAL STATEMENT RELEASE 1 JANUARY 31 DECEMBER 2004
 1 (12) SUOMINEN CORPORATION FINANCIAL STATEMENT RELEASE 1 JANUARY 31 DECEMBER 2004 Net sales: EUR 233.2 million (EUR 179.8 million 1 January - 31 December 2003) Operating profit: EUR 8.0 million (EUR15.4
Sponda Plc Financial Statements Bulletin 4 February 2005, at 9 am
 Sponda Plc Financial Statements Bulletin 4 February 2005, at 9 am SPONDA S RESULT IMPROVED 10 % IN 2004 Sponda Group s result in 2004 was better than the previous year s due to profits on property sales.
During the first quarter, the revenue grew and the operating result remained at the previous year s level.
 1 (14) MARTELA CORPORATION STOCK EXCHANGE RELEASE 27 April 2012 at 8.30 a.m. MARTELA CORPORATION INTERIM REPORT, 1 JANUARY - 31 MARCH 2012 During the first quarter, the revenue grew and the operating result
Year-end report January 1 December 31, 2014
 Year-end report January 1 December 31, 2014 October 1 December 31, 2014 Orders received SEK 18,469 M (14,363) Net sales SEK 18,760 M (21,073) Profit after financial items SEK 1,017 M (1,472) Profit after
strong and steady performance continued
 H1 2018 strong and steady performance continued half year financial REPORT JANUARY june 2018 Ramirent Plc s Half year financial Report January-June 2018 Strong and steady performance continued APRIL JUNE
Suominen Corporation Interim report 1 Jan 30 Jun July 2013
 Suominen Corporation Interim report 1 Jan 30 Jun 2013 17 July 2013 1 (20) Suominen Corporation Interim Report 17 July 2013 at 9:00am (EEST) SUOMINEN CORPORATION S INTERIM REPORT FOR JANUARY 1 JUNE 30,
April 27, Interim Report I
 April 27, 2005 Interim Report I January March 2005 The Jaakko Pöyry Group s net sales for the period under review were EUR 123.3 (115.5 in the same period 2004) million. Profit before taxes was EUR 7.5
EDITA GROUP KEY FIGURES Jan-Jun 2009 Jan-Jun 2008 Jan-Dec 2008
 1 (9) Interim Report September 2, 29 EDITA GROUP INTERIM REPORT JANUARY 1 JUNE 3, 29 Increase in net revenue and operating profit The net revenue of the Edita Group s continuing operations increased 9
EXEL COMPOSITES PLC INTERIM REPORT at 9.00 a.m. 1 (13)
") EXEL COMPOSITES PLC INTERIM REPORT 23.10. at 9.00 a.m. 1 (13) Exel Composites Plc s Interim Report for January 1 September 30, Q3 in brief - Net sales were 18.0 MEUR (Q3/: 19.0 MEUR) - Operating profit
EXEL COMPOSITES PLC INTERIM REPORT 23.10. at 9.00 a.m. 1 (13) Exel Composites Plc s Interim Report for January 1 September 30, Q3 in brief - Net sales were 18.0 MEUR (Q3/: 19.0 MEUR) - Operating profit
NET SALES DECREASED, OPERATING PROFIT BACK IN BLACK IN THE SECOND QUARTER
 NET SALES DECREASED, OPERATING PROFIT BACK IN BLACK IN THE SECOND QUARTER April-June 2011: -Net sales decreased by 7% to EUR 67.4 million (EUR 72.2 million in April-June 2010). -Number of chargers delivered
Basware grew SaaS revenues by 99% and continued to invest in enablers for the 2018 strategy
 Interim Report 1 (24) BASWARE INTERIM REPORT JANUARY 1 - JUNE 30, 2016 (IFRS) SUMMARY Basware grew SaaS revenues by 99% and continued to invest in enablers for the 2018 strategy January-June 2016: - Net
OP MORTGAGE BANK. Interim Report 1 January 30 September 2012
 OP MORTGAGE BANK Interim Report 1 January tember OP Mortgage Bank's (OPA) loan portfolio increased to EUR 8,511 million in the January-September period (EUR 7,535 million at the end of ). The bank increased
Report of the Board of Directors
 Report of the Board of Directors and Financial Statements 1.1.2008-31.12.2008 2 Solteq Financial statements 2008 contents 4 7 8 9 10 11 12 20 21 22 22 22 23 23 24 24 24 24 25 26 28 30 30 31 32 32 34 35
Lassila & Tikanoja plc: Interim Report 1 January 31 March 2018
 26.4.2018 1 Lassila & Tikanoja plc Stock exchange release 26 April 2018 at 8:00 am Lassila & Tikanoja plc: Interim Report 1 January 31 March 2018 - Net sales for the first quarter were EUR 196.5 million
Monetary figures in the financial statements are expressed in millions of euros unless otherwise stated.
 Notes to the consolidated financial statements General information Orion Corporation is a Finnish public limited liability company domiciled in Espoo, Finland, and registered at Orionintie 1, FI-02200
Board of Directors Report
 Board of Directors Report Operating environment Uncertainty in the world economy persisted in 2012. Finnish GDP decreased in the two last quarters of 2012 and Finland experienced an economic downturn.
DELETE GROUP OYJ, STOCK EXCHANGE RELEASE 7 November 2018 at 11:00 EET
 DELETE GROUP OYJ, STOCK EXCHANGE RELEASE 7 November 2018 at 11:00 EET NOT FOR RELEASE, PUBLICATION OR DISTRIBUTION, IN WHOLE OR IN PART, DIRECTLY OR INDIRECTLY, IN OR INTO ANY JURISDICTION IN WHICH THE
INTERIM REPORT JANUARY-JUNE 2013
 INTERIM REPORT JANUARY-JUNE 2013 1 (14) Destia Group s Interim Report for January June 2013 INCREASE OF ORDER BOOK CONTINUED AND CASH POSITION REMAINED STRONG, REVENUE DECREASED Revenue decreased by 12
Stock Exchange release 16 August 2018 at 9 am EEST
 Containerships plc Stock Exchange release 16 August 2018 at 9 am EEST Containerships plc s half year report H1/2018 H1/2018: Net Sales up almost 15% and Net Profit up EUR 1.7 million - Net Sales EUR 126.5
Interim Management Statement January August 2017 (Unaudited)
") Interim Management Statement January August 2017 (Unaudited) Table of Contents Highlights... 3 Key figures and ratios... 3 President and CEO s comments... 4 Operating and financial review Comprehensive
Interim Management Statement January August 2017 (Unaudited) Table of Contents Highlights... 3 Key figures and ratios... 3 President and CEO s comments... 4 Operating and financial review Comprehensive
Interim Report q2. 1 January - 30 JUNE The Group s order book rose 33%, standing at. Consolidated net sales in the review period
 2011 Interim Report q2 1 January - 30 JUNE 2011 The Group s order book rose 33%, standing at MEUR 111 (MEUR 84) at the end of June. Consolidated net sales in the review period increased 44% to MEUR 301
The Group s adjusted operating result back to profit in Q3
 Interim report Q3 2018 2 STOCKMANN S INTERIM REPORT Q3 2018 STOCKMANN plc, Interim report 26.10.2018 at 8:00 EET The Group s adjusted operating result back to profit in Q3 July-September 2018, continuing
OP MORTGAGE BANK. Stock exchange release 30 October 2013 Interim Report 1 January -30 September 2013
 OP MORTGAGE BANK Stock exchange release 30 October Interim Report 1 January -30 September Financial Standing The loan portfolio of OP Mortgage Bank (OPMB) decreased from EUR 8,678 million on 31 December