WDP Q results. Roadshow November & December 2012
|
|
|
- Morgan Oliver
- 6 years ago
- Views:
Transcription


1 WDP Q results Roadshow November & December 2012
2
3 Agenda WDP in a nutshell Strategic vision Highlights 9M 2012 Acquisition Lake Side Portfolio Update on WDP Netherlands Operational review Portfolio overview Financing structure Results analysis WDP share Outlook
4


5 WDP in a nutshell Pure player in warehouse sector Developments New build Refurbishments Acquisitions Portfolios Sale & rent back Sustainability BREEAM Renewable energy Active & flexible investor Creating long-term partnerships Focus on sustainable solutions Internal commercial, development & property management teams Built on solid foundations Supported by defensive REIT status Geographic diversification Long-dated experience with dedicated strategy for > 35y


6 Strategic vision Dynamic pure play property company offering creative long-term solutions to clients Creating a sustainable & growing income stream and focus on assets with strong residual value Building scale & financial strength to diversify risks and drive performance Lean & mean positioning within its core markets as to maintain flexibility


7 Prioritize controlled growth Shareholders Improve earnings visibility Access to debt & equity markets Enhance return on equity & control risks Clients Build long-term partnerships Offer creative deal structuring & improve services Diversify risk exposure & create efficiency gains Win/win for all stakeholders Generating sustainable EPS growth

8 Built on strong fundamentals > 95% Historical average occupancy rate > 8% Consistently high portfolio yield < 10% Operating expenses as a % of revenues < 4% Controlled cost of debt 55-60% Constant capital structure synchronizing debt & equity issuance # 35 Headcount combining SME spirit & large cap sophistication
9 Highlights 9M 2012 Operational Occupancy rate 97.2% (+ 50bps in 9M 2012) & letting of Venlo project (28,000m²) Strategic acquisition in second home market the Netherlands (Lake Side Portfolio) Confirmation of Benelux market leadership (deployment in the Netherlands) Financial Success of optional dividend & Lake Side bis (reinforcing equity base to fund growth) (*) Strengthening financing (several new credit facilities) Controlled cost of debt (based on high hedge ratio) Results Continued growth of the net current result in 9M 2012 (+7% on a per share basis) (**) Dividend forecast of EUR 3.10 per share confirmed (+5% compared to 2011) Guidance net current result increased to minimum EUR 51m (EUR 3.60 per share) (**) (*) The Lake Side bis -transaction was realized on 9 October 2012 and encompasses the (indirect) contribution in kind of 3 properties within the expanded Lake Side Portfolio for an amount of EUR 30m against payment in newly issued WDP shares, thereby reinforcing the equity base. (**) Based on the weighted average number of outstanding shares.
10 Highlights 9M 2012 KEY FIGURES Operational Fair value of real estate portfolio (incl. solar panels) (EUR m) 1.109,9 989,4 Gross rental yield (incl. vacancy) (%) 8,2% 8,3% Net initial yield (EPRA) (%) 7,4% 7,5% Average lease duration (till first break) (y) 6,9 7,2 Occupancy rate (%) 97,2% 96,7% Like-for-like rental growth (%) 2,5% 2,8% Operating margin (%) (H12012 vs. H1 2011) 91,4% 91,7% Per share data (EUR) Net current result (EPRA) 2,79 2,61 Result on portfolio 0,09 0,12 IAS 39 result -1,22-1,05 Net result 1,66 1,67 NAV (IFRS) 28,60 28,74 NAV (EPRA) 33,52 32,54 NNNAV (EPRA) 28,60 28,74
11 Acquisition Lake Side Portfolio Lake Side Portfolio transaction (*) Acquisition of a high quality, long leased logistics portfolio in the Netherlands 8 modern logistics/industrial facilities rented out to quality tenants (EUR 105m) Expanded with the purchase of an extra property in Veghel (EUR 9m) Financial details Asset deal of 9 freehold properties for a total investment of EUR 105m + EUR 9m (**) Annualized rental income of EUR 8.2m generating a gross initial yield of 7.8% (***) Partially paid in shares via (indirect) contribution in kind of 3 properties (EUR 30m) (*) Strategic fit Further deployment in second home market the Netherlands Strengthening portfolio quality & lengthening lease duration Matching property acquisition with reinforcement of equity through Lake Side bis (*) (*) See press releases of 22 March 2012, 25 April 2012, 3 October 2012 and 9 October (**) Including transaction costs. (***) Calculated by dividing the annualized gross rental income by the purchase price of EUR 105m (including transaction costs). The property of EUR 9m was acquired at a gross initial yield of 8.0%.


12 Strategic rationale Excellent quality assets Long duration leases Complementary to existing portfolio growth plan Strengthening Benelux market leadership Building strong platform in the Netherlands
13 Overview assets Lake Side Portfolio Location Type Tenant Site area (m²) Gross Lettable Area (m²) Occupancy rate Gross annual rent (EUR m) Lease duration (y) Nieuwegein Logistic V&D % 2,5 15,3 Zwolle Logistic Kuehne + Nagel % 1,2 7,6 Helmond Industrial Prinsen % 0,7 15,0 Veghel Industrial Vetipak % 0,5 9,1 Oss Industrial Vetipak % 0,5 14,0 Roosendaal (*) Industrial BIS Industrial Services % 0,8 10,0 Oss Logistic Movianto % 0,9 10,0 Beek (Maastricht-Airport) (*) Logistic Koninklijke Mosa % 0,9 15,0 Total % 8,2 12,5 (*) Under construction with deliveries scheduled respectively mid-september 2012 (Roosendaal) and early December 2012 (Beek). On 9 October 2012, these projects have together with the property in Veghel (let to K+N, excluded from the list above) been acquired through the Lake Side bis - transaction. See press releases of 3 October 2012 and 9 October 2012.

 Access to local funding (*) In 2010 WDP Netherlands NV obtained the Dutch REIT status, also known as Fiscale")
14 WDP Netherlands Developed Benelux market leadership Through strategic development in second home market the Netherlands Active in all strategic submarkets offering a wide range of logistics property solutions Building critical mass Strong growth achieved via acquisition of Wereldhave NL and Lake Side Portfolio Local team present supported from the headquarters in Belgium Solid platform for further growth Operating under the tax transparent Dutch REIT regime (*) Access to local funding (*) In 2010 WDP Netherlands NV obtained the Dutch REIT status, also known as Fiscale Beleggingsinselling (FBI)
15 Milestones in the Netherlands EUR 350m Acquisition of Wereldhave NL logistics portfolio - Starts partnership with ABN AMRO to access local funding - Start of activities though sale & rent back Hazeldonck (Breda) Acquisition of Univeg portfolio Opening a local office and Setting a team in NL E 2013 Tilburg: 1st BREEAM certificate for logistic building in NL - Nijmegen: BREEAM Very Good certification - Obtained Dutch REIT status - Evolution investment value of the porfolio Strategic acquisition of the Lake Side Portfolio
16 Purchases Transaction Country Type Investment Lake Side Portfolio NL logistics portfolio EUR 114m (*) 6 properties transferred during H EUR 83m 2 projects scheduled for delivery in H EUR 22m 1 extra property added to Lake Side Portfolio in H EUR 9m Londerzeel BE industrial site EUR 3m Zwijndrecht BE logistics site EUR 9m Total investment of > EUR 100m Profitable strengthening of market position (*) The transfer of the portfolio has occurred in phases during The 6 completed & rented buildings were transferred on 27 April 2012 for approximately EUR 83m. The 2 fully pre-leased projects with investment budgets of respectively approximately EUR 10m and approximately EUR 12m have together with the property in Veghel been transferred on 9 October 2012 through the Lake Side bis -transaction.
17 Disposals Transaction Country Type Divestment Various BE logistics EUR 20m Executed EUR 5m In negotiation EUR 15m EUR 20m disposals foreseen (at fair value) (*) Smaller non-strategic assets (*) A total of 6 properties with a fair value of EUR 15m are currently held as Assets for sale in the accounts per September 30, For 3 of these properties a final, binding sales agreement has been signed. In September 2012, one property was already sold for an amount of EUR 5m.
18 Projects executed Location Country Surface Completion Tenant Mollem BE 3,200m² Q Lactalis Mollem BE 3,100m² Q Vemoflex Venlo (*) NL 15,000m² Q Arrow Electronics Schiphol NL 10,000m² Q Rapid Total 31,300m² Total capex of EUR 21m (**) Yield on total cost around 8% (*) Because of unstable market conditions the completion of this project was postponed in After the letting to Arrow Electronics, the finalization of the project has been accelerated in Q taking into account a limited cash-out of EUR 2m. (**) For Venlo only taking into account the required investment to finish the project.
19 Projects in execution (pre-let) Location Country Surface Completion Tenant Willebroek BE 15,000m² Q Distrilog Ternat BE 10,000m² Q ATS, Bpost etc Total 25,000m² Total capex of EUR 7m (EUR 4m disbursed to date) (*) Yield on total cost around 8% (*) Since the Ternat project concerns a renovation, only refurbishment spends were taken into account.

20 Projects on hold (unlet) Location Country Surface Strategy n/a n/a n/a n/a No unfinished & unlet projects left, down y/y from 45,000m² Further optimization of balance sheet
21 Development potential (uncommitted) Location Country Buildable surface (*) St.-Niklaas BE 16,000m² Nivelles BE 25,000m² Courcelles BE 10,000m² Trilogiport BE 50,000m² (**) Heppignies BE 80,000m² Libercourt FR 24,000m² Neprevaska CZ Various RO tbd 10,000m² Land positions with a fair value of EUR 42m Initiation subject to preletting, secured financing & permits (*) Potential surfaces that could be built on the sites. (**) Concession.
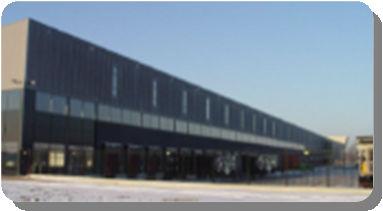
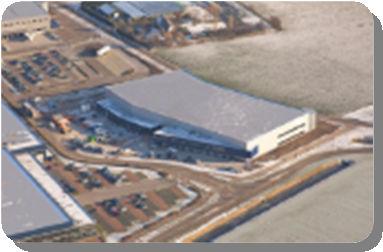
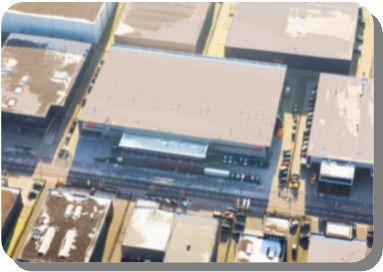
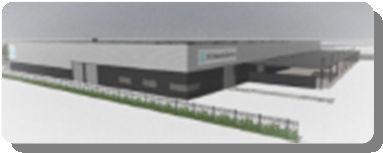
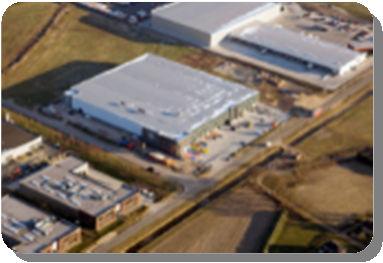
22 Redevelopment project Alphen aan den Rijn VT Verkerk & Logistics B.V. Before After
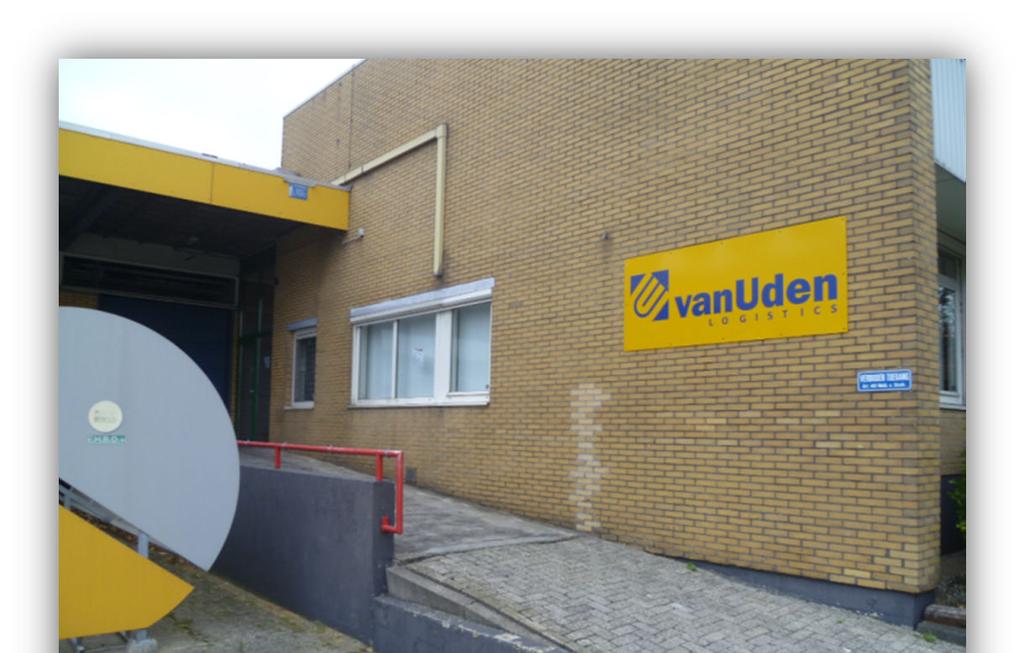
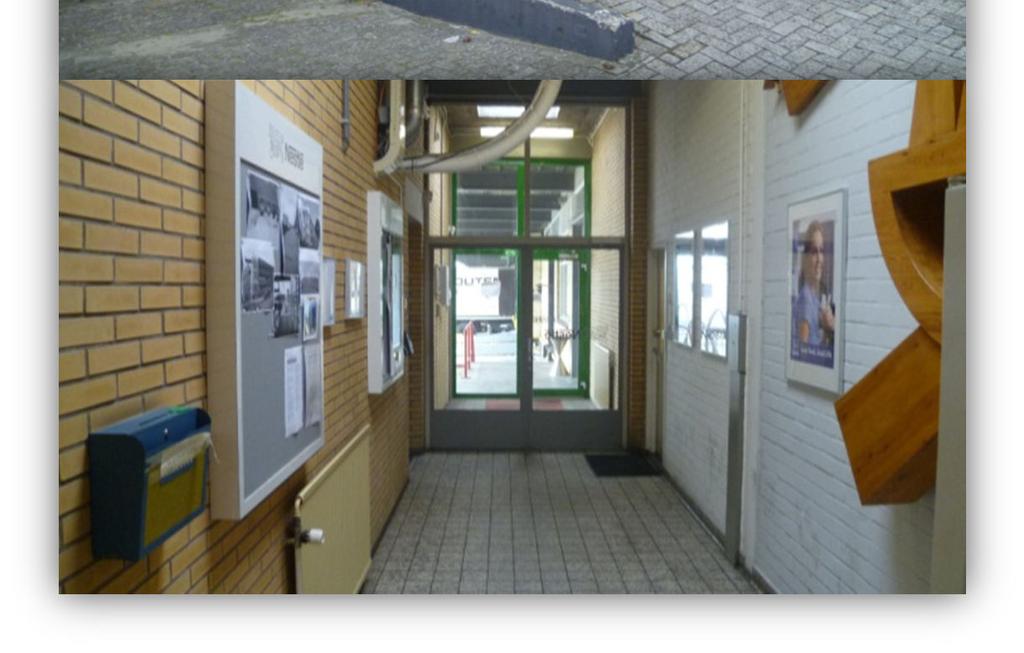
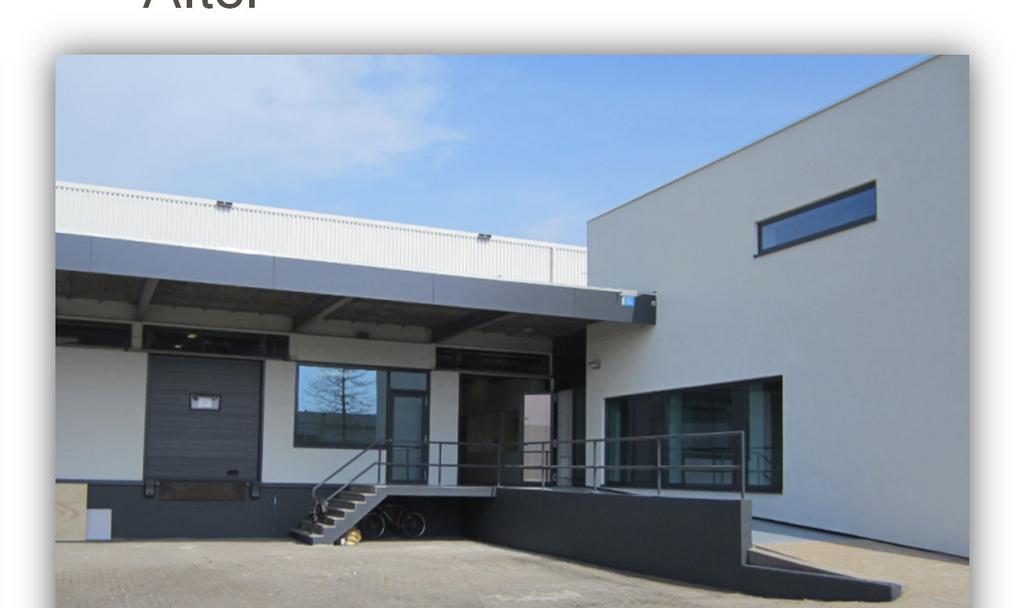
23 Redevelopment project Alphen aan den Rijn VT Verkerk & Logistics B.V. Before After
24 Sustainability Investments renewable energy Realized projects to cover rooftops of 6 sites in BE/RO with 1.5MWp solar panels Total of 16MWp solar panels in operation on rooftops in Belgium 9M 2012: solar panel income stands for 9% of revenues Various initiatives to reduce CO 2 footprint Initiated sustainable lighting project (cfr. Mollem first fully-led warehouse in BE) BREEAM certification for new projects (Willebroek, Schiphol) Constant dialogue with tenants to reduce heating and electricity consumption Looking ahead Political headwind reduces economic viability and lengthens project lead time Examining various alternatives (*) Lake Side Portfolio two buildings covering 40% of the surfaces BREEAM certified (*) Like for example the thermal storage systems that are being used in the BREEAM certified buildings in Nieuwegein and Helmond that are part of the Lake Side Portfolio.


. Value: EUR 598m Gross yield: 7.8% Vacancy rate: 3.")
25 Geographical footprint Portfolio fair value split 9M 2012 (*) Belgium 57% Total Value: EUR 1,040m Gross yield: 8.2% Vacancy rate: 3.0% 1.8m m² buildings 4.6m m² land Netherlands 30% France 8% Czech Republic 2% Romania 2% Czech Republic Value: EUR 25m Gross yield: 10.5% Vacancy rate: 0.0% 39,000m² buildings 131,000m² land Romania Value: EUR 25m Gross yield: 9.0% Vacancy rate: 0.0% 7,000m² buildings 861,000m² land Belgium France Netherlands (*) Excl. solar panels and incl. projects. Vacancy rate excl. solar panels (EPRA definition). Value: EUR 598m Gross yield: 7.8% Vacancy rate: 3.3% 1,117,000m² buildings 2,362,000m² land Value: EUR 82m Gross yield: 8.6% Vacancy rate: 8.4% 150,000m² buildings 376,000m² land Value: EUR 310m Gross yield: 8.7% Vacancy rate: 1.5% 526,000m² buildings 856,000m² land
26 Occupancy Continued high occupancy Occupancy rate 97.2% at 9M 2012 (vs. 96.7% end 2011) 90% of 2012 rental breaks secured Expected occupancy of minimum 96% end ,0% Historical occupancy rate 40% Lease maturity profile (till first break) 8,0 97,5% 95,0% 92,5% 35% 30% 25% 20% 7,0 6,0 5,0 4,0 90,0% 87,5% 85,0% 15% 10% 5% 0% 3,0 2,0 1,0 0,0 Vacancy due to unlet development projects Reletting of Hazeldonk post closing of FY04 Occupancy rate % Lease maturities 2012 renewed at % Lease maturities (incl. solar income) Weighted average lease duration (till first break & incl. solar panels)
27 Diversified client base Well-spread tenant profile Active in multiple industries & predominantly large (inter)national corporates Healthy mix between end-users & logistic service providers Top tenants spread over multiple buildings / businesses / countries Top tenants Tenant industry activity Univeg Group (*) 13% 14% 15% 3 PL Other DHL (**) 10% Food Wholesale Other 48% Top % Solar panels 8% Kuehne + Nagel 6% Philips Lighting 4% 41% 1% 2% 3% 7% 4% 4% 4% 5% Telecom & ICT Automotive Industry Textile Services Media & Communication Government & non-profit (*) Due to the growth of WDP and the disposal by Univeg of several non-core activities, the weight of Univeg within WDP s revenues will evolve towards 10% by year-end (**) The client relationship with DHL concerns multiple rental contracts spread over 10 buildings, 3 countries and 3 business units.
28 with long-term leases Income visibility Circa 40% of contracts have a duration of minimum 10y Including Lake Side Portfolio with 12.5y weighted average lease length Strong historical client retention rate Lease duration Weighted average lease duration (y) Till first break Till expiration Rental contracts (excl. solar panels) 6,1y 8,2y Rental contracts (incl. solar panels) 6,9y 8,9y
29 9M 2012 Consolidated results EUR x M M 2011 % Growth 2011 Net current profit Net rental result ,5% Income from solar energy ,1% Other operating income/charges n.r Property result ,2% Property costs ,0% Corporate overheads ,6% Net profit on property ,4% Financial result excl. IAS 39 result ,0% Taxes on net current result n.r. -87 Deferred taxes on net current result n.r. -58 Net current profit ,1% Result on the portfolio Changes in fair value of property investments (+/-) n.r Result on the disposals of property investments (+/-) n.r 17 Deferred taxes on the result of the portfolio n.r -708 Result on the portfolio n.r IAS 39 result Variation in the fair value of financial instruments (IAS 39 impa n.r Deferred taxes on revaluation of IRSs - - n.r - IAS 39 result n.r NET PROFIT n.r
30 9M 2012 Consolidated results Per share data 9M M 2011 % Growth 2011 Net current result (EPRA) (*) 2,79 2,61 7,0% 3,42 Portfolio result 0,09 0,12 n.r. 0,21 IAS 39 result -1,21-1,05 n.r. -1,33 Net profit 1,66 1,67 n.r. 2,29 Weighted average number of outstanding shares ,5% Net current result (**) 2,71 2,54 6,7% 3,25 Total number of dividend entitled shares ,8% (*) Based on the weighted average number of outstanding shares and based on EPRA Best Practices Recommendations ( (**) Based on the total number of dividend entitled shares.
31 9M 2012 Consolidated B/S EUR x Intangible fixed assets Property investments Other tangible fixed assets (incl. solar panels) Financial fixed assets Financial lease receivables Trade receivables and other fixed assets Deferred tax assets Fixed assets Assets intended for sale Financial leasing receivables Trade debtors receivables Tax receivables and other current assets Cash and cash equivalents Deferrals and accruals Current assets TOTAL ASSETS
32 9M 2012 Consolidated B/S EUR x Capital Issue premiums Reserves Net result of the financial year Equity capital Long-term financial debt Other long-term liabilities Long-term liabilities Short-term financial debt Other short-term liabilities Short-term liabilities TOTAL LIABILITIES Metrics NAV (IFRS) 28,60 29,43 28,74 NAV (EPRA) 33,52 33,35 32,54 NNNAV (EPRA) 28,60 29,43 28,74 Share price 40,71 37,06 37,05 Premium / discount 23,2% 11,5% 14,4% Debt ratio 57,7% 55,1% 56,5%
33 Financial management Management of capital structure Equity raised through optional dividend (EUR 22m) and Lake Side bis (EUR 30m) (*) Average issue price of EUR 38.7 (**) Debt ratio of 57.7% and expected to evolve towards 55% by year-end 2012 (*) New financing New credit facilities with existing and new banking partners For a total amount of EUR 70m Buffer of EUR 75m committed undrawn long-term credit facilities Controlled cost of debt Long-term hedges to cover debt taken up to acquire Lake Side Portfolio Reduction in the average financing cost to 3.6% in 9M 2012 (vs. 4.0% in 9M 2011) Based on a high hedge ratio (currently at 80%) (*) Post balance sheet date, on 9 October 2012, the equity base was reinforced through the Lake Side bistransaction, which encompassed the (indirect) contribution in kind of 3 properties for an amount of EUR 30m. (**) The EUR 22.4m equity raised in May through the stock dividend was issued at EUR per share. The EUR 30.0m raised through the Lake Side bis -transaction was issued at EUR The average also includes the EUR 3.4m contribution in kind of Immo Wever, with shares issued at EUR
34 Financing structure Solid debt metrics Debt ratio at 57.7% ICR at 3.4x Cost of debt at 3.6% Debt composition 90% Evolution hedge ratio Long-term bilateral credit facilities 73% Commercial paper 23% 80% 70% 60% 50% 40% Leasing 3% Straight loans 1% 30% 20% 10% 0%
35 Financing structure Well-spread debt maturities Duration of outstanding debt of 2.7y (incl. commercial paper) Duration of long-term credit facilities of min. 3.3y and max. 4.2y (*) Committed undrawn long-term credit lines of EUR 75m (**) Debt maturities (min.) (*) Debt maturities (max.) (*) >2019 Commercial paper & straight loans Long-term credit facilities (undrawn) Long-term credit facilities (drawn) >2019 Commercial paper & straight loans Long-term credit facilities (undrawn) Long-term credit facilities (drawn) (*) Some loans are structured with a renewal option at the discretion of the lenders. The minimum loan duration assumes these renewal options are not exercised. The maximum loan duration assumes the loans are rolled over at the date of the renewal. (**) Excluding the back-up facilities to cover the commercial paper programme and available short-term credit facilities.
36 WDP share Share statistics NAV (EPRA) per share of EUR 33.5 at 9M 2012 Market cap of ca. EUR 600m Free float of 71% - Family Jos De Pauw 29% WDP share price vs. NAV WDP share price Net Asset Value (EPRA NAV) 4,00 3,50 3,00 2,50 2,00 1,50 1,00 0,50 - EPS & DPS history EPS (EPRA) DPS
37 WDP share Return of WDP share Total return 9M 2012 Average since IPO / year WDP 18,1% 12,3% GPR 250 Belgium -0,8% 4,3% GPR 250 Europe 19,7% 6,2% BEL 20 13,9% -2,1%
 Funded with a healthy mix")


38 Executing on growth plan Improvement occupancy rate standing portfolio Strong investment volume of EUR 100m (acquisitions & projects) Funded with a healthy mix of debt & equity (55/45) Confirmation of Benelux market leadership Strategic acquisition in the Netherlands of EUR 105m Renewed success of optional dividend Letting of projects previously put on hold Disposal of smaller non-core assets 2013 Maintaining good operational & financial metrics Exploiting market position to source opportunities Preparing for next phase


 2011 EUR")


39 Executing on growth plan (cont d) 2013 target 2012E EUR 3.73 (+20%) EUR 3.60 (+15%) 2011 EUR 3.42 (+10%) 2010 EUR 3.11 (basis) On track to meet target of 20% EPS growth in Including recent reinforcement of equity base
40 Outlook 2012 Expected net current result of minimum EUR 51m or EUR 3.60 per share including Lake Side Portfolio & based on good fundamentals (high occupancy, long lease duration, healthy underlying market) (*) Expected dividend +5% to EUR 3.10 per share based on a payout ratio of 90% Gearing ratio expected of around 55% Expected occupancy rate of at least 96% end 2012 (*) Based on the present situation and barring unforeseen events (such as a material deterioration of the economic and financial environment) and a normal level of solar irradiation.
41 Disclaimer Warehouses De Pauw Comm.VA, abbreviated WDP, having its registered office at Blakebergen 15, 1861 Wolvertem (Belgium), is a closed-end property investment company, incorporated under Belgian law and listed on Euronext Brussels. By its very nature, any investment in financial instruments carries substantial risks. Investors are invited to carefully consider the risks, uncertainties and all other relevant information contained before deciding to invest. These risks, if they actually occur, could adversely impact WDP's business, results of operations, financial conditions and prospects and thereby the value of the shares and the dividend, and consequently, create a loss to investors of all or part of their investment. This presentation combined with all the declarations, estimates and forecasts and in general all other corporate information released by WDP contains selected and summarised information and does not express any commitment or acknowledgement or creates any right expressed or implied to. This presentation contains forward-looking information, forecasts and estimates prepared by WDP relating to the expected future performance of WDP and the market in which WDP operates. By their very nature, forward-looking statements involve inherent risks and uncertainties, both general and specific, and risks exist that the forecasts, estimates and other forward-looking statements will not be achieved. Investors should be aware that a number of important factors could cause actual results to differ materially from the plans, objectives, expectations, estimates and intentions expressed in such forward-looking statements. Such declarations, forecasts and estimates are based on various hypotheses and assessments of known and unknown risks, uncertainties and other factors which seemed sound at the time they were made, but which may or may not prove to be accurate. Some events are difficult to predict and can depend on factors on which WDP has no control. This uncertainty is further increased due to financial, operational and regulatory risks and risks related to the economic outlook, which reduces the predictability of any declaration, forecast or estimate made by WDP. Consequently, the reality of the earnings, financial situation, performance or achievements of WDP may prove substantially different from the guidance regarding the future earnings, financial situation, performance or achievements set out or suggested in such declarations, forecasts or estimates. Given these uncertainties, investors are advised not to give undue weight to these forward-looking statements. Additionally, the forecasts and estimates only apply on the date of drafting this presentation and WDP is not obliged to update these forecasts or estimates to reflect any changes in its expectations in this regard or any change in the events, conditions or circumstances on which such forecasts or estimates are based on. WDP makes no representation, warranty or prediction that the results anticipated by such forward-looking statements will be achieved.
42


43
WDP FY 2012 results February 13, 2013
 WDP FY 2012 results February 13, 2013 Agenda 2 Introduction WDP in a nutshell Highlights FY 2012 Operational review Financing structure Results analysis WDP share New ambition 2013-16 Outlook 2013 Introduction
Agenda. WDP in a nutshell Highlights Q Operational review Results analysis Financing structure WDP share New ambition Outlook 2013
 WDP Q1 2013 results Agenda WDP in a nutshell Highlights Q1 2013 Operational review Results analysis Financing structure WDP share New ambition 2013-16 Outlook 2013 2 WDP in a nutshell Pure player in warehouse
FY 2013 RESULTS 12 FEBRUARY 2014
 FY 2013 RESULTS 12 FEBRUARY 2014 1 AGENDA > Introduction > WDP in a nutshell > Roll-out growth plan 2013-16 > Operational review > Highlights FY 2013 > Results analysis > Financing structure > WDP share
ANNUAL RESULTS FOR THE PERIOD 01/01/2011 to 31/12/2011
 1 / 17 Press release Regulated information Wednesday, 15 February 2012, 7:00am ANNUAL RESULTS FOR THE PERIOD 01/01/2011 to 31/12/2011 NET CURRENT PROFIT 1 FOR 2011 OF 44.3 MILLION EURO OR A 13% INCREASE
Chairman s letter to the shareholders
 Interim financial report 2012 Content 4 1. Chairman s letter to the shareholders 6 2. Interim management report 6 1. Consolidated key figures 7 2. Notes to the consolidated results for the first six months
9M 2017 RESULTS 8 NOVEMBER 2017
 9M 2017 RESULTS 8 NOVEMBER 2017 1 AGENDA > Highlights 9M 2017 > Roll-out growth plan 2016-20 > Built on strong fundamentals > 9M 2017 > Operational review > Portfolio metrics > Highlights > Results analysis
INTERIM STATEMENT BY THE MANAGER FOR THE PERIOD
 Regulated information INTERIM STATEMENT BY THE MANAGER FOR THE PERIOD 01.01.2015 31.03.2015 The net current result over Q1 2015 amounts to 18.2 million euros and 1.04 euros per share, which implies an
HY 2018 results. 1 August 2018
 HY 2018 results 1 August 2018 AGENDA Introduction Highlights HY 2018 Roll-out growth plan 2016-20 Built on strong fundamentals HY 2018 results Outlook 2018 WDP share 2 2 HY 2018 HIGHLIGHTS HY 2018 EPS
9M 2018 results. 26 October 2018
 9M 2018 results 26 October 2018 AGENDA Introduction Highlights 9M 2018 Roll-out growth plan 2016-20 Built on strong fundamentals 9M 2018 results Outlook 2018 WDP share 2 2 9M 2018 HIGHLIGHTS 9M 2018 EPS
FY 2017 results. 2 February 2018
 FY 2017 results 2 February 2018 AGENDA Introduction Highlights FY 2017 Roll-out growth plan 2016-20 Built on strong fundamentals FY 2017 Outlook 2018 WDP share Governance 2 2 3 Mark Duyck Chairman of the
INTERIM REPORT BY THE MANAGER FOR THE PERIOD
 Regulated information INTERIM REPORT BY THE MANAGER FOR THE PERIOD 01.07.2015 30.09.2015 The net current result over 9M 2015 amounts to 65.8 million euros or 3.64 euros per share, which implies an increase
INTERIM STATEMENT BY THE MANAGER FOR THE PERIOD
 Regulated information INTERIM STATEMENT BY THE MANAGER FOR THE PERIOD 01.01.2016 31.03.2016 The net current result for Q1 2016 amounts to 22.2 million euros or 1.20 euros per share, which implies an increase
INTERIM STATEMENT BY THE MANAGER FOR THE PERIOD
 Wednesday 5 November 2014, 7.00 am Regulated information INTERIM STATEMENT BY THE MANAGER FOR THE PERIOD 01.07.2014 30.09.2014 The net current result for the first nine months of 2014 amounted to 51.0
ANNUAL RESULTS FOR THE PERIOD
 Regulated information ANNUAL RESULTS FOR THE PERIOD 01.01.2013-31.12.2013 The net current result 1 per share in 2013 was 3.85 euros (around 60 million euros), a 5.0% increase per share, in line with expectations.
THE GREENERY TRANSACTION
 THE GREENERY TRANSACTION 1 STRATEGIC LONG-TERM PARTNERSHIP > Redevelopment and further extension of The Greenery s Dutch sites located in Barendrecht Breda > Initial investment for WDP: ca. 46 million
Kempen conference. Amsterdam 30 May 2013
 Kempen conference Amsterdam 30 May 2013 Company snapshot Description Dutch REIT: NSI is a real estate asset management company and qualifies as fiscal investment institution under Dutch law (REIT) Full
PRESS RELEASE INTERIM FINANCIAL REPORT OF THE STATUTORY MANAGER
 PRESS RELEASE INTERIM FINANCIAL REPORT OF THE STATUTORY MANAGER UNDER EMBARGO UNTIL 05/11/2015 08:30 AM NET OPERATING RESULT OF EUR 5.33 MILLION (EUR 0.58 PER SHARE), GROWTH OF 40.3% COMPARED WITH THE
NET OPERATING RESULT OF EUR 3.54 MILLION GROWTH OF 6.3% COMPARED WITH Q1 2013
 REGULATED INFORMATION INTERIM STATEMENT UNDER EMBARGO UNTIL 15/05/2014 8.45 AM NET OPERATING RESULT OF EUR 3.54 MILLION GROWTH OF 6.3% COMPARED WITH Q1 2013 OCCUPANCY RATE OF 95% AVERAGE LEASE TERM UNTIL
Montea Space for Growth
 Montea Space for Growth 1 Table of content About Montea Real estate portfolio Space for Growth: Main objectives & Pipeline Financials Outlook 2 About Montea REIT listed on the NYSE Euronext Brussels &
Interim financial report
 Interim financial report Regulated information 2016 INTERIM FINANCIAL REPORT The net current result for H1 2016 amounts to 48.7 million euros or 2.62 euros per share, which implies an increase per share
INTERIM STATEMENT BY THE MANAGER FOR THE PERIOD
 Regulated information INTERIM STATEMENT BY THE MANAGER FOR THE PERIOD 01.01.2017 31.03.2017 EPRA Earnings for Q1 2017 amounts to 25.6 million euros, an increase of 15% compared to Q1 2016. The EPRA Earnings
Open minds, open spaces
 Open minds, open spaces A presentation by Laurent Carlier, CFO of Befimmo 18 November 2017 Finance Avenue Speaker Laurent Carlier > CFO of Befimmo since 2006 > 17 years of experience as Finance Director
PRESS & ANALYST MEETING
 BEYOND REAL ESTATE PRESS & ANALYST MEETING 2 HALF YEAR RESULTS 31 July 2018 3 Agenda 1. Nature of the portfolio 2. Important activities & developments in 2018 3. Financial results 30 June 2018 4. Property
PRESS RELEASE. Friday 26 October 2018, am Regulated information. Press release 26 October 2018
 PRESS RELEASE Friday 26 October 2018, 07.00 am Regulated information 1 Interim statement of the manager on 30 September 2018 The EPRA Earnings for 9M 2018 amounts to 101.2 million euros, an increase of
Amsterdam Schiphol 1 August Half-year results 2013
 Amsterdam Schiphol 1 August 2013 Half-year results 2013 Introduction CFO Pieter Roozenboom Age 41 Nationality Dutch 2010 2013 CEO Merin (former Uni-Invest Holding) a.o. restructuring CMBS, equity and syndicated
2017 HALF YEAR 25 JULY 2017
 2017 HALF YEAR RESULTS 25 JULY 2017 Strong financial results and robust balance sheet Driving performance through operational excellence and disciplined capital allocation High quality pipeline of growth
Interim financial report 2010
 Interim financial report 2010 Contents 4 Key figures and notes 10 Chairman s message to the shareholders 12 Interim management report 20 Outlook 21 Review of the semi-industrial and logistics property
Investor presentation Q results
 Investor presentation Q1 2011 results Recent highlights Successful issue of US$ 300m senior notes (US private placement) Sale non-strategic assets in UK of 15.1m, 7% above latest valuation Sale of a further
EGULATED INFORMATION INTERIM REPORT FROM THE STATUTORY MANAGER
 ² REGULATED INFORMATION INTERIM REPORT FROM THE STATUTORY MANAGER EPRA EARNINGS OF 7.1 MILLION ( 0.61 PER SHARE) FOR THE FIRST 3 MONTHS OF 2018 NET RENTAL INCOME OF 11.1 MILLION FOR THE FIRST 3 MONTHS
2018 INTERIM FINANCIAL REPORT
 2018 INTERIM FINANCIAL REPORT Wednesday 1 August 2018, 7.00 am Regulated information 1 fbredf 2018 Interim financial report The EPRA Earnings for H1 2018 amount to 65.1 million euros, an increase of 14%
Kempen European Property Seminar 30 May 2012 in Amsterdam
 Kempen European Property Seminar 30 May 2012 in Amsterdam Profile Top 3 listed Dutch mixed real estate fund Dutch REIT / Listed on Amsterdam Euronext (Midkap AMx) Portfolio: 2.29bn TRI: 203m Outstanding
PRESS RELEASE INTERMEDIATE DECLARATION OF THE BOARD OF DIRECTORS FOR THE PERIOD FROM TO
 INTERMEDIATE DECLARATION OF THE BOARD OF DIRECTORS FOR THE PERIOD FROM 01.01.2014 TO 31.03.2014 Net current result per share Group share (excluding IAS 39 impact) of 1.74 at 31.03.2014 - Compared to a
INTERIM STATEMENT FROM THE STATUTORY MANAGER FOR THE PERIOD FROM 01/07/2012 TO 30/09/2012
 UNDER EMBARGO UNTIL 08/11/2012 8.45 AM INTERIM STATEMENT FROM THE STATUTORY MANAGER FOR THE PERIOD FROM 01/07/2012 TO 30/09/2012 Net operating result 1 of EUR 2.89 million (EUR 0.51 per share), compared
INTERIM STATEMENT BY THE MANAGER FOR THE PERIOD
 Regulated information INTERIM STATEMENT BY THE MANAGER FOR THE PERIOD 01.07.2017 30.09.2017 The EPRA Earnings for the first nine months of 2017 amount to 90.0 million euros, an increase of 19% compared
HALF-YEARLY FINANCIAL REPORT FROM 01/01/2018 TO 30/06/2018
 REGULATED INFORMATION STATUTORY MANAGER S INTERIM STATEMENT EMBARGO UNTIL 21/08/2017 08:45 AM HALF-YEARLY FINANCIAL REPORT FROM EPRA EARNINGS OF 16.0 MILLION IN H1 2018 EPRA EARNINGS PER SHARE OF 1.35
FIRST SIX MONTHS OF 2018
 FIRST SIX MONTHS OF 2018 In the first half of 2018, Qrf City Retail focused on the optimization of the existing portfolio and on divesting nonstrategic properties. In this context, Qrf City Retail has
Investor presentation 9M 2012 results
 Investor presentation 9M 2012 results Key results: stabilising in Q3 Direct result p/s: 3.05 (-17.6% yoy) Q3: + 0.01 vs Q2 Revaluation portfolio: -4.75% Q3: -0.25% NAV p/s: 63.72 (-12.9% yoy) Q3: +0.4%
Amsterdam Schiphol 25 July Half-year results 2014
 Amsterdam Schiphol 25 July 2014 Half-year results 2014 Highlights Financial performance H1 2014 H1 2013 Direct result per share 1.73 1.76 Indirect result per share (1.50) (1.15) EPRA NAV per share 62.48
Q HIGHLIGHTS MEUR MEUR % MEUR MEUR 48.4 MEUR 94.8 MEUR % 1.87% +2.2% +1.9 PP +3.5% +73.8% + >100% +19.9% +81.
 Q1-2 2018 HIGHLIGHTS STRENGTHENED OPERATING PERFORMANCE Occupancy rate 94.7% Rental income MEUR 119.0 Rental income lfl MEUR 98.2 +1.9 PP +3.5% +2.2% KPIs SIGNIFICANTLY IMPROVED Results of AM MEUR 94.8
Befimmo SA. European Real Estate Society. March 11, 2016 ERES Seminar
 Befimmo SA European Real Estate Society March 11, 2016 ERES Seminar Befimmo 20-year track record in quality offices > Leading Belgian REIT (SIR/GVV) > Pure player in quality offices, located in Belgium
Hansteen. Full Year Results to 31 December Tilburg, Netherlands
 Hansteen Full Year Results to 31 December 2016 Tilburg, Netherlands Contents Introduction Hansteen 2016 results Sale announcement Sale of German and Dutch Portfolio 2016 Annual Results 2016 Property Performance
NET OPERATING RESULT OF EUR 6.91 MILLION (EUR 1.02 PER SHARE)
") REGULATED INFORMATION HALF-YEARLY FINANCIAL REPORT UNDER EMBARGO UNTIL 21/08/2014 08.45 AM NET OPERATING RESULT OF EUR 6.91 MILLION (EUR 1.02 PER SHARE) GROWTH OF 3.0% COMPARED WITH THE SAME PERIOD LAST
REGULATED INFORMATION HALF-YEARLY FINANCIAL REPORT UNDER EMBARGO UNTIL 21/08/2014 08.45 AM NET OPERATING RESULT OF EUR 6.91 MILLION (EUR 1.02 PER SHARE) GROWTH OF 3.0% COMPARED WITH THE SAME PERIOD LAST
Half yearly financial statement 2015
 Half yearly financial statement 2015 Vilvoorde, 23 July 2015 Regulated information Embargo until 24/07/2014, 08:00 AM CONTENTS 1. Overall summary real estate markets 1 2. Interim financial report Key figures
FINANCIALS. Arnaud Laviolette Group CFO. Investor day 13 December 2017
 FINANCIALS Arnaud Laviolette Group CFO ACTIVITIES ARE FINANCED INDEPENDENTLY EUR million 30 June 2017 AUTO BELRON MOLESKINE GROUP Loans & borrowings 189.9 708.8 189.6 1,088.3 Inter-group -330.2 180.5 149.7
2009 HALF-YEAR RESULTS
 2009 HALF-YEAR RESULTS SUMMARY Group profile and strategic plan Satisfactory results in the current climate A solid financial position Key highlights as of August 31 st Outlook and conclusion 2 GROUP PROFILE
2018 HALF YEAR 26 JULY 2018
 2018 HALF YEAR RESULTS 26 JULY 2018 H1 2018 Another period of delivery Strong financial results and capital structure Disciplined capital allocation improving portfolio scale and quality, reducing risk
NET OPERATING RESULT OF EUR 6.71 MILLION (EUR 1.02 PER SHARE)
") REGULATED INFORMATION UNDER EMBARGO UNTIL 22/08/2013 8.45 am NET OPERATING RESULT OF EUR 6.71 MILLION (EUR 1.02 PER SHARE) GROWTH OF 21.9% COMPARED WITH THE SAME PERIOD LAST YEAR ON COURSE TO ACHIEVE A
REGULATED INFORMATION UNDER EMBARGO UNTIL 22/08/2013 8.45 am NET OPERATING RESULT OF EUR 6.71 MILLION (EUR 1.02 PER SHARE) GROWTH OF 21.9% COMPARED WITH THE SAME PERIOD LAST YEAR ON COURSE TO ACHIEVE A
Full Year Aalberts Industries more than doubles earnings per share
 Full Year 2010 Aalberts Industries more than doubles earnings per share Today s agenda Headlines 2010 Profile Objectives Financial review Operational developments The Aalberts Industries share Outlook
Press Release 2006 Wednesday 21 February 2007, 7:30 AM
 Press Release 2006 Wednesday 21 February 2007, 7:30 AM OPERATING PROFIT OVER 2006 ROSE BY OVER 10% TO 22.3 MILLION EURO TOTAL GROSS DIVIDEND OVER 2006 OF 2.47 EURO PER SHARE (2.10 EURO NET) FURTHER DEVELOPMENT
PRESS RELEASE REGULATED INFORMATION Under embargo until 14/05/ PM
 PROVISIONAL STATEMENT OF THE STATUTARY MANAGER FOR THE PERIOD FROM 01/01/2009 TO 31/03/2009 Net current result 1 increases by 18.7% to EUR 2.07 million (EUR 0.58 per share) compared to EUR 1.75 million
Investor presentation H results
 Investor presentation H1 2011 results Recent highlights New lettings in Belgian and US office portfolio. Occupancy rate improving Heads of terms agreed for hotel in Eilan-project: 20 yr fixed lease, operator
VFB HAPPENING
 VFB HAPPENING 16.04.2016 Nursing home Noordduin Koksijde (BE) TABLE OF CONTENTS - Company Profile & Strategy - Healthcare Real Estate - Offices - Outlook - Q&A 2 COMPANY PROFILE & STRATEGY Nursing home
ASX CEO CONNECT PRESENTATION. Viva Energy REIT ASX CEO Connect Presentation 29 March 2018
 ASX CEO CONNECT PRESENTATION Viva Energy REIT ASX CEO Connect Presentation 29 March 2018 AGENDA Highlights 4 Financial Results 7 Portfolio Update 11 Industry Update 18 Strategy & Outlook 20 Questions &
Activities and results of the 3 rd quarter 2016
 Activities and results of the 3 rd quarter 2016 Strong financial results: Net current result (excluding IAS 39 impact) - Group share*: 4.69 EUR per share (compared to 4.96 EUR at 30.09.2015) Impact of
Results HALF-YEAR. Presentation of 30 August 2011
 Results HALF-YEAR 2011 Presentation of 30 August 2011 1 Summary Affine Group Property portfolio Development of group companies Analysis of 1H11 accounts A robust financial model Affine on the stock market
HIGHLIGHTS PROPERTY FOR INDUSTRY 2017 INTERIM RESULTS BRIEFING
 HIGHLIGHTS Internalisation of management on 30 June 2017 Increased guidance: distributable profit of between 7.70 and 7.90 cents per share, cash dividend of 7.45 cents per share Transition of the Penrose
CONTENT. 01 Highlights. 02 Portfolio Performance. 03 Optimisation of Financing Structure. 04 FY 2017 Results. 05 Outlook FY
 CONTENT 01 Highlights 02 Portfolio Performance 03 Optimisation of Financing Structure 04 FY 2017 Results 05 Outlook FY 2017 2 IMMOFINANZ RESTRUCTURING 5/2015 12/2017 Sale of logistics asset class - focus
INVESTOR PRESENTATION
 INVESTOR PRESENTATION Table of Contents Introduction to SEGRO 3 Market drivers 10 High quality development pipeline 15 Balance sheet and financing 21 Operating performance 26 Portfolio overview 30 APP
Press release nine months results 2010 VASTNED RETAIL REALISES STABLE DIRECT INVESTMENT RESULT AND POSITIVE VALUE MOVEMENTS IN PROPERTY PORTFOLIO
 Press release nine months results VASTNED RETAIL REALISES STABLE DIRECT INVESTMENT RESULT AND POSITIVE VALUE MOVEMENTS IN PROPERTY PORTFOLIO Reinier van Gerrevink, CEO VastNed Retail: The letting market
Agenda. About IREIT Global. Key Highlights. Portfolio Summary. Economy & Real Estate Review. Looking Ahead. Appendix : Overview of Tikehau Capital
 4Q 2017 and FY 2017 Results Presentation 14 February 2018 Agenda About IREIT Global Key Highlights Portfolio Summary Economy & Real Estate Review Looking Ahead Appendix : Overview of Tikehau Capital 2
Oosterhamrikkade Groningen 180 units Annual results 2017 Xior Stu d ent Hou sin g 9 Feb r u ar y 2018
 Oosterhamrikkade Groningen 180 units Annual results 2017 Xior Student Housing 9 February 2018 Disclaimer This presentation has been prepared by the management of XIOR STUDENT HOUSING NV (the "Company")
2016 FINANCIAL YEAR RESULTS PRESENTATION
 2016 FINANCIAL YEAR RESULTS PRESENTATION 22 August 2016 www.industriareit.com.au ASX CODE: IDR Agenda 01 Highlights and Investment Proposition 02 Financial results 03 Portfolio performance 04 Capital management
Press release. Annual figures 2008
 Press release Annual figures 2008 VASTNED RETAIL: DIRECT INVESTMENT RESULT 2008 3.71 PER SHARE ( 3.85 BEFORE ONE-OFF COSTS); PROPERTY VALUE DECREASES RESULT IN NEGATIVE INDIRECT INVESTMENT RESULT OF 6.82
ATRIUM COMPANY PRESENTATION
 ATRIUM COMPANY PRESENTATION THE LEADING OWNER & MANAGER OF CENTRAL EASTERN EUROPEAN SHOPPING CENTRES August 2017 ATRIUM LEADING OWNER & MANAGER OF CEE SHOPPING CENTRES Strong management team with a proven
Half yearly financial statement 2014
 Half yearly financial statement 2014 Vilvoorde, 24 July 2014 Contents 1. Overall summary real estate markets 1 2. Interim report Key figures 3 Profit 3 Direct result 4 Indirect result 4 Shareholders equity
> Financing costs sharply down by 38.6% or MEUR 10.3 to MEUR due to successful refinancing measures undertaken in FY 2017
 Q1 - HIGHLIGHTS PORTFOLIO EFFICIENCY ON VERY ROBUST LEVEL COST SAVINGS AND IMPROVED KPIs > Occupancy rate stable at record level of 94.2% > Adjusted rental income (like-for-like) rose 3.7% > Overall rental
Fortis Financial Statements 2007
 Fortis Financial Statements 2007 Fortis Financial Statements 2007 Fortis Consolidated Financial Statements Report of the Board of Directors of Fortis SA/NV and Fortis N.V. Fortis SA/NV Financial Statements
Investor Relations. results Q investor and analyst presentation 7 November 2018
 Investor Relations results Q3 2018 investor and analyst presentation 7 November 2018 Highlights of Q3, a good quarter Financials Net profit of EUR 725m and ROE of 14.4% NII remained strong and benefitted
Earnings, Balance Sheet and Cash Flow Analysis
 IMMOFINANZ AG Financial Report on the first three quarters of the 2017 Financial Year Earnings, Balance Sheet and Cash Flow Analysis General information: Due to the harmonisation of the financial year
Cofinimmo: Investing in diversified listed real estate. by Marc Hellemans, CFO
 Cofinimmo: Investing in diversified listed real estate by Marc Hellemans, CFO Tour & Taxis, June 1 st, 2013 Cofinimmo in a nutshell Leading Belgian listed real estate company, exposed to: The office property
Annual Communiqué Announcement of annual results 11/12/ /12/2015
 Annual Communiqué Announcement of annual results 11/12/2015-31/12/2015 Successful launch for Xior Antwerp, Belgium 7 March 2016 Annual results 11/12/2015 to 31/12/2015 I. SUMMARY Xior was successfully
9M 2018 RESULTS 09 NOVEMBER 2018 TLG IMMOBILIEN AG 9M 2018 RESULTS
 TLG IMMOBILIEN AG 9M 208 RESULTS DISCLAIMER This presentation includes statements, estimates, opinions and projections with respect to anticipated future performance of TLG IMMOBILIEN ("Forward-Looking
ENCORE+ DIVERSIFIED AND BALANCED CORE+ PROPERTY FUND
 ENCORE+ DIVERSIFIED AND BALANCED CORE+ PROPERTY FUND Q1 2017. This document is for professional clients and institutional/qualified investors only. It is not to be distributed to or relied on by retail
Agenda. About IREIT Global. Key Highlights. Portfolio Summary. Economy & Real Estate Review. Looking Ahead. Appendix : Overview of Tikehau Capital
 2Q 2017 and 1H 2017 Results Presentation 10 August 2017 Agenda About IREIT Global Key Highlights Portfolio Summary Economy & Real Estate Review Looking Ahead Appendix : Overview of Tikehau Capital 2 About
Neways posts higher turnover and results in 2016
 PRESS RELEASE Annual results Neways posts higher turnover and results in 2016 Son (the Netherlands) 3 March 2016 Neways Electronics International N.V. (Euronext: NEWAY) ( Neways or the Company ), today
Next Generation Real Estate. HY 2008 Figures. Colonia Real Estate AG HY 2008 Figures 15 th of August 2008 Cologne
 Next Generation Real Estate HY 2008 Figures Colonia Real Estate AG HY 2008 Figures 15 th of August 2008 Cologne Focused and Integrated Business Model Colonia Real Estate AG Investments Management Principal
Half yearly financial statement 2013
 Half yearly financial statement 2013 Vilvoorde, 31 July 2013 Contents 1. Overall summary real estate markets 1 2. Interim report Key figures 3 Profit 4 Direct result 4 Indirect result 4 Shareholders equity
Interim report per 30 June 2013
 Interim report per 30 June 2013 NSI N.V. Report of the Management Board NSI: investing in operational performance Results Direct investment result for the 1 st half-year of 2013 amounted to 25.5 million
Aldermore Banking as it should be UK Challenger Bank Day
 Aldermore Banking as it should be UK Challenger Bank Day 09 June 2015 Banking as it should be SME focused bank Customer loans 1 22% Asset Finance Track record of accelerating profitability Invoice Finance
Half-year results 2017 of Geneba Properties N.V.
 Half-year results 2017 of Geneba Properties N.V. Completion of strategic alternatives process Fraser Property new majority shareholder Frasers Property launched One-time Offer for remaining free float
ABN AMRO. Goldman Sachs Annual European Financials Conference. Paris, 8 June Kees van Dijkhuizen, CFO
 Kees van Dijkhuizen, CFO ABN AMRO Paris, 8 June 2016 Goldman Sachs Annual European Financials Conference Strong and balanced financial profile with focus on the Netherlands Key financials and metrics Q1
FINANCE AVENUE A presentation by Jean-Edouard Carbonnelle, Chief Executive Officer
 FINANCE AVENUE 19.11.2016 A presentation by Jean-Edouard Carbonnelle, Chief Executive Officer Woluwe 58 office building Brussels (BE): Cofinimmo headquarters ABOUT COFINIMMO Leading Belgian listed REIT
ABN AMRO reports record operating result
 ABN AMRO reports record operating result Third Quarter Results 23 31 October 23 Table of Contents ABN AMRO reports record operating result 3 Operating Performance 4 Asset Quality and Capital 13 Outlook
NSI Strategy update and full year results. Roadshow Tel Aviv 7 & 8 April
 NSI Strategy update and full year results Roadshow Tel Aviv 7 & 8 April Equity issue: full focus on operations Successful equity issue 300 million equity raised in a private placement to qualified investors
Regional REIT. Asset growth and refinancing completed. Further portfolio growth and diversification. Acquisition benefit offset by underlying revision
 Regional REIT Asset growth and refinancing completed Completion of acquisitions Real estate RGL s acquisition of two property portfolios, first announced in early December, for an aggregate consideration
FY2017 Annual General Meeting 19 April 2018
 FY2017 Annual General Meeting 19 April 2018 Agenda Key Highlights About Tikehau Capital European Market Review Portfolio Overview Financial Highlights Conclusion 2 Key Highlights FY2017 Key Highlights
Financial Ambition 2017 ING Investor Day Patrick Flynn CFO, Member Executive Board ING Group. Amsterdam - 31 March 2014
 Financial Ambition 2017 ING Investor Day Patrick Flynn CFO, Member Executive Board ING Group Amsterdam - 31 March 2014 www.ing.com We entered the final phase to become a pure Bank 2009-2011 2012-2013 2014-2017
ANALYST PRESENTATION 1H 2018
 ANALYST PRESENTATION 1H 2018 ABOUT QRF CITY RETAIL BE-REIT in inner-city retail WE INVEST IN, (RE)DEVELOP AND RENT OUT PRIME RETAIL REAL ESTATE IN THE GOLDEN MILE OF BELGIAN AND DUTCH CITIES > 90.000 m²
Bank and Bondholder presentation
 Bank and Bondholder presentation 19 September 2013 0 Geopost, Enfield Agenda Welcome and strategic overview (David Sleath, CEO) Operational and financial performance (Justin Read, Group Finance Director)
NINE MONTHS FINANCIAL RESULTS NOVEMBER 19, 2015
 NINE MONTHS FINANCIAL RESULTS NOVEMBER 19, 2015 01 ADO OVERVIEW AND INVESTMENT HIGHLIGHTS Overview ADO the pure play Berlin residential specialist Investment highlights 1 2 3 Berlin residential pure play
MILLION (+1.0%) VALUE INCREASE VASTNED RETAIL PROPERTY PORTFOLIO IN Q1 2011; DIRECT INVESTMENT RESULT MARGINALLY DOWN
 VALUE INCREASE VASTNED RETAIL PROPERTY PORTFOLIO IN Q1 2011; DIRECT INVESTMENT RESULT MARGINALLY DOWN") Press release first quarter figures 2011 20 MILLION (+1.0%) VALUE INCREASE VASTNED RETAIL PROPERTY PORTFOLIO IN 2011; DIRECT INVESTMENT RESULT MARGINALLY DOWN Reinier van Gerrevink, VastNed Retail CEO:
Press release first quarter figures 2011 20 MILLION (+1.0%) VALUE INCREASE VASTNED RETAIL PROPERTY PORTFOLIO IN 2011; DIRECT INVESTMENT RESULT MARGINALLY DOWN Reinier van Gerrevink, VastNed Retail CEO:
UBS Global Real Estate CEO/CFO Conference. December 1/2, 2015
 UBS Global Real Estate CEO/CFO Conference December 1/2, 2015 01 ADO OVERVIEW AND INVESTMENT HIGHLIGHTS Overview ADO the pure play Berlin residential specialist Investment highlights 1 2 3 Berlin residential
Investor Relations. Q results. analyst & investor call presentation 9 August 2017
 Investor Relations Q2 2017 results analyst & investor call presentation 9 August 2017 Good second quarter 2017 results Highlights Q2 2017 (vs. Q2 2016) Financial results Underlying net profit at EUR 960m
Interim Results Announcement For the half-year to 30 September th November 2006
 Interim Results Announcement For the half-year to 30 September 2006 16 th November 2006 Forward Looking Statement 2 This document contains certain forward-looking statements as defined in the US Private
WEBCAST PRESENTATION
 WEBCAST PRESENTATION 31.12.2017 2017 Highlights FINANCIAL RESULTS IN LINE WITH 2017 FORECAST AND CONFIRMATION OF 2017 DIVIDEND Net result from core activities Group share: 6.53 EUR/share at 31.12.2017
/ Investment portfolio 2.418,2 mln 2.646,0 mln Shareholders equity 3) 1.686,5 mln 1.
 1.686,5 mln 1.") Results 2009 Key items Direct result per share stable at 4.93 (2008: 4.92) Property revaluation -9.1% (until Q3 2009: -8.3%) Net asset value 73.77 per share (2008: 83.74) Solvency stable at 70% (2008:
Results 2009 Key items Direct result per share stable at 4.93 (2008: 4.92) Property revaluation -9.1% (until Q3 2009: -8.3%) Net asset value 73.77 per share (2008: 83.74) Solvency stable at 70% (2008:
Stride Property Group (NS) Annual Results For the year ended 31 March 2018
 Annual Results For the year ended 31 March 2018") Stride Property Group (NS) Annual Results For the year ended 31 March 2018 30 May 2018 Agenda and Contents Page Welcome Highlights 3 Strategy 5 Philip Littlewood Chief Executive Officer Financial Performance
Stride Property Group (NS) Annual Results For the year ended 31 March 2018 30 May 2018 Agenda and Contents Page Welcome Highlights 3 Strategy 5 Philip Littlewood Chief Executive Officer Financial Performance
Credit Opinion: Ascendas Real Estate Investment Trust
 Credit Opinion: Ascendas Real Estate Investment Trust Global Credit Research - 28 May 2012 Singapore Ratings Category Outlook Corporate Family Rating Senior Unsecured Moody's Rating Stable A3 Baa1 Contacts
2017 Full Year Results. Tuesday 21 November 2017
 2017 Full Year Results Tuesday 21 November 2017 Disclaimer Certain information included in the following presentation is forward looking and involves risks, assumptions and uncertainties that could cause
Prime Office REIT-AG EXCELLENCE IN GERMAN REAL ESTATE. Roadshow FY 2011 results Zurich, London, Frankfurt, Brussels, Paris and Amsterdam April 2012
 Prime Office REIT-AG EXCELLENCE IN GERMAN REAL ESTATE Roadshow FY 2011 results Zurich, London, Frankfurt, Brussels, Paris and Amsterdam April 2012 0 Disclaimer The statements contained herein may include