Agenda. WDP in a nutshell Highlights Q Operational review Results analysis Financing structure WDP share New ambition Outlook 2013
|
|
|
- Ambrose Domenic Blankenship
- 6 years ago
- Views:
Transcription


1 WDP Q results
2 Agenda WDP in a nutshell Highlights Q Operational review Results analysis Financing structure WDP share New ambition Outlook
3 WDP in a nutshell Pure player in warehouse sector Developments New build Refurbishments Acquisitions Portfolios Sale & rent back Sustainability BREEAM Renewable energy Active & flexible investor Creating long-term partnerships Focus on sustainable solutions Internal commercial, development & property management teams Built on solid foundations Supported by defensive REIT status Geographic diversification Long-dated experience with dedicated strategy for > 35y 3


4 Prioritize controlled growth Shareholders Improve earnings visibility Access todebt& equitymarkets Enhancereturn on equity& conservative risk profile Clients Build long-term partnerships Offer creativedeal structuring& improve services Diversify risk exposure & create efficiency gains Win/win for all stakeholders Generating visibility & sustainable EPS growth 4
5 Built on strong fundamentals > 95 % Historical average occupancy rate > 8 % Consistently high portfolio yield (based on long lease duration) < 10 % Operating expenses as a % of revenues < 4 % Controlled cost of debt (based on solid risk profile) % Constant capital structure synchronizing debt & equity issuance # 35 Headcount combining SME spirit & large cap sophistication 5

 Czech portfolio to be sold. Value: EUR 603m Gross yield: 7.7% Vacancy rate: 3.9% 1,160,000 m² buildings 2,417,000 m² land Value: EUR 81m Gross yield: 8.8% Vacancy rate: 8.")
6 Geographicalfootprint Portfolio fair value split Q (*) Netherlands 33% Czech Republic Belgium 55% TOTAL France 8% Czech Republic (**) Romania 2% 2% Value: EUR 25m Gross yield: 10.5% Vacancy rate: 0.0% 39,000 m² buildings 131,000 m² land Romania Value: EUR 1,098m Gross yield: 8.2% Vacancy rate: 3.1% 2.0m m² buildings 4.8m m² land Value: EUR 25m Gross yield: 9.3% Vacancy rate: 0.0% 7,000 m² buildings 861,000 m² land Belgium France Netherlands (*) Excl. solar panels and incl. projects. Vacancy rate excl. solar panels (EPRA definition). (**) Czech portfolio to be sold. Value: EUR 603m Gross yield: 7.7% Vacancy rate: 3.9% 1,160,000 m² buildings 2,417,000 m² land Value: EUR 81m Gross yield: 8.8% Vacancy rate: 8.4% 150,000 m² buildings 376,000 m² land Value: EUR 364m Gross yield: 8.7% Vacancy rate: 1.3% 662,000 m² buildings 1,008,000 m² land 6


7 Healthysector & strategiclogisticslocation Preparing products for European markets FOCUS Informatiestroom Know-how & 3PL evolution 4PL OPBRENGST Gain sharing Strategisch 3PL Proximity Unique value proposition of logistics topregion Goederenstroom Tactisch 2PL Operationeel Kost per pallet EDC know-how Gateways and Infrastructure Attractiveness 7
8 HighlightsQ Operational Strong fundamentals sustained (occupancy at 97% & lease duration at 7y) Several new projects launched in Belgium & Romania (based on pre-lettings) Phased development of new multimodal logistics hub (port of Ghent) Financial Active balance sheet management (synchronized debt & equity issuance) Strengthening financing (diversification of funding sources through bond issue) Renewed success of optional dividend (reinforcing equity base to fund growth) Results Continued growth of the net current result in Q (+12% on a per share basis) (*) Dividend forecast for 2013 of EUR 3.25 per share confirmed (+5% compared to 2012) New growth plan initiated (targeted cumulative EPS growth of 20-25% over 4 years) (*) Based on the weighted average number of outstanding shares. 8
9 HighlightsQ KEY FIGURES Operational Fair value of real estate portfolio (incl. solar panels) (EUR m) 1.165, ,1 Gross rental yield (incl. vacancy) (%) 8,2% 8,2% Net initial yield (EPRA) (%) 7,4% 7,4% Average lease duration (till first break) (y) 7,1 7,2 Occupancy rate (%) 97,1% 97,3% Like-for-like rental growth (%) 1,7% 2,3% Operating margin (%) (Q12013 vs. Q1 2012) 91,3% 91,3% Per share data (EUR) Net current result (EPRA) 0,92 0,82 Result on portfolio 0,01 0,02 IAS 39 result 0,34-0,30 Net result 1,27 0,53 NAV (IFRS) 31,07 29,93 NAV (EPRA) 35,52 34,05 NNNAV (EPRA) 31,06 29,93 9


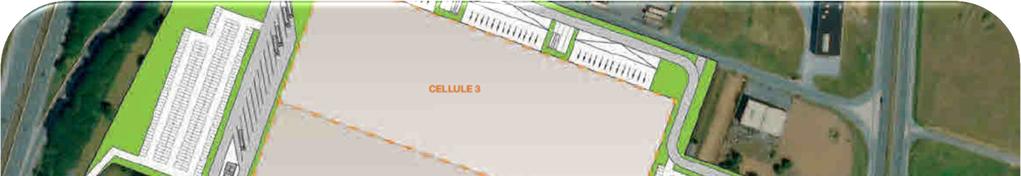
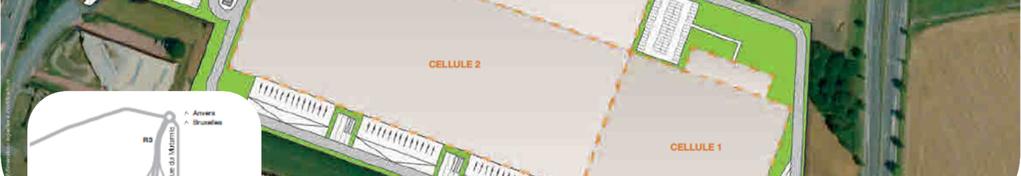
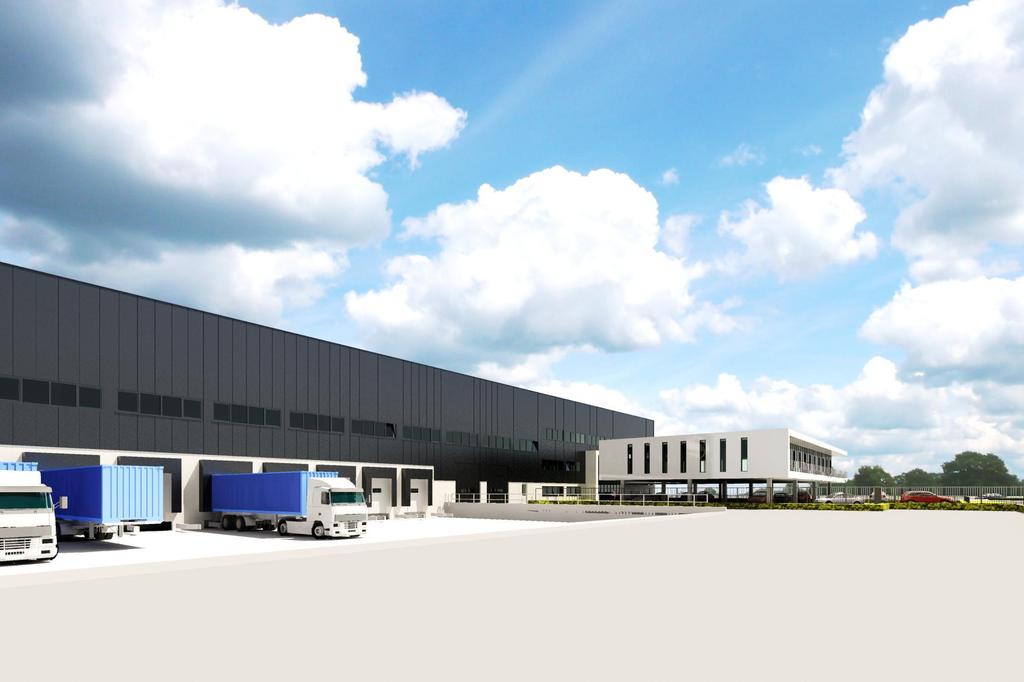
10 Belgium -WDPortof Ghent Logistic Park Multimodal site with potential forca m² of flexible warehouse solutions. Highway, railway & harbor connections. PORT OF GHENT BRUSSELS 10


11 Belgium Londerzeelproject Development, renovation, redevelopment and relocation project. LONDERZEEL A: new warehouse for Colfridis. B: light renovation - Crown Baele moves into an adapted industrial complex. C: Davigelcentralizes its activities by relocating to Bornem. Now there is room for a newly built warehouse at D. D: construction of deep-freeze warehouse for Lantmännen Unibake. BRUSSELS 11
12 Purchases Transaction Country Type Investment Zaltbommel NL logistics site EUR 8m (*) (*)TheclosingofthetransactionisscheduledbyJune30,2013. Total investment of ca. EUR 8m Further deployment in the Netherlands 12
 WDP CZ + smaller non-strategic assets (*)SeveralpropertieswithafairvalueofEUR36marecurrentlyheldas Assetsforsale intheaccountspermarch 31,2013.")
13 Disposals Transaction Country Type Divestment In execution WDP CZ CZ logistics & retail EUR 25m Aalst, Wieze, Nivelles BE logistics EUR 11m Optimizing portfolio ~ EUR 36m disposals (at fair value) (*) WDP CZ + smaller non-strategic assets (*)SeveralpropertieswithafairvalueofEUR36marecurrentlyheldas Assetsforsale intheaccountspermarch 31,2013.Theserelatetotheexpectedsaleof5propertiesinAalst(3),Wieze(1)andNivelles(1)(EUR11m)andto the planned disposal of the Czech portfolio (EUR 25m). All disposals to be executed in 2013 are based on a transactionvalueinlinewiththelatestfairvalueatthetimethedisposalwasagreed. 13
14 Projects in execution (pre-let) Location Country Surface Completion Tenant Zwijndrecht BE 20,000 m² Q Van Moer Nivelles BE 4,000 m² Q GLS Aalst BE 3,000 m² Q Tech Data Londerzeel BE 21,000 m² Q1 2014/15 Various Brasov RO 5,000 m² Q Intercars Sarulesti RO n/r Q Solar ground park Total 53,000 m² (*) Excluding the ground solar park that is being developed in Sarulesti(RO). Total capexof > EUR 40m Yield on total cost minimum 8% (*) 14
15 Development potential (uncommitted) Location Country Buildable surface (*) Sint-Niklaas BE 16,000 m² Nivelles BE 8,000 m² Courcelles BE 10,000 m² Trilogiport BE 50,000 m² (**) Heppignies BE 80,000 m² Port of Ghent BE 180,000 m² (**) Libercourt FR 24,000 m² Various RO tbd (*) Potential surfaces that could be built on the sites. (**) Concession. Land positions with a fair value of EUR 42m Initiation subject to preletting, secured financing & permits 15
16 Development potential: Heppignies 16
17 Sustainability Investments in sustainability through offset and reduce Offset through investments in renewable energy Reduce through reduction of energy consumption in existing & new buildings Only investments based on low-risk assessment & similar return pattern Investments in renewable energy Total of 22 MWpsolar panels in Belgium (15)& Romania (7)(*) Long-term secured cash flow & strengthening commercial positioning of properties Examining various alternatives, but only based on low-risk assessment (**) Various initiatives to reduce carbon footprint Various investments to reduce heating & electricity consumption for tenants Initiated sustainable lighting project (cfr. Mollem first fully-led warehouse in BE) BREEAM certification for new projects (9% of portfolio BREEAM certified) (*) Including a ground solar park of 6MW that is being installed in Romania (on the basis of 100% of the investment. WDP is 51% owner within the joint operation WDP Development RO). (**) Such as for example the thermal storage systems that are being used in the BREEAM certified buildings in Nieuwegeinand Helmond that are part of the Lake Side Portfolio. 17
18 Strong portfolio quality Investments reflect long-term thinking & entrepreneurship Locations on strategic logistics corridors Robust building quality, integrating sustainability & flexibility through lifecycle Diversified portfolio & integrated facility management to tailor clients needs Type of buildings Building quality General warehouse 65% Cooled 8% Cross-dock 5% Multiple floor 7% Other (retail and offices) 4% Semi industrial 11% Class A warehouse 61% Class B warehouse Class C 19% warehouse 1% Cross-dock 5% Other 5% Class A BREEAM warehouse 9% 18
19 Occupancy Continued high occupancy Occupancy rate 97.1% end Q (vs. 97.3% end 2012) Lease renewal rate of 90% in 2012 Circa 85% of rental breaks in 2013 already secured year-to-date 100,0% Historical occupancy rate 40% Lease maturity profile (till first break) 8,0 97,5% 95,0% 92,5% 35% 30% 25% 20% 7,0 6,0 5,0 4,0 90,0% 87,5% 85,0% 15% 10% 5% 0% 3,0 2,0 1,0 0,0 Vacancy due to unlet development projects Reletting of Hazeldonk post closing of FY04 Occupancy rate % Lease maturities 2013 renewed year-to-date (lhs) % Lease maturities (incl. solar income) (lhs) Weighted average lease duration (till first break & incl. solar panels) 19
20 Diversified client base Well-spread tenant profile Active in multiple industries & predominantly large (inter)national corporates Healthy mix between end-users & logistic service providers Top tenants spread over multiple buildings / businesses / countries (max. building risk <5%) Top tenants DHL (*) 10% Univeg Group (**) 10% 13% Tenant industry activity 15% 3 PL Other Food Other 51% Top % Solar panels 8% Kuehne + Nagel 7% Philips Lighting 4% 40% 1% 1% 3% 8% 6% 5% 4% 4% Wholesale Textile Industry Telecom & ICT Automotive Services Media & Communication Government & non-profit (*) The client relationship with DHL concerns multiple rental contracts spread over 10 buildings, 3 countries and 3 business units. (**) The client relationship with Univeg concerns multiple rental contracts spread over 2 sites and 2 countries. 20
21 with long-term leases Income visibility Circa 35% of contracts have a duration of minimum 10y Investments in 2012 realized with an average lease duration of > 10y Strong historical client retention rate & fidelity Lease duration Weighted average lease duration (y) Till first break Till expiration Rental contracts (excl. solar panels) 6,4y 8,8y Rental contracts (incl. solar panels) 7,1y 9,3y 21
22 Q Consolidatedresults EUR x Q Q % Growth Net current profit rel. Net rental result ,1% Income from solar energy ,5% Other operating income/charges n.r. Property result ,1% Property costs ,0% Corporate overheads ,2% Net profit on property ,0% Financial result excl. IAS 39 result ,2% Taxes on net current result n.r. Deferred taxes on net current result n.r. Net current profit ,2% Result on the portfolio Changes in fair value of property investments (+/-) n.r Result on the disposals of property investments (+/-) -7-1 n.r Deferred taxes on the result of the portfolio 5 24 n.r Result on the portfolio n.r IAS 39 result Variation in the fair value of financial instruments (IAS 39 impact) n.r Deferred taxes on revaluation of IRSs - - n.r IAS 39 result n.r NET PROFIT n.r 22
23 Q Consolidated results Per share data Q Q % Growth rel. Net current result (EPRA) (*) 0,92 0,82 12,3% Portfolio result 0,01 0,02 n.r. IAS 39 result 0,34-0,30 n.r. Net profit 1,27 0,53 n.r. Weighted average number of outstanding shares ,6% Net current result (EPRA) 0,92 0,82 12,3% Portfolio result 0,01 0,02 n.r. IAS 39 result 0,34-0,30 n.r. Net profit 1,27 0,53 n.r. Total number of outstanding shares ,6% (*) Based on the weighted average number of outstanding shares and based on EPRA Best Practices Recommendations( (**) Based on the total number of dividend entitled shares. 23
24 Q ConsolidatedB/S EUR x Intangible fixed assets Property investments Other tangible fixed assets (incl. solar panels) Financial fixed assets Financial lease receivables Trade receivables and other fixed assets Deferred tax assets Fixed assets Assets intended for sale Financial leasing receivables Trade debtors receivables Tax receivables and other current assets Cash and cash equivalents Deferrals and accruals Current assets TOTAL ASSETS
25 Q ConsolidatedB/S EUR x Capital Issue premiums Reserves Net result of the financial year Equity capital Long-term financial debt Other long-term liabilities Long-term liabilities Short-term financial debt Other short-term liabilities Short-term liabilities TOTAL LIABILITIES Metrics NAV (IFRS) 31,07 29,85 29,93 NAV (EPRA) 35,52 34,64 34,05 NNNAV (EPRA) 31,06 29,85 29,93 Share price 49,50 47,24 40,03 Premium / discount 39,8% 36,8% 17,6% Debt ratio 54,8% 56,1% 54,5% 25
26 Financial management Management of capital structure Matching property acquisitions with simultaneous debt & equity issuance Renewed success of optional dividend (72% take-up) leading to EUR 25m capital increase (*) Debt ratio expected to remain stable in 2013 vs (at around 56%) Debt financing Diversification of funding sources through inaugural bond issue of EUR 50m (**) 2013 long-term debt maturities proactively refinanced in full Buffer of EUR 100m committed undrawn long-term credit facilities Controlled cost of debt Good coverage metrics sustained and based on high visibility Average financing cost at 3.5% in Q (vs. 3.6% in FY 2012) High hedge ratio maintained (currently at 85%) with a duration of 6y (*) The EUR 25.4m equity raised in May through the stock dividend was issued at EUR per share, leading to the creation of 573,596 new shares thereby bringing the total number of shares at 15,655,288. (**) In March 2013 the private placement of a 7-year bond for a total amount of EUR 50m was realized. The bonds offer an annualized gross yield of 3.82% and are traded on NYSE Euronext Brussels. 26
27 Financingstructure Solid debt metrics Debt ratio Q at 54.8% ICR at 3.7x based on long-term visibility and high hedge ratio (currently at 85%) Cost of debt at 3.5% Debt composition 90% Evolution hedge ratio 7,0 Long-term bilateral credit lines 69% Commercial paper 20% Bond % Leasing 3% 80% 70% 60% 50% 40% 30% 20% 10% 6,0 5,0 4,0 3,0 2,0 1,0 Straight loan 1% 0% ,0 Hedge ratio Weighted average hedge duration (y) (rhs). 27
28 Financing structure Well-spread debt maturities Duration of outstanding debt of 3.0y (incl. commercial paper) Duration of long-term credit facilities of min. 3.6y and max. 4.2y (*) Committed undrawn long-term credit lines of EUR 100m (**) Debt maturities (min.) (*) Debt maturities (max.) (*) Commercial paper & straight loans Long-term credit facilities (undrawn) Long-term credit facilities (drawn) Commercial paper & straight loans Long-term credit facilities (undrawn) Long-term credit facilities (drawn) (*) Some loans are structured with a renewal option at the discretion of the lenders. The minimum loan duration assumes these renewal options are not exercised. The maximum loan duration assumes the loans are rolled over at thedateoftherenewal. (**) Excluding the back-up facilities to cover the commercial paper programme and available short-term credit facilities. 28
29 WDP share Share statistics NAV (EPRA) per share of EUR 35.5 at Q Market cap of ca. EUR 775m Free float of 71% -Family Jos De Pauw 29% WDP share price vs. NAV ,00 3,50 3,00 2,50 2,00 1,50 1,00 0,50 - EPS & DPS history WDP share price Net Asset Value (EPRA NAV) EPS (EPRA) DPS 29
30 WDP share Return of WDP share Total return Q Average since IPO / year WDP 4,8% 13,4% GPR 250 Belgium -2,1% 4,5% GPR 250 Europe -0,6% 6,5% BEL 20 4,7% -1,4% 30
 EUR 3.67 (+18%) 2011 EUR 3.")
 Target EPS nearly achieved after 2")
31 Executed growthplan 2013 target 2012 EUR 3.73 (+20%) EUR 3.67 (+18%) 2011 EUR 3.42 (+10%) 2010 EUR 3.11 (basis) Target EPS nearly achieved after 2 years Including reinforcement of equity base 31
32 New growthplan Ambition to grow EPS in 4 years by 20-25% to EUR by 2016 based on: Increasing portfolio with 50% or EUR 600m in existing markets, especially the Benelux Acquisitions (direct, sale & rent back, portfolios) Developments for own account on existing and/or new land (subject to pre-letting) Investments in sustainability through offset and reduce (improve CO 2 footprint) Continuation of matching property acquisitions with synchronous debt & equity issuance (*) Strong operational fundamentals (high occupancy, long lease duration, sustainable rent levels) Controlled cost of debt (based on a solid risk profile) Creating growth & profitability Driven by a healthy sector in a strategic region for logistics (*) In principle, through stock dividend and contributions in kind. 32
33 Outlook 2013 Expected net current result of minimum EUR 60m (*) based on: high occupancy (projected to be at least 96% end 2013) high lease renewal rate (13% lease expiries in 2013, of which already ca. 85% renewed) reinvestment of proceeds from ongoing disposals and optional dividend assuming a constant capital structure with a gearing ratio around 56% Net current result per share of minimum EUR 3.85 (+5% vs. 2012) Expected dividend (payable in 2014) +5% to EUR 3.25 per share (*) Based on the situation & prospects as at 31 March 2013 and barring unforeseen events (such as a material deterioration of the economic and financial environment) and a normal level of solar irradiation. 33
34 Contact details Joost Uwents CEO T+32(0) M+32(0) Mickael Van den Hauwe CFO T+32(0) M+32(0)
35 Disclaimer Warehouses De Pauw Comm. VA, abbreviated WDP, having its registered office at Blakebergen 15, 1861 Wolvertem(Belgium), is a public closedend property investment company, incorporated under Belgian law and listed on Euronext Brussels. This presentation contains forward-looking information, forecasts, beliefs, opinions and estimates prepared by WDP, relating to the currently expected future performance of WDP and the market in which WDP operates( forward-looking statements ). By their very nature, forward-looking statements involve inherent risks, uncertainties and assumptions, both general and specific, and risks exist that the forward-looking statements will not be achieved. Investors should be aware that a number of important factors could cause actual results to differ materially from the plans, objectives, expectations, estimates and intentions expressed in, or implied by, such forward-looking statements. Such forward-looking statements are based on various hypotheses and assessments of known and unknown risks, uncertainties and other factors which seemed sound at the time theyweremade,butwhichmayormaynotprovetobeaccurate.someeventsaredifficulttopredictandcandependonfactorsonwhichwdphas no control. Statements contained in this presentation regarding past trends or activities should not be taken as a representation that such trends or activities will continue in the future. This uncertainty is further increased due to financial, operational and regulatory risks and risks related to the economic outlook, which reduces the predictability of any declaration, forecast or estimate made by WDP. Consequently, the reality of the earnings, financial situation, performance or achievements of WDP may prove substantially different from the guidance regarding the future earnings, financial situation, performance or achievements set out in, or implied by, such forward-looking statements. Given these uncertainties, investors are advised not toplace undue reliance on these forward-looking statements. Additionally, the forward-looking statements only apply on the date of this presentation. WDP expressly disclaims any obligation or undertaking, unless if required by applicable law, to release any update or revision in respect of any forwardlooking statement, to reflect any changes in its expectations or any change in the events, conditions, assumptions or circumstances on which such forward-looking statements are based. Neither WDP, nor its representatives, officers or advisers, guarantee that the assumptionsunderlying the forward-looking statements are free from errors, and neither of them makes any representation, warranty or prediction that the results anticipated by such forward-looking statements will be achieved. 35


36
WDP FY 2012 results February 13, 2013
 WDP FY 2012 results February 13, 2013 Agenda 2 Introduction WDP in a nutshell Highlights FY 2012 Operational review Financing structure Results analysis WDP share New ambition 2013-16 Outlook 2013 Introduction
FY 2013 RESULTS 12 FEBRUARY 2014
 FY 2013 RESULTS 12 FEBRUARY 2014 1 AGENDA > Introduction > WDP in a nutshell > Roll-out growth plan 2013-16 > Operational review > Highlights FY 2013 > Results analysis > Financing structure > WDP share
WDP Q results. Roadshow November & December 2012
 WDP Q3 2012 results Roadshow November & December 2012 Agenda WDP in a nutshell Strategic vision Highlights 9M 2012 Acquisition Lake Side Portfolio Update on WDP Netherlands Operational review Portfolio
THE GREENERY TRANSACTION
 THE GREENERY TRANSACTION 1 STRATEGIC LONG-TERM PARTNERSHIP > Redevelopment and further extension of The Greenery s Dutch sites located in Barendrecht Breda > Initial investment for WDP: ca. 46 million
9M 2017 RESULTS 8 NOVEMBER 2017
 9M 2017 RESULTS 8 NOVEMBER 2017 1 AGENDA > Highlights 9M 2017 > Roll-out growth plan 2016-20 > Built on strong fundamentals > 9M 2017 > Operational review > Portfolio metrics > Highlights > Results analysis
INTERIM STATEMENT BY THE MANAGER FOR THE PERIOD
 Regulated information INTERIM STATEMENT BY THE MANAGER FOR THE PERIOD 01.01.2015 31.03.2015 The net current result over Q1 2015 amounts to 18.2 million euros and 1.04 euros per share, which implies an
ANNUAL RESULTS FOR THE PERIOD
 Regulated information ANNUAL RESULTS FOR THE PERIOD 01.01.2013-31.12.2013 The net current result 1 per share in 2013 was 3.85 euros (around 60 million euros), a 5.0% increase per share, in line with expectations.
ANNUAL RESULTS FOR THE PERIOD 01/01/2011 to 31/12/2011
 1 / 17 Press release Regulated information Wednesday, 15 February 2012, 7:00am ANNUAL RESULTS FOR THE PERIOD 01/01/2011 to 31/12/2011 NET CURRENT PROFIT 1 FOR 2011 OF 44.3 MILLION EURO OR A 13% INCREASE
INTERIM STATEMENT BY THE MANAGER FOR THE PERIOD
 Wednesday 5 November 2014, 7.00 am Regulated information INTERIM STATEMENT BY THE MANAGER FOR THE PERIOD 01.07.2014 30.09.2014 The net current result for the first nine months of 2014 amounted to 51.0
INTERIM REPORT BY THE MANAGER FOR THE PERIOD
 Regulated information INTERIM REPORT BY THE MANAGER FOR THE PERIOD 01.07.2015 30.09.2015 The net current result over 9M 2015 amounts to 65.8 million euros or 3.64 euros per share, which implies an increase
HY 2018 results. 1 August 2018
 HY 2018 results 1 August 2018 AGENDA Introduction Highlights HY 2018 Roll-out growth plan 2016-20 Built on strong fundamentals HY 2018 results Outlook 2018 WDP share 2 2 HY 2018 HIGHLIGHTS HY 2018 EPS
PRESS RELEASE INTERIM FINANCIAL REPORT OF THE STATUTORY MANAGER
 PRESS RELEASE INTERIM FINANCIAL REPORT OF THE STATUTORY MANAGER UNDER EMBARGO UNTIL 05/11/2015 08:30 AM NET OPERATING RESULT OF EUR 5.33 MILLION (EUR 0.58 PER SHARE), GROWTH OF 40.3% COMPARED WITH THE
FY 2017 results. 2 February 2018
 FY 2017 results 2 February 2018 AGENDA Introduction Highlights FY 2017 Roll-out growth plan 2016-20 Built on strong fundamentals FY 2017 Outlook 2018 WDP share Governance 2 2 3 Mark Duyck Chairman of the
9M 2018 results. 26 October 2018
 9M 2018 results 26 October 2018 AGENDA Introduction Highlights 9M 2018 Roll-out growth plan 2016-20 Built on strong fundamentals 9M 2018 results Outlook 2018 WDP share 2 2 9M 2018 HIGHLIGHTS 9M 2018 EPS
INTERIM STATEMENT BY THE MANAGER FOR THE PERIOD
 Regulated information INTERIM STATEMENT BY THE MANAGER FOR THE PERIOD 01.01.2016 31.03.2016 The net current result for Q1 2016 amounts to 22.2 million euros or 1.20 euros per share, which implies an increase
NET OPERATING RESULT OF EUR 3.54 MILLION GROWTH OF 6.3% COMPARED WITH Q1 2013
 REGULATED INFORMATION INTERIM STATEMENT UNDER EMBARGO UNTIL 15/05/2014 8.45 AM NET OPERATING RESULT OF EUR 3.54 MILLION GROWTH OF 6.3% COMPARED WITH Q1 2013 OCCUPANCY RATE OF 95% AVERAGE LEASE TERM UNTIL
Kempen conference. Amsterdam 30 May 2013
 Kempen conference Amsterdam 30 May 2013 Company snapshot Description Dutch REIT: NSI is a real estate asset management company and qualifies as fiscal investment institution under Dutch law (REIT) Full
INTERIM STATEMENT FROM THE STATUTORY MANAGER FOR THE PERIOD FROM 01/07/2012 TO 30/09/2012
 UNDER EMBARGO UNTIL 08/11/2012 8.45 AM INTERIM STATEMENT FROM THE STATUTORY MANAGER FOR THE PERIOD FROM 01/07/2012 TO 30/09/2012 Net operating result 1 of EUR 2.89 million (EUR 0.51 per share), compared
Montea Space for Growth
 Montea Space for Growth 1 Table of content About Montea Real estate portfolio Space for Growth: Main objectives & Pipeline Financials Outlook 2 About Montea REIT listed on the NYSE Euronext Brussels &
Open minds, open spaces
 Open minds, open spaces A presentation by Laurent Carlier, CFO of Befimmo 18 November 2017 Finance Avenue Speaker Laurent Carlier > CFO of Befimmo since 2006 > 17 years of experience as Finance Director
NET OPERATING RESULT OF EUR 6.91 MILLION (EUR 1.02 PER SHARE)
") REGULATED INFORMATION HALF-YEARLY FINANCIAL REPORT UNDER EMBARGO UNTIL 21/08/2014 08.45 AM NET OPERATING RESULT OF EUR 6.91 MILLION (EUR 1.02 PER SHARE) GROWTH OF 3.0% COMPARED WITH THE SAME PERIOD LAST
REGULATED INFORMATION HALF-YEARLY FINANCIAL REPORT UNDER EMBARGO UNTIL 21/08/2014 08.45 AM NET OPERATING RESULT OF EUR 6.91 MILLION (EUR 1.02 PER SHARE) GROWTH OF 3.0% COMPARED WITH THE SAME PERIOD LAST
Press Release 2006 Wednesday 21 February 2007, 7:30 AM
 Press Release 2006 Wednesday 21 February 2007, 7:30 AM OPERATING PROFIT OVER 2006 ROSE BY OVER 10% TO 22.3 MILLION EURO TOTAL GROSS DIVIDEND OVER 2006 OF 2.47 EURO PER SHARE (2.10 EURO NET) FURTHER DEVELOPMENT
FIRST SIX MONTHS OF 2018
 FIRST SIX MONTHS OF 2018 In the first half of 2018, Qrf City Retail focused on the optimization of the existing portfolio and on divesting nonstrategic properties. In this context, Qrf City Retail has
INTERIM STATEMENT BY THE MANAGER FOR THE PERIOD
 Regulated information INTERIM STATEMENT BY THE MANAGER FOR THE PERIOD 01.01.2017 31.03.2017 EPRA Earnings for Q1 2017 amounts to 25.6 million euros, an increase of 15% compared to Q1 2016. The EPRA Earnings
NET OPERATING RESULT OF EUR 6.71 MILLION (EUR 1.02 PER SHARE)
") REGULATED INFORMATION UNDER EMBARGO UNTIL 22/08/2013 8.45 am NET OPERATING RESULT OF EUR 6.71 MILLION (EUR 1.02 PER SHARE) GROWTH OF 21.9% COMPARED WITH THE SAME PERIOD LAST YEAR ON COURSE TO ACHIEVE A
REGULATED INFORMATION UNDER EMBARGO UNTIL 22/08/2013 8.45 am NET OPERATING RESULT OF EUR 6.71 MILLION (EUR 1.02 PER SHARE) GROWTH OF 21.9% COMPARED WITH THE SAME PERIOD LAST YEAR ON COURSE TO ACHIEVE A
Interim financial report
 Interim financial report Regulated information 2016 INTERIM FINANCIAL REPORT The net current result for H1 2016 amounts to 48.7 million euros or 2.62 euros per share, which implies an increase per share
Amsterdam Schiphol 1 August Half-year results 2013
 Amsterdam Schiphol 1 August 2013 Half-year results 2013 Introduction CFO Pieter Roozenboom Age 41 Nationality Dutch 2010 2013 CEO Merin (former Uni-Invest Holding) a.o. restructuring CMBS, equity and syndicated
2017 HALF YEAR 25 JULY 2017
 2017 HALF YEAR RESULTS 25 JULY 2017 Strong financial results and robust balance sheet Driving performance through operational excellence and disciplined capital allocation High quality pipeline of growth
PRESS RELEASE REGULATED INFORMATION Under embargo until 14/05/ PM
 PROVISIONAL STATEMENT OF THE STATUTARY MANAGER FOR THE PERIOD FROM 01/01/2009 TO 31/03/2009 Net current result 1 increases by 18.7% to EUR 2.07 million (EUR 0.58 per share) compared to EUR 1.75 million
Montea is on course to maintain the net operating result/share of 2010
 half-yearly FINANCIAL REPORT Net operation result w EUR 4,86 Mio w +29,0% compared with 30/06/2010 Montea is on course to maintain the net operating result/share of 2010 Occupancy ratio 95,4% Improvement
Interim financial report 2010
 Interim financial report 2010 Contents 4 Key figures and notes 10 Chairman s message to the shareholders 12 Interim management report 20 Outlook 21 Review of the semi-industrial and logistics property
Chairman s letter to the shareholders
 Interim financial report 2012 Content 4 1. Chairman s letter to the shareholders 6 2. Interim management report 6 1. Consolidated key figures 7 2. Notes to the consolidated results for the first six months
Investor presentation 9M 2012 results
 Investor presentation 9M 2012 results Key results: stabilising in Q3 Direct result p/s: 3.05 (-17.6% yoy) Q3: + 0.01 vs Q2 Revaluation portfolio: -4.75% Q3: -0.25% NAV p/s: 63.72 (-12.9% yoy) Q3: +0.4%
PRESS & ANALYST MEETING
 BEYOND REAL ESTATE PRESS & ANALYST MEETING 2 HALF YEAR RESULTS 31 July 2018 3 Agenda 1. Nature of the portfolio 2. Important activities & developments in 2018 3. Financial results 30 June 2018 4. Property
Q HIGHLIGHTS MEUR MEUR % MEUR MEUR 48.4 MEUR 94.8 MEUR % 1.87% +2.2% +1.9 PP +3.5% +73.8% + >100% +19.9% +81.
 Q1-2 2018 HIGHLIGHTS STRENGTHENED OPERATING PERFORMANCE Occupancy rate 94.7% Rental income MEUR 119.0 Rental income lfl MEUR 98.2 +1.9 PP +3.5% +2.2% KPIs SIGNIFICANTLY IMPROVED Results of AM MEUR 94.8
2,50 2,00 1,50 1,00 100% 98% 96% 94% 92% 90% 88% 86%
 Regulated information embargo till 17/02/2009, 12.30 Annual results 2008 Gross dividend per share: 2,14 (+ 46 %) Operating distributable result of Intervest Retail increases with 46 % Value increase of
PRESS RELEASE INTERMEDIATE DECLARATION OF THE BOARD OF DIRECTORS FOR THE PERIOD FROM TO
 INTERMEDIATE DECLARATION OF THE BOARD OF DIRECTORS FOR THE PERIOD FROM 01.01.2014 TO 31.03.2014 Net current result per share Group share (excluding IAS 39 impact) of 1.74 at 31.03.2014 - Compared to a
Results HALF-YEAR. Presentation of 30 August 2011
 Results HALF-YEAR 2011 Presentation of 30 August 2011 1 Summary Affine Group Property portfolio Development of group companies Analysis of 1H11 accounts A robust financial model Affine on the stock market
> Financing costs sharply down by 38.6% or MEUR 10.3 to MEUR due to successful refinancing measures undertaken in FY 2017
 Q1 - HIGHLIGHTS PORTFOLIO EFFICIENCY ON VERY ROBUST LEVEL COST SAVINGS AND IMPROVED KPIs > Occupancy rate stable at record level of 94.2% > Adjusted rental income (like-for-like) rose 3.7% > Overall rental
Interim statement of the board of directors as at 30 September 2015 on the third quarter of financial year 2015
 Regulated information - embargo till 27.10.2015, 8.00 am Antwerp, 27 October 2015 Interim statement of the board of directors as at 30 September 2015 Strategic focus on premium city high street shops continues
INTERIM STATEMENT BY THE MANAGER FOR THE PERIOD
 Regulated information INTERIM STATEMENT BY THE MANAGER FOR THE PERIOD 01.07.2017 30.09.2017 The EPRA Earnings for the first nine months of 2017 amount to 90.0 million euros, an increase of 19% compared
ASX CEO CONNECT PRESENTATION. Viva Energy REIT ASX CEO Connect Presentation 29 March 2018
 ASX CEO CONNECT PRESENTATION Viva Energy REIT ASX CEO Connect Presentation 29 March 2018 AGENDA Highlights 4 Financial Results 7 Portfolio Update 11 Industry Update 18 Strategy & Outlook 20 Questions &
Investor presentation Q results
 Investor presentation Q1 2011 results Recent highlights Successful issue of US$ 300m senior notes (US private placement) Sale non-strategic assets in UK of 15.1m, 7% above latest valuation Sale of a further
Investor presentation H results
 Investor presentation H1 2011 results Recent highlights New lettings in Belgian and US office portfolio. Occupancy rate improving Heads of terms agreed for hotel in Eilan-project: 20 yr fixed lease, operator
Befimmo SA. European Real Estate Society. March 11, 2016 ERES Seminar
 Befimmo SA European Real Estate Society March 11, 2016 ERES Seminar Befimmo 20-year track record in quality offices > Leading Belgian REIT (SIR/GVV) > Pure player in quality offices, located in Belgium
Kempen European Property Seminar 30 May 2012 in Amsterdam
 Kempen European Property Seminar 30 May 2012 in Amsterdam Profile Top 3 listed Dutch mixed real estate fund Dutch REIT / Listed on Amsterdam Euronext (Midkap AMx) Portfolio: 2.29bn TRI: 203m Outstanding
The Everton Park Hotel, Brisbane
 The Everton Park Hotel, Brisbane Annual Results Briefing 30 June 2017 Important Notice This presentation has been prepared by Hotel Property Investments Limited as Responsible Entity of the Hotel Property
EGULATED INFORMATION INTERIM REPORT FROM THE STATUTORY MANAGER
 ² REGULATED INFORMATION INTERIM REPORT FROM THE STATUTORY MANAGER EPRA EARNINGS OF 7.1 MILLION ( 0.61 PER SHARE) FOR THE FIRST 3 MONTHS OF 2018 NET RENTAL INCOME OF 11.1 MILLION FOR THE FIRST 3 MONTHS
Amsterdam Schiphol 25 July Half-year results 2014
 Amsterdam Schiphol 25 July 2014 Half-year results 2014 Highlights Financial performance H1 2014 H1 2013 Direct result per share 1.73 1.76 Indirect result per share (1.50) (1.15) EPRA NAV per share 62.48
NET OPERATING RESULT EUR 5.51 MILION (EUR 0.98 PER SHARE)
") EMBARGO UNTIL 23/08/2012 8:45 AM NET OPERATING RESULT EUR 5.51 MILION (EUR 0.98 PER SHARE) INCREASE OF 13.4% COMPARED WITH THE SAME PERIOD LAST YEAR ON COURSE TO MAINTAIN A NET OPERATING RESULT PER SHARE
EMBARGO UNTIL 23/08/2012 8:45 AM NET OPERATING RESULT EUR 5.51 MILION (EUR 0.98 PER SHARE) INCREASE OF 13.4% COMPARED WITH THE SAME PERIOD LAST YEAR ON COURSE TO MAINTAIN A NET OPERATING RESULT PER SHARE
INTERIM STATEMENT ON THE THIRD QUARTER 2009
 Regulated information embargo 02/11/2009, 17:45 INTERIM STATEMENT ON THE THIRD QUARTER 2009 of the board of directors for the period 01.07.2009 to 30.09.2009 Operating distributable result improves by
CONTENT. 01 Highlights. 02 Portfolio Performance. 03 Optimisation of Financing Structure. 04 FY 2017 Results. 05 Outlook FY
 CONTENT 01 Highlights 02 Portfolio Performance 03 Optimisation of Financing Structure 04 FY 2017 Results 05 Outlook FY 2017 2 IMMOFINANZ RESTRUCTURING 5/2015 12/2017 Sale of logistics asset class - focus
Annual Communiqué Announcement of annual results 11/12/ /12/2015
 Annual Communiqué Announcement of annual results 11/12/2015-31/12/2015 Successful launch for Xior Antwerp, Belgium 7 March 2016 Annual results 11/12/2015 to 31/12/2015 I. SUMMARY Xior was successfully
Regional REIT. Asset growth and refinancing completed. Further portfolio growth and diversification. Acquisition benefit offset by underlying revision
 Regional REIT Asset growth and refinancing completed Completion of acquisitions Real estate RGL s acquisition of two property portfolios, first announced in early December, for an aggregate consideration
June 30, Bank Degroof 11/09/2009
 Full Year Results June 30, 2009 Bank Degroof 11/09/2009 Table of contents Achievements Portfolio analysis Financial review Shares and shareholders Outlook Conclusion 2 Growth strategy in Belgium Unfurnished
Full Year Aalberts Industries more than doubles earnings per share
 Full Year 2010 Aalberts Industries more than doubles earnings per share Today s agenda Headlines 2010 Profile Objectives Financial review Operational developments The Aalberts Industries share Outlook
PRESS RELEASE. Friday 26 October 2018, am Regulated information. Press release 26 October 2018
 PRESS RELEASE Friday 26 October 2018, 07.00 am Regulated information 1 Interim statement of the manager on 30 September 2018 The EPRA Earnings for 9M 2018 amounts to 101.2 million euros, an increase of
Hansteen. Full Year Results to 31 December Tilburg, Netherlands
 Hansteen Full Year Results to 31 December 2016 Tilburg, Netherlands Contents Introduction Hansteen 2016 results Sale announcement Sale of German and Dutch Portfolio 2016 Annual Results 2016 Property Performance
Cofinimmo: Investing in diversified listed real estate. by Marc Hellemans, CFO
 Cofinimmo: Investing in diversified listed real estate by Marc Hellemans, CFO Tour & Taxis, June 1 st, 2013 Cofinimmo in a nutshell Leading Belgian listed real estate company, exposed to: The office property
Press release nine months results 2010 VASTNED RETAIL REALISES STABLE DIRECT INVESTMENT RESULT AND POSITIVE VALUE MOVEMENTS IN PROPERTY PORTFOLIO
 Press release nine months results VASTNED RETAIL REALISES STABLE DIRECT INVESTMENT RESULT AND POSITIVE VALUE MOVEMENTS IN PROPERTY PORTFOLIO Reinier van Gerrevink, CEO VastNed Retail: The letting market
FINANCIALS. Arnaud Laviolette Group CFO. Investor day 13 December 2017
 FINANCIALS Arnaud Laviolette Group CFO ACTIVITIES ARE FINANCED INDEPENDENTLY EUR million 30 June 2017 AUTO BELRON MOLESKINE GROUP Loans & borrowings 189.9 708.8 189.6 1,088.3 Inter-group -330.2 180.5 149.7
ANALYST PRESENTATION 1H 2018
 ANALYST PRESENTATION 1H 2018 ABOUT QRF CITY RETAIL BE-REIT in inner-city retail WE INVEST IN, (RE)DEVELOP AND RENT OUT PRIME RETAIL REAL ESTATE IN THE GOLDEN MILE OF BELGIAN AND DUTCH CITIES > 90.000 m²
2018 INTERIM FINANCIAL REPORT
 2018 INTERIM FINANCIAL REPORT Wednesday 1 August 2018, 7.00 am Regulated information 1 fbredf 2018 Interim financial report The EPRA Earnings for H1 2018 amount to 65.1 million euros, an increase of 14%
Aldermore Banking as it should be UK Challenger Bank Day
 Aldermore Banking as it should be UK Challenger Bank Day 09 June 2015 Banking as it should be SME focused bank Customer loans 1 22% Asset Finance Track record of accelerating profitability Invoice Finance
HIGHLIGHTS PROPERTY FOR INDUSTRY 2017 ANNUAL RESULTS BRIEFING
 HIGHLIGHTS Significant acquisition activity: $84.3 million of property acquired, improving portfolio metrics and providing significant medium to long-term development potential Transition of the Penrose
FLOW TRADERS CONTINUES TO GROW ITS MARKET FOOTPRINT AND TO ROLL OUT STRUCTURAL GROWTH STRATEGY
 For immediate release FLOW TRADERS CONTINUES TO GROW ITS MARKET FOOTPRINT AND TO ROLL OUT STRUCTURAL GROWTH STRATEGY Amsterdam, the Netherlands, 24 October 2017, 07:30 hrs Amsterdam Time - Flow Traders
2009 Half-Year Results. 3 August 2009
 2009 Half-Year Results 3 August 2009 John Nelson, Chairman 2 Agenda Introduction John Richards Financial Results Simon Melliss France Christophe Clamageran UK David Atkins Summary and Conclusion John Richards
FY2014 Financial Results Presentation
 FY2014 Financial Results Presentation 16 January 2015 16 International Business Park Important Notice This material shall be read in conjunction with CIT s results announcements for the financial period
9M 2018 RESULTS 09 NOVEMBER 2018 TLG IMMOBILIEN AG 9M 2018 RESULTS
 TLG IMMOBILIEN AG 9M 208 RESULTS DISCLAIMER This presentation includes statements, estimates, opinions and projections with respect to anticipated future performance of TLG IMMOBILIEN ("Forward-Looking
HIGHLIGHTS PROPERTY FOR INDUSTRY 2017 INTERIM RESULTS BRIEFING
 HIGHLIGHTS Internalisation of management on 30 June 2017 Increased guidance: distributable profit of between 7.70 and 7.90 cents per share, cash dividend of 7.45 cents per share Transition of the Penrose
Earnings, Balance Sheet and Cash Flow Analysis
 IMMOFINANZ AG Financial Report on the first three quarters of the 2017 Financial Year Earnings, Balance Sheet and Cash Flow Analysis General information: Due to the harmonisation of the financial year
FY2015 Financial Results Presentation
 FY2015 Financial Results Presentation 14 January 2016 16 International Business Park 2 Content Executive Summary Financial Summary Real Estate Highlights Financial & Capital Management Highlights Appendix
Press and analyst meeting. Annual figures Tuesday 23 February 2010
 Press and analyst meeting Annual figures 2009 Tuesday 23 February 2010 AGENDA 1. Description of the portfolio 2. Important facts of 2009 3. Financial results 31.12.2009 4. Real estate market 5. Outlook
Q Dream Industrial REIT
 Q2 2017 Dream Industrial REIT Table of contents Management s discussion and analysis 1 Condensed consolidated financial statements 38 Notes to the condensed consolidated financial statements 42 Corporate
Financial Results for the Quarter / Year Ended 31 Mar April 2012
 Financial Results for the Quarter / Year Ended 31 Mar 2012 19 April 2012 Disclaimer This Presentation is focused on comparing results for the three months ended 31 Mar 2012 versus results achieved in the
REAL ESTATE PATRIMONY Total lettable surface area (m²) Debt ratio RD 21 June 2006 (max. 65%) (%) 39 % 43 %
 Debt ratio RD 21 June 2006 (max. 65%) (%) 39 % 43 %") Regulated information embargo 03/11/2008, 17:45 Interim statement for the third quarter of 2008 of the board of directors covering the period 01.07.2008 to 30.09.2008 Positive results for Intervest Retail
Regulated information embargo 03/11/2008, 17:45 Interim statement for the third quarter of 2008 of the board of directors covering the period 01.07.2008 to 30.09.2008 Positive results for Intervest Retail
INVESTOR PRESENTATION
 INVESTOR PRESENTATION Table of Contents Introduction to SEGRO 3 Market drivers 10 High quality development pipeline 15 Balance sheet and financing 21 Operating performance 26 Portfolio overview 30 APP
HALF-YEARLY FINANCIAL REPORT
 of the board of directors for the period 01.01 to 30.06.2009 1 Regulated information embargo 04/08/2009, 12:30 Antwerp, 4 August 2009 Operating distributable result increases by 12 % Value decrease real
HIGHLIGHTS PROPERTY FOR INDUSTRY 2018 INTERIM RESULTS BRIEFING
 HIGHLIGHTS Significant portfolio activity: 58,000 square metres or 8% of the portfolio leased during the interim period to 11 tenants for an average increase in term of 6.5 years Increased earnings and
HALF-YEAR 2018 RESULTS IR-PRESENTATION 30 AUGUST 2018
 HALF-YEAR 2018 RESULTS IR-PRESENTATION 30 AUGUST 2018 1 Disclaimer This communication contains specific forward-looking statements, beliefs or opinions, including statements with respect to objectives,
half-yearly financial report
 half-yearly financial report of the board of directors for the period 01.01 to 30.06.2010 Regulated information - embargo 03/08/2010, 8.30 am Antwerp, 3 August 2010 Operating distributable result decreases
Half-yearly financial report
 Regulated information - embargo till 29/07/2014, 8:00 Antwerp, 29 July 2014 Increase of operating distributable result to 1,34 per share ( 1,32 in the first semester of 2013) Slight increase in fair value
KION UPDATE CALL Q Gordon Riske, CEO Thomas Toepfer, CFO Wiesbaden, 7 May 2015
 KION UPDATE CALL 2015 Gordon Riske, CEO Thomas Toepfer, CFO Wiesbaden, 7 May 2015 AGENDA 1 Highlights Gordon Riske 2 Market update Gordon Riske 3 Financial update Thomas Toepfer 4 Outlook Gordon Riske
HALF-YEARLY FINANCIAL REPORT FROM 01/01/2018 TO 30/06/2018
 REGULATED INFORMATION STATUTORY MANAGER S INTERIM STATEMENT EMBARGO UNTIL 21/08/2017 08:45 AM HALF-YEARLY FINANCIAL REPORT FROM EPRA EARNINGS OF 16.0 MILLION IN H1 2018 EPRA EARNINGS PER SHARE OF 1.35
Hansteen. Half Year Results to 30 June Castrop-Rauxel, Germany
 Hansteen Half Year Results to 30 June 2016 Castrop-Rauxel, Germany Introduction Hansteen - Pan European Real Estate Investment Trust (REIT) Pan European REIT Five countries Regional teams in 15 offices
Agenda. About IREIT Global. Key Highlights. Portfolio Summary. Economy & Real Estate Review. Looking Ahead. Appendix : Overview of Tikehau Capital
 4Q 2017 and FY 2017 Results Presentation 14 February 2018 Agenda About IREIT Global Key Highlights Portfolio Summary Economy & Real Estate Review Looking Ahead Appendix : Overview of Tikehau Capital 2
Next Generation Real Estate. HY 2008 Figures. Colonia Real Estate AG HY 2008 Figures 15 th of August 2008 Cologne
 Next Generation Real Estate HY 2008 Figures Colonia Real Estate AG HY 2008 Figures 15 th of August 2008 Cologne Focused and Integrated Business Model Colonia Real Estate AG Investments Management Principal
Oosterhamrikkade Groningen 180 units Annual results 2017 Xior Stu d ent Hou sin g 9 Feb r u ar y 2018
 Oosterhamrikkade Groningen 180 units Annual results 2017 Xior Student Housing 9 February 2018 Disclaimer This presentation has been prepared by the management of XIOR STUDENT HOUSING NV (the "Company")
MAPLETREE LOGISTICS TRUST S 3Q FY13/14 DISTRIBUTION PER UNIT RISES 7% YEAR-ON-YEAR
 For Immediate Release MAPLETREE LOGISTICS TRUST S 3Q FY13/14 DISTRIBUTION PER UNIT RISES 7% YEAR-ON-YEAR Highlights: Amount Distributable to Unitholders registered 8% year-on-year growth Results underpinned
Hong Kong Non-Deal Roadshow Hong Kong, 4 March International Business Park
 Hong Kong Non-Deal Roadshow Hong Kong, 4 March 2016 16 International Business Park 2 Content CIT FY2015 Results Executive Summary Financial Summary Real Estate Highlights Financial & Capital Management
CLSA Asean Forum Bangkok, March International Business Park
 CLSA Asean Forum Bangkok, March 2016 16 International Business Park 2 Content Overview of CIT CIT FY2015 Financial Results Overview Financial & Capital Management Highlights Real Estate Highlights Singapore
For personal use only
 ACN 072 507 147 ASX & MEDIA RELEASE 25 May 2017 THORN FY17 KEY NUMBERS UP, ISSUES BEING ADDRESSED Consumer leasing and business finance company, Thorn Group Limited (ASX: TGA), has lifted revenue, EBIT
CITYCON CAPITAL MARKETS DAY 16 MAY 2017, ISO OMENA CFO, EERO SIHVONEN
 STRONG FINANCING FUNDAMENTALS CITYCON CAPITAL MARKETS DAY 16 MAY 2017, ISO OMENA CFO, EERO SIHVONEN MAIN FINANCING TARGETS Loan to Value 40-45% 47.1% Average maturity of loan portfolio > 5 yrs 5.2 Debt
MILLION (+1.0%) VALUE INCREASE VASTNED RETAIL PROPERTY PORTFOLIO IN Q1 2011; DIRECT INVESTMENT RESULT MARGINALLY DOWN
 VALUE INCREASE VASTNED RETAIL PROPERTY PORTFOLIO IN Q1 2011; DIRECT INVESTMENT RESULT MARGINALLY DOWN") Press release first quarter figures 2011 20 MILLION (+1.0%) VALUE INCREASE VASTNED RETAIL PROPERTY PORTFOLIO IN 2011; DIRECT INVESTMENT RESULT MARGINALLY DOWN Reinier van Gerrevink, VastNed Retail CEO:
Press release first quarter figures 2011 20 MILLION (+1.0%) VALUE INCREASE VASTNED RETAIL PROPERTY PORTFOLIO IN 2011; DIRECT INVESTMENT RESULT MARGINALLY DOWN Reinier van Gerrevink, VastNed Retail CEO:
Regional REIT. Retail eligible bond 4.5% Regional markets have remained robust. Retail eligible bond offering. Launch of bond issue.
 Regional REIT Retail eligible bond 4.5% 2024 Launch of bond issue Real estate Despite continuing Brexit uncertainty and some slowing of UK economic growth regional property markets have remained robust
EVS Broadcast Equipment. FY13 results
 EVS Broadcast Equipment FY13 results February 20, 2014 Joop JANSSEN, Managing Director & CEO Magdalena BARON, CFO Geoffroy d OULTREMONT, VP Investor Relations and Corporate Communication www.evs.com 2
PRESENTING TODAY. Craig Peirce Chief Finance and Operating Officer. Simon Woodhams Chief Executive Officer
 PRESENTING TODAY Simon Woodhams Chief Executive Officer Craig Peirce Chief Finance and Operating Officer 2 2018 HIGHLIGHTS Increased earnings and dividends: profit after tax up $58.4 million, 3.2% increase
6 th Annual General Meeting 24 April International Business Park
 6 th Annual General Meeting 24 April 2015 16 International Business Park Important Notice This material shall be read in conjunction with CIT s results announcements for the financial period ended 31 December
MAPLETREE LOGISTICS TRUST S 1Q FY14/15 DISTRIBUTION PER UNIT RISES 6% to 1.90 CENTS
 For Immediate Release MAPLETREE LOGISTICS TRUST S 1Q FY14/15 DISTRIBUTION PER UNIT RISES 6% to 1.90 CENTS Highlights: 6% year-on-year growth in amount distributable to Unitholders to S$46.6 million Recent
Singapore Investor Roadshow
 Singapore Investor Roadshow 11 May 2015 16 International Business Park Important Notice This material shall be read in conjunction with CIT s results announcements for the financial period ended 31 December