Full Year Revenue more than EUR 2 billion and 5% higher operating profit (EBITA)
|
|
|
- Cameron Alvin Pitts
- 5 years ago
- Views:
Transcription

1 Full Year 2012 Revenue more than EUR 2 billion and 5% higher operating profit (EBITA)

2 Today s agenda Strategy 2012 Headlines Financial review Operational developments Industrial Services Flow Control Objectives & Outlook Questions & Answers FY2012 2
3 Strategy


4 Description of businesses Building Installations Europe Building Installations North America Climate Control Flow Control Industrial Oil & Gas Industrial Services Regulation and distribution of (warm) water and gas in heating, cooling, water and gas systems Regulation and distribution of (warm) water and gas in heating, cooling, water and gas systems Complete systems from source to emission to improve climate control, energy efficiency and comfort for heating & cooling systems Regulation, control and distribution of fluids and gas systems in more severe conditions Supply of highgrade tailor made products, systems and processes for specific market segments FY2012 4


chemical Mining Oil & gas production")

5 Main markets Building Installations Europe Building Installations North America Climate Control Flow Control Industrial Oil & Gas Industrial Services Commercial/ residential new build Renovation & Repair Sprinkler Utility Commercial/ residential new build Renovation & Repair Fire protection Retail Irrigation / Pool & spa / Golf Commercial and residential buildings New & renovation Shipbuilding Industrial buildings Pulp & paper Food & beverage Power Marine (Petro)chemical Mining Oil & gas production transmission and distribution LNG Shale gas/oil Semiconductor Automotive Oil & gas Turbine & aerospace Machine building Metal & electronics FY2012 5


")
6 Market approach of business Building Installations Europe Building Installations North America Climate Control Flow Control Industrial Oil & Gas Industrial Services Market segmentation Installers, contractors & wholesalers Using local sales platforms Market segmentation Installers, contractors & wholesalers Using local sales platform Architects, specifyers & contractors Specification system sales Worldwide project tracking Market segmentation (Global) key accounts Market segmentation Local customers (Global) key accounts FY2012 6
7 Aalberts Industries - Linked Building Installations Europe Innovation Portfolio Flow Control Industrial Oil & Gas Portfolio (Material) Technology development Industrial Services Key account management Best practices Portfolio Projects Product development Supply Climate Control Projects Portfolio Building Installations North America Cross-selling FY2012 7
8 Growth drivers
9 Building Installations Europe Growth drivers 1. Installation efficiency and know-how Metal and plastic piping systems for: a safer, quicker, easier and user friendly installation an optimal connection of all kind of pipe materials Combined with specified control valves 2. Consolidation of contractors and wholesalers Complete offering of connect & control systems % of total revenue Leverage portfolio, using strong local brand name, distribution and service Driving of international product brands, worldwide 31% FY2012 9


10 Project tracking: Crystal Peaks Shopping Mall & Retail Park Sheffield Fit out of a new Marks & Spencer retail store MARKET SEGMENT Commercial PRODUCT LINES INSTALLED SERVICES Heating Potable water MARKET APPROACH Contractor (Simons Group) Building Installations Europe Installation efficiency FY

 Building Installations Europe Installation")
11 Project tracking: Quarry Gardens Portadown 26 Flats, replacement of Economy 7 heating system MARKET SEGMENT Residential PRODUCT LINES INSTALLED SERVICES Heating MARKET APPROACH Contractor (Fusion Heating) Building Installations Europe Installation efficiency FY
12 Building Installations North America % of total revenue Growth drivers 1. Installation efficiency and know-how Metal and plastic piping systems for: A safer, quicker, easier and user friendly installation An optimal connection of all kind of pipe materials Combined with specified control valves 2. Consolidation of contractors and wholesalers Complete offering of connect & control systems Leverage portfolio, using strong local brand name, distribution and service Driving of international product brands, worldwide 14% FY
13 Climate Control Growth drivers 1. Energy efficiency, saving & comfort of heating & cooling systems Specification and engineering of complete systems from source to emission using international product brands Making use of local regulation and requirements per country 2. Combining with metal and plastic piping systems to complete the climate control system (one specification/offering) % of total revenue 3. Consolidation of contractors & specifyers Complete solution for climate control Lesser suppliers per project 13% FY

")


14 Project tracking: Naturparkhaus Waltersdorf Renovation of 300 m 2 half-timbered house (1409) MARKET SEGMENT Commercial PRODUCT LINES INSTALLED SERVICES Heat distribution MARKET APPROACH Contractor Climate Control From source to emission FY


15 Project tracking: Botanic Garden Aarhus Renovation & new build of greenhouses (5.000 m 2 ) MARKET SEGMENT Residential PRODUCT LINES INSTALLED SERVICES Heat distribution Drinking water MARKET APPROACH Contractor Climate Control From source to emission FY


16 Project tracking: Quai Ste Hélène Saint André 160 low-energy consumption apartments MARKET SEGMENT Residential PRODUCT LINES INSTALLED SERVICES Heat distribution Drinking water MARKET APPROACH Contractor Climate Control From source to emission FY

17 Flow Control Industrial Oil & Gas % of total revenue Growth drivers 1. More severe conditions in end user markets Higher pressures lower and/or higher temperatures Temperature and pressure control Process system control 2. Consolidation of supply Complete offering of connect & control systems 3. Globalisation of key accounts Supply chain, manufacturing in every part of the world Global standards, local service 4. Development of new resources LNG / Shale gas / Shale oil 13% FY
 tailor made solutions Development and engineering of new products Improvement of material usage /")
 partnership")
18 Industrial Services Growth drivers 1. Continuous innovation of (local) tailor made solutions Development and engineering of new products Improvement of material usage / technology (Sub)assembly and testing of modules 2. Combined technologies for strategic partners Optimising supply chain, contacts for customers Stable (and strong financial) partnership with same quality Key account management 3. Globalisation of key accounts Supply chain, manufacturing in every part of the world Global standards, local service % of total revenue 29% FY
19 2012 Headlines

20 Headlines 2012 Revenue 5% to EUR 2,025 million Operating profit (EBITA) 5% to EUR million Net profit before amortisation 4% to EUR million Earnings per share before amortisation 3% to EUR 1.40 Cash flow from operations 9% to EUR million Capital expenditure 23% to EUR million Industrial Services: revenue 3% and good profitability maintained Flow Control: revenue 5% and operating profit (EBITA) 8% FY
21 Financial headlines
22 Financial headlines Added-value margin maintained at 59.1% Lower net interest expense due to reduced leverage ratio and lower interest rates Higher effective tax rate of 25.2% compared to 2011 (21.6%) Continuous focus on Return on Capital Employed Net working capital slightly to 18.3% of revenue (17.3%) Balance sheet ratios improved further (leverage ratio ) No refinancing need due to repayments of bank loans from free cash flow: 2013: EUR 124 million 2014: EUR 105 million 2015: EUR 76 million After 2015: EUR 64 million USD currency 8.2% average rate and 1.9% end of December GBP currency 6.9% average rate and 2.4% end of December FY
23 Key figures in graphs 1 Revenue (EURm) 5% EBITA 5% Net profit (EURm) 4% EPS (EUR) 3% ,51 1,02 1,10 1,40 1,36 FY
24 Key figures in graphs 2 Cash flow (EURm) 6% Working capital (EURm) 7% Capex (EURm) 23% Leverage ratio ,8 2,0 2,3 2,9 3,4 FY
25 Income statement in EUR million FY 2012 FY 2011 Δ Revenue 2, , % Added-value 1, , % Operating profit (EBITDA) % Depreciation (77.0) (70.5) 9% Operating profit (EBITA) % Net interest expense (20.5) (23.0) (11%) Other net finance cost 0.3 (3.6) - Taxes (45.9) (36.3) 26% Non-controlling interest (0.9) (0.2) - Net profit before amortisation % FY
26 Balance sheet ASSETS in EUR million Goodwill Other intangible assets Property, plant and equipment Deferred income tax assets Non-current assets 1, ,283.7 Inventories Trade receivables Other current assets Cash and cash equivalents Current assets TOTAL ASSETS 1, ,932.0 FY
27 Balance sheet EQUITY AND LIABILITIES in EUR million Total equity Non-current borrowings Employee benefit plans Deferred income tax liabilities Other provisions and long term liabilities Non-current liabilities Current borrowings Current portion of non-current borrowings Trade and other payables Other current liabilities Current liabilities TOTAL EQUITY AND LIABILITIES 1, ,932.0 FY
28 Cash flow statement in EUR million FY 2012 FY 2011 Operating profit (EBITDA) Provisions & other movements (1.4) (1.5) Changes in inventories (5.4) (20.1) Changes in trade & other receivables (6.6) 20.3 Changes in trade & other payables (11.3) (28.1) Changes in working capital (23.3) (27.9) Cash flow from operations FY
29 Cash flow statement in EUR million FY 2012 FY 2011 Net finance cost paid (23.1) (25.3) Income taxes paid (45.9) (26.8) Acquisitions (incl. earn-outs) (18.3) (110.4) Capital expenditure (100.4) (77.9) Proceeds from borrowings Repayments of borrowings (148.6) (133.8) Dividend paid (19.9) (8.5) Other movements (3.0) (3.5) Net cash flow (67.7) (33.9) FY
30 Key figures in EUR million FY 2011 FY 2010 Δ EBITA as a % of revenue Effective tax rate in % Earnings per share (EUR x 1) % Average number of shares issued % Number of employees (x 1) 12,048 12,282 Capital expenditure % Interest cover (12 months-rolling) Total equity % Total equity as a % of total assets Leverage ratio (12 months-rolling) Net debt (11%) Net debt / Total equity (Gearing) FY
31 Spread of revenue United States 389 Germany 358 Benelux 282 Eastern Europe France United Kingdom Scandinavia Spain & Portugal EURm Middle East 40 Other European countries 101 Other countries outside Europe FY
32 Spread of revenue per activity in 2012 United States Germany Benelux countries France Eastern Europe United Kingdom Scandinavia Spain & Portugal Middle East Other European countries Other countries outside Europe Flow Control Industrial Services FY
33 Operational developments Industrial Services
34 Industrial Services market developments Market Developments Semiconductor LED Semiconductor good 1H2012 Weakening 2H2012 Flattening partly offset by new technologies, new customers and engineering Activities for LED production lines remained at a low level Automotive Turbine & aerospace Oil & gas Machine building Metal & electronics Stable, high level in Germany France on lower level Investing in new product/process developments and sales Strong growth, particularly in US, France and UK Investments made/planned in these countries Sharp increase in orders and project requests Significant expansion of sales and engineering capacity Continued improvement of key account management Stable, good level Strong market position in Germany Declined of demand in France, partly offset by product developments Good developments in China and Poland FY
35 Industrial Services key figures in EUR million FY 2011 FY 2010 Δ Revenue % Operating profit (EBITDA) % EBITDA as a % of revenue Operating profit (EBITA) EBITA as a % of revenue Capital expenditure % Depreciation % Average number of employees (x1) 4,756 4,463 7% Employees at year-end (x1) 4,585 4,701 (2%) FY
36 Industrial Services key figures Revenue (EURm) 3% EBITA (EURm) = 3.7% organic Capex (EURm) 37% EBITA margin ,8 8,2 12,5 13,4 13,8 FY


37 Industrial Services Oil & Gas Parts for drilling equipment Stator tubes Stator Instrumentation bodies Knee joint (part of steering Thermal FY
38 Operational developments Flow Control
39 Flow Control market developments Market Building Installations Europe Building Installations North America Climate Control Industry Oil & Gas Developments New build continued to be difficult Renovation, repair and maintenance reasonably stable Focus on fast growing product lines Benefit from joint marketing and sales approach Increase in sales of new houses, building applications and renovations Projects in commercial building declined somewhat Growth in retail activities (plastic and metal regulator valves) Efforts concentrated on complete energy-efficient systems for heating & cooling (residential/commercial) = optimum building comfort Marketing & sales, training & education were strengthened Position strengthened in Europe, North America and Asia Upward trend in power stations, pulp & paper, (petro)chemical and food industry Substantial growth as a result of expansion of portfolio BSM Valves to contribute in strengthening market position FY
40 Flow Control key figures in EUR million FY 2012 FY 2011 Δ Revenue 1, , % Operating profit (EBITDA) % EBITDA as a % of revenue Operating profit (EBITA) % EBITA as a % of revenue Capital expenditure % Depreciation % Average number of employees (x1) 7,625 7,767 (2%) Employees at year-end (x1) 7,445 7,563 (2%) FY
41 Flow Control key figures Revenue (EURm) 5% EBITA (EURm) 8% 2.1% organic Capex (EUR) 9% EBITA margin ,8 9,5 10,0 10,1 11,3 FY

42 Flow Control Climate Control From generator to emission FY

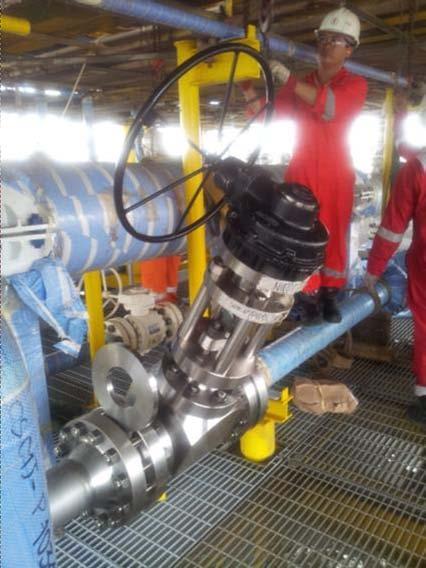
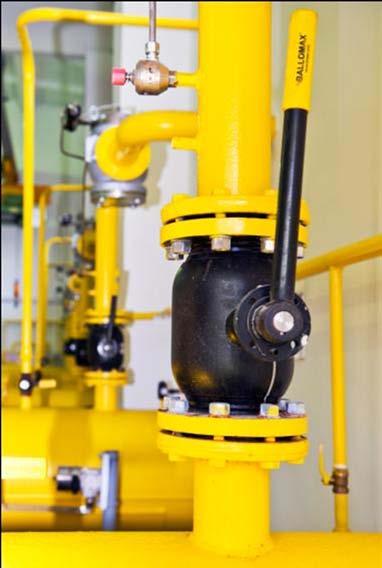
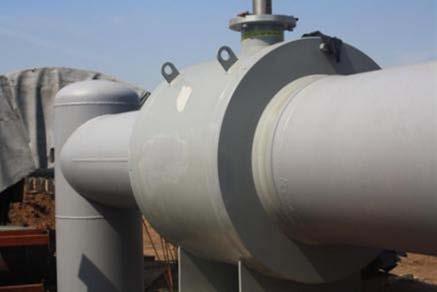
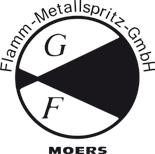
43 Flow Control Industrial Oil & Gas Valves, actuation, control systems FY
44 Objectives & Outlook


45 Objectives unchanged Organic Acquisitions CONTINUOUS GROWTH IN REVENUE WIDE SPREAD OF RESULTS Lowering risks for shareholders STABLE GROWTH OF EARNINGS PER SHARE In specific market segments LEADING MARKET POSITIONS SOLID BALANCE SHEET RATIOS Equity 30% of total assets Interest cover 4 Leverage ratio 2.5 Gearing 1.5 FY
46 Outlook In 2013 Aalberts Industries will continue strengthening the technology and product portfolio and the marketing and sales force; expand the engineering capacity, increase the production efficiency; and widen the position in specific market segments. The management is sharply focused on achieving the many plans for profitable growth and higher operational margins; complemented by acquisitions that add value and strengthen the market positions; while making the best possible use of the solid balance sheet ratios. Barring unforeseen circumstances The expectation is that this will enable revenue, profit and capital expenditure to further increase in 2013 FY
47 Questions & Answers
Full Year Aalberts Industries more than doubles earnings per share
 Full Year 2010 Aalberts Industries more than doubles earnings per share Today s agenda Headlines 2010 Profile Objectives Financial review Operational developments The Aalberts Industries share Outlook
FULL YEAR RESULTS Operating profit (EBITDA) in line with 2007
 in line with 2007") FULL YEAR RESULTS 2008 Operating profit (EBITDA) in line with 2007 Today s agenda Highlights Profile Objectives Financial review Operational developments The Aalberts Industries share Outlook Questions
FULL YEAR RESULTS 2008 Operating profit (EBITDA) in line with 2007 Today s agenda Highlights Profile Objectives Financial review Operational developments The Aalberts Industries share Outlook Questions
Net profit and earnings per share +12%
 Net profit and earnings per share +12% Langbroek, 28 February 2017 Highlights o Revenue +2% to EUR 2,522 million (organic +1.1%) o Operating profit (EBITA) +10% to EUR 298 million; EBITA-margin 11.8% o
highlights key figures dividend outlook organic revenue growth +5% earnings per share +16% continued investments in growth and innovations
 organic revenue growth +5% earnings per share +16% continued investments in growth and innovations Utrecht, 26 February 2019 highlights revenue +2% to EUR 2,759 million (organic +5%) operating profit (EBITA)
Intertek Investor Presentation April 2013
 Intertek Investor Presentation April 2013 aston.swift@intertek.com sarah.ogilvie@intertek.com +44 (0)20 7396 3400 1 Cautionary statement regarding forward-looking statements This presentation contains
Aalberts Industries posts 17% rise in net profit, revenue more than EUR 1 billion
 date 28 February 2006 more information J. Aalberts phone +31 (0)343 565 080 e-mail info@aalberts.nl Aalberts Industries posts 17% rise in net profit, revenue more than EUR 1 billion 2005 good year with
1. Consolidated balance sheet Inventories Consolidated income statement Consolidated statement of comprehensive income 50
 1. Consolidated balance sheet 48 12. Inventories 63 2. Consolidated income statement 49 13. Trade receivables 63 3. Consolidated statement of comprehensive income 50 14. Other current assets 64 4. Consolidated
ROADSHOW POST-Q2 & H RESULTS. September 2016
 ROADSHOW POST-Q2 & H1 2016 RESULTS September 2016 1. COMPANY OVERVIEW Rexel at a glance : Strategic partner for suppliers and customers Energy Providers Suppliers Customers Endusers Economies of scale
H Aalberts Industries N.V.
 H1 2004 Aalberts Industries N.V. 1 Agenda Highlights H1 2004 Profile Strategy Financial review Operational review The Aalberts Industries share Outlook H1 2004 2 Highlights H1 2004 7% organic growth in
Interim announcement 1 st quarter 2016
 Interim announcement 1 st quarter 2016 Danfoss at a glance Danfoss engineers technologies that enable the world of tomorrow to do more with less. We meet the growing need for infrastructure, food supply,
Half year results TKH Group NV
 Half year results 2014 TKH Group NV 1 Half year results 2014 19-08-2014 Content 1 About TKH Group 2 Developments 1 st half year 2014 3 Notes to the results 1 st half year 2014 4 Strategic developments,
2017 Interim Results Presentation
 2017 Interim Results Presentation 28 th July 2017 www.morganadvancedmaterials.com Agenda Introduction and key highlights Pete Raby 2017 interim results Peter Turner Operational and strategic update Pete
Quarterly Report 01/2018
 Q1 Quarterly Report 01/2018 CENTROTEC The European Energy-Saving Company Highlights > International expansion continues; stable development in German heating market > Group revenue up 1.5% on prior-year
P R E S S R E L E A S E
 P R E S S R E L E A S E from ASSA ABLOY AB (publ) 27 April 2004 No. 5/04 ASSA ABLOY Q1: ORGANIC GROWTH AND IMPROVED MARGINS IN ALL DIVISIONS Sales in the first quarter increased organically by 3% to SEK
Delivered 60 million of validated cost savings to our customers
 2013 Preliminary Results For the year ended 31 December 2013 Continued progress in difficult markets Delivered 60 million of validated cost savings to our customers Agenda Overview Financial highlights
Results for the first three quarters of 2010 November 8, 2010
 Results for the first three quarters of November 8, ANDRITZ GROUP /Q1 results at a glance Favorable business development in Order intake: 932 in : +11 vs. 3,236 in Q1 : +27 vs. Q1 Order backlog: 5,478
Second quarter Yet another strong quarter!
 Second quarter 2007 Yet another strong quarter! During the second quarter 2007 we had another record quarter with the highest ever operating result as well as operating margin. Orders received increased
Interim Jan-March 2007 results briefing Helsinki 26 April Jan Lång President and CEO
 Interim Jan-March 2007 results briefing Helsinki 26 April 2007 Jan Lång President and CEO Q1/2007: Positive market environment in Europe, decline in U.S. continues Lively demand for Uponor solutions Strong
Interim announcement 1st-3rd quarter 2018
 Danfoss in brief Highlights 1st-3rd quarter 2018 Financial highlights Financial update Outlook 2018 Quarterly financial highlights Interim announcement 1st-3rd quarter 2018 www.danfoss.com Contents Danfoss
Interim announcement 1st to 3rd quarter 2015
 Interim announcement 1st to 3rd quarter 2015 Danfoss at a glance Danfoss engineers technologies that enable the world of tomorrow to do more with less. We meet the growing need for infrastructure, food
2012 Preliminary Results For the year ended 31 December Proven strategy adds value to customers, delivers growth and increases resilience
 2012 Preliminary Results For the year ended 31 December 2012 Proven strategy adds value to customers, delivers growth and increases resilience Agenda Overview Financial highlights Growth Strategy Market
STAR Conference. 6 th October 2016, London
 STAR Conference 6 th October 2016, London Elica Corporation N#1 PLAYER WORLDWIDE IN HOODS 13% MARKET SHARE 2015 TURNOVER 421.6 M 8 INDUSTRIAL PLANTS WORLDWIDE 2 19 Mln Hoods + Motors Cooking Net Sales:
JOHNSON ELECTRIC HOLDINGS LIMITED. FY Interim Results
 JOHNSON ELECTRIC HOLDINGS LIMITED FY2010 11 Interim Results November 2010 Page 1 Group Overview Key Financial Highlights Operational Results Outlook Appendix Page 2 JOHNSON ELECTRIC GROUP OVERVIEW Johnson
Interim Report First Quarter 2018
 Interim Report First Quarter 2018 First quarter Net sales increased by 9% to SEK 124.9 (115.0) million. Adjusted to fixed exchange rates, net sales increased by 8%. This follows on the back of 6% growth
2018 Interim Presentation
 2018 Interim Presentation 26th July 2018 www.morganadvancedmaterials.com Agenda Introduction and key highlights Pete Raby 2018 interim results Peter Turner Operational and strategic update Pete Raby 2
Henrik Lange Executive Vice President and CFO
 Henrik Lange Executive Vice President and CFO SKF Capital Markets Day 10 September 2014 Agenda Financial development Cash flow, working capital Financial position Acquisitions Second brand Key business
Eng US. 14 July 2017
 Eng US 14 July 2017 Presentation 2017 Eng US Disclaimer This presentation has been prepared by Duni AB (the Company ) solely for use at this investor presentation and is furnished to you solely for your
Interim announcement 1 st Half-year 2015
 Interim announcement 1 st Half-year 2015 Danfoss at a glance Danfoss engineers technologies that enable the world of tomorrow to do more with less. We meet the growing need for infrastructure, food supply,
Global leader in high-end vacuum valve technology
 HALF YEAR 2017 RESULTS Global leader in high-end vacuum valve technology Heinz Kundert, CEO, Andreas Leutenegger, CFO and Jürgen Krebs, COO August 24, 2017 1 Agenda 1 2 3 Highlights Second quarter and
REPORT ThIRD QUARTER 2011
 Imagine the result REPORT third QUARTER 2011 2 Introduction Arcadis nv Report third quarter 2011 Organic revenue growth remains at good level with 3% in the quarter U.S. environmental market, South America
Eng US. 9 February Q4 Presentation 2017
 Eng US 9 February 2018 Q4 Presentation 2017 Eng US Disclaimer This presentation has been prepared by Duni AB (the Company ) solely for use at this investor presentation and is furnished to you solely for
2011 Results and Outlook. Paris, February 17, 2012
 2011 Results and Outlook Paris, February 17, 2012 Contents 1. 2011 Highlights 2. 2011 Results 3. Strategy C O N T E N T S 4. Outlook and Objectives for 2012 1. 2011 Highlights 2011 key figures Amounts
TI Fluid Systems plc Half Year Results Presentation for TI Fluid Systems plc. 8 August 2018
 2018 Half Year Results Presentation for 8 August 2018 Disclaimer This presentation contains certain forward-looking statements with respect to the financial condition, results of operations and business
Q3 9M 2017 RESULTS. Investor Presentation. 9 November 2017
 Q3 9M 2017 RESULTS Investor Presentation 9 November 2017 INFORMATION Quarterly financial statements are unaudited and are not subject to any review Half year financial statements are subject to limited
H FINANCIAL RESULTS. Milan September 18 th, 2018
 H1 2018 FINANCIAL RESULTS Milan September 18 th, 2018 1 AGENDA H1 2018 Highlights o o o Group overview Results by business Outlook Financial results Appendix 2 H1 2018 Financial Highlights Organic sales
Q results. April 27, 2018
 Q1 2018 results April 27, 2018 Consolidated financial statements as of March 31, 2018 were authorized for issue by the Board of Directors held on April 26, 2018. Q118 KEY HIGHLIGHTS Q1 2018 in line with
Annual General Meeting Fiscal Year 2013
 Annual General Meeting Fiscal Year 2013 Oberhausen, April 16, 2014 Check against delivery. GEA Group Aktiengesellschaft Performance of GEA Group 2 Annual General Meeting Fiscal Year 2013 Highlights of
Linde Group. Full Year Results 2005
 Full Year Results 2005 Disclaimer This presentation has been prepared independently by Linde AG ( Linde ). The presentation contains statements which address such key issues as Linde s growth strategy,
Eng US. Q1 Presentation April, 2015
 Eng US Presentation 2015 24 April, 2015 Eng US Disclaimer This presentation has been prepared by Duni AB (the Company ) solely for use at this investor presentation and is furnished to you solely for your
Report on the performance of the Philips Group. Key performance data for the period ending March 31
 Report on the performance of the Philips Group Key performance data for the period ending March 31 the data included in this report are unaudited 1 st Quarterly report April 17, 2001 January to March 2001
HUGO BOSS First Nine Months Results 2011
 HUGO BOSS First Nine Months Results 2011 Mark Langer (CFO) November 2, 2011 Conference Call, First Nine Months Results 2011 HUGO BOSS November 2, 2011 2 / 30 AGENDA OPERATIONAL HIGHLIGHTS FIRST NINE MONTHS
P R E S S R E L E A S E
 P R E S S R E L E A S E from ASSA ABLOY AB (publ) 16 February 2005 No. 3/05 GOOD END TO A STRONG YEAR FOR ASSA ABLOY Sales for the fourth quarter increased organically by 4% to SEK 6,263 M (6,096) after
P R E S S R E L E A S E
 P R E S S R E L E A S E from ASSA ABLOY AB (publ) 2 November 2004 No. 12/04 ASSA ABLOY: CONTINUED STRONG ORGANIC GROWTH IN THE THIRD QUARTER Sales in the third quarter increased organically by 6% to SEK
Introduction Stephen Harris
 Introduction Stephen Harris Group Chief Executive 2 Agenda Highlights Financial review Business review Summary and Outlook 3 Highlights Results 8.7% revenue growth to 368.0m 5% growth in headline operating
Stifel Nicolaus 2017 Industrials Conference June 15, 2017
 Stifel Nicolaus 2017 Industrials Conference June 15, 2017 Forward-Looking Statements This material and related presentation may contain certain forward-looking statements within the meaning of the Private
BUILDING A BOLD AND SUSTAINABLE FUTURE
 BUILDING A BOLD AND SUSTAINABLE FUTURE 2018 HALF YEAR RESULTS 7 AUGUST 2018 PRESENTED BY: CHAIRMAN MARTIN LAMB CHIEF EXECUTIVE KEVIN HOSTETLER FINANCE DIRECTOR JONATHAN DAVIS Keeping the World Flowing
Q Results. Strong start in May 3, 2016
 Q1 2016 Results Strong start in 2016 May 3, 2016 Legal Disclaimer Information in this presentation may involve guidance, expectations, beliefs, plans, intentions or strategies regarding the future. These
Refresco Gerber reports solid 2015 results and delivers on strategic goals
 Press release March 10, 2016 Refresco Gerber reports solid 2015 results and delivers on strategic goals Key indicators: Volume in full year 2015 increased 2.1% to 6,095.5 million liters (FY 2014: 5,968.9
Storing. vital products. with care. Full Year 2018 Roadshow Presentation Royal Vopak
 Storing vital products with care Full Year Roadshow Presentation Royal Vopak Forward-looking statement This presentation contains forward-looking statements, based on currently available plans and forecasts.
Appendix 1: Results by business sector and geographic area - Full Year
 Appendix 1: Results by business sector and geographic area - Full Year I. SALES Innovative Materials 1 9,703 9,857 +1.6% +1.4% +4.5% Flat Glass 5,217 5,364 +2.8% +2.7% +6.5% High-Performance Materials
Interim Report Third Quarter 2018
 Interim Report Third Quarter 2018 Third quarter Net sales increased by 19% to SEK 114.0 (95.6) million. Adjusted to fixed exchange rates, net sales increased by 9%. This follows on the back of 7% growth
WAVIN GROUP REPORTS STRONG INCREASE IN REVENUE AND OPERATING RESULTS IN FIRST HALF YEAR 2007
 WAVIN GROUP REPORTS STRONG INCREASE IN REVENUE AND OPERATING RESULTS IN FIRST HALF YEAR 2007 Zwolle, 6 September 2007 Wavin N.V., leading supplier of plastic pipe systems and solutions in Europe, today
Press release Regulated information 2015 results Under embargo until Thursday 25 February 2016 at 7:15 a.m. CET
 Under embargo until Thursday 25 February 2016 at 7:15 a.m. CET Deceuninck 2015: Solid growth. Sales: 644.5m (+16.6%), EBITDA: 54.4(+54%) and net result: 13.3m (+ 27%) Growth driven by successful integration
1 st Half-year, 2014 Danfoss delivers good half-year results
 1 st Half-year, 2014 Danfoss delivers good half-year results www.danfoss.com www.danfoss.com Danfoss at a glance Danfoss is a world-leading supplier of technologies that meet the growing need for food
Q RESULTS INVESTOR PRESENTATION
 Q1 2018 RESULTS INVESTOR PRESENTATION INFORMATION Quarterly financial statements are unaudited and are not subject to any review Half year financial statements are subject to limited review by statutory
Investor Presentation
 Investor Presentation Summer / Fall 2014 Disclaimer Certain statements in this presentation and responses to various questions may constitute forward-looking statements within the meaning of the U.S. federal
First quarter report 2012 Q 2012
 report 2012 Q 2012 page 2 FIRST QUARTER Contents Contents Financial review 3 Overview 3 Market developments and outlook 5 Additional factors impacting Hydro 7 Underlying EBIT 8 Items excluded from underlying
Interim results presentation. 26 August 2010
 Interim results presentation 26 August 2010 Martin Lamb Agenda Results Overview Martin Lamb Financial Review Douglas Hurt Business Review - Severe Service Ian Whiting - Fluid Power Roy Twite - Indoor Climate
TomTom reports fourth quarter and full year results
 De Ruyterkade 154 1011 AC Amsterdam, The Netherlands corporate.tomtom.com ir@tomtom.com 28 February 2012 TomTom reports fourth quarter and full year results Financial headlines FY 2011 - Revenue of 1,273
TELECONFERENCE Q3 2017
 AGENDA BUSINESS HIGHLIGHTS FINANCIAL REVIEW QUESTIONS AND ANSWERS 2 DISCLAIMER Certain statements in this presentation constitute forward-looking statements. Forward-looking statements are statements (other
Quarterly Report 03/2018
 Q3 Quarterly Report 03/2018 CENTROTEC The European Energy-Saving Company Highlights > Positive business development in German heating and ventilation market; CHP market well below expectations > Group
2 nd quarter continuation of a stable trend. Ben Noteboom, CEO Robert Jan van de Kraats, CFO. Randstad Holding nv July 25, 2013
 2 nd quarter 2013 continuation of a stable trend Ben Noteboom, CEO Robert Jan van de Kraats, CFO Randstad Holding nv disclaimer & definitions Certain statements in this document concern prognoses about
RepoRt first quarter 2011
 Imagine the result report first quarter 2011 2 Introduction ARCADIS NV Report first quarter 2011 Gross revenues increase 4%; net income from operations up 8% Organic revenue growth continues and came out
2017 Results Presentation
 2017 Results Presentation 27th February 2018 www.morganadvancedmaterials.com Agenda Introduction and key highlights Pete Raby 2017 results Peter Turner Operational and strategic update Pete Raby 2 Key
First-half 2007 results
 First-half 2007 results Analyst-Investor meeting July 2007 Contents 1 Highlights 2 Group results 3 Operating performance 4 Strategy 5 Outlook and objectives for 2007 Highlights Saint-Gobain in first-half
BUSINESS YEAR 2017/18 2 nd QUARTER, 1 st HALF
 BUSINESS YEAR 2017/18 2 nd QUARTER, 1 st HALF Investor Relations November 2017 www.voestalpine.com OVERVIEW BUSINESS MODEL» voestalpine is a leading technology and capital goods group with combined material
H Results. July 28, 2017
 H1 2017 Results July 28, 2017 1. HIGHLIGHTS 2. H1 2017 RESULTS 3. OUTLOOK AND ACTION PLAN FOR H2 2 / H1 2017 KEY FIGURES Sales Actual Like-for-like Operating income Actual Like-for-like 20.4bn +4.4% +3.5%
ABN AMRO reports record operating result
 ABN AMRO reports record operating result Third Quarter Results 23 31 October 23 Table of Contents ABN AMRO reports record operating result 3 Operating Performance 4 Asset Quality and Capital 13 Outlook
H Financial Results. Milan July 28th, 2016
 H1 2016 Financial Results Milan July 28th, 2016 Agenda H1 2016 Highlights o o o Group overview Results by business Outlook Financial results Appendix H1 2016 Financial Results 2 H1 2016 Highlights Organic
Results presentation For the year ending 31 December 2015
 Results presentation For the year ending 31 December 2015 1 Results Presentation March 2016 Agenda 1 2015 Overview & Business Priorities Update Chris Weston, CEO 2 2015 Financial & Operating Review Carole
JOHNSON ELECTRIC HOLDINGS LIMITED FY2011/12 Interim Results
 JOHNSON ELECTRIC HOLDINGS LIMITED FY2011/12 Interim Results Jan 2012 Page 1 Group Overview Key Financial Highlights Operational Results Outlook Appendix Page 2 JOHNSON ELECTRIC GROUP OVERVIEW Johnson Electric
High-quality aluminium coils of AMAG Austria Metall AG
 High-quality aluminium coils of AMAG Austria Metall AG Financial Report 1 st half year of 2015 2 AMAG Financial Report Key figures for the AMAG Group Key figures for the Group in EUR million Q2/2015 Q2/2014
Introduction Stephen Harris
 Introduction Stephen Harris Group Chief Executive 2 Agenda Summary Financial review Business review Outlook 3 Summary Growth - Strong constant currency revenue growth of 8.3% - 3.5% contribution from acquisitions
INTERIM STATEMENT FIRST QUARTER
 FIRST QUARTER Overview of Q1 2018 1 Q1 2017 1 Change in % Order situation Order book (Mar 31) EUR millions 356.5 312.1 14.3 statement Revenue EUR millions 272.6 254.9 6.9 (Adjusted) gross profit EUR millions
FY2018 RESULTS PRESENTATION 27 August 2018
 RELIANCE WORLDWIDE CORPORATION LIMITED ACN 610855877 FY2018 RESULTS PRESENTATION 27 August 2018 INVESTOR PRESENTATION FY18 RESULTS PAGE 0 Important Notice This presentation contains general information
Full Year 2009 Results. Givaudan reinforces its leadership position
 Full Year 2009 Results Givaudan reinforces its leadership position Vernier, 16 February 2010 Gilles Andrier CEO Full Year 2009 results Business highlights The new Givaudan platform has passed its test
P R E S S R E L E A S E
 P R E S S R E L E A S E from ASSA ABLOY AB (publ) 9 August 2002 No. 11/02 INTERIM REPORT FOR THE SECOND QUARTER OF 2002 Sales increased 14% greater focus on organic growth Income before tax increased 26%
EXPERTISE, OUR SOURCE OF ENERGY 2012 INTERIM RESULTS AUGUST 30, 2012
 EXPERTISE, OUR SOURCE OF ENERGY 2012 INTERIM RESULTS AUGUST 30, 2012 GROWTH STRATEGIES STRENGTH OUR AREAS OF EXPERTISE Increase offer differentiation Improve operational excellence: quality, costs, services
4 th quarter and annual results 2011 strong growth in North America, gradual slowdown in Europe revenue up 13% and diluted earnings per share up 8%
 4 th quarter and annual results 2011 strong growth in North America, gradual slowdown in Europe revenue up 13% and diluted earnings per share up 8% Ben Noteboom, CEO Robert-Jan van de Kraats, CFO Randstad
FY MARCH 2011 TELECONFERENCE PRESENTATION
 FY 2010 TELECONFERENCE PRESENTATION 15 MARCH 2011 1 4 APRIL 2011 DISCLAIMER This presentation contains forward-looking statements that reflect PANDORA s expectations with respect to certain future events
RECORD RESULTS FOR 2004 REFLECT STRONG ORGANIC GROWTH SOLID GROWTH ANTICIPATED IN 2005
 RECORD RESULTS FOR 2004 REFLECT STRONG ORGANIC GROWTH SOLID GROWTH ANTICIPATED IN 2005 Revenues up 5.7% to 1,631.4 million, organic revenues up 6.2% EBITDA rises 11.6% to 465.2 million Operating income
Q results. July 28, Financial statements at June 30, 2010 were reviewed by the Supervisory Board held on July 27, 2010.
 Q2 2010 results July 28, 2010 Financial statements at June 30, 2010 were reviewed by the Supervisory Board held on July 27, 2010. 1. Q2 2010 at a glance Q2 2010 highlights Organic sales growth in Q2 (+2.3%)
EMERSON REPORTS FIRST QUARTER 2019 RESULTS AND RAISES FULL YEAR GUIDANCE
 Investor Contact: Tim Reeves (314) 553-2197 Media Contact: Casey Murphy (314) 982-6220 EMERSON REPORTS FIRST QUARTER 2019 RESULTS AND RAISES FULL YEAR GUIDANCE Net sales of $4.1 billion increased 9 percent,
Results for the Fourth Quarter ended 31 December 2017
 Results for the Fourth Quarter ended 31 December 2017 Athens, Greece, 25 April 2018 Frigoglass SAIC ( Frigoglass or we or the Group ) announces results for the quarter and full year ended 31 December 2017
JARI ROSENDAL, PRESIDENT AND CEO PETRI CASTRÉN, CFO APRIL 27, Good organic growth JANUARY-MARCH 2018
 JARI ROSENDAL, PRESIDENT AND CEO PETRI CASTRÉN, CFO APRIL 27, 2018 Good organic growth JANUARY-MARCH 2018 Key financial highlights Q1 2018 Organic growth +7% Demand is growing in every market we serve
Investor Presentation Q Results. 8 November 2017
 Investor Presentation Q3 2017 Results 8 November 2017 Forward-looking statements This presentation contains forward-looking statements, including, but not limited to, the statements and expectations contained
2016 Full Year Results. 28 February 2017
 2016 Full Year Results 28 February 2017 Introduction Stephen Harris Group Chief Executive 2 Agenda Overview Financial review Business review Summary & Outlook 3 Overview Revenue Headline operating margin
Interim Report Second Quarter 2018
 Interim Report Second Quarter 2018 Second quarter Net sales increased by 12% to SEK 118.8 (106.5) million. Adjusted to fixed exchange rates, net sales increased by 7%. This follows on the back of 8% growth
Annual Results Harrie Noy, Chief Executive Officer Renier Vree, Chief Financial Officer Amsterdam, the Netherlands, 27 February 2012
 Annual Results 2011 Harrie Noy, Chief Executive Officer Renier Vree, Chief Financial Officer Amsterdam, the Netherlands, Imagine the result DISCLAIMER Statements included in this presentation that are
Interim Jan June/ 2005 results briefing
 Interim Jan June/ 2005 results briefing Helsinki, 4 August 2005 Market and business review Financial results Outlook Jan Lång, President and CEO Jyri Luomakoski, CFO and Deputy CEO Jan Lång Questions Interim
Report on Finnish Technology Industry Exports
 Report on Finnish Technology Industry Exports Last observation October 2018, 2.1.2019 Goods Export of Technology Industry from Finland Goods Export of Technology Industry from Finland by Branches Source:
NKT. Annual Report 2010 Live presentation 1 March 2011 at 11:00 am. NKT Holding A/S / IR presentation / Annual Report
 NKT Annual Report 2010 Live presentation 1 March 2011 at 11:00 am NKT Holding A/S / IR presentation / Annual Report 2010 1 Agenda NKT Group 2010 in headlines Expectations 2011 Financial results 2010 NKT
Balance sheets and additional ratios
 Balance sheets and additional ratios all amounts in millions of euros unless otherwise stated Consolidated balance sheets 1999 1998 June 30, December 31, Cash and cash equivalents 3,648 6,553 Receivables
INTERIM REPORT SECOND QUARTER SANDVIK: Interim Report on the second quarter 2017
 INTERIM REPORT SECOND QUARTER 217 1 SANDVIK: Interim Report on the second quarter 217 SUMMARY STRONG MOMENTUM ORDER INTAKE +17% REVENUES +9% POSITIVE DEVELOPMENT IN ALL BUSINESS AREAS AND REGIONS EARNINGS
GrandVision Full Year 2017 Results. 28 February 2018
 GrandVision Full Year 2017 Results 28 February 2018 1 Forward looking statements This presentation contains forward-looking statements that reflect GrandVision s current views with respect to future events
FY 2017 Results Presentation February 23, 2018
 FY 2017 Results Presentation February 23, 2018 2017 HIGHLIGHTS Sales Euro 884.5 million,-1.8% (-1.7% in constant currency) Wholesale: +1.4%, with a growth in almost all countries LFL directly operated
Hans Wijers, CEO, Keith Nichols, CFO February 16, 2012 Press conference Q4 and FY 2011 results
 Hans Wijers, CEO, Keith Nichols, CFO February 16, 2012 Agenda Q4 and full year 2011 value and values highlights Performance improvement program, conclusion and outlook Q&A 2 Highlights 2011 revenue up
RWC reports strong first half results with continued business growth. EBITDA guidance for FY2018 increased.
 ASX Announcement 26 February 2018 RWC reports strong first half results with continued business growth. EBITDA guidance for FY2018 increased. Reliance Worldwide Corporation Limited (ASX: RWC) ( RWC or
Annual 2014 Report. Insert URL here.
 Annual 2014 Report Danfoss Financial lorem highlights ipsum in dolorem EURO 2014 Insert URL here www.danfoss.com FIND US HERE: DANFOSS.COM www.facebook.com/danfoss www.twitter.com/danfoss http://plus.google.com/+danfoss
NUPLEX INDUSTRIES LIMITED RESULTS PRESENTATION FOR THE YEAR ENDED 30 JUNE 2012 PRESENTATION AGENDA
 NUPLEX INDUSTRIES LIMITED RESULTS PRESENTATION FOR THE YEAR ENDED 30 JUNE 2012 17 AUGUST 2012 Emery Severin, Chief Executive Officer Ian Davis, Chief Financial Officer PRESENTATION AGENDA 1. Group Overview