Storing. vital products. with care. Full Year 2018 Roadshow Presentation Royal Vopak
|
|
|
- Lisa Paul
- 5 years ago
- Views:
Transcription


1 Storing vital products with care Full Year Roadshow Presentation Royal Vopak
2 Forward-looking statement This presentation contains forward-looking statements, based on currently available plans and forecasts. By their nature, forward-looking statements involve risks and uncertainties because they relate to events and depend on circumstances that may or may not occur in the future, and Vopak cannot guarantee the accuracy and completeness of forward-looking statements. These risks and uncertainties include, but are not limited to, factors affecting the realization of ambitions and financial expectations, developments regarding the potential capital raising, exceptional income and expense items, operational developments and trading conditions, economic, political and foreign exchange developments and changes to IFRS reporting rules. Vopak s outlook does not represent a forecast or any expectation of future results or financial performance. Statements of a forward-looking nature issued by the company must always be assessed in the context of the events, risks and uncertainties of the markets and environments in which Vopak operates. These factors could lead to actual results being materially different from those expected, and Vopak does not undertake to publicly update or revise any of these forward-looking statements. FY Roadshow Presentation 2
3 Key message Capital Markets Day Confidence in short-term performance delivery and managing long-term value Global well-diversified portfolio Strong competitive position Clear and robust financial framework Strategy execution is well on track FY Roadshow Presentation 3
4 External developments Structural business drivers influenced by two global trends Storage demand drivers Structural demand drivers for storage of vital products, driven by growth in population and global energy consumption Increasing global imbalances resulting from concentration of supply and demand Energy transition Facilitate the introduction of lighter, cleaner fuels Pursue potential infrastructure solutions for a low-carbon energy future Competition Competitive landscape changed as a result of new storage capacity worldwide Digital transformation Real-time data and transparent processes are required by customers Vopak strategic capabilities of more importance Connectivity with external parties FY Roadshow Presentation 4


5 Business environment update Diversified portfolio, well positioned for future opportunities Chemicals Focus on operational delivery Strong underlying demand for chemicals Oil products Prepare for the uptick Oil hubs: solid long-term demand drivers despite short-term weakness Positive investment climate petrochemical industry Fuel oil: unsettled market Import-distribution markets: Solid growth in markets with structural deficits Gases Steady cash flows Strong growth in LNG imports in Asia (including China) Strong growing demand in LPG for residential and petrochemical markets Vegoils & biofuels Reap the benefit of current market Strong biofuels market despite volatility due to changes in government policies Incremental vegoil demand fueled by price competitiveness FY Roadshow Presentation 5


6 Vopak at a glance FY Roadshow Presentation 6

7 Robust Vopak strategy Leadership in 5 pillars with clear strategy execution Storing vital products with care Service leadership Operational leadership Leading asset in leading locations Technology leadership People leadership Founder s mentality Vopak Values FY Roadshow Presentation 7


8 Strategic terminal types Industrial terminals LNG, LPG and chemical gases Chemical terminals Oil terminals Vopak has more than 40 years of experience with industrial terminals. These often large terminals exclusively support chemical clusters in the Americas, Europe, Middle East and Asia. We also operate terminals that have significant long-term pipeline connections and serve global and regional plants. We provide a centralized fit-for-purpose solution and deliver value to customers and local authorities through economies of scale. Demand for gas is increasing, driven by petrochemical and plastics production, for gas-fired power plants and for transportation purposes. This led Vopak to increase its focus on facilitating growth in global gas markets. By introducing infrastructure and logistic solutions for cleaner and efficient fuels like LPG and LNG, Vopak is contributing to the energy transition. We own and operate LPG storage terminals for example in the Netherlands, China and Singapore. Vopak operates LNG facilities in Mexico, the Netherlands and Pakistan. The strong growth of global chemicals demand is leading to an increased need for chemical storage capacity. Vopak has a strong presence in key chemical hub locations, including Antwerp, Rotterdam, Singapore and Houston and operates a global chemical distribution network. Besides our growth opportunities in chemicals, we are continuously searching for opportunities to improve our competitive position by further optimization of our infrastructure to service customers better. Oil import, distribution and hub terminals remain an important part of our business. Oil hub terminals are strategically located along major shipping routes, where many suppliers, customers and traders are active and where efficient supply chain solutions are of utmost importance. Our oil hubs are located in Rotterdam, Fujairah and the Singapore Strait. GDP and population growth drive the consumption of energy products. Vopak plays an important role in the import and distribution of energy products in major oil markets with structural deficits. FY Roadshow Presentation 8
9 Portfolio transformation Shift towards gases and industrial terminals and focus on the East of Suez Proportionate revenue per product Period Reshaping the portfolio Divestment of 19 terminals Focus on 4 strategic terminal types ~10% ~15% 35-40% 40-45% ~10% 20-25% 25-30% 40-45% 10-15% 25-30% 25-30% 35-40% LNG, LPG & Chemical Gases Industrial terminals Chemicals Oil * Proportionate revenue per region Period Portfolio management & delivering growth Major announcements of new projects adding toward 2019 Strategic review and testing of market value of 4 assets 15-20% 5-10% 20-25% 50-55% 2014 ~20% 5-10% ~25% 45-50% 20-25% 5-10% 25-30% 40-45% * Americas China Asia & Middle East Europe & Africa * Excluding terminals under strategic review Note: keeping all market conditionals equal and only taking announced projects into account FY Roadshow Presentation 9


10 Digital transformation Improve safety performance, better service for our customers and more efficient use of our assets resulting in lower costs Cyber security Centralized cyber security program to protect our systems In progress Significant reduction in response time to cyber attacks Digital Modernization In progress Replacing and modernizing our company-wide IT and OT systems Developed own software for core processes and standardize non-core processes Digital Innovation Early phase Connecting our assets to generate real-time data with smart sensoring Digitizing our maintenance Platforms Create digital platforms around smart terminals enabling efficient and reliable information sharing Early phase Engage in new ventures related to technology & innovation FY Roadshow Presentation 10


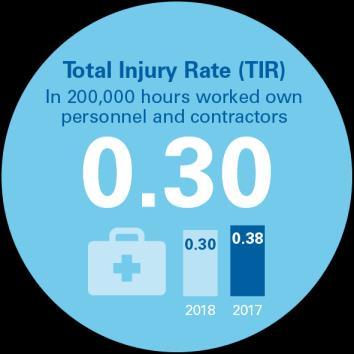
11 Value creation - sustainability Safety and sustainability developments Safety Leading safety performance in storage industry Personnel Safety (TIR) Total injuries per 200,000 hours worked Sustainability UN Sustainability Development Goals (SDGs) Process Safety (PSER) Tier 1 and Tier 2 incidents per 200,000 hours worked Task-force on Climate-related Financial Disclosures Investing in emission-reducing methods FY Roadshow Presentation 11
12 Strategy execution well on track Strategic direction is set towards growth and productivity improvements Capture growth 14 expansion projects announced in last years New projects in Canada, Malaysia, Indonesia, Singapore, South Africa, Brazil, Pakistan and the Netherlands Spend EUR 750 million on sustaining and service improvement capex Sustaining and service improvement capex budget include investments in our fuel oil network Invest EUR 100 million in new technology, innovation programs and replacing IT systems Global roll-out of Terminal Management Software started Cybersecurity controls implemented Drive further productivity and reduce the cost base with at least EUR 25 million by 2019 Efficiency program delivered at and subsequently increased to EUR 40 million by 2019 FY Roadshow Presentation 12
13 Summary financial performance FY strategic direction Capture growth Spend EUR 750m on sustaining and service capex Invest EUR 100m in technology & innovation Drive further productivity EBITDA of EUR 734 million, adjusted for currency translation effects, EBITDA was EUR 10 million lower than prior year Resilient CFFO with investment momentum (CFFI) In line with our growth strategy, our growth investments increased to 1 billion for the period to 2019 Vopak completed the acquisition of the LNG import facility Engro Elengy Terminal Pakistan Cash dividend increased to EUR 1.10 FY Roadshow Presentation 13
14 vs EBITDA Adjusted for currency translation effects EBITDA was EUR 10 million lower than prior year FX-effect Adjusted Europe & Asia & LNG Americas China & Africa Middle East North Asia Global functions, corporate activities and others Figures in EUR million, excluding exceptional items including net result from joint ventures and associates FY Roadshow Presentation 14
15 vs EBITDA Net EUR 7 million one-off cost items included in FX-effect Adjusted Europe & Africa Americas LNG China & North Asia Asia & Middle East Global functions, corporate activities and others Figures in EUR million, excluding exceptional items including net result from joint ventures and associates FY Roadshow Presentation 15
16 Cash flow overview Investment momentum driven by growth project phasing towards CFFO (gross) Tax & other operating items CFFO (net) Sustaining, service & IT investments FCF before growth Growth investments Other CFFI Free Cash Flow before financing CFFO (gross) Tax & other operating items CFFO (net) Sustaining, service & IT investments FCF before growth Growth investments Other CFFI Free Cash Flow before financing Figures in EUR million FY Roadshow Presentation 16
17 Divisional segmentation Europe & Africa and Asia & Middle East impacted by oil hub weakness; Americas and China & North Asia benefit from strong chemical and gas markets Europe & Africa Asia & Middle East Americas China & North Asia LNG Occupancy rate (in percent) for subsidiaries only, with the exception of LNG EBITDA (in EUR million) excluding exceptional items and including net result from JVs & associates and currency effects FY Roadshow Presentation 17
18 NON-IFRS PROPORTIONATE IFRS BASED Non-IFRS proportionate information Occupancy rate In percent EBITDA Maintenance, Service & IT Capex Non-IFRS proportionate information provides transparency in Vopak s Occupancy rate* In percent EBITDA Maintenance, Service & IT Capex underlying performance and free cash flow generating capacity Excluding exceptional items * Proportionate occupancy rate excluding fully impaired joint venture terminals in Estonia and Hainan FY Roadshow Presentation 18
19 Overview financial framework Performance delivery and managing value Clear financial framework to support strategy Balanced portfolio management with focus on strong operational cash flow generation with a disciplined capital investment approach Aimed towards a strong investment case Return on capital employed (ROCE) between 10% and 15% Long term net debt to EBITDA ratio between 2.5 and 3.0 Annual stable to rising cash dividend in balance with a management view on a payout ratio range of 25-75% of net profit FY Roadshow Presentation 19
 Consolidated terminals: sustaining + service + IT + growth capex Joint ventures: equity injection + shareholder loans granted")
20 Financial framework Focus on cash flow generation to create shareholder value Cash Flow From Operations (CFFO) Consolidated terminals: EBITDA -/- tax + asset disposals Joint ventures: dividends received + shareholder loans repaid Cash Flow From Investments (CFFI) Consolidated terminals: sustaining + service + IT + growth capex Joint ventures: equity injection + shareholder loans granted Free Cash Flow (FCF) = CFFO-CFFI Cash flow from operations minus the cash flow from investments Debt servicing Growth opportunities Shareholder dividend Capital optimization FY Roadshow Presentation 20
21 Well-balanced global portfolio Strong resilient cash flow generation Industrial terminals LNG, LPG & chemical gases Chemical terminals Oil terminals 5-20 years years 0-5 years 0-5 years Typical contract duration per product / terminal category 20-25% ~10% 25-30% ~40% Share of proportionate revenues * Europe & Africa Asia & Middle East China & North Asia Americas LNG EUR 303 million EUR 256 million EUR 53 million EUR 129 million EUR 35 million EBITDA** *Joint ventures, associates and subsidiaries with non-controlling interests are consolidated based on the economic ownership interests of the Group in these entities. ** Including net result from joint ventures and associates and excluding exceptional items FY Roadshow Presentation 21


22 Significant capacity to be delivered in 2019 Shift towards industrial terminals and LNG, LPG and chemical gases terminals Vlissingen RIPET 96,000 cbm Panama 360,000 cbm LNG, LPG and chemical gases Industrial Chemicals Oil * Fully or partly commissioned in Deer Park 138,000 cbm * Alemoa Mexico 110,000 cbm 106,000 cbm German LNG 9,200 cbm Botlek 63,000 cbm Richards Bay 15,000 cbm Open season completed EETPL 151,000 cbm * Sebarok 67,000 cbm Merak Lesedi 50,000 cbm 100,000 cbm Durban 130,000 cbm Vietnam 20,000 cbm PT2SB 1,496,000 cbm * PITSB 430,000 cbm Jakarta 100,000 cbm FY Roadshow Presentation 22
 bringing the total share in equity to 85% and effectively obtaining control.")
23 Growth projects under development 1 Terminal capacity available for customers. 2 In January 2019, Vopak acquired an additional 35% equity share in Vopak Terminal Ningbo (China) bringing the total share in equity to 85% and effectively obtaining control. The storage capacity of this terminal was already part of the capacity of the Vopak network. 3 On 5 November, Vopak and its partner Reatile announced that they will invest in a new LPG import and distribution terminal in Richards Bay, subject to final conditions. FY Roadshow Presentation 23


24 Global fuel oil network EUR 40 million investments to be fully ready to support new market requirements in 2020 Hamburg Fuel Oil capacity ~35% 10% 45% 15% 60% ~65% 45% 30% * VLSFO Flexible (HSFO/VLSFO/MGO) HSFO * Fuel oil capacity excluding terminals under strategic review Rotterdam Conversion Los Angeles Panama Algeciras Strategic review Strategic review Fuel oil hub terminal Fuel oil bunker terminal Terminal under strategic review Estonia Strategic review Fujairah Conversion Singapore MGO Expansion FY Roadshow Presentation 24
25 Cash flow from investments Balanced approach for growth, sustaining, service improvement and IT investments Investments ,899 2,012 1,729 New projects* Investments Investments Growth investments with clear return criteria based on future cash flow and risk profile ~1bn Growth investments** Other investments*** ~340 ~125 ~240 ~ Sustaining and service improvement investments influenced by (environmental) legislation and portfolio developments IT investments for rolling out digital systems and create value by digital opportunities * For illustration purposes only, new announcements might increase future growth investments ** Growth capex at subsidiaries and equity injections for JV s and associates for among others all project announced until 13 February 2019, subject to currency changes *** Forecasted sustaining, service improvement and IT capex including investments in fuel oil network FY Roadshow Presentation 25
26 Maintain a return on capital Expected ROCE between 10% and 15% Capital employed In EUR billion Return on capital employed In percent % 12.3% 11.5% 11.8% 10.8% 10-15% Disciplined capital for sustaining, service improvement and IT capex Value accretive growth opportunities FY Roadshow Presentation 26
27 Priorities for cash Balanced approach between allocating capital to growth opportunities, an efficient and robust capital structure and distributions to shareholders 1 Debt servicing EUR 1.6 billion, remaining maturity ~7 years, average interest 4.1% 2 Growth opportunities Value accretive growth 3 Shareholder dividend Annual stable to rising cash dividend in balance with a management view on a payout ratio range of 25-75% of the net profit 4 Capital optimization Efficient and robust capital structure FY Roadshow Presentation 27

")


28 Capital structure Financial flexibility to support growth Ordinary shares Private placement program Syndicated Revolving Credit Facility Equity(-like) Listed on Euronext Market capitalization: EUR ~5.1 billion (31 December ) USD 1.55 billion JPY 20 billion EUR 1.0 billion 15 participating banks duration until June 2023 Subordinated loans: USD 75 million EUR 25 million FY Roadshow Presentation 28
29 Financial flexibility The solid operational cash flow generation, strong balance sheet and sufficient financial flexibility, provides an excellent platform to continue our capital disciplined growth journey Equity and net liabilities In percent Senior net debt* : EBITDA ratio Equity Net liabilities Maximum ratio under other private placements programs and syndicated revolving credit facility 36% 40% 49% 53% 52% % 60% 51% 47% 48% *For certain joint ventures, limited guarantees are provided, affecting the Senior net debt FY Roadshow Presentation 29
30 Debt repayment schedule Debt repayment schedule 1,300 1, RCF flexibility RCF drawn Other Subordinated loans Asian PP US PP As per 25 February 2019 FY Roadshow Presentation 30
31 Increase in dividend to EUR 1.10 per share Continued rising cash dividends Dividend and EPS* In EUR Dividend policy: Annual stable to rising cash dividend in balance with a management view on a payout ratio of % of net profit and subject to market circumstances % 39% 41% 47% 48% payout ratio EPS *Excluding exceptional items; attributable to holders of ordinary shares FY Roadshow Presentation 31
32 IFRS 16 Leases No changes in economics, only changes in accounting (reporting) IFRS 16 Leases No changes in economics and cash flows only in accounting (reporting) IFRS implementation is substantially completed and Vopak is ready to apply IFRS 16 starting per 1 January 2019 Vopak does normally not act as a lessor Vopak, as lessee, has a sizeable portfolio of long-term land leases and leases of other non-current assets Material land leases are in the process of being renewed and will later be included in the lease liability Net debt to EBITDA ratio calculation is based on Frozen GAAP and are not impacted by IFRS 16 Indicative impact Vopak 1 Key figures EBITDA Net profit 0 (10) IFRS 16 Lease liabilities 678 Return on Capital Employed (ROCE) Net debt to EBITDA ratio Cash Flows reported on adjusted basis Frozen GAAP Cash flows from operating activities Cash flows from financing activities (45) (55) Total cash flows No impact 1. Actual financial impact will change due to sensitivities and assumptions applied; Impact presented is based on modified retrospective approach where lease assets equal lease liabilities. Vopak is finalizing its assessment whether it can measure the assets of its largest contracts as if the standard had been applied since historical commencement date. This may lower the amount of the lease assets and subsequently the depreciation expenses. Comparative figures are not required to be restated. Vopak intends to voluntarily disclose like-for-like comparative figures FY Roadshow Presentation 32
33 Storing vital products with care Full Year Roadshow Presentation Appendix
34 Europe & Africa developments Storage capacity In million cbm Occupancy rate* In percent Revenues* 2.3 Total 13.7 million cbm Subsidiaries Joint ventures & associates Operatorship 19 Terminals (6 countries) EBITDA** EBIT** * Subsidiaries only ** EBIT(DA) including net result from joint ventures and associates and excluding exceptional items FY Roadshow Presentation 34
35 Asia & Middle East developments Storage capacity In million cbm Occupancy rate* In percent Revenues* Total 14.1 million cbm Subsidiaries Joint ventures & associates Operatorship 19 Terminals (9 countries) EBITDA** EBIT** * Subsidiaries only ** EBIT(DA) including net result from joint ventures and associates and excluding exceptional items FY Roadshow Presentation 35
36 China & North Asia developments Storage capacity In million cbm Occupancy rate* In percent Revenues* 0.7 Total 4.2 million cbm Subsidiaries Joint ventures & associates Operatorship 9 Terminals (3 countries) EBITDA** EBIT** * Subsidiaries only ** EBIT(DA) including net result from joint ventures and associates and excluding exceptional items FY Roadshow Presentation 36
37 Americas developments Storage capacity In million cbm Occupancy rate* In percent Revenues* Total 4.0 million cbm Subsidiaries Joint ventures & associates Operatorship 18 Terminals (7 countries) EBITDA** EBIT** * Subsidiaries only ** EBIT(DA) including net result from joint ventures and associates and excluding exceptional items FY Roadshow Presentation 37
38 JVs & associates developments Net result JVs and associates* Europe & Africa* Asia & Middle East* China & North Asia* Americas* LNG* * Excluding exceptional items FY Roadshow Presentation 38
39 Key developments Occupancy rate* In percent EBITDA development** Cash flow from operating activities (gross) Dividend In EUR per ordinary share *Subsidiaries only / **Excluding exceptional items; including net result of joint ventures FY Roadshow Presentation 39
40 Occupancy rate developments Occupancy rate of 86% (FY ) explained by lower rented capacity at the oil hub terminals caused by a less favorable oil market structure. Other product-market segments showed stable demand for storage services Occupancy rate* In percent FY 90% FY 86% 90-95% 85-90% *Occupancy rate figures include subsidiaries only FY Roadshow Presentation 40
41 EBITDA to Net profit overview Increase in Earning per Share EBITDA Depreciation and amortization EBIT Net finance costs Income tax Non-controlling interests Net profit to holders of ordinary shares EPS 2.27 EPS 2.25 Excluding exceptional items including net result from joint ventures and associates FY Roadshow Presentation 41
Storing. with care. vital products. Vopak Full Year 2018 financial results Analyst presentation 13 February 2019
 Storing vital products with care Vopak Full Year financial results Analyst presentation 13 February 2019 Forward-looking statement This presentation contains forward-looking statements, based on currently
Storing vital products. with care. PT2SB - Pengerang, Malaysia
 Storing vital products with care PT2SB - Pengerang, Malaysia Clear and robust financial framework Gerard Paulides Member of the Executive Board & CFO Forward-looking statement This presentation contains
Vopak Half Year 2018 financial results. Analyst presentation - 17 August 2018
 Vopak Half Year financial results Analyst presentation - 17 August Forward-looking statements This presentation contains forward-looking statements, based on currently available plans and forecasts. By
Q Roadshow presentation Royal Vopak
 Roadshow presentation Royal Vopak Forward-looking statement This presentation contains forward-looking statements, based on currently available plans and forecasts. By their nature, forward-looking statements
Vopak Interim Update Q Results Analyst Presentation
 5 November Vopak Interim Update Results Analyst Presentation Gerard Paulides - CFO of Royal Vopak Forward-looking statement This presentation contains forward-looking statements, based on currently available
Q Roadshow presentation Royal Vopak
 Roadshow presentation Royal Vopak Forward-looking statement This presentation contains forward-looking statements, based on currently available plans and forecasts. By their nature, forward-looking statements
Strategy execution. Business performance. Looking ahead. Capital disciplined growth. Achievements 2013 ANALYST PRESENTATION 2013.
 Achievements Annual Results ANALYST PRESENTATION 1 Forward-looking statements This presentation contains forward-looking statements, based on currently available plans and forecasts. By their nature, forward-looking
FY FEBRUARY 2015 ANALYST PRESENTATION
 FY 27 FEBRUARY 2015 ANALYST PRESENTATION Results Forward-looking Statements This presentation contains forward-looking statements, based on currently available plans and forecasts. By their nature, forward-looking
Q APRIL 2015 ANALYST PRESENTATION Q Trading update
 22 APRIL ANALYST PRESENTATION Trading update Forward-looking Statements This presentation contains forward-looking statements, based on currently available plans and forecasts. By their nature, forward-looking
HY results analyst presentation. 23 August 2013
 results analyst presentation 23 August 2013 Forward-looking statements This presentation contains forward-looking statements, based on currently available plans and forecasts. By their nature, forward-looking
Storing vital. products. with care. Q Roadshow presentation. Royal Vopak
 Storing vital products with care Q4 Roadshow presentation Royal Vopak Forward-looking statement This presentation contains forward-looking statements, based on currently available plans and forecasts.
Q1 Trading update. 23 April Business Performance Strategy execution and results. Q Trading update. Capital disciplined growth
 Strategy execution and Performance Trading update 2014 Trading update 23 April 2014 Looking ahead Forward-looking statements This presentation contains forward-looking statements, based on currently available
Interim Update YTD Q Rotterdam, the Netherlands, 5 November 2018
 Interim Update YTD Q3 2018 Rotterdam, the Netherlands, 5 November 2018 Highlights for YTD Q3 2018 -excluding exceptional items-: EBITDA of EUR 554 million (YTD Q3 2017: EUR 571 million). Adjusted for adverse
DECEMBER 2014 CAPITAL MARKET DAY VALUE CREATION
 DECEMBER 2014 CAPITAL MARKET DAY VALUE CREATION THROUGH A BALANCED GLOBAL PORTFOLIO Hub terminals Gases Distribution terminals Industrial terminals FORWARD-LOOKING STATEMENTS This presentation contains
Annual results March 2010
 _ Annual results 2009 12 March 2010 A worldwide network strategy Vopak Houston Deer Park Terminal Vopak Horizon Fujairah Vopak Terminal Europoort Vopak Terminal Bahamas Vopak Singapore Sebarok Terminal
THE WORLD OF VOPAK FULL YEAR 2015 RESULTS ROYAL VOPAK FY 2015 ROADSHOW PRESENTATION
 THE WORLD OF VOPAK FULL YEAR RESULTS ROYAL VOPAK FY ROADSHOW PRESENTATION FORWARD-LOOKING STATEMENTS This presentation contains forward-looking statements, based on currently available plans and forecasts.
THE WORLD OF VOPAK Q RESULTS ROYAL VOPAK Q ROADSHOW PRESENTATION
 THE WORLD OF VOPAK Q1 2016 RESULTS ROYAL VOPAK Q1 2016 ROADSHOW PRESENTATION FORWARD-LOOKING STATEMENTS This presentation contains forward-looking statements, based on currently available plans and forecasts.
First Half Year 2012 Results Analyst presentation 24 August 2012
 First Half Year 2012 Results Analyst presentation 24 August 2012 Forward-looking statement This document contains statements of a forward-looking nature, based on currently available plans and forecasts.
Interim Update Q Results Analyst presentation - 6 November 2017
 Jack de Kreij Vice-Chairman of the Executive Board and CFO of Royal Vopak Interim Update Results Analyst presentation - 6 November Forward-looking statement This presentation contains forward-looking statements,
Value creation through capital disciplined growth
 Value creation through capital disciplined growth Capital Markets Day, 10 December 2013 Jack de Kreij, Vice Chairman of the Executive Board and CFO Forward-looking statements This presentation contains
HY ROADSHOW PRESENTATION. The world. of Vopak
 ROADSHOW PRESENTATION The world of Vopak Forward-looking Statement This presentation contains forward-looking statements, based on currently available plans and forecasts. By their nature, forward-looking
Strategy in Financial Perspective: past, present, ambition 2016
 Strategy in Financial Perspective: past, present, ambition 2016 Capital Markets Day, 7 December 2012 Jack de Kreij, Vice-Chairman of the Executive Board and CFO Forward-looking statement This presentation
THE WORLD OF VOPAK Q RESULTS ROYAL VOPAK Q ROADSHOW PRESENTATION
 THE WORLD OF VOPAK Q3 RESULTS ROYAL VOPAK FORWARD-LOOKING STATEMENTS This presentation contains forward-looking statements, based on currently available plans and forecasts. By their nature, forward-looking
Agenda van de jaarlijkse Algemene Vergadering van Koninklijke Vopak N.V. woensdag 22 april 2015
 Agenda van de jaarlijkse Algemene Vergadering van Koninklijke Vopak N.V. woensdag 22 april 2015 1. Opening 2. Bespreking verslag van de Raad van Bestuur over het boekjaar 2014 3. Implementatie remuneratiebeleid
Roadshow presentation HY1 2013
 Roadshow presentation Forward-looking statements This presentation contains forward-looking statements, based on currently available plans and forecasts. By their nature, forward-looking statements involve
vital products with care
 Storing vital products with care Americas - Dynamic markets with opportunities Boudewijn Siemons Division President Vopak Americas Bahia Las Minas - Panama Forward-looking statement This presentation contains
Vopak reports on 2015
 Vopak reports on 2015 Rotterdam, the Netherlands, 26 February 2016 In EUR millions 2015 2014 Revenues 1,386.0 1,322.5 5% Results -excluding exceptional items- Group operating profit before depreciation
HY ROADSHOW PRESENTATION ROADSHOW PRESENTATION. The world of Vopak
 ROADSHOW PRESENTATION ROADSHOW PRESENTATION The world of Vopak Forward-looking Statements This presentation contains forward-looking statements, based on currently available plans and forecasts. By their
Jack de Kreij Member of the Executive Board and Chief Financial Officer. Analyst Meeting 3 July 2009
 _ Jack de Kreij Member of the Executive Board and Chief Financial Officer Analyst Meeting 3 July 2009 Sustainable Value Growth Introduction Sustainable Value Growth Status July 2009 Financing Outlook 2
Strategic priorities & Financial update
 Strategy 2 July 2014 Strategic priorities & Financial update Copyright of Royal Vopak NV review 2 July 2014 Forward-looking statements This presentation contains forward-looking statements, based on currently
Storing vital products with care
 Storing vital products ANNUAL REPORT 2017 In our everyday life, we all use many different vital products. Products that we consider natural to have or normal to use. Energy, such as oil and gas that allows
Directors statement 13. Forward-looking statements 13
 Royal Vopak First Half Year Report 2009 Content Interim Management Report 3 Sustainable development 3 Market developments 3 Growth continues 3 Outlook 5 Main risks and uncertainties 5 Financial review
Vopak: Q EBIT of EUR 110 mln, excluding exceptional gains of EUR 128 mln. In EUR millions Q Q1 2010
 oyal Vopak Westerlaan 10 3016 CK otterdam The Netherlands ress release Vopak: Q1 2011 BIT of U 110 mln, excluding exceptional gains of U 128 mln otterdam, the Netherlands, 27 April 2011 Highlights first
Mid year results 2008
 Page 1 sur 19 Koninklijke Vopak N.V. (Royal Vopak) Westerlaan 10 3016 CK Rotterdam Postbus 863 3000 AW Rotterdam Nederland Telefoon: +31 10 4002911 Fax: +31 10 4139829 E-mail: info@vopak.com Internet:
Fourth quarter and full-year report 2017 Stockholm, January 31, 2018
 Fourth quarter and full-year report Stockholm, January 31, 2018 FOURTH QUARTER HIGHLIGHTS See page > > Reported sales decreased by -12%. Sales adjusted for comparable units and currency declined by -7%
2010 Annual Results. February 10, 2011
 2010 Annual Results February 10, 2011 Disclaimer This presentation contains forward-looking statements. The use of the words "aim(s)," "expect(s)," "feel(s)," "will," "may," "believe(s)," "anticipate(s)"
IMCD reports 25% EBITA growth in 2018
 Press release IMCD reports 25% EBITA growth in 2018 Rotterdam, The Netherlands (1 March 2019) - IMCD N.V. ( IMCD or Company ), a leading distributor of speciality chemicals and food ingredients, today
2017 Results Presentation
 2017 Results Presentation 27th February 2018 www.morganadvancedmaterials.com Agenda Introduction and key highlights Pete Raby 2017 results Peter Turner Operational and strategic update Pete Raby 2 Key
DSM in motion: driving focused growth
 DSM in motion: driving focused growth Nico Gerardu Member of the Managing Board Nomura Chemicals Conference Rome, 22 March 2012 Safe harbor statement This presentation may contain forward-looking statements
Q3 9M 2017 RESULTS. Investor Presentation. 9 November 2017
 Q3 9M 2017 RESULTS Investor Presentation 9 November 2017 INFORMATION Quarterly financial statements are unaudited and are not subject to any review Half year financial statements are subject to limited
LafargeHolcim makes good progress in 2017; Strategy 2022 to drive growth. EPS 11.9% up on prior year excluding impairment and divestments
 Zurich, 07:00, March 2, 2018 LafargeHolcim makes good progress in 2017; Strategy 2022 to drive growth 4.7% growth in Net Sales on like-for-like basis Recurring EBITDA up 6.1% on like-for-like basis EPS
THIRD QUARTER OCTOBER 2018
 THIRD QUARTER 2018 18 OCTOBER 2018 DISCLAIMER Certain information contained in this document, other than historical information, may constitute forward-looking statements or unaudited financial forecasts.
Our Transformation Continues. March 21, 2018
 Our Transformation Continues March 21, 2018 Disclosure Regarding Forward-Looking Statements Forward-Looking Statements and Factors That May Affect Future Results: Throughout this presentation, we make
LafargeHolcim continues growth in sales and EBITDA in Q3. Q3 Net Sales grow 4.1% year-on-year to CHF 6.9 billion on a like-for-like basis
 Zurich, October 27, 2017 LafargeHolcim continues growth in sales and EBITDA in Q3 Q3 Net Sales grow 4.1% year-on-year to CHF 6.9 billion on a like-for-like basis Q3 Operating EBITDA Adjusted up 5.9% to
Investor Teleconference Presentation Fourth Quarter Praxair, Inc. January 29, 2016
 Investor Teleconference Presentation 2015 Praxair, Inc. January 29, 2016 Forward Looking Statement This document contains forward-looking statements within the meaning of the Private Securities Litigation
Our Transformation Continues Sidoti NDR May 29-30, 2018
 Our Transformation Continues Sidoti NDR May 29-30, 2018 Disclosure Regarding Forward-Looking Statements Forward-Looking Statements and Factors That May Affect Future Results: Throughout this presentation,
NUPLEX INDUSTRIES LIMITED RESULTS PRESENTATION FOR THE YEAR ENDED 30 JUNE 2012 PRESENTATION AGENDA
 NUPLEX INDUSTRIES LIMITED RESULTS PRESENTATION FOR THE YEAR ENDED 30 JUNE 2012 17 AUGUST 2012 Emery Severin, Chief Executive Officer Ian Davis, Chief Financial Officer PRESENTATION AGENDA 1. Group Overview
9M2016 Results Announcement
 9M2016 Results Announcement October 27, 2016 Sembcorp Industries 2016 9M2016 Performance Round-up Turnover at S$5.9 billion, down 18% Profit from Operations at S$617.1 million, down 25% Net Profit at S$247.4
2007 Revenue and Results. 2007: strong increase in results Strengthened growth momentum. February 15 th, 2008
 2007 Revenue and Results 2007: strong increase in results Strengthened growth momentum February 15 th, 2008 2007 revenue and results Agenda A successful 2007 Be the recognized industry leader John Glen
Investor Day. Corporate Overview. Henry Buckley, President & CEO and Eric Bussières, CFO November 28, 2017
 Investor Day Corporate Overview Henry Buckley, President & CEO and Eric Bussières, CFO November 28, 2017 Preliminary Comments Forward-looking statements: The information provided in this presentation contains
Strengthening the economic model
 Strengthening the economic model Cécile CABANIS Executive Vice President, Chief Financial Officer Strategy and Information Systems DISCLAIMER This document is presented by Danone. It contains certain forward-looking
2017 Full Year. Results Presentation. 21 February 2018
 2017 Full Year Results Presentation 21 February 2018 CAUTIONARY STATEMENT 2017 Full Year Results Slide 2 Full Year Highlights 2017 Full Year Results Presentation 8TH YEAR OF DOUBLE-DIGIT GROWTH 2017 FINANCIAL
SOLID FINANCIAL POSITION SUPPORTS OUR GROWTH AGENDA
 SOLID FINANCIAL POSITION SUPPORTS OUR GROWTH AGENDA Marco Wirén, CFO & Executive Vice President 1 Business model based on growth opportunities and flexibility Faster than global GDP growth Flexible cost
Henkel Shaping Henkel towards 2020 and beyond. Hans Van Bylen, Carsten Knobel German Investment Seminar 2017 January 2017
 Henkel 2020 + Shaping Henkel towards 2020 and beyond Hans Van Bylen, Carsten Knobel German Investment Seminar 2017 January 2017 Disclaimer This information contains forward-looking statements which are
IMCD reports 9% EBITA growth in 2017
 Press release IMCD reports 9% EBITA growth in 2017 Rotterdam, The Netherlands (2 March 2018) - IMCD N.V. ( IMCD or Company ), a leading distributor of speciality chemicals and food ingredients, today announces
THIRD QUARTER 2017 OCTOBER 2017
 THIRD QUARTER 2017 OCTOBER 2017 DISCLAIMER Certain information contained in this document, other than historical information, may constitute forward-looking statements or unaudited financial forecasts.
YTD Q3 YTD Q3 In EUR millions Revenues 1, %
 Vopak reports on otterdam, the Netherlands, 6 November In U millions 2014 evenues 1,035.6 984.8 5% esults -excluding exceptional items- Group operating profit before depreciation and amortization (BITDA)
Part 1 Executing our strategy
 Entwurf 19.09.018 15h00 Part 1 Executing our strategy Klaus Rosenfeld Chief Executive Officer Capital Markets Day 018 Berlin Disclaimer This presentation contains forward-looking statements. The words
Full Year 2009 Results. Givaudan reinforces its leadership position
 Full Year 2009 Results Givaudan reinforces its leadership position Vernier, 16 February 2010 Gilles Andrier CEO Full Year 2009 results Business highlights The new Givaudan platform has passed its test
We create chemistry for a sustainable future
 Ingo Rose Director Investor Relations Redburn Conference Toronto May 9-10, 2017 We create chemistry for a sustainable future Cautionary note regarding forward-looking statements This presentation contains
Financial Targets through 2022: Focus on Value Creation
 Financial Targets through 2022: Focus on Value Creation /////////// Capital Markets Day London, December 5, 208 Wolfgang Nickl CFO Bayer AG Disclaimer Cautionary Statements Regarding Forward-Looking Information
We create chemistry for a sustainable future
 Dr. Hans-Ulrich Engel Chief Financial Officer CFO Roadshow Boston September 11, 2017 We create chemistry for a sustainable future Cautionary note regarding forward-looking statements This presentation
Acquisition of Wood Mackenzie. March 10, 2015
 Acquisition of Wood Mackenzie March 10, 2015 Forward Looking Statements, Safe Harbor & Non- GAAP Financial Measures Forward-Looking Statements This presentation contains forward-looking statements. These
Stericycle Investor Presentation Q NASDAQ: SRCL
 Stericycle Investor Presentation Q3-2017 NASDAQ: SRCL Forward - Looking Statements Safe Harbor Statement: This press release may contain forward-looking statements that involve risks and uncertainties,
Picture area. HSBC Commercial Banking. Citibank Investor Presentation. Alan Keir Group Managing Director and Global Head, Commercial Banking
 Picture area HSBC Commercial Banking Citibank Investor Presentation Alan Keir Group Managing Director and Global Head, Commercial Banking March 2012 Forward-looking statements This presentation and subsequent
Growing Downstream Value Scotia Howard Weil Conference New Orleans - March 25, 2019 Bryan Milton President, Fuels and Lubricants Company, Exxon Mobil
 Growing Downstream Value Scotia Howard Weil Conference New Orleans - March 25, 2019 Bryan Milton President, Fuels and Lubricants Company, Exxon Mobil Corporation CAUTIONARY STATEMENT CAUTIONARY STATEMENT
January March Conference Call. Georg Denoke Member of the Executive Board & CFO 4 May 2011
 January March 2011 Conference Call Georg Denoke Member of the Executive Board & CFO 4 May 2011 Disclaimer This presentation contains forward-looking statements about Linde AG ( Linde ) and their respective
Investor presentation
 Investor presentation Important information Forward-Looking Statements and Risks & Uncertainties This document and the related oral presentation contain, and responses to questions following the presentation
Q Investor Highlights. May 8, 2018
 Q1 2018 Investor Highlights May 8, 2018 Forward Looking Statements This document contains, and our other public communications may contain, forward-looking statements, that is, information related to future,
July 26, 2017 LafargeHolcim Ltd 2015
 Second Quarter 2017 Results Beat Hess, Chairman and Interim CEO Roland Köhler, Interim COO and Regional Head of Europe, Australia/NZ & Trading Ron Wirahadiraksa, CFO July 26, 2017 LafargeHolcim Ltd 2015
First Half Results 2008:
 First Half Results 2008: A strong performance in the first half ALMA gaining momentum August 4 th, 2008 First half results 2008 Agenda A strong performance in the first half ALMA gaining momentum John
Eng US. 14 July 2017
 Eng US 14 July 2017 Presentation 2017 Eng US Disclaimer This presentation has been prepared by Duni AB (the Company ) solely for use at this investor presentation and is furnished to you solely for your
CIBC Industrials Conference. Alexandre L Heureux May 18, 2016
 CIBC Industrials Conference Alexandre L Heureux May 18, 2016 A LEADING GLOBAL PROFESSIONAL CONSULTING FIRM 2 Focus on professional services (no construction risk) Solid technical expertise Global presence
Third Quarter Earnings Release. October 25, 2017
 Third Quarter 2017 Earnings Release October 25, 2017 Forward looking statements We are making some forward looking statements today that use words like outlook or target or similar predictive words. Such
FY 2016 RESULTS. March 2 nd, 2017
 FY 2016 RESULTS March 2 nd, 2017 AGENDA Key messages & strategy execution Financial update 2017 outlook & conclusion FY2016 RESULTS 2 KEY MESSAGES & STRATEGY EXECUTION KEY MESSAGES 2016 results in line
Half-year 2011 Results. July 29, 2011
 Half-year 2011 Results July 29, 2011 Disclaimer All forward-looking statements are Schneider Electric management s present expectations of future events and are subject to a number of factors and uncertainties
Steve Martens VP Investor Relations FY13 Q3
 Steve Martens VP Investor Relations steve.martens@molex.com FY13 Q3 Forward-Looking Statement Statements in this presentation that are not historical are forward-looking and are subject to various risks
Interim Report Q4 FY 17
 Interim Report Q4 FY 17 Quarter 4 / Fiscal Year 2017 Sustained positive development Sivantos delivered 3.1% organic growth 1) in Q4 FY2017. The moderate growth rate compared to previous quarters was a
AES CORPORATION. AES Investor Presentation.
 AES CORPORATION AES Investor Presentation April 4, 12006 Safe Harbor Disclosure Certain statements in the following presentation regarding AES s business operations may constitute forward looking statements.
Investor Teleconference Presentation Second Quarter Praxair, Inc. July 29, 2015
 Investor Teleconference Presentation 2015 Praxair, Inc. July 29, 2015 Forward Looking Statement This document contains forward-looking statements within the meaning of the Private Securities Litigation
LafargeHolcim accelerates growth momentum; Revenue increased 6.2% in Q2. Strong revenue growth of 6.2% in Q2 and 4.8% in first half on a like-forlike
 Zurich, 07:00, 27 July 2018 LafargeHolcim accelerates growth momentum; Revenue increased 6.2% in Q2 Strong revenue growth of 6.2% in Q2 and 4.8% in first half on a like-forlike basis Recurring EBITDA up
FINANCIAL OVERVIEW Three months ended March 31,
 QUARTERLY REPORT FOR THE THREE MONTHS ENDED MARCH 31, 2018 MANAGEMENT S DISCUSSION AND ANALYSIS May 3, 2018 The Management s Discussion and Analysis ( MD&A ) for Enerflex Ltd. ( Enerflex or the Company
Interim Report Q1 FY 18
 Interim Report Q1 FY 18 Quarter 1 / Fiscal Year 2018 Continued positive development extends into the new fiscal year Sivantos delivered 3.5% organic growth 1) in Q1 2018 with negative Fx translation effects
CEVA Logistics AG Investor Call Third Quarter/First 9 Months November CEVA Logistics AG Q3 2018
 CEVA Logistics AG Investor Call Third Quarter/First 9 Months 2018 13 November 2018 1 Highlights Third Quarter of 2018 Revenue up 4.7% year on year in constant currency FM growth +6.8% in constant currency,
Henkel Annual Results Press Conference
 Henkel Annual Results Press Conference Düsseldorf March 06, 2013 Kasper Rorsted Carsten Knobel Kathrin Menges Disclaimer This information contains forward-looking statements which are based on current
ABB reports solid fourth quarter performance, 2011 net income up 24%
 ABB reports solid fourth quarter performance, 2011 net income up 24% Orders rise 17% 1 (10% organic 2 ), revenues up 16% (10% organic) Full-year orders hit $40 bn for first time, record revenues of $38
GrandVision Full Year 2017 Results. 28 February 2018
 GrandVision Full Year 2017 Results 28 February 2018 1 Forward looking statements This presentation contains forward-looking statements that reflect GrandVision s current views with respect to future events
Q2 / H RESULTS. Investor Presentation. 26 July 2017
 Q2 / H1 2017 RESULTS Investor Presentation 26 July 2017 INFORMATION Quarterly financial statements are unaudited and are not subject to any review Half year financial statements are subject to limited
AXA. Jean-Laurent Granier. Chairman & CEO of AXA Global P&C CEO of the Mediterranean and Latin American Region Member of the Management Committee
 AXA Jean-Laurent Granier Chairman & CEO of AXA Global P&C CEO of the Mediterranean and Latin American Region Member of the Management Committee March 27, 2014 Morgan Stanley European Financials Conference
Year end report. January-December st of January 2018 Mikael Ericson, President and CEO Erik Forsberg, CFO
 Year end report January-December 2017 31 st of January 2018 Mikael Ericson, President and CEO Erik Forsberg, CFO Agenda 1. Highlights for the fourth quarter and FY 2017 2. Key messages from Capital Markets
Philips Lighting reports 0.5% full year comparable sales growth, 10% operational profitability and EUR 403 million free cash flow
 Philips Lighting reports 0.5% full year comparable sales growth, 10% operational profitability and EUR 403 million free cash flow Q4 & Full Year 2017 presentation February 2, 2018 Important information
Valmet unique offering with process technology, automation and services. SEB Nordic Seminar January 8, 2019
 Valmet unique offering with process technology, automation and services SEB Nordic Seminar January 8, 2019 Agenda Valmet roadshow presentation 1 Valmet in brief 2 Investment highlights 3 Financials 4 Conclusion
We create chemistry for a sustainable future
 Dr. Stefanie Wettberg Senior Vice President Investor Relations Investor Visit Ludwigshafen June 27, 2017 We create chemistry for a sustainable future Cautionary note regarding forward-looking statements
Conference Call H Results. Georg Denoke CFO and Member of the Executive Board 30 July 2013
 Conference Call Results Georg Denoke CFO and Member of the Executive Board 30 July 2013 1 1 Disclaimer This presentation contains forward-looking statements about Linde AG ( Linde ) and their respective
GCP Applied Technologies
 GCP Applied Technologies Q3 2017 Investor Highlights November 2, 2017 Forward Looking Statements This document contains, and our other public communications may contain, forward-looking statements, that
Bilfinger Berger: Entering new growth phase
 Bilfinger Berger: Entering new growth phase Roadshow London, Roland Koch, CEO Andreas Müller, Head of Corporate Accounting and Investor Relations Agenda 1. Bilfinger Berger Overview 2. Preliminary figures
FORWARD LOOKING STATEMENTS
 May 2015 FORWARD LOOKING STATEMENTS We are making some forward looking statements today that use words like outlook or target or similar predictive words. Such forward looking statements involve risks
2013 Interim Results. 14 August 2013
 2013 Interim Results 14 August 2013 1 This presentation contains statements that are, or may be, forward-looking regarding the group's financial position and results, business strategy, plans and objectives.
XYLEM INC. Q EARNINGS RELEASE FEBRUARY 1, 2018
 XYLEM INC. Q4 2017 EARNINGS RELEASE FEBRUARY 1, 2018 Q4 2017 EARNINGS RELEASE FORWARD-LOOKING STATEMENTS This presentation contains information that may constitute forward-looking statements. Forward-looking
Fiscal Year st Quarter Earnings Conference Call
 Fiscal Year 2018 1 st Quarter Earnings Conference Call February 7, 2018 www.jacobs.com worldwide Forward-Looking Statement Disclaimer Certain statements contained in this presentation constitute forward-looking