ARTNeT Capacity Building for Trade Policy Researchers. Session 8
|
|
|
- Rodney Shelton
- 5 years ago
- Views:
Transcription

1 ARTNeT Capacity Building for Trade Policy Researchers Supporting Equitable Development in ASEAN: Impact of Regional Integration on CLMV Countries Hands on Session: Getting to know the WITS and ITIP databases 1. Data. Access and variables available 2. Incidence measures Session 8 DITC/TAB, Denise Penello Rial Bangkok, Thailand, June 2016

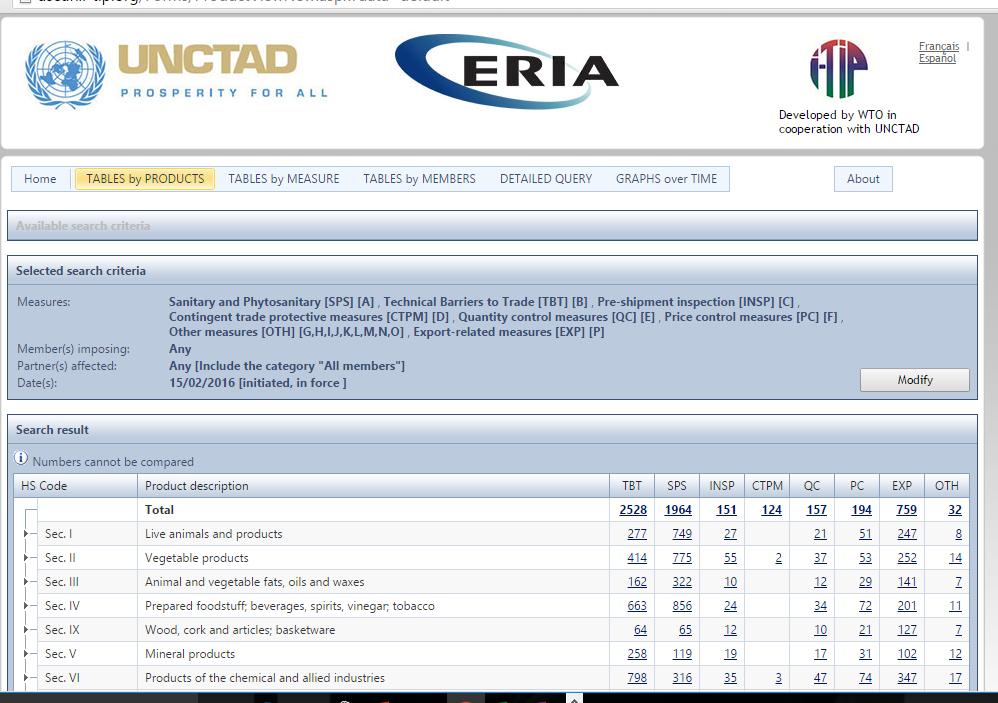
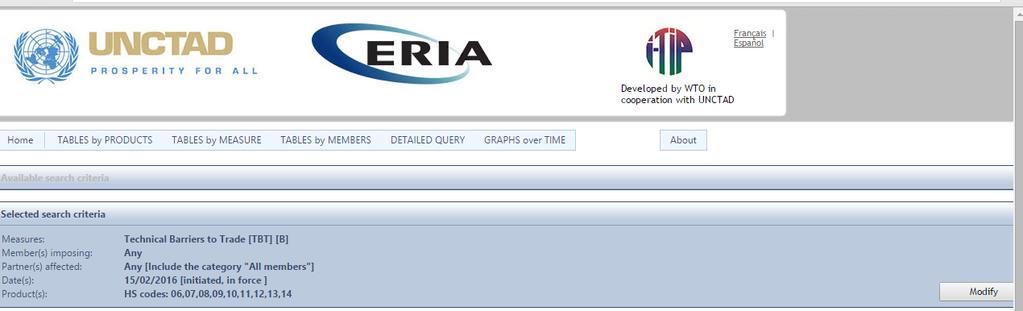
2 i-tip portal (in cooperation with WTO)

3 ASEAN data

4 ASEAN data
5
6
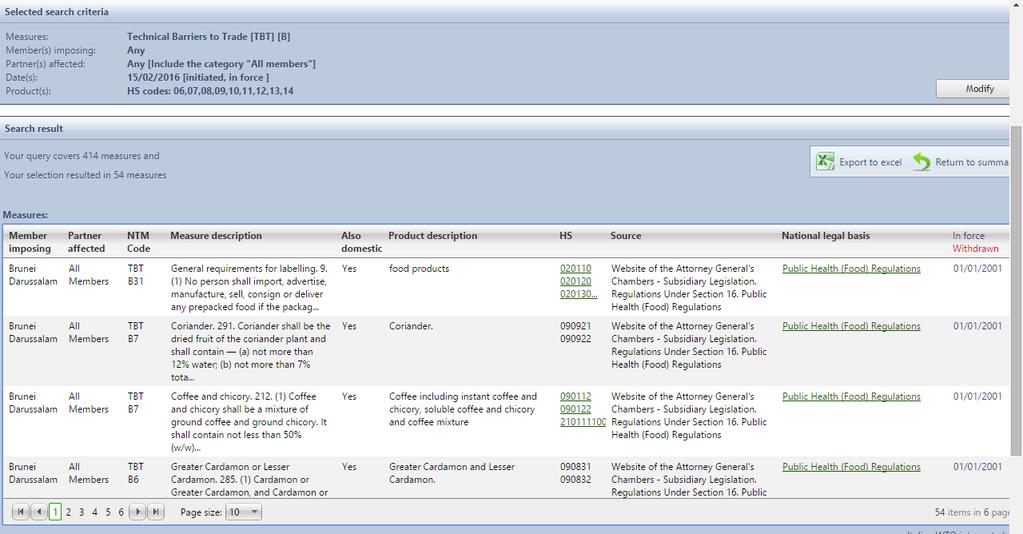
7 See ASEAN i-tip Get acquainted with the data and format Try to find some information that is particularly interesting
8 Database on NTM - from WITS Incidence Calculations
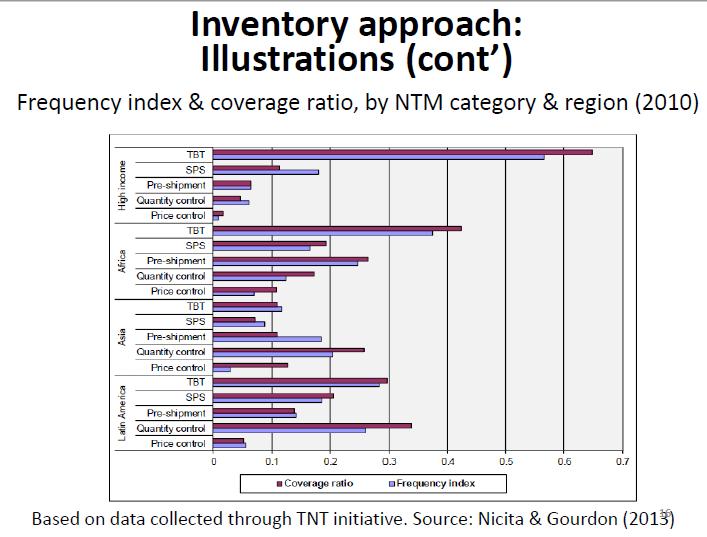
9 Incidence measures, inventory approach Frequency index F j = σ D i M ij σ M i How many of my importing products have to comply with an NTM? Coverage ratio C j = σ D i V ij σ V i What share of my imports (in value) have to comply with an NTM? Intensity (prevalence score?), or frequency count + What are the most typical measures in my country? + How many regulations do food products have?
10 Key simple questions on NTM that we can (now) start to answer What are the measures that countries impose? Legal mandatory requirements, all trade-control regulations What measures are applied to a particular product? How many of my importing products have to comply with an NTM? What share of my imports (in value) have to comply with an NTM? What are the most typical measures in my country?
11 UNCTAD NTM Data Model NTM Code (NTM classification) Measure Implementation Date Measure Repeal Date Measure Description Description of the measure in the regulation Measure Reference Specific place within the regulation Affected Products Description Description of affected products as stated in the regulation Affected Regions Description Description of affected countries/regions as stated in the regulation Notes, Optional additional notes

12 UNCTAD NTM Data Model ASEAN reports discuss how many measures were collected in each country This starts from the regulation legal text Useful for political analysis, reviewing competencies of different ministries, how broad, which areas, etc COULD BE MISLEADING for statistical analysis The data collection work starts from the legal texts But the statistical analysis starts ONLY by the product
13 Example To better understand NTMs in the Lao PDR, NTM data were analysed in detail. It may be noted that NTM data analysis started at the measure level. That means regardless of a number of tariff lines affected, each registered measure is counted as one. For example, Decree on the Control of the Movement of Animals and Animal Products, number 230/GOL dated on 4th June 2012, indicates that To import of livestock and animal products, the import permit issued designated by the relevant department of the Ministry of Agriculture and Forestry is required. This is an NTM and classified as A14 according to UNCTAD s February 2012 Version Classification. This measure affects 913 national tariff lines. It is, however, counted as one measure. The national tariff line of the Lao PDR is at 8-digit HS Code and the total number of tariff lines is 9,558.

14 Counting measure_id, and not measures on products
15 NTM by source/issuing institution, the same as mentioned above No Issuing Institution Number of NTMs 1 Ministry of Trade 2 Ministry of Agriculture 3 Ministry of Health The rest institutions Total % of total number of NTMs * The NTM issuing institutions can be varied in every country, the mentioned 3 ministries are just an example. Please mention the top 10 institutions that issue the highest number of NTM-related regulations, then the rest of institutions are classified as the rest institutions (No. 11)


16 This is not Percentage of NTM by product, but % OF PRODUCTS WITH 3 OR + MEASURES
17 Correctly named: this is nbr of products, not nbr of measures
18 This is average number of measures on any product in a certain group
19 Data collection starts from reading regulations, data analysis starts from the products affected to see how many, or which ones, are affected, by which measures and/or by how many of them.

20 WITS website


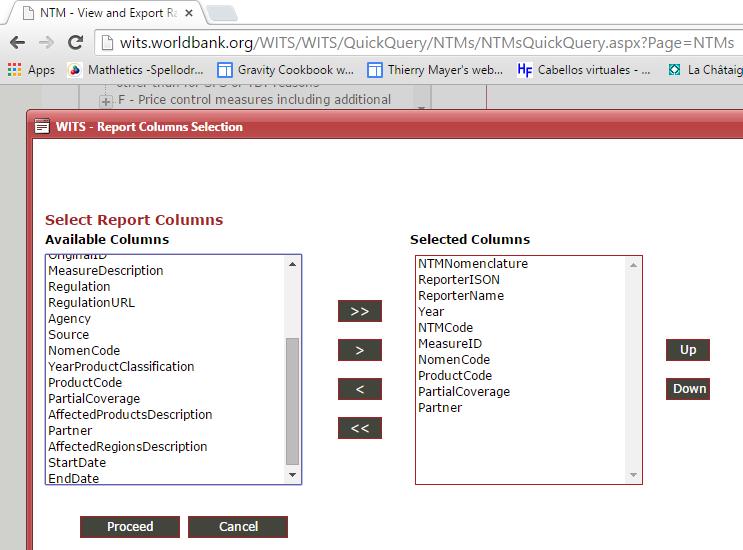
21 How to access data

22 Select which product/s Always shows most detailed product level, does not aggregate
23
24 Key simple questions on NTM that we can (now) start to answer What are the measures that countries impose? Legal mandatory requirements, all trade-control regulations What measures are applied to a particular product? How many of my importing products have to comply with an NTM? What share of my imports (in value) have to comply with an NTM? What are the most typical measures in my country?
25 Incidence measures, inventory approach Frequency index F j = σ D i M ij σ M i How many of my importing products have to comply with an NTM? Coverage ratio C j = σ D i V ij σ V i What share of my imports (in value) have to comply with an NTM? Intensity (prevalence score?), or frequency count + What are the most typical measures in my country? + How many regulations do food products have?
26 Some data. América Latina Frequency index ARG BOL BRA CHL COL CUB ECU MEX PER PRY URY VEN No NTM 17% 75% 38% 44% 30% 7% 54% 40% 67% 72% 50% 12% With NTM 83% 25% 62% 56% 70% 93% 46% 60% 33% 28% 50% 88% Total Nbr. Of HS6 5,461 5,461 5,461 5,461 5,461 5,461 5,461 5,461 5,461 5,461 5,461 5,461 Coverage Ratio ARG BOL BRA CHL COL CUB ECU MEX PER PRY URY Ratio 92% 44% 72% 46% 88% 57% 65% 43% 41% 66%
27
28 WORLD AVERAGE AD-VALOREM EQUIVALENT OF NTMS Animals Vegetables Fats & oils Beverages & tobacco Minerals Chemicals Plastics Leather Wood products Paper Textile and clothing Footwear Stone & glass Pearls Metals Machinery Vehicles Not included: subsidies/domestic support and export restrictions Source: UNCTAD per cent (%) SPS TBT Other NTMs
29 NTM from WITS - Mock exercise Excel small example
30 NTM from WITS - exercise Download one country, e.g. Viet Nam We need to merge with trade data, We download Viet Nam exports it from WITS

31 Trade data - choose COMTRADE database Reporter

32 Trade data Products
33 Trade data Products

34 Trade data Partner

35 Trade data View results

36 Trade data Download data
37 NTM from WITS preparing for exercise Problems encountered NTM data is at 8 digits for products Trade data from WITS is HS6 So we need to turn NTM data into 6 digits to combine both datasets
38 Incidence measures, inventory approach First descriptive analysis Frequency index F j = σ D i M ij σ M i How many of my importing products have to comply with an NTM? 1. Marking those HS categories with a binary variable equal to one for those that have NTMs and zero otherwise. 2. Counting how many products are signaled with a 1 3. Relate to the total number of products Existing products (for all countries in the World), or Only those in the export basket of the country 4. This gives a coverage ratio of per cent in our example (31.28% %).The same calculation can be carried out for a country s entire trade, producing a summary measure of the incidence of NTMs.
39 Incidence measures, inventory approach Coverage ratio C j = σ D i V ij σ V i What share of my imports (in value) have to comply with an NTM? 1. Marking those HS categories with a binary variable equal to one for those that have NTMs and zero otherwise. 2. Multiplying this binary variable by the import share of each category and taking the sum. 3. Relate to the total import value of the affected products to total import value (at bilateral level?) 4. This gives a coverage ratio of per cent in our example (31.28% %).The same calculation can be carried out for a country s entire trade, producing a summary measure of the incidence of NTMs.
40 Incidence measures, inventory approach Frequency index F j = σ D i M ij σ M i How many of my importing products have to comply with an NTM? Coverage ratio C j = σ D i V ij σ V i What share of my imports (in value) have to comply with an NTM? Intensity (prevalence score?), or frequency count + What are the most typical measures in my country? + How many regulations do food products have?
41 NTM database structure Measure ID NTM code Product Code Regulation Partner country Year & Prod.classif Remember : Regulation 1 Measure 1 Measure 2 Measure 3 Products Affected Countries Affected Objectives mentioned Products Affected Countries Affected Objectives mentioned Products Affected Countries Affected Objectives mentioned Each measure in the regulation will have a different ID And each NTM affects the same (or different) group of products This means we will find duplications
42 NTM database structure Measure ID NTM code (several) Regulation (several) Year & Prod.classif Product Code Partner country There are several products for each NTM code And several countries affected This means we will find duplications
43 NTM database structure Measure ID 1 NTM code 1 Product Code 1 Regulation 1 Partner country 1 Year & Prod.classif Measure ID 2 NTM code 2 Product Code 1 Regulation 1 Partner country 1 Year & Prod.classif This means we cannot simply erase all duplications to compute FreqIndex and CoverageRatio Trade Each product may appear more than once in the database, with different NTM, But with the same value of trade Trade Partner Or the same product with different Regulation
44 NTM from WITS - exercise Any introduction needed for STATA?
45 WARNING Aggregation from Tariff Line to HS6, HS4 or HS2 There will appear several duplications. Some duplications come from the aggregation itself, (a number of products at tariff line is to be replaced by just one code at HS6). All these should disappear Done already Need to observe and distinguish the legal origin of the measure, (2 or more legal texts mention the same NTM code on the same products) These have to remain, they are taken into account with measure_id Also see Partial Coverage On the original product, at tariff line type I Partial due to the aggregation (only some lines affected fully) type II
46 Frequency index Coverage ratio Brazil, 2014 Calculated at HS6 Calculated at HS4 Erroneous calculation Frequency Index 80.6% 79.6% 99.7% Total products traded 5,617 1,234 8,790,072 Total products traded that are affected by an NTM 4, ,768,012 Calculated at HS6 Calculated at HS4 Erroneous calculation Coverage Ratio 87.3% 88.8% 98.4% Total value of imports 229,054, ,054,272 2,102,506,240 Total value of imports that are affected by an NTM 200,054, ,347,456 2,069,077,120
47 NTM data is legal in origin Counting of measures, not dummy any more Number of measures (horizontal axis) applying to number of products (vertical axis) Two measures with the same NTM code would be counted twice if they are set by two distinct legal texts, and presumably refer to distinct requirements to be met by exporters Correct. Accounting for Regulation Wrong. Droping those originated in distinct regulations (with the same NTM code)
48 Cumulative Probability Cumulative Probability NTM data is legal in origin Cumulative distribution function for Frequency count of NTM for Brazil, Number of NTM on a product Erroneous calculation. Number of NTM on a product Correct identification of Regulations Erroneous dropping of observations when originated in different regulations
49 Counting products vs. measures 1. Counting of products at HS6 level that face have distinct NTM, Number of products in each category of number of NTM all types of measures all sectors hs6 hs4
50 Counting of Measures Agri-food is usually one of the highest regulated sectors How many measures does any agri-food / manufacturing product face? In all (the maximum for this country) On average Agri-food Minerals,chemicals,plastics Leather,wood,paper,textiles,stone,glass Manufactures, Base metals Mean Number of NTM Mean of count Total nbr of NTM
51 Counting of Measures 0.9 percentile How many measures does any agri-food / manufacturing product face? In all (the 0.9 percentile for this country) TBT SPS Other Mean and Total Number of NTM On average Mean of count Total nbr of NTM
52 NTM data is bilateral The average of the bilateral Coverage Ratio for all countries is not equal to the global Coverage Ratio. While the global value is above 87%, the average of all individual bilateral values is 84% (in our recent example from Brasil)
53
Non-Tariff Measures (NTMs) Arun Jacob
 Arun Jacob") Non-Tariff Measures (NTMs) Arun Jacob jacoba@un.org Outline Introduction : an overview of NTMs Classification of NTMs Incidence statistics and data sources Data exercise - I Impact of NTMs Data exercise
Non-Tariff Measures (NTMs) Arun Jacob jacoba@un.org Outline Introduction : an overview of NTMs Classification of NTMs Incidence statistics and data sources Data exercise - I Impact of NTMs Data exercise
Session 12 Achieving trade-related SDGs: Issues with tariffs and other trade measures
 REGIONAL WORKSHOP ON LEAST DEVELOPED COUNTRIES AND LEVERAGING TRADE AS A MEANS OF IMPLEMENTATION FOR THE 2030 AGENDA Session 12 Achieving trade-related SDGs: Issues with tariffs and other trade measures
Exports to major trading partners and duties faced
 European Communities Part A.1 Tariffs and imports: Summary and duty ranges Summary Total Ag Non-Ag WTO member since 1995 Simple average final bound 5.4 15.4 3.9 Binding coverage: Total 100 Simple average
Exports to major trading partners and duties faced
 Malawi Part A.1 Tariffs and imports: Summary and duty ranges Summary Total Ag Non-Ag WTO member since 1995 Simple average final bound 75.9 121.3 42.4 Binding coverage: Total 31.2 Simple average MFN applied
Exports to major trading partners and duties faced
 Australia Part A.1 Tariffs and imports: Summary and duty ranges Summary Total Ag Non-Ag WTO member since 1995 Simple average final bound 9.9 3.4 11.0 Binding coverage: Total 97.0 Simple average MFN applied
Exports to major trading partners and duties faced
 Indonesia Part A.1 Tariffs and imports: Summary and duty ranges Summary Total Ag Non-Ag WTO member since 1995 Simple average final bound 37.1 47.0 35.6 Binding coverage: Total 96.6 Simple average MFN applied
Exports to major trading partners and duties faced
 Sri Lanka Part A.1 Tariffs and imports: Summary and duty ranges Summary Total Ag Non-Ag WTO member since 1995 Simple average final bound 30.3 50.1 19.6 Binding coverage: Total 37.8 Simple average MFN applied
Exports to major trading partners and duties faced
 Macao, China Part A.1 Tariffs and imports: Summary and duty ranges Summary Total Ag Non-Ag WTO member since 1995 Simple average final bound 0.0 0.0 0.0 Binding coverage: Total 26.8 Simple average MFN applied
The Rising Importance of Non-tariff Measures in China s Trade Policy. Zhaohui Niu School of Public Administration, Beihang University, Beijing, China
 The Rising Importance of Non-tariff Measures in China s Trade Policy Zhaohui Niu School of Public Administration, Beihang University, Beijing, China Outline Introduction Evolution of trade policy in China
Non-Tariff Measures in ASEAN
 Australia Indonesia Partnership for Economic Governance Economic Research Institute for ASEAN and East Asia Non-Tariff Measures in ASEAN Bangkok, 12-16 Dec 2016 ERNAWATI MUNADI WTO/ESCAP-ARTNeT Capacity
THE UNSEEN IMPACT OF NON-TARIFF MEASURES:
 (Preliminary draft) THE UNSEEN IMPACT OF NON-TARIFF MEASURES: Photo credit: Fotolia Dmitry V. Petrenko Insights from a new database 218, United Nations and World Bank This work is available open access
Benin WORLD TARIFF PROFILES 2008 COUNTRY PAGES. Benin. Tariffs and imports: Summary and duty ranges Summary
 Benin Benin Part A.1 Tariffs and imports: Summary and duty ranges Summary Total Ag Non-Ag WTO member since 1996 Simple average final bound 28.3 61.8 11.4 Binding coverage: Total 39.3 Simple average MFN
Democratic Republic of the Congo
 Democratic Republic of the Congo Democratic Republic of the Congo Part A.1 Tariffs and imports: Summary and duty ranges Summary Total Ag Non-Ag WTO member since 1997 Simple average final bound 96.2 98.2
Tariffs and imports: Summary and duty ranges Summary
 Barbados Barbados Part A.1 Tariffs and imports: Summary and duty ranges Summary Total Ag Non-Ag WTO member since 1995 Simple average final bound 78.1 111.2 72.9 Binding coverage: Total 97.9 Simple average
Tariffs and imports: Summary and duty ranges Summary
 Zambia Zambia Part A.1 Tariffs and imports: Summary and duty ranges Summary Total Ag Non-Ag WTO member since 1995 Simple average final bound 106.4 123.3 42.2 Binding coverage: Total 16.7 Simple average
Qatar WORLD TARIFF PROFILES 2008 COUNTRY PAGES. Qatar. Tariffs and imports: Summary and duty ranges Summary
 Qatar Qatar Part A.1 Tariffs and imports: Summary and duty ranges Summary Total Ag Non-Ag WTO member since 1996 Simple average final bound 16.0 25.7 14.5 Binding coverage: Total 100 Simple average MFN
Tariffs and imports: Summary and duty ranges Summary
 New Zealand New Zealand Part A.1 Tariffs and imports: Summary and duty ranges Summary Total Ag Non-Ag WTO member since 1995 Simple average final bound 9.9 5.7 10.6 Binding coverage: Total 99.9 Simple average
Tariffs and imports: Summary and duty ranges Summary
 Mexico Mexico Part A.1 Tariffs and imports: Summary and duty ranges Summary Total Ag Non-Ag WTO member since 1995 Simple average final bound 36.1 44.1 34.9 Binding coverage: Total 100 Simple average MFN
Mongolia WORLD TARIFF PROFILES 2008 COUNTRY PAGES. Mongolia. Tariffs and imports: Summary and duty ranges Summary
 Mongolia Mongolia Part A.1 Tariffs and imports: Summary and duty ranges Summary Total Ag Non-Ag WTO member since 1997 Simple average final bound 17.6 18.9 17.3 Binding coverage: Total 100 Simple average
Tariffs and imports: Summary and duty ranges Summary
 Philippines Philippines Part A.1 Tariffs and imports: Summary and duty ranges Summary Total Ag Non-Ag WTO member since 1995 Simple average final bound 25.6 34.6 23.4 Binding coverage: Total 66.8 Simple
China WORLD TARIFF PROFILES 2008 COUNTRY PAGES. China. Tariffs and imports: Summary and duty ranges Summary
 China China Part A.1 Tariffs and imports: Summary and duty ranges Summary Total Ag Non-Ag WTO member since 2001 Simple average final bound 10.0 15.8 9.1 Binding coverage: Total 100 Simple average MFN applied
SOUTH SOUTH TRADE MONITOR
 SOUTH SOUTH TRADE MONITOR No. 2 July 2013 Total South-South trade: In 2011, South South merchandize exports reached $4 trillion. Since 2008/2009, the South has been exporting more to other developing countries
Tariffs and imports: Summary and duty ranges Summary
 Armenia Armenia Part A.1 Tariffs and imports: Summary and duty ranges Summary Total Ag Non-Ag WTO member since 2003 Simple average final bound 8.5 14.7 7.5 Binding coverage: Total 100 Simple average MFN
Tariffs and imports: Summary and duty ranges Summary
 Malawi Malawi Part A.1 Tariffs and imports: Summary and duty ranges Summary Total Ag Non-Ag WTO member since 1995 Simple average final bound 75.9 121.3 42.4 Binding coverage: Total 31.2 Simple average
Tariffs and imports: Summary and duty ranges Summary
 Djibouti Djibouti Part A.1 Tariffs and imports: Summary and duty ranges Summary Total Ag Non-Ag WTO member since 1995 Simple average final bound 41.0 48.4 39.9 Binding coverage: Total 100 Simple average
Sri Lanka WORLD TARIFF PROFILES 2008 COUNTRY PAGES. Sri Lanka. Tariffs and imports: Summary and duty ranges Summary
 Sri Lanka Sri Lanka Part A.1 Tariffs and imports: Summary and duty ranges Summary Total Ag Non-Ag WTO member since 1995 Simple average final bound 30.3 50.0 19.7 Binding coverage: Total 37.8 Simple average
Tariffs and imports: Summary and duty ranges Summary
 Colombia Colombia Part A.1 Tariffs and imports: Summary and duty ranges Summary Total Ag Non-Ag WTO member since 1995 Simple average final bound 42.9 91.9 35.4 Binding coverage: Total 100 Simple average
Tariffs and imports: Summary and duty ranges Summary
 Tanzania Tanzania Part A.1 Tariffs and imports: Summary and duty ranges Summary Total Ag Non-Ag WTO member since 1995 Simple average final bound 120.0 120.0 120.0 Binding coverage: Total 13.4 Simple average
Haiti WORLD TARIFF PROFILES 2008 COUNTRY PAGES. Haiti. Tariffs and imports: Summary and duty ranges Summary
 Haiti Haiti Part A.1 Tariffs and imports: Summary and duty ranges Summary Total Ag Non-Ag WTO member since 1996 Simple average final bound 18.7 21.3 18.3 Binding coverage: Total 89.2 Simple average MFN
Jordan WORLD TARIFF PROFILES 2008 COUNTRY PAGES. Jordan. Tariffs and imports: Summary and duty ranges Summary
 Jordan Jordan Part A.1 Tariffs and imports: Summary and duty ranges Summary Total Ag Non-Ag WTO member since 2000 Simple average final bound 16.3 23.8 15.2 Binding coverage: Total 100.0 Simple average
Albania WORLD TARIFF PROFILES 2008 COUNTRY PAGES. Albania. Tariffs and imports: Summary and duty ranges Summary
 Albania Albania Part A.1 Tariffs and imports: Summary and duty ranges Summary Total Ag Non-Ag WTO member since 2000 Simple average final bound 7.0 9.4 6.6 Binding coverage: Total 100 Simple average MFN
Tariffs and imports: Summary and duty ranges Summary
 Grenada Grenada Part A.1 Tariffs and imports: Summary and duty ranges Summary Total Ag Non-Ag WTO member since 1996 Simple average final bound 56.7 101.0 50.0 Binding coverage: Total 100 Simple average
Assessing the impacts of NTMs in trade
 Wiener Institut für Internationale Wirtschaftsvergleiche The Vienna Institute for International Economic Studies www.wiiw.ac.at Assessing the impacts of NTMs in trade Robert Stehrer The Vienna Institute
Trade Policy in Brazil. What is the Agenda?
 Inter-American Development Bank Trade Policy in Brazil. What is the Agenda? Mauricio Mesquita Moreira, Senior Trade Economist Integration and Trade Sector Brazil and the United States: Trade Agendas and
WORLD TRADE ORGANIZATION
 WORLD TRADE ORGANIZATION WT/REG216/2 6 February 2009 (09-0601) Committee on Regional Trade Agreements FACTUAL PRESENTATION Economic Partnership Agreement between Japan and Malaysia (Goods and Services)
( ) Page: 1/60 FACTUAL PRESENTATION FREE TRADE AGREEMENT BETWEEN THE ASSOCIATION OF SOUTHEAST ASIAN NATIONS (ASEAN) AND INDIA (GOODS)
 Page: 1/60 FACTUAL PRESENTATION FREE TRADE AGREEMENT BETWEEN THE ASSOCIATION OF SOUTHEAST ASIAN NATIONS (ASEAN) AND INDIA (GOODS)") WT/COTD/RTA/8/1 14 December 216 (16-6789) Page: 1/6 Committee on Trade and Development Dedicated Session on Regional Trade Agreements FACTUAL PRESENTATION FREE TRADE AGREEENT BETWEEN THE ASSOCIATION OF
WT/COTD/RTA/8/1 14 December 216 (16-6789) Page: 1/6 Committee on Trade and Development Dedicated Session on Regional Trade Agreements FACTUAL PRESENTATION FREE TRADE AGREEENT BETWEEN THE ASSOCIATION OF
Recent developments in international trade and in the use of trade policy instruments
 Recent developments in international trade and in the use of trade policy instruments Short courses for Permanent Missions in Geneva Organised by the Division on Technology and Logistics Delivered by the
TRADE PREFERENCE INDEX
 TRADE PREFERENCE INDEX Maria Cipollina (Università del Molise) David Laborde (International Food Policy Research Institute) Luca Salvatici (Università del Molise) Agricultural, Food and Bio-energy Trade
Online Appendix: Tariffs and Firm Performance in Ethiopia
 Online Appendix: Tariffs and Firm Performance in Ethiopia Arne Bigsten, Mulu Gebreeyesus and Måns Söderbom $ August 2015 Document description: This appendix contains additional material for the study Tariffs
Parallel Session 7: Regional integration
 ASIA-PACIFIC RESEARCH AND TRAINING NETWORK ON TRADE ARTNeT CONFERENCE ARTNeT Trade Economists Conference Trade in the Asian century - delivering on the promise of economic prosperity 22-23 rd September
Appendix A Specification of the Global Recursive Dynamic Computable General Equilibrium Model
 Appendix A Specification of the Global Recursive Dynamic Computable General Equilibrium Model The model is an extension of the computable general equilibrium (CGE) models used in China WTO accession studies
Session 3: ATIGA and Rules of Origin
 TRAINING PROGRAMME ON NEGOTIATING PREFERENTIAL TRADE AGREEMENTS Session 3: ATIGA and Rules of Origin 29-31 August Phnom Penh, Cambodia Rajan Sudesh Ratna Economic Affairs Officer Trade, Investment and
ALADI Initiatives on Non-Tariff Measures
 ALADI Initiatives on Non-Tariff Measures Non-Tariff Measures Week Mandatory Trade Regulations and Voluntary Sustainability Standards 25-27 September 2017 General Secretariat of the ALADI sgaladi@aladi.org
KEY INDICATORS AND TRENDS
 United Nations Conference on Trade And Development KEY INDICATORS AND TRENDS in Trade Policy 2016 G20 POLICIES AND LEAST DEVELOPED COUNTRIES EXPORT PERFORMANCE United Nations Conference on Trade And Development
Why do we need RCEP? Lili Yan Ing. The Establishment of the AEC and RCEP: Challenges and Opportunities Taipei, 29 July 2015
 Economic Research Institute for ASEAN and East Asia The Establishment of the AEC and RCEP: Challenges and Opportunities Taipei, 29 July 2015 Why do we need RCEP? Lili Yan Ing 1 Outline 1. Review of ASEAN
Major Highlights. Recent Economic Developments April/May Central Bank of Swaziland 1
 Major Highlights Annual consumer inflation increased to 7.0 per cent in April 2017 from 6.0 per cent in March 2017. Inflation rate (% y/y) 7.0 (Apr) Discount and prime lending rates remained unchanged
KEY STATISTICS AND TRENDS
 UNCTAD UNITED NATIONS UNITED NATIONS CONFERENCE ON TRADE AND DEVELOPMENT KEY STATISTICS AND TRENDS in Trade Policy 2014 New York and Geneva, 2015 ii NOTE Key Statistics and Trends in Trade Policy 2014
Francis Da Silva. Chairman of CCILL Chambre de Commerce et d Industrie Luso - Luxembourgeoise
 Francis Da Silva Chairman of CCILL Chambre de Commerce et d Industrie Luso - Luxembourgeoise Who is CCILL? CCILL exist since 1991 under the name of APIL. So, we are in the field for more than 25 years.
Effect of tariff increase on residential sector preliminary results. Dr Johannes C Jordaan
 Effect of tariff increase on residential sector preliminary results Dr Johannes C Jordaan Scope Impact on residential sector (i.e. households) Impact of: nominal tariff increases, 2x25% in 2013 and 2014
TRADE IN GOODS OF BULGARIA WITH THIRD COUNTRIES IN THE PERIOD JANUARY - FEBRUARY 2019 (PRELIMINARY DATA)
") TRADE IN GOODS OF BULGARIA WITH THIRD COUNTRIES IN THE PERIOD JANUARY - FEBRUARY 2019 (PRELIMINARY DATA) In the period January - February 2019 the exports of goods from Bulgaria to third countries increased
TRADE IN GOODS OF BULGARIA WITH THIRD COUNTRIES IN THE PERIOD JANUARY - FEBRUARY 2019 (PRELIMINARY DATA) In the period January - February 2019 the exports of goods from Bulgaria to third countries increased
Regional and Global Trade Strategies for Liberia
 Regional and Global Trade Strategies for Liberia Jaime de Melo FERDI, IGC Armela Mancellari IGC International Growth Centre de Melo, Mancellari Regional and Global Trade Strategies for Liberia Outline
Note on Trade and Investment Policy Coordination in Lao PDR
 Note on Trade and Investment Policy Coordination in Lao PDR Prepared by Sirisamphanh Vorachith, Deputy Permanent Secretary, Ministry of Industry and Commerce, Lao PDR ARTNeT Consultative Meeting on Trade
Assessing the Impact of Non-Tariff Measures on Imports
 Wiener Institut für Internationale Wirtschaftsvergleiche The Vienna Institute for International Economic Studies www.wiiw.ac.at PRONTO Annual Conference: Quantifying Non-Tariff Barriers to Trade and Investment
Good Regulatory Practice for NTMs monitoring
 Good Regulatory Practice for NTMs monitoring Ha Thi Thanh Doan Economic Research Institute for ASEAN and East Asia ASEAN-CER Integration Partnership Forum Da Nang, 5 th April 2018 1 NTMs Definition Policy
Import - Export Unit Value. Index (MXUVI) Released Date: March 2017
 Released Date: March 2017") Import - Export Unit Value Index (MXUVI) 2016 Released Date: March 2017 Introduction The United Arab Emirates is one of the developed countries that has established its position on the global trade map.
Import - Export Unit Value Index (MXUVI) 2016 Released Date: March 2017 Introduction The United Arab Emirates is one of the developed countries that has established its position on the global trade map.
An Uneven Recovery. Outlook for Latin America and the Caribbean. A Presentation by Western Hemisphere Department
 International Monetary Fund November 1, 2018 An Uneven Recovery Outlook for Latin America and the Caribbean A Presentation by Western Hemisphere Department I. Key Messages II. Global Crosscurrents III.
Non-tariff measures related to foreign trade liberalization in selected Arab countries. Summary
 UNITED NATIONS ECONOMIC AND SOCIAL COUNCIL E Distr. LIMITED E/ESCWA/EDID/2015/IG.2/4 25 August 2014 ORIGINAL: ENGLISH Economic and Social Commission for Western Asia (ESCWA) Committee on Liberalization
HARMONISED SYSTEM OF NOMENCLATURE, SOURCES OF TRADE DATA (EXCEL, WITS, DGCIS AND SCHEDULE OF WTO TARIFF COMMITMENTS)
") HARMONISED SYSTEM OF NOMENCLATURE, SOURCES OF TRADE DATA (EXCEL, WITS, DGCIS AND SCHEDULE OF WTO TARIFF COMMITMENTS) Dr. Murali Kallummal, Associate Professor, CWS Dr. Sachin Kumar Sharma, Assistant Professor,
HARMONISED SYSTEM OF NOMENCLATURE, SOURCES OF TRADE DATA (EXCEL, WITS, DGCIS AND SCHEDULE OF WTO TARIFF COMMITMENTS) Dr. Murali Kallummal, Associate Professor, CWS Dr. Sachin Kumar Sharma, Assistant Professor,
( ) Page: 1/79 FACTUAL PRESENTATION
 Page: 1/79 FACTUAL PRESENTATION") 19 January 2015 (15-0350) Page: 1/79 Committee on Regional Trade Agreements FACTUAL PRESENTATION TRADE AGREEMENT BETWEEN THE EUROPEAN UNION AND ITS MEMBER STATES, OF THE ONE PART AND COLOMBIA AND PERU,
19 January 2015 (15-0350) Page: 1/79 Committee on Regional Trade Agreements FACTUAL PRESENTATION TRADE AGREEMENT BETWEEN THE EUROPEAN UNION AND ITS MEMBER STATES, OF THE ONE PART AND COLOMBIA AND PERU,
A Comparison of Official and EUKLEMS estimates of MFP Growth for Canada. Wulong Gu Economic Analysis Division Statistics Canada.
 A Comparison of Official and EUKLEMS estimates of MFP Growth for Canada Wulong Gu Economic Analysis Division Statistics Canada January 12, 2012 The Canadian data in the EU KLEMS database is now updated
REMOVING TRADE BARRIERS IN BRAZIL
 REMOVING TRADE BARRIERS IN BRAZIL A QUANTITATIVE ANALYSIS USING METRO Sónia Araújo Senior Economist, OECD WTO PUBLIC FORUM Trade: Behind the Headlines Session 78: Distributive impacts of trade liberalisation
Evidence Based Trade policy Making: Using statistical tools for policy making
 NATIONAL WORKSHOP ON TRADE POLICY CHOICES: ACCESSION TO WTO AND APTA 8-10 DECEMBER 2014, Bhutan Evidence Based Trade policy Making: Using statistical tools for policy making Witada Aunkoonwattaka (PhD)
ARTNeT Capacity Building Workshop on Trade Research UN ESCAP WITS
 United Nations Conference on Trade and Development ARTNeT Capacity Building Workshop on Trade Research UN ESCAP WITS World Integrated Trade Solution Ralf Peters UNCTAD Bangkok, March 25 World Integrated
THE UNSEEN IMPACT OF NON-TARIFF MEASURES:
 U N I T E D N AT I O N S C O N F E R E N C E O N T R A D E A N D D E V E L O P M E N T AND THE WORLD BANK THE UNSEEN IMPACT OF NON-TARIFF MEASURES: Insights from a new database U N I T E D N AT I O N
Economic Impact of Canada s Participation in the Comprehensive and Progressive Agreement for Trans-Pacific Partnership
 Economic Impact of Canada s Participation in the Comprehensive and Progressive Agreement for Trans-Pacific Partnership Office of the Chief Economist, Global Affairs Canada February 16, 2018 1. Introduction
ECA. An empirical assessment of the African Continental Free Trade Area modalities on goods. November 2018
 ECA An empirical assessment of the African Continental Free Trade Area modalities on goods November 2018 The Economic Commission for Africa (ECA) recently conducted a new economic modelling analysis to
A way out of preferential deals OECD Global Forum on Trade 2014, February, OECD Conference Centre, Paris
 A way out of preferential deals OECD Global Forum on Trade 2014, 11-12 February, OECD Conference Centre, Paris Jayant Menon Lead Economist (Trade and Regional Cooperation) Office of Regional Economic Integration
APPENDIX to Pyramidal Ownership and the Creation of New Firms
 APPENDIX to Pyramidal Ownership and the Creation of New Firms This Appendix reports additional results that we discuss but do not tabulate in the main text of the paper. The content is summarized below,
STUDY OF AVERAGE EFFECTS OF NTM ON TRADE IMPORTS
 STUDY OF AVERAGE EFFECTS OF NTM ON TRADE IMPORTS (Unedited Version) Denise Penello Rial* United Nations Conference on Trade and Development, Geneva August 2012 * I am grateful for valuable comments and
BRAZILIAN ROLE IN THE GLOBAL VALUE CHAINS
 BRAZILIAN ROLE IN THE GLOBAL VALUE CHAINS Joaquim J.M. Guilhoto Denise Imori Department of Economics University of São Paulo E-mail: guilhoto@usp.br - Internet: guilhotojjmg.wordpress.com Université Paris-Dauphine
KEY STATISTICS AND TRENDS
 UNCTAD UNITED NATIONS CONFERENCE ON TRADE AND DEVELOPMENT KEY STATISTICS AND TRENDS in Trade Policy 2018 TRADE TENSIONS, IMPLICATIONS FOR DEVELOPING COUNTRIES UNITED NATIONS UNITED NATIONS CONFERENCE
Minneapolis Area Service Port
 Minneapolis Area Service Port Trade Operations Division Midwest Global Trade Association Educational Seminar Antidumping & Countervailing Duty (AD/CVD) November 21 st, 2014 Import Specialists DISCLAIMER:
BULGARIAN TRADE WITH THIRD COUNTRIES FOR THE PERIOD JANUARY - NOVEMBER 2010 (PRELIMINARY DATA)
") BULGARIAN TRADE WITH THIRD COUNTRIES FOR THE PERIOD JANUARY - NOVEMBER 2010 (PRELIMINARY DATA) In the period January - November 2010 the Bulgarian exports to third countries increased by 46.9 compared
BULGARIAN TRADE WITH THIRD COUNTRIES FOR THE PERIOD JANUARY - NOVEMBER 2010 (PRELIMINARY DATA) In the period January - November 2010 the Bulgarian exports to third countries increased by 46.9 compared
Missouri Economic Indicator Brief: Manufacturing Industries
 Missouri Economic Indicator Brief: Manufacturing Industries Manufacturing is a major component of Missouri s $300.9 billion economy. It represents 13.1 percent ($39.4 billion) of the 2016 Gross State Product
Asia-Pacific Trade Briefs: Hong Kong, China
 i Asia-Pacific Trade Briefs: Hong Kong, China Merchandise Trade Hong Kong, China has a trade-to-gdp ratio of 386.95%. Merchandise trade accounted for 86.3% of Hong Kong, China's total trade in 2017. Hong
< Chapter 1 > Outline of The 2000 Japan-U.S. Input-Output Table
 < Chapter 1 > Outline of The 2000 apan-.s. Input-Output Table 1. Background of the International Input-Output Table (1) As is apparent from the sharp fluctuations in exchange rates since the 1973 oil shock
BULGARIAN TRADE WITH THIRD COUNTRIES IN THE PERIOD JANUARY - FEBRUARY 2017 (PRELIMINARY DATA)
") BULGARIAN TRADE WITH THIRD COUNTRIES IN THE PERIOD JANUARY - FEBRUARY 2017 (PRELIMINARY DATA) In the period January - February 2017 Bulgarian exports to third countries increased by 20.0 in comparison
BULGARIAN TRADE WITH THIRD COUNTRIES IN THE PERIOD JANUARY - FEBRUARY 2017 (PRELIMINARY DATA) In the period January - February 2017 Bulgarian exports to third countries increased by 20.0 in comparison
Update: Interim Economic Partnership Agreements
 TRADE POLICY in PRACTICE GLOBAL EUROPE 13 December 2007 Update: Interim Economic Partnership Agreements The EU and the African, Caribbean and Pacific countries (ACP) have been working to put in place new
Measuring Productivity in the Public Sector: A personal view
 Measuring Productivity in the Public Sector: A personal view Matilde Mas University of Valencia and Ivie OECD WORKSHOP ON PRODUCTIVITY OECD Conference Centre Paris, 5-6 November 2012 [ 1 ] Problems faced:
Inclusive and Sustainable Industrial Development Working Paper Series WP THE MULTIPLIER EFFECTS OF MANUFACTURING CONSUMPTION
 Inclusive and Sustainable Industrial Development Working Paper Series WP 10 2018 THE MULTIPLIER EFFECTS OF MANUFACTURING CONSUMPTION DEPARTMENT OF POLICY, RESEARCH AND STATISTICS WORKING PAPER 10/2018
Statistics on UK-EU trade
 BRIEFING PAPER Number 7851, 4 July 2018 Statistics on UK-EU trade By Matthew Ward Contents: 1. Overview 2. Trade between EU & Scotland, Wales, Northern Ireland & English regions 3. Tariffs 4. Appendix:
( ) Page: 1/8 FREE TRADE AGREEMENT BETWEEN THE ASSOCIATION OF SOUTHEAST ASIAN NATIONS (ASEAN) AND INDIA (GOODS) QUESTIONS AND REPLIES
 Page: 1/8 FREE TRADE AGREEMENT BETWEEN THE ASSOCIATION OF SOUTHEAST ASIAN NATIONS (ASEAN) AND INDIA (GOODS) QUESTIONS AND REPLIES") 7 March 2017 (17-1351) Page: 1/8 Committee on Trade and Development Dedicated Session on Regional Trade Agreements Original: English FREE TRADE AGREEMENT BETWEEN THE ASSOCIATION OF SOUTHEAST ASIAN NATIONS
7 March 2017 (17-1351) Page: 1/8 Committee on Trade and Development Dedicated Session on Regional Trade Agreements Original: English FREE TRADE AGREEMENT BETWEEN THE ASSOCIATION OF SOUTHEAST ASIAN NATIONS
Annual National Accounts 2016
 Annual National Accounts 2016 Namibia Statistics Agency P.O. Box 2133, FGI House, Post Street Mall, Windhoek, Namibia Tel: +264 61 431 3200 Fax: +264 61 431 3253 Email: info@nsa.org.na www.nsa.org.na Annual
Business Cycle Co-movements and Economic Integration in East Asia
 RIETI-CASS-CESSA Joint Workshop on Establishing Surveillance Indicators for Monetary Cooperation between China and Japan, Beijing, October 28, 2012 Business Cycle Co-movements and Economic Integration
AGREEMENT ESTABLISHING THE ASEAN-AUSTRALIA-NEW ZEALAND FREE TRADE AREA (AANZFTA) Making Use of AANZFTA to Export or Import Goods
 Making Use of AANZFTA to Export or Import Goods") AGREEMENT ESTABLISHING THE ASEAN-AUSTRALIA-NEW ZEALAND FREE TRADE AREA (AANZFTA) Making Use of AANZFTA to Export or Import Goods Contents 1. Introduction 2. AANZFTA s Tariff Commitments 2.1 Overview of
AGREEMENT ESTABLISHING THE ASEAN-AUSTRALIA-NEW ZEALAND FREE TRADE AREA (AANZFTA) Making Use of AANZFTA to Export or Import Goods Contents 1. Introduction 2. AANZFTA s Tariff Commitments 2.1 Overview of
Presented by S K Mohanty, Fellow, RIS
 Economics of an East Asian FTA Presented by S K Mohanty, Fellow, RIS 1 Structure of Presentation Sustainability of the Asian Eco. Community East Asia FTA emerging as a Mega RTA Changing structure of regional
WORLD TRADE ORGANIZATION
 WORLD TRADE ORGANIZATION TN/MA/W/35 16 May 2003 (03-2639) Negotiating Group on Market Access A. INTRODUCTION DRAFT ELEMENTS OF MODALITIES FOR NEGOTIATIONS ON NON-AGRICULTURAL PRODUCTS 1. In adopting on
Session 5: In search of the meaningful market access what are the policy options for LDCs
 REGIONAL WORKSHOP ON LEAST DEVELOPED COUNTRIES AND LEVERAGING TRADE AS A MEANS OF IMPLEMENTATION FOR THE 2030 AGENDA Session 5: In search of the meaningful market access what are the policy options for
Report No: AUS9097. A Comparative Overview of the Incidence of Non-Tariff Measures on Trade in Lao PDR
 Report No: AUS9097 A Comparative Overview of the Incidence of Non-Tariff Measures on Trade in Lao PDR February 2016 Currency Equivalent Exchange rate effective as of February 24, 2016 (from BCEL): Currency
KEY STATISTICS AND TRENDS
 UNCTAD UNITED NATIONS UNITED NATIONS CONFERENCE ON TRADE AND DEVELOPMENT KEY STATISTICS AND TRENDS in Trade Policy 2017 TRADE IMBALANCES UNITED NATIONS CONFERENCE ON TRADE AND DEVELOPMENT KEY STATISTICS
Integrated Database atabase
 Click here to return to homepage Integrated Database atabase System (IDB) Data Sources Dissemination Policy Means of Dissemination Uses IDB Data Sources nnual notification from all members eadlines for
Main Development Trends of Czech Economy in 2013 and the Perspective for (April 2014)
") Main Development Trends of Czech Economy in 2013 and the Perspective for 2014 (April 2014) The Czech Industry Results in 2013 in the Context of the EU Market and the Perspective for 2014 The Development
Main Development Trends of Czech Economy in 2013 and the Perspective for 2014 (April 2014) The Czech Industry Results in 2013 in the Context of the EU Market and the Perspective for 2014 The Development
Role of PTAs for Promoting MSMEs Integration in GVCs
 Role of PTAs for Promoting MSMEs Integration in GVCs Masato Abe, Ph.D. IEDS, TIID, ESCAP Regional Dialogue on ENHANCING THE CONTRIBUTION OF PREFERENTIAL TRADE AGREEMENTS TO INCLUSIVE AND EQUITABLE TRADE
A COMPARISON OF LATIN AMERICAN AND ASIAN PRODUCT EXPORTS TO THE UNITED STATES, 1972 TO 1999 PETER K. SCHOTT *
 414 Cuadernos de Economía, CUADERNOS Año 4, Nº DE 121, ECONOMIA pp. 414-422 (Vol. (diciembre 4, Nº 121, 23) diciembre 23) A COMPARISON OF LATIN AMERICAN AND ASIAN PRODUCT EXPORTS TO THE UNITED STATES,
User Guide and Explanatory Note for the ESCAP Trade Analytics Portal
 User Guide and Explanatory Note for the ESCAP Trade Analytics Portal INTRODUCTION (Document version 1.0 / January 2019) The purpose of this explanatory note is to narrate how to use the ESCAP Trade Analytics
The Effects of Non-Tariff Measures on Prices, Trade, and Welfare: CGE Implementation of Policy-Based Price Comparisons
 The Effects of Non-Tariff Measures on Prices, Trade, and Welfare: CGE Implementation of Policy-Based Price Comparisons The USITC Office of Economics NTM Project Team Shuby Andriamananjara Judy Dean Bill
FIW-Research Reports 2012/13 N 03 January Policy Note
 FIW-Research Reports 2012/13 FIW-Research Reports 2012/13 N 03 January 2013 Policy Note Modeling the Effects of Free Trade Agreements between the EU and Canada, USA and Moldova/Georgia/Armenia on the Austrian
Data Preparation and Preliminary Trails with TURINA. --TURkey s INterindustry Analysis Model
 Data Preparation and Preliminary Trails with TURINA --TURkey s INterindustry Analysis Model Ozhan Gazi (European University of Lefke) Wang Yinchu (China Economic Information Network of the State Information
Hong Kong, China. Dashboard - Cover Note
 Dashboard-Hong Kong, China 1 Dashboard - Cover Note Hong Kong, China The purpose of the Dashboard is to provide easy-to-understand figures to track the advances in areas critical to promoting greater regional
GOAL 6 FIRMS PARTICIPATING IN FOREIGN EXPORT TRADE
 GOAL 6 FIRMS PARTICIPATING IN FOREIGN EXPORT TRADE By 2028, New Brunswick will have at least 1,080 firms participating in foreign export trade. Status: NOT PROGRESSING Current Situation As outlined in