Europris. 10. November Norway s leading discount variety retailer
|
|
|
- Derick Daniels
- 5 years ago
- Views:
Transcription


1 Europris 10. November 2017 Norway s leading discount variety retailer
2 Europris at a glance Norway s leading discount variety retailer Europris in figures 1 Undisputed market leadership in Norway Nationwide presence Wide assortment at very low prices 245 stores 4 90% brand awareness 3 Efficient sourcing with direct access to end producers 25 years of continuous growth since start in 1992 Total revenue development (NOKm) / 5.1bn Chain 2 / Company sales 4.1% LFL growth % Gross margin 13% Adj. EBITDA margin - General note: Please refer to page 20 for important terms and definitions that apply on this page. 1. All figures for fiscal year 2016 except where explicitly stated otherwise. 2. Based on chain sales 2016 (including franchise stores). 3. According to TNS Gallup; sum of assisted and non-assisted awareness As of September Source: Europris 2


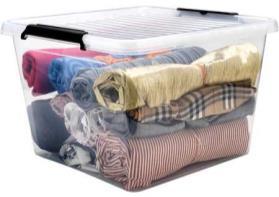
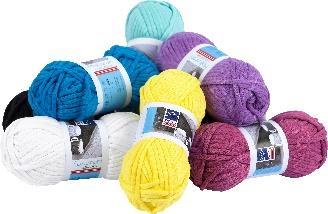
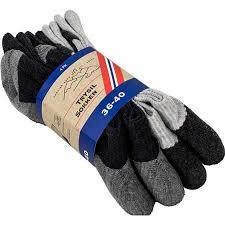
3 Wide assortment that taps into a large addressable market Groceries General merchandise Europris has a truly mixed assortment 2 Personal Care 9% Laundry & Cleaning 3% Pets 3% Home & Kitchen 15% Candy & Chocolate 5% Total addressable market 1 : ~NOK 280bn Groceries 12% Clothes & Shoes 8% Hobby & Office 7% Handyman 7% House & Garden 11% Electronics 9% Travel, Sports & Leisure 11% Speciality retail Large market Competitive flexibility Resilience 1. Total addressable market for packaged food, home & garden, clothing & shoes, leisure & office, health & beauty, and electronics & appliances. 2. Active SKUs year end 2014 Source: Euromonitor, Europris 3

4 Europris is #1 in Norwegian discount variety retail with NO 1:1 competitor Sales in Norway 2016 (NOKm) Entered in Offering Discount variety retail Tools, car supplies, leisure products Hardware, home, leisure, electrical, multimedia Tools, home, electrical, DYI, garden, leisure, car supplies, clothing Discount variety non-food retail Clothing, textiles, cosmetics, tools, home Home, DIY, tools, garden, leisure, electrical # of stores May Assortment overlap to Europris 2 Source: Euromonitor, Ravninfo, Europris 1. Chain sales including franchise stores. 2. Management estimates. 4
5 Discount variety retail set for continued structural growth Clear discount variety retail outperformance Structural trends underpin continued growth Index: 1999 = 100 CAGR Consumer focus on value for money Discount variety retail +14% FMCG supportive of channel as source of growth Landlords increasingly positive due to strong footfall and online resilience Expanding seasons Favorable demographics Source: Ultima Universet, Varde Hartmark Analyser Note: 2016 figures are estimates 5


6 and continues to thrive in the face of an increasingly online retail space International players in the discount variety retail space continue to display strong growth in markets with significantly higher e-commerce penetration than Norway 6
 Reknes Brekstad 17 14 6 Long-term potential of 320-330 stores defined in 2015 Kokstad Tasta 7 22 14 17 24 16 9 Gran Rælingen 20")
7 Clear long term white space opportunity and a solid near term pipeline Total: Six new stores opened so far in 2017 Solid pipeline of new stores Five additional stores confirmed for 2017 Nine confirmed for 2018 so far (three stores subject to zoning process) Reknes Brekstad Long-term potential of stores defined in 2015 Kokstad Tasta Gran Rælingen More than 25k inhabitants per store Between 15k and 25k inhabitants per store 15k or fewer inhabitants per store Note: # of stores updated as at end of September
8 Our new stores continue to deliver Store payback analysis for stores opened Average revenue Average EBITDA Average capex per store Year 1 (12 months) Year 2 (12-24 months) Year 1 (12 months) Year 2 (12-24 months) m 15.2m 0.5m 1.1m 1.5m Stores opened m 16.7m 0.9m 1.2m 1.8m m 15.9m 1.0m 1.4m 1.7m m NA 1.4m NA 2.1m Positive performance by the group s newly opened stores Strong returns continue for latest store vintages 1.4 years average payback on investment (capex) 4.0 years average payback on total committed capital (capex + inventory) Inventory value inflated from NOK depreciation during 2015 Average inventory per store Payback period (excl. inventory) (Based on Year 2 EBITDA) 3.3m ~1.4 years 3.0m ~1.5 years 3.1m ~1.2 years 3.9m NA 2016 store vintage also indicating strong results Payback period (incl. inventory) (Based on Year 2 EBITDA) ~4.6 years ~4.0 years ~3.4 years NA General note: Please refer to page 20 for important terms and definitions that apply on this page : Including 10 stores and excluding 1 closed store; 2013: Including 10 stores; 2014: Including 9 stores; 2015: Including 9 stores Source: Europris 8
9 A dynamic store portfolio of directly operated and franchised stores # of stores Q Q Directly operated Franchise 9


10 The Europris customer Who are they? Families What do they like? Our customers «love»: and some special, loyal customers Value for money Spend less save more Adults 40+ Spending time shopping Bargain hunting for great deals 10


11 What Europris can offer Unbeatable campaign prices! Nice shopping experience! Wide assortment! accounting for c. 27% of chain revenue and always a season at low prices 11
12 continues to be well received by customers Strong price perception Clear bargains Respondents agreeing with statement: offers generally low prices Respondents agreeing with statement: a place where bargains can be made Source: MediaCom survey with 1,400 respondents over 15 years of age that have heard of Europris and have a store in proximity to where they live, updated autumn 2016; Europris analysis Note: 2008 levels indexed to
13 Europris is adapting its approach to reach a younger audience Electronic distribution of weekly direct marketing campaign December 2014 indexed to >500% increase in distribution since 2014! Source: Europris analysis 13


14 Europris is building its digital capabilities with the MER customer loyalty club e-crm first step on digital ladder towards a full e-commerce offering 14
15 Strong revenue growth Consistent store roll-out and solid LFL growth has driven sales Total sales CAGR: 10% Avg. LFL growth: 5% # of Chain stores (year end) Sales (NOKm) Y-o-Y total sales growth (%) % 14% % 12% 10% % 9% 8% 6% % % % x # of new store openings General note: Please refer to page 20 for important terms and definitions that apply on this page Source: Europris 15
16 High and stable profitability Stable gross margin Gross profit (NOKm) Margin (%) Consistently high EBITDA margin Adjusted EBITDA (NOKm) Margin (%) ,7 % 43,1 % ,5 % ,9 % 50,0 % 45,0 % 40,0 % 35,0 % ,8 % ,0 % 13,5 % ,0 % ,1 % 13,0 % 25,0 % ,9 % ,0 % ,4 % 12,5 % 15,0 % ,0 % ,0 % 5,0 % ,0 % ,5 % General note: Please refer to page 20 for important terms and definitions that apply on this page. Source: Europris 16
17 Consistent profitability profile Profitability by location Adj. EBITDA % Profitability by competitive intensity Adj. EBITDA % 16,0 % 16,0 % 14,0 % 12,9 % 12,7 % 13,6 % 14,0 % 13,1 % 12,8 % 13,5 % 12,0 % 12,0 % 10,0 % 10,0 % 8,0 % 8,0 % 6,0 % 6,0 % 4,0 % 4,0 % 2,0 % 2,0 % 0,0 % City Rural Town 0,0 % Limited Some Significant Source: Europris analysis Definitions: number of stores in each category in 2016 By location: City: 60 stores; Rural: 64 stores; Town: 115 stores. Analysis excludes Solheimsviken which was closed in September. By competitive intensity: Limited: 60 stores; Some: 112 stores; Significant: 67 stores. Analysis excludes Solheimsviken which was closed in September
18 A strong and profitable store base Adj. EBITDA in NOK 000 per square meter sales area in 2016 for the 219 like-for-like stores in the Europris chain % of like-for-like stores are profitable (210 out of 219) Two unprofitable stores in 2015 now in the black Profitability in all five remaining underperforming stores in 2015 has improved Four new underperforming stores in 2016 being addressed Source: Europris analysis 18
19 Key investment highlights 1 Unchallenged market leader in a fast growing retail segment 2 Unique discount variety retail model 3 Impressive track record of growth, high profitability and solid cash generation 4 Strong future growth potential 19
20 Important terms and definitions Term Definition Chain Chain sales Stores LFL growth Company All Europris stores including both stores owned by the Company (directly operated) and franchise stores Total retail sales of the Chain All stores of the Chain, both franchise and stores owned by the Company (directly operated), unless explicitly stated Measure of growth rate for same-store sales. Same-store sales exclude the sales of a store if the store was not open for the full calendar year and the entire prior calendar year. The stores included in calculating like-for-like growth are redefined each year at the beginning of the year and include both directly owned stores and franchise stores. The measure includes stores that have been refurbished, relocated or expanded during an applicable calendar year Europris ASA (with subsidiaries) Franchise takeover Acquisition of a franchise store and conversion to a directly operated store. Transaction date and consolidation into Company financial accounts may differ from the date of formal merger Accounting standards Gross profit Gross margin EBITDA Adjusted EBITDA Adjusted EBITDA margin EBITA Adjusted EBITA Cash conversion Europris changed the accounting principles for its audited financial statements from Norwegian GAAP to IFRS with effect from 1 January 2014 and has restated its audited financial figures for 2013 and 2012 Gross profit represents Company revenue less the cost of goods sold excluding unrealised foreign currency effects Gross profit as a percentage of Company revenue EBITDA represents operating income before depreciation and write-downs. EBITDA is not a measure of liquidity or performance calculated in accordance with IFRS EBITDA before certain non-recurring operating expenses defined by management Adjusted EBITDA as a percentage of Company revenue EBITDA less depreciation of fixtures & fittings and software (consistent with reported operating income going forward before any impairment charges). EBITA is not a measure of liquidity or performance calculated in accordance with IFRS EBITA before certain non-recurring operating expenses defined by management (the same as for adjusted EBITDA) Adjusted EBITDA less total capital expenditures (excluding amounts under financial lease) divided by adjusted EBITDA. Cash conversion is not a measure of liquidity or performance calculated in accordance with IFRS 20
21 Disclaimer By attending the meeting where this presentation is made, or by reading the presentation slides or by accepting delivery of this document, you agree to be bound by the following limitations. IMPORTANT INFORMATION The presentation and any information provided does not constitute or form part of, and should not be construed as, an offer to acquire any securities of the Company or any of its subsidiaries nor should it or any part of it form the basis of, or be relied on in connection with, any contract to purchase any securities of the Company or any of its subsidiaries, nor shall it or any part of it form the basis of or be relied on in connection with any contract or commitment whatsoever. FORWARD LOOKING STATEMENTS Matters discussed in this document may constitute forward-looking statements. Forward-looking statements are statements that are not historical facts and may be identified by words such as believe, expect, anticipate, intends, estimate, will, may, continue, should and similar expressions. Forward-looking statements include statements regarding: objectives, goals, strategies, outlook and growth prospects; future plans, events or performance and potential for future growth; liquidity, capital resources and capital expenditures; economic outlook and industry trends; and developments in the Company s markets. The forward-looking statements in this Company Introduction are based upon various assumptions, many of which are based, in turn, upon further assumptions, including without limitation, management s examination of historical operating trends, data contained in the Company s records and other data available from third parties. Although the Company believe that these assumptions were reasonable when made, these assumptions are inherently subject to significant known and unknown risks, uncertainties, contingencies and other important factors which are difficult or impossible to predict and are beyond its control. Such risks, uncertainties, contingencies and other important factors could cause the actual results of the Company or the industry to differ materially from those results expressed or implied in this Company Introduction by such forward-looking statements. No representation is made that any of these forward-looking statements or forecasts will come to pass or that any forecast result will be achieved and you are cautioned not to place any undue influence on any forward-looking statement. NO UPDATES Nothing contained in this Company Introduction is or should be relied upon as a promise or representation as to the future. Except where otherwise expressly indicated, this Company Introduction speaks as of the date hereof. Neither the delivery of this Company Introduction nor any purchase of any of the securities, assets, businesses or undertakings of Europris shall, under any circumstances, be construed to indicate or imply that there has been no change in the affairs of Europris since the date hereof. In addition, no responsibility or liability or duty of care is or will be accepted by Europris or their respective Representatives for updating this Company Introduction (or any additional information), correcting any inaccuracies in it which may become apparent or providing any additional information. The information contained in this Company Introduction is necessarily based on economic, market and other conditions as in effect on the date hereof or as stated herein. It should be understood that subsequent developments may affect such information and that Europris have no obligation to update or revise such information. 21
22
Europris. March Norway s leading discount variety retailer
 Europris March 2017 Norway s leading discount variety retailer 1992 1993 1994 1995 1996 1997 1998 1999 2000 2001 2002 2003 2004 2005 2006 2007 2008 2009 2010 2011 2012 2013 2014 2015 2016 Europris at a
Europris. September Norway s leading discount variety retailer
 Europris September 2016 Norway s leading discount variety retailer 1992 1993 1994 1995 1996 1997 1998 1999 2000 2001 2002 2003 2004 2005 2006 2007 2008 2009 2010 2011 2012 2013 2014 Europris at a glance
Europris. September Norway s leading discount variety retailer
 Europris September 2018 Norway s leading discount variety retailer 1992 1993 1994 1995 1996 1997 1998 1999 2000 2001 2002 2003 2004 2005 2006 2007 2008 2009 2010 2011 2012 2013 2014 2015 2016 2017 Europris
HIGHLIGHTS THIRD QUARTER 2017
 Q3-17 EUROPRIS ASA 2 CONTENTS / HIGHLIGHTS HIGHLIGHTS THIRD QUARTER 2017 Group revenues increased 5.0 per cent to NOK 1,278 million (1,218 million)» 3.2 per cent like-for-like growth, better than the market
Presentation of results for the first quarter 2018
 Presentation of results for the first quarter 2018 CEO Pål Wibe CFO Espen Eldal 19 April 2018 Norway s leading discount variety retailer Highlights in the first quarter Timing of Easter distorts comparability
Europris Group Q Interim report
 Europris Group Q1 2015 Interim report 1 Introduction to Europris Europris is Norway s largest discount variety retailer by sales. The Group offers its customers a broad assortment of quality private label
HIGHLIGHTS CONTENTS SECOND QUARTER 2017 FIRST HALF 2017 FINANCIAL REVIEW FINANCIAL STATEMENTS KEY FIGURES ALTERNATIVE PERFORMANCE MEASURES
 EUROPRIS ASA Q2-17 2 CONTENTS / HIGHLIGHTS HIGHLIGHTS SECOND QUARTER 2017 Group revenues increased 12.7 per cent to NOK 1,406 million (1,248 million)» 5.7 per cent growth on a like-for-like basis primarily
Presentation of results for the third quarter 2018
 Presentation of results for the third quarter 2018 CEO Pål Wibe CFO Espen Eldal 31 October 2018 Norway s leading discount variety retailer Highlights in the third quarter Group revenue (NOK million) 5.8%
Creating a pan-nordic platform
 Creating a pan-nordic platform June 2018 Norway s leading discount variety retailer Important notice ABOUT THIS PRESENTATION By reading this company presentation (the Presentation ), or attending any meeting
Presentation of results for the fourth quarter and full year 2017
 Presentation of results for the fourth quarter and full year 2017 CEO Pål Wibe CFO Espen Eldal 1 February 2018 Norway s leading discount variety retailer Highlights in the fourth quarter Group revenues
HIGHLIGHTS FIRST QUARTER 2018
 Q1-18 EUROPRIS ASA 2 CONTENTS / HIGHLIGHTS HIGHLIGHTS FIRST QUARTER 2018 Timing of Easter distorts comparability of numbers before end of first half year Strong increase in group revenues to NOK 1,199
Q3-18 LEKRE HJEM EUROPRIS ASA. til Europriser! Høsten 2017
 Q3-18 EUROPRIS ASA Høsten 2017 LEKRE HJEM til Europriser! 2 CONTENTS / HIGHLIGHTS HIGHLIGHTS THIRD QUARTER 2018 5.8 per cent increase in group revenues to NOK 1,352 million (NOK 1,278 million) o Growth
Interim results 6 months ended 31 July September 2018
 Interim results 6 months ended 31 July 2018 25 September 2018 1 Forward-looking statements This presentation contains certain forward-looking statements with respect to the financial condition, results
Investor Presentation
 Investor Presentation September 2018 Disclaimer This presentation contains forward-looking statements. You can generally identify forward-looking statements by our use of forward-looking terminology such
Investor Presentation
 Investor Presentation June 2018 Safe Harbor Statement This presentation contains forward-looking statements. You can generally identify forward-looking statements by our use of forward-looking terminology
Interim report Q4 2018
 Interim report Q4 2018 Interim report Q4 2018 Kid ASA Dear Shareholders The fourth quarter of 2018 was the best three month period ever for Kid. The early winter and Christmas season is extremely busy
This presentation contains forward-looking statements, which are based on current expectations and projections about future events, and include all
 This presentation contains forward-looking statements, which are based on current expectations and projections about future events, and include all statements other than statements of historical facts,
4.4 per cent increase in group revenues to NOK 2,626 million (NOK 2,516 million)
") Q2-18 EUROPRIS ASA 2 CONTENTS / HIGHLIGHTS HIGHLIGHTS SECOND QUARTER 2018 Timing of Easter distorts comparability of figures for the quarter 1.5 per cent increase in group revenues to NOK 1,427 million
Q2-18 EUROPRIS ASA 2 CONTENTS / HIGHLIGHTS HIGHLIGHTS SECOND QUARTER 2018 Timing of Easter distorts comparability of figures for the quarter 1.5 per cent increase in group revenues to NOK 1,427 million
EUROCASH. Empowering modern retail entrepreneurs
 EUROCASH Empowering modern retail entrepreneurs Mom & pops stores supported by demographics are still half the market Small towns, small living quarters, daily shopping nearby drive small stores market
Deutsche Bank Leveraged Finance Conference October 2018
 Deutsche Bank Leveraged Finance Conference October 2018 Disclaimer Forward Looking Statements Disclaimer Some of the statements in this presentation are forward-looking statements within the meaning of
Interim report Q2 2018
 Interim report Q2 2018 Dear Shareholders Interim report Q2 2018 Kid ASA The second quarter is our most weather-dependent period of the year as we target the Norwegian consumer s outdoor home environment.
CAGNY Conference. February 22, 2018
 CAGNY Conference February 22, 2018 Disclaimer This presentation has been prepared and issued by Nomad Foods Limited (the "Company"). This Presentation has been provided solely for information and background.
INTERIM REPORT Q XXL ASA HIGHLIGHTS. Q2 Growth
 INTERIM REPORT Q2 2014 XXL ASA HIGHLIGHTS Total revenues of NOK 1 246 million (NOK 945 million), up 32 per cent EBITDA increased by 47 per cent to NOK 184 million Successful opening in Finland One new
Forward-Looking Statements and Non- GAAP Financial Measures
 Investor Deck 3 rd Quarter 2014 0 Forward-Looking Statements and Non- GAAP Financial Measures Certain statements in this presentation are forward-looking as defined in the Private Securities Litigation
SECOND QUARTER REPORT TO SHAREHOLDERS
 eady Q2 SECOND QUARTER REPORT TO SHAREHOLDERS 24 WEEKS ENDING JUNE 16, 2018 2018 Second Quarter Report to Shareholders Management s Discussion and Analysis Financial Results Notes to the Unaudited Interim
Investor Presentation. April 2018
 Investor Presentation April 2018 Disclaimer This presentation has been prepared and issued by Nomad Foods Limited (the "Company"). This Presentation has been provided solely for information and background.
Q Results presentation
 Q1 2016 Results presentation 12 May 2016 1 Disclaimer This presentation (the "Presentation") has been prepared and is issued by, and is the sole responsibility of Telepizza Group, S.A. ( Telepizza" or
HIGHLIGHTS INTERIM REPORT Q XXL ASA. Q3 Growth
 INTERIM REPORT Q3 2017 XXL ASA HIGHLIGHTS Total revenues of NOK 2 417 million (NOK 2 080 million), up 16 per cent Like-for-like growth of 6 per cent EBITDA of NOK 252 million (NOK 214 million) Solid results
Interim report Q4 2017
 Interim report Q4 2017 Interim report Q4 2017 Kid ASA Dear Shareholders The fourth quarter is the most important period of the year for Kid due to the Christmas season, representing 37% of annual revenues
16 May M FY 2017/18 FINANCIAL RESULTS
 16 May 2018 6M FY 2017/18 FINANCIAL RESULTS NOTICE TO RECIPIENTS This presentation and any materials distributed in connection herewith (together, the Presentation ) have been prepared by Douglas GmbH
HIGHLIGHTS INTERIM REPORT Q XXL ASA. YTD Growth. Q4 Growth
 INTERIM REPORT Q4 2017 XXL ASA HIGHLIGHTS Total revenues of NOK 2 525 million (NOK 2 151 million), up 17 per cent Like-for-like growth of 7 per cent EBITDA of NOK 332 million (NOK 286 million) Strong cash
2014 Annual Report. George Weston Limited
 2014 Annual Report George Weston Limited Footnote Legend (1) See non-gaap financial measures beginning on page 52. (2) For financial definitions and ratios refer to the Glossary beginning on page 138.
Interim report Q3 2017
 Interim report Q3 2017 Dear Shareholders Interim report Q3 2017 Kid ASA The third quarter is our second most important quarter in terms of revenue and profit, and we are happy to report a top line growth
H RESULTS PRESENTATION
 H1 2018 RESULTS PRESENTATION 03.09.2018 H1 2018 RESULTS PRESENTATION DISCLAIMER This presentation (the "Presentation") has been prepared and is issued by, and is the sole responsibility of Telepizza Group,
2018 Jefferies Consumer Conference June 19, Trevor Lang EVP and Chief Financial Officer
 2018 Jefferies Consumer Conference June 19, 2018 Trevor Lang EVP and Chief Financial Officer Forward-Looking Statements This presentation and the associated webcast contain forward-looking statements,
Financial Highlights (1)
") Loblaw Companies limited 2013 Annual Report Financial review Financial Highlights (1) As at or for the periods ended December 28, 2013 and December 29, 2012 2013 2012 (2) 2011 (3) (millions of Canadian
Loblaw Companies limited 2013 Annual Report Financial review Financial Highlights (1) As at or for the periods ended December 28, 2013 and December 29, 2012 2013 2012 (2) 2011 (3) (millions of Canadian
FINANCIAL RESULTS EUROTORG ANNOUNCES IFRS FINANCIAL RESULTS FOR 1H September 2018
 FINANCIAL RESULTS EUROTORG ANNOUNCES IFRS FINANCIAL RESULTS FOR 1H 2018 11 September 2018 Eurotorg (the Company ), the largest food retailer in Belarus, today announces its reviewed condensed consolidated
3M FY 2016/17 Financial results. 22 February
 3M FY 206/7 Financial results 22 February 207 0 Table of contents. Key Highlights 2. Financial Update Appendix Notice to recipients This presentation and any materials distributed in connection herewith
FIRST-HALF 2017 RESULTS. 27 July 2017
 FIRST-HALF 2017 RESULTS 27 July 2017 Disclaimer FORWARD LOOKING STATEMENTS This presentation contains certain statements that constitute "forward-looking statements", including but not limited to statements
Management s Discussion and Analysis
 1. 2. 3. 4. 5. 6. 7. 8. 9. 10. 11. 12. 13. 14. 15. 16. 17. 18. 19. 20. 21. 22. 23. Forward-Looking Statements Overview Strategic Framework Key Financial Performance Indicators Overall Financial Performance
Investor PRESENTATION. November 2018
 Investor PRESENTATION November 2018 HLT VALUE PROPOSITION Hilton's scale, global presence and leading brands at multiple price points drive a network effect delivering industry-leading performance HLT
our purpose: 2016 Annual Report Financial Review Live Life Well
 our purpose: 2016 Annual Report Financial Review Live Life Well 2016 Annual Report Financial Review Financial Highlights Management s Discussion and Analysis Financial Results Notes to the Consolidated
Q Results presentation
 Q1 2018 Results presentation 12 May 2016 1 15 May, 2018 Disclaimer This presentation (the "Presentation") has been prepared and is issued by, and is the sole responsibility of Telepizza Group, S.A. ( Telepizza"
dbaccess Global Consumer Conference June 12, 2018
 dbaccess Global Consumer Conference June 12, 2018 Disclaimer This Presentation has been prepared and issued by Nomad Foods Limited (the "Company"). This Presentation has been provided solely for information
Ontex Q1 2018: Performance in line with our expectations
 Ontex Q1 2018: Performance in line with our expectations 1.7% LFL revenue growth with positive volumes and price/mix Sequential improvement of margins Progress on our actions in Brazil with full benefits
PRESENTATION BAADER INVESTMENT CONFERENCE. Munich 18 September 2017
 PRESENTATION BAADER INVESTMENT CONFERENCE Munich 18 September 2017 DISCLAIMER AND NOTES To the extent that statements in this presentation do not relate to historical or current facts, they constitute
AUDITED RESULTS for the year ended 30 September 2017
 AUDITED RESULTS for the year ended 30 September 2017 0 Introductory video WELCOME Jayendra Naidoo CHAIRMAN LISTING 20 September 2017 Ben la Grange CEO 3 STAR LISTING JSE main board listing completed on
Migros Ticaret A.Ş. 9M 2018 Financial Results
 Migros Ticaret A.Ş. 9M 2018 Financial Results CONTENTS Sales Market Share Evolution Expansion Capital Expenditures Ataşehir Migros Financial Overview Guidance Financial Results Format Summary 1 Sales in
3Q 2Q 2016 RESULTS DISCUSSION
 3Q 2Q 2016 RESULTS DISCUSSION Disclaimer This presentation and the associated slides and discussion contain forward-looking statements. These statements are naturally subject to uncertainty and changes
Migros Ticaret A.Ş. 9M 2017 Financial Results. Migros 2016 Sustainability Report released
 Migros Ticaret A.Ş. 9M 2017 Financial Results Migros 2016 Sustainability Report released Disclaimer Statement Migros Ticaret A.Ş. (the Company ) has prepared this presentation for the sole purpose of providing
1H 2018 Results Presentation
 1H 2018 Results Presentation Agenda of the presentation 1. Executive Summary 2. Summary of Eurocash parts (segments) 3. Market overview 4. Eurocash Financials 2 1. Executive summary WHOLESALE - STRONG
Institutional Presentation March 2017
 Institutional Presentation March 2017 DISCLAIMER This presentation may include declarations about Springs Global s expectations regarding future events or results. All declarations based upon future expectations,
Financial Results. Düsseldorf, December 11, 2018
 Financial Results Düsseldorf, December 11, 2018 NOTICE TO RECIPIENTS This presentation and any materials distributed in connection herewith (together, the Presentation ) have been prepared by Douglas GmbH
GROWTH A STRONG COMMITMENT
 GROWTH A STRONG COMMITMENT INDEX 1. THE GROUP TODAY INDEX 2. STRATEGY OVERVIEW 3. OUTLOOK 2.1. Strategic Pillars 2.2. Strategic Paths 2 1. THE GROUP TODAY 3 1. THE GROUP TODAY PORTUGAL POLAND Supermarkets
2015 FY RESULTS. / IR Team / Tel: ext
 2015 FY RESULTS / IR Team / Tel: +34 91 398 54 00 ext. 33890 investor.relations@diagroup.com 1 Disclaimer This document does not constitute or form part of any purchase, sales or Exchange offer, nor is
Investor Presentation. May 2015
 Investor Presentation May 2015 AGENDA 1 - Our markets, a significant opportunity 2 Cnova is built on two strong companies: Cdiscount and Cnova Brasil 3 - The development of marketplaces: a key element
Full year and Q results March 15, 2017
 Full year and Q4 2016 results March 15, 2017 Disclaimer This document and its related communication ( Presentation ) have been issued by windeln.de SE and its subsidiaries ( Company ) and do not constitute
Investor. Presentation. February The Diplomat Beach Resort Hollywood, Curio Collection by Hilton
 Investor Presentation February 2019 The Diplomat Beach Resort Hollywood, Curio Collection by Hilton HLT VALUE PROPOSITION Hilton's scale, global presence and leading brands at multiple price points drive
Management s discussion and analysis (MD&A)
") Canadian Tire Corporation, Limited to Shareholders 13 Weeks Ended September 28, 2013 Management s discussion and analysis (MD&A) Forward-looking statements... 1 1.0 Preface... 2 1.1 Definitions... 2 1.2
Canadian Tire Corporation, Limited to Shareholders 13 Weeks Ended September 28, 2013 Management s discussion and analysis (MD&A) Forward-looking statements... 1 1.0 Preface... 2 1.1 Definitions... 2 1.2
Investor Presentation. December 2018
 Investor Presentation December 2018 Disclaimer This Presentation has been prepared and issued by Nomad Foods Limited (the "Company"). This Presentation has been provided solely for information and background.
9M 2018 RESULTS PRESENTATION
 9M 2018 RESULTS PRESENTATION 12.11.2018 9M 2018 RESULTS PRESENTATION DISCLAIMER This presentation (the "Presentation") has been prepared and is issued by, and is the sole responsibility of Telepizza Group,
Investor Presentation
 Investor Presentation Results for the year ended 31 December 2017 26 April 2018 Disclaimer Forward-looking statements This presentation may include forward-looking statements. All statements other than
Matas Annual Report 2017/18 MATAS ANNUAL REPORT 2017/2018
 Matas Annual Report 2017/18 MATAS ANNUAL REPORT 2017/2018 Overview: 2017/18 results within guidance Revenue EBITA BEFORE EXCEPTIONAL ITEMS DKK3.42 billion DKK 3.46 bn in 2016/17 DKK 459 million* Guidance:
Investor PRESENTATION. November Conrad Bora Bora Nui, French Polynesia
 Investor PRESENTATION November 2017 Conrad Bora Bora Nui, French Polynesia HLT VALUE PROPOSITION Hilton's scale, global presence and leading brands at multiple price points drive a network effect delivering
Interim Results For 6 months ended 31 Dec February 2018
 Interim Results For 6 months ended 31 Dec 2017 February 2018 Financial highlights 62.5m 55.7m 71.7m 13.7m 10.8m 15.8m 8.8m 11.2m 12.9m 16 17 18 16 17 18 16 17 18 REVENUE 71.7m (H1 FY17: 62.5m) +14.7% YEAR-ON-YEAR
FIRST QUARTER REPORT TO SHAREHOLDERS
 eady Q1 FIRST QUARTER REPORT TO SHAREHOLDERS 12 WEEKS ENDING MARCH 24, 2018 2018 First Quarter Report to Shareholders Management s Discussion and Analysis Financial Results Notes to the Unaudited Interim
Interim report Q2 2015
 Introduction to Kid Kid is a leading Norwegian retailer in the home textile market, typified by products like duvets, pillows, curtains, bed linens and other accessories and decorating items. Currently
Jacky Lo Chief Finance Officer, Yum China
 Jacky Lo Chief Finance Officer, Yum China Cautionary Language Regarding Forward-Looking Statements Forward-Looking Statements. Our presentation may contain forward-looking statements within the meaning
Institutional Presentation May 2017
 Institutional Presentation May 2017 DISCLAIMER This presentation may include declarations about Springs Global s expectations regarding future events or results. All declarations based upon future expectations,
STOCK EXCHANGE RELEASE
 28 April 2016 The final offering price in Tokmanni Group Corporation s initial public offering has been set at EUR 6.70 per share Tokmanni Group Corporation ( Tokmanni or the Company ) today announces
Institutional Presentation November 2017
 Institutional Presentation November 2017 DISCLAIMER This presentation may include declarations about Springs Global s expectations regarding future events or results. All declarations based upon future
Hudson's Bay Company Reports Fourth Quarter and Fiscal 2014 Financial Results
 April 7, 2015 Hudson's Bay Company Reports Fourth Quarter and Fiscal 2014 Financial Results Strategic Initiatives Continue to Drive Sales and Earnings Growth Company Provides Sales and Capex Outlook for
1Q 2018 Results Presentation
 1Q 2018 Results Presentation EXECUTIVE SUMMARY EUROCASH GROUP ORGANIC WHOLESALE SEGMENT GROWTH BETTER THAN MARKET BACK ON GROWTH TRACK GROSS MARGIN BACK ON TRACK AFTER WEAK 4Q 2017 HO COSTS OPTIMIZATION
As of March, 2011 SALLYBEAUTY HOLDINGS, INC. 1
 As of March, 2011 HOLDINGS, INC. 1 Cautionary Notice Regarding Forward-Looking Statements Cautionary Notice Regarding Forward-Looking Statements Statements in this presentation and the schedules hereto
Acquisition of Jack Wolfskin. November 2018
 Acquisition of Jack Wolfskin November 2018 Important notices Forward-Looking Statements: During this presentation, any statements relating to future plans, events, financial results, performance or prospects,
Ontex Q3 2018: Further progress in challenging environment
 Ontex Q3 2018: Further progress in challenging environment Q3 LFL revenue ex Brazil +3%, outperforming flat hygiene markets Continuous focus on value: price/mix +2.9% Important milestones achieved in Brazil
Management s Discussion and Analysis. Canadian Tire Corporation, Limited Third Quarter 2014
 Management s Discussion and Analysis Canadian Tire Corporation, Limited Third Quarter 2014 1 1.0 Preface 1.1 Definitions In this document, the terms we, us, our, Company, Canadian Tire Corporation, CTC
Interim results. 30 March 2017
 Interim results 30 March 2017 Highlights Ian Filby Continued Financial Growth and Strong Operational Progress H1 FINANCIALS 493.7m +7.0% 16.7m +3.1% 20m 9.5p per share Gross sales Profit before tax Special
ICR Conference January 2019
 ICR Conference January 209 IMPORTANT INFORMATION Forward Looking Statements This presentation contains forward looking statements that are subject to risks and uncertainties. All statements other than
Investor Presentation
 Investor Presentation Cautionary Note Regarding Forward-Looking Statements This presentation contains forward-looking information, including the Company s statements regarding its future outlook. In addition,
Investor Presentation. April 2011
 Investor Presentation April 2011 Forward-Looking Statements 1. This presentation contains forward-looking statements about our current and future plans, expectations and intentions, results, levels of
HIGHLIGHTS INTERIM REPORT Q XXL ASA. Q2 Growth
 INTERIM REPORT Q2 2018 XXL ASA HIGHLIGHTS Total revenues of NOK 2 331 million (NOK 2 054 million), up 14 per cent E-commerce growth of 38 per cent Three new store openings Strong growth but pressure on
Forward Looking Statements
 Forward Looking Statements Certain statements in this presentation constitute forward-looking statements within the meaning of Section 21E of the Securities Exchange Act of 1934, as amended. Any statements
ANNUAL RESULTS FOR THE YEAR ENDED 31 AUGUST 2017
 ANNUAL RESULTS FOR THE YEAR ENDED 31 AUGUST 2017 PRESENTATION OUTLINE Review of the year Financial results Trading performance Outlook Questions 2 REVIEW OF THE YEAR DAVID KNEALE REVIEW OF THE YEAR Strong
25 February 2019 The PAS Group Limited H1 FY2019 Results Briefing
 25 February 2019 The PAS Group Limited H1 FY2019 Results Briefing ABN 25 169 477 463 H1 FY2019 Results Summary Sales up 9.9% to $143.0 million Online sales up 11.0% Wholesale sales up 32.1% Retail sales
HIGHLIGHTS INTERIM REPORT Q XXL ASA. H1 Growth. Q2 Growth
 INTERIM REPORT Q2 2016 XXL ASA HIGHLIGHTS Total revenues of NOK 1 898 million (NOK 1 535 million), up 24 per cent Like-for-like growth of 11 per cent EBITDA of NOK 222 million (NOK 201 million) Five new
HUGO BOSS First Nine Months Results 2011
 HUGO BOSS First Nine Months Results 2011 Mark Langer (CFO) November 2, 2011 Conference Call, First Nine Months Results 2011 HUGO BOSS November 2, 2011 2 / 30 AGENDA OPERATIONAL HIGHLIGHTS FIRST NINE MONTHS
Cautionary Notice Regarding Forward-Looking Statements
 March 2008 0 Cautionary Notice Regarding Forward-Looking Statements Statements in this presentation which are not purely historical facts or which depend upon future events may be forward-looking statements
PRESENTATION GERMAN CORPORATE CONFERENCE
 PRESENTATION GERMAN CORPORATE CONFERENCE 17 January 2018 1 DISCLAIMER To the extent that statements in this presentation do not relate to historical or current facts, they constitute forward-looking statements.
Norwegian Finans Holding ASA. Investor Presentation for Contemplated Private Placement April 2016
 Norwegian Finans Holding ASA Investor Presentation for Contemplated Private Placement April 2016 Disclaimer THIS PRESENTATION (HEREINAFTER REFERRED TO AS THE PRESENTATION ) HAS BEEN PREPARED BY NORWEGIAN
November O KEY Group S.A. Russia & CIS 1-1 Conference London
 November 2011 O KEY Group S.A. Russia & CIS 1-1 Conference London Disclaimer By attending the meeting where this presentation is made, or by reading the presentation slides, you agree to be bound by the
Resultados 3º Trimestre de de outubro Q18 and 2018 Results February 21, 2019
 4Q18 and 2018 Results February 21, 2019 2018: Highlights OPTIMIZATION OF STORE PORTFOLIO 15 Pão de Açúcar stores renovated into the new model 23 Extra Super to Mercado Extra 13 conversions to Compre Bem
Forward-Looking Statements
 March 2006 0 Forward-Looking Statements This presentation contains forward-looking statements that are subject to a number of risks and uncertainties, many of which are outside our control. These forward-looking
2005 FULL YEAR RESULTS. March / April 2006
 2005 FULL YEAR RESULTS March / April 2006 DISCLAIMER Safe Harbour Statement This presentation contains forward-looking statements (made pursuant to the safe harbour provisions of the Private Securities
FIRST-HALF 2018 RESULTS 30 JULY 2018
 FIRST-HALF 2018 RESULTS 30 JULY 2018 Disclaimer FORWARD LOOKING STATEMENTS This presentation contains certain statements that constitute "forward-looking statements", including but not limited to statements
Disclosure Statement. Page 2
 Disclosure Statement Page 2 This presentation and the accompanying slides (the Presentation ) which have been prepared by Samsonite International S.A. ( Samsonite or the Company ) do not constitute any
Investor PRESENTATION. May Conrad Bora Bora Nui, French Polynesia
 Investor PRESENTATION May 2018 Conrad Bora Bora Nui, French Polynesia HLT VALUE PROPOSITION Hilton's scale, global presence and leading brands at multiple price points drive a network effect delivering
Our Q2 results further demonstrate how we are changing the profit trajectory of our Hotel segment.
 Exhibit 99.2 TripAdvisor, Inc. Q2 2018 Prepared Remarks (All comparisons are against the same period of the prior year, unless otherwise noted; some calculations may not foot due to rounding) We are pleased
FY2017 RESULTS. - March 8 th,
 FY2017 RESULTS - March 8 th, 2018 - I 2017 key business highlights 2017 KEY BUSINESS HIGHLIGHTS strategic projects transforming the group for the long term Implementation of our omni-channel vision with
H Results. September 13 th, Delivery Hero SE. H Trading Update.
 H 208 Results September 3 th, 208 Our Clear Vision AMAZING FOOD AMAZING ORDERING Create an amazing takeaway experience AMAZING SERVICE 2 Agenda Business Update 2 Financial Update 3 Outlook 3 H 208 Financial