Europris. September Norway s leading discount variety retailer
|
|
|
- Dulcie Dalton
- 5 years ago
- Views:
Transcription


1 Europris September 2018 Norway s leading discount variety retailer
2 Europris at a glance Norway s leading discount variety retailer Europris total revenue development 1 Undisputed market leadership in Norway (NOKm) Nationwide presence Wide assortment at very low prices Efficient sourcing with direct access to end producers years of continuous growth since start in Based on chain sales 2017 (including franchise stores). Source: Europris 2


3 Wide assortment that taps into a large addressable market Groceries General merchandise Europris has a truly mixed assortment 2 Personal Care 9% Laundry & Cleaning 3% Pets 3% Home & Kitchen 15% Candy & Chocolate 5% Total addressable market 1 : ~NOK 280bn Groceries 12% Clothes & Shoes 8% Hobby & Office 7% Handyman 7% House & Garden 11% Electronics 9% Travel, Sports & Leisure 11% Speciality retail Large market Competitive flexibility Resilience 1. Total addressable market for packaged food, home & garden, clothing & shoes, leisure & office, health & beauty, and electronics & appliances. 2. Active SKUs year end 2014 Source: Euromonitor, Europris 3


4 Europris is #1 in Norwegian discount variety retail with NO 1:1 competitor Sales in Norway 2017 (NOKm) Entered in Offering Discount variety retail Tools, car supplies, leisure products Hardware, home, leisure, electrical, multimedia Tools, home, electrical, DYI, garden, leisure, car supplies, clothing Discount variety non-food retail Clothing, textiles, cosmetics, tools, home Home, DIY, tools, garden, leisure, electrical # of stores May Assortment overlap to Europris 2 Source: Euromonitor, Ravninfo, Europris 1. Chain sales including franchise stores. 2. Management estimates. 4


5 Discount variety retail experiences solid growth across all Western geographies 18% 22% 10% Average Sales CAGR Average Sales CAGR Average Sales CAGR Source: 3i Capital Markets Day presentation 2018, 9th March 2018; OC&C research; company information; and Europris estimates Note: Sales CAGRs for each region denotes the straight average of the respective companies highlighted for the relevant years 5
 7 Long-term")

6 Clear long term white space opportunity and a solid near term pipeline Total: 257 Ørnes Seven new stores opened in 2018 Robust pipeline of new stores Two planned for the rest of 2018 Nine stores in pipeline for 2019 and beyond (six stores subject to zoning process) 7 Long-term potential of stores defined in 2015 Digernes Lillehammer Lura Rykkinn 9 Stokke 16 Kjørbekk More than 25k inhabitants per store Between 15k and 25k inhabitants per store 15k or fewer inhabitants per store Note: # of stores updated as per August


7 Preparing the group for future growth New warehouse: capacity 34% up; rental space 13% down Værste Øra Kampenveien Automatic high bay storage 65,000 pallets Traditional warehousing 35,700 pallets Hjalmar Bjørges vei Havnelageret 7
8 while also contributing to significant gains in efficiency Significant efficiency gains long term Expected reduction in the ratio of opex/group revenue of between p.p OPEX in % of group revenue 30,8 % Several drivers of increased efficiency Lower lease expenses Reduction in transportation costs General savings from more efficient operations 30,3 % Reduction of between p.p 29,8 % Period of transition Note: assuming normal course of business, and no other efficiency gains or losses affecting the ratio of operational expenses to group revenue 8


9 A leader in concept development clear shop-in-shop layout and spacing Improved shop-in-shop categorisation Brands more prominently displayed Value for money visualisation one step up The best of all Same investment as previous version Limited cost for roll-out of main elements to existing stores 9


10 Clear category strategy with specific focus on seven destination categories 7 focus Destination product article groups Personal Care Laundry & Cleaning 12 main categories 7 specific Destination areas to drive traffic Candy & Chocolate Petfood & Accessories 40% of sales Prominent positions in stores Proven category management models Home Storage Socks & Underwear Low ticket items Seasonal offerings across all categories underpin category strategy Candles & Napkins Seasonal 10

11 Significant initiatives in category development coffee, tea and accessories 11


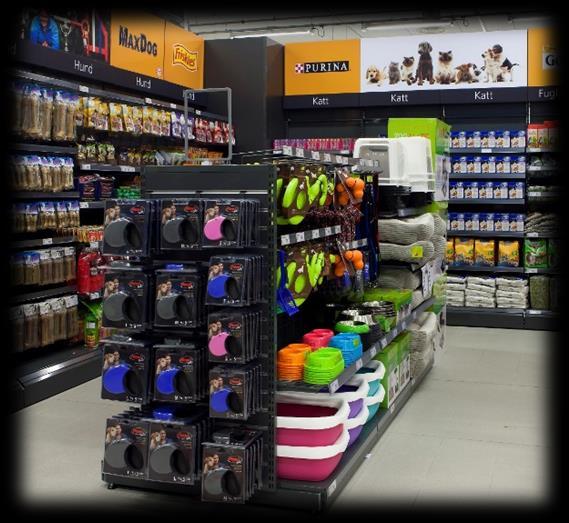
12 Significant initiatives in category development pet food and accessories 12


13 Significant initiatives in category development small textiles Building credibility in small textiles 13

14 Focusing on digital capabilities with E-CRM as a first step towards a full online offering INCREASED SOPHISTICATION IN DECISION MAKING TOTAL # OF POTENTIAL CUSTOMERS MER customer loyalty programme customer specific communication and information DIGITAL MARKETING + RECEIPT / CUSTOMER BEHAVIOUR ANALYSES DM LEAFLET / TRADITIONAL MARKETING Analyses of general customer behavior and shopping patterns Better decision making for marketing, campaigns and other customer facing activities 14

15 Launch of e-commerce in June 15


16 Smart sourcing is part of the Europris DNA The Competitive edge The Europris DNA More than 25 years sourcing experience from low cost countries Opportunistic spirit Innovative approach Bargain hunters Relationship driven Highest ethical standards Longstanding relationships with high quality producers Unique Nordic sourcing cooperation together with Tokmanni and ÖoB Direct access to the local end producer Strong product and production knowledge High value chain flexibility and fast execution Source: Europris 16

17 Achieving international competitiveness with a solid Nordic footprint Bringing the segment s two strong players in Norway and Sweden together, leveraging a significantly overlapping assortment, deep retail know-how and a common strategic agenda to create a robust Nordic constellation in discount variety retail # of stores 257 # of stores 94 Retail sales 2017A NOK 5.9bn Retail sales 2017A NOK 3.6bn Note: Numbers for Runsvengruppen converted to NOK using SEK / NOK rate as of Friday, 8 th June

18 Partners with strategic potential on a European scale The Europris & ÖoB partnership emerges among the top three major European structures in the fast growing discount variety retail sector Estimated combined partnership numbers Not PF for Hong Kong Chain sales: NOK 9.5bn Chain sales: NOK 33bn Chain sales: NOK 33bn Chain sales: NOK 4bn EBITDA: NOK 720m EBITDA: NOK 3.7bn EBITDA: NOK 3.0bn EBITDA: NOK 271m Stores: 351 Stores: 1,095 Stores: 927 Stores: countries: Norway and Sweden 7 countries: Benelux, Germany, France, Austria, Poland 2 countries: United Kingdom and Germany 4 countries: Norway, Sweden, Finland, Germany Note: Combined 2017 revenue for Europris / ÖoB. Actual 2017 Adj. EBITDA for Europris and ÖoB (excluding non-recurring items). Rusta figures not adjusted for acquisition of Hong Kong in Finland 18


19 A low-risk synergistic partnership today potential for true European scale tomorrow Strategic Initiatives Turnaround of ÖoB Store initiatives (incl. ÖoB 2.0) Best practice sharing Potential exercise of option to acquire remaining 80% stake Purchasing cooperation Continued store roll-out in Norway Implementation new warehouse Best practice sharing Strategic Initiatives EPR acquisition of 20% ownership stake in ÖoB Nordic discount variety retail champion and platform established true European scale within reach 19
20 Creating a pan-nordic platform in discount variety retail with sourcing power to reflect an even larger grouping (through Shanghai JV with Tokmanni) Representing sales of NOK 17.1bn NOK 3.6bn NOK 5.9bn 351 stores across Norway & Sweden NOK 7.6bn Note: Numbers based on each company s 2017A revenue numbers, converted to NOK as of Friday, 8 th June
21 Key investment highlights 1 Unchallenged market leader in a fast growing retail segment 2 Unique discount variety retail model 3 Impressive track record of growth, high profitability and solid cash generation 4 Strong future growth potential 21
22 Appendix
23 Strong revenue growth Consistent store roll-out and solid LFL growth has driven sales Total sales CAGR: 8% Avg. LFL growth: 5% # of Chain stores (year end) Sales (NOKm) Y-o-Y total sales growth (%) % % % 12% 10% % 7% 8% 6% % % % x # of new store openings General note: Please refer to page 25 for important terms and definitions that apply on this page. Source: Europris 23
24 High and stable profitability Stable gross margin Gross profit (NOKm) Margin (%) Consistently high EBITDA margin Adjusted EBITDA (NOKm) Margin (%) ,1 % ,5 % ,9 % ,6 % 50,0 % 45,0 % 40,0 % 35,0 % ,8 % ,1 % ,0 % 13,5 % 13,0 % ,0 % ,9 % 12,5 % 25,0 % ,0 % 15,0 % 10,0 % ,8 % 12,0 % 11,5 % 5,0 % ,0 % ,0 % ,5 % General note: Please refer to page 25 for important terms and definitions that apply on this page. Source: Europris 24
25 Important terms and definitions Term Definition Chain Chain sales Stores LFL growth Company All Europris stores including both stores owned by the Company (directly operated) and franchise stores Total retail sales of the Chain All stores of the Chain, both franchise and stores owned by the Company (directly operated), unless explicitly stated Measure of growth rate for same-store sales. Same-store sales exclude the sales of a store if the store was not open for the full calendar year and the entire prior calendar year. The stores included in calculating like-for-like growth are redefined each year at the beginning of the year and include both directly owned stores and franchise stores. The measure includes stores that have been refurbished, relocated or expanded during an applicable calendar year Europris ASA (with subsidiaries) Franchise takeover Acquisition of a franchise store and conversion to a directly operated store. Transaction date and consolidation into Company financial accounts may differ from the date of formal merger Accounting standards Gross profit Gross margin EBITDA Adjusted EBITDA Adjusted EBITDA margin EBITA Adjusted EBITA Cash conversion Europris changed the accounting principles for its audited financial statements from Norwegian GAAP to IFRS with effect from 1 January 2014 and has restated its audited financial figures for 2013 and 2012 Gross profit represents Company revenue less the cost of goods sold excluding unrealised foreign currency effects Gross profit as a percentage of Company revenue EBITDA represents operating income before depreciation and write-downs. EBITDA is not a measure of liquidity or performance calculated in accordance with IFRS EBITDA before certain non-recurring operating expenses defined by management Adjusted EBITDA as a percentage of Company revenue EBITDA less depreciation of fixtures & fittings and software (consistent with reported operating income going forward before any impairment charges). EBITA is not a measure of liquidity or performance calculated in accordance with IFRS EBITA before certain non-recurring operating expenses defined by management (the same as for adjusted EBITDA) Adjusted EBITDA less total capital expenditures (excluding amounts under financial lease) divided by adjusted EBITDA. Cash conversion is not a measure of liquidity or performance calculated in accordance with IFRS 25
26 Disclaimer By attending the meeting where this presentation is made, or by reading the presentation slides or by accepting delivery of this document, you agree to be bound by the following limitations. IMPORTANT INFORMATION The presentation and any information provided does not constitute or form part of, and should not be construed as, an offer to acquire any securities of the Company or any of its subsidiaries nor should it or any part of it form the basis of, or be relied on in connection with, any contract to purchase any securities of the Company or any of its subsidiaries, nor shall it or any part of it form the basis of or be relied on in connection with any contract or commitment whatsoever. FORWARD LOOKING STATEMENTS Matters discussed in this document may constitute forward-looking statements. Forward-looking statements are statements that are not historical facts and may be identified by words such as believe, expect, anticipate, intends, estimate, will, may, continue, should and similar expressions. Forward-looking statements include statements regarding: objectives, goals, strategies, outlook and growth prospects; future plans, events or performance and potential for future growth; liquidity, capital resources and capital expenditures; economic outlook and industry trends; and developments in the Company s markets. The forward-looking statements in this Company Introduction are based upon various assumptions, many of which are based, in turn, upon further assumptions, including without limitation, management s examination of historical operating trends, data contained in the Company s records and other data available from third parties. Although the Company believe that these assumptions were reasonable when made, these assumptions are inherently subject to significant known and unknown risks, uncertainties, contingencies and other important factors which are difficult or impossible to predict and are beyond its control. Such risks, uncertainties, contingencies and other important factors could cause the actual results of the Company or the industry to differ materially from those results expressed or implied in this Company Introduction by such forward-looking statements. No representation is made that any of these forward-looking statements or forecasts will come to pass or that any forecast result will be achieved and you are cautioned not to place any undue influence on any forward-looking statement. NO UPDATES Nothing contained in this Company Introduction is or should be relied upon as a promise or representation as to the future. Except where otherwise expressly indicated, this Company Introduction speaks as of the date hereof. Neither the delivery of this Company Introduction nor any purchase of any of the securities, assets, businesses or undertakings of Europris shall, under any circumstances, be construed to indicate or imply that there has been no change in the affairs of Europris since the date hereof. In addition, no responsibility or liability or duty of care is or will be accepted by Europris or their respective Representatives for updating this Company Introduction (or any additional information), correcting any inaccuracies in it which may become apparent or providing any additional information. The information contained in this Company Introduction is necessarily based on economic, market and other conditions as in effect on the date hereof or as stated herein. It should be understood that subsequent developments may affect such information and that Europris have no obligation to update or revise such information. 26
27
Europris. 10. November Norway s leading discount variety retailer
 Europris 10. November 2017 Norway s leading discount variety retailer 1992 1993 1994 1995 1996 1997 1998 1999 2000 2001 2002 2003 2004 2005 2006 2007 2008 2009 2010 2011 2012 2013 2014 2015 2016 Europris
Europris. September Norway s leading discount variety retailer
 Europris September 2016 Norway s leading discount variety retailer 1992 1993 1994 1995 1996 1997 1998 1999 2000 2001 2002 2003 2004 2005 2006 2007 2008 2009 2010 2011 2012 2013 2014 Europris at a glance
Europris. March Norway s leading discount variety retailer
 Europris March 2017 Norway s leading discount variety retailer 1992 1993 1994 1995 1996 1997 1998 1999 2000 2001 2002 2003 2004 2005 2006 2007 2008 2009 2010 2011 2012 2013 2014 2015 2016 Europris at a
Creating a pan-nordic platform
 Creating a pan-nordic platform June 2018 Norway s leading discount variety retailer Important notice ABOUT THIS PRESENTATION By reading this company presentation (the Presentation ), or attending any meeting
4.4 per cent increase in group revenues to NOK 2,626 million (NOK 2,516 million)
") Q2-18 EUROPRIS ASA 2 CONTENTS / HIGHLIGHTS HIGHLIGHTS SECOND QUARTER 2018 Timing of Easter distorts comparability of figures for the quarter 1.5 per cent increase in group revenues to NOK 1,427 million
Q2-18 EUROPRIS ASA 2 CONTENTS / HIGHLIGHTS HIGHLIGHTS SECOND QUARTER 2018 Timing of Easter distorts comparability of figures for the quarter 1.5 per cent increase in group revenues to NOK 1,427 million
Q3-18 LEKRE HJEM EUROPRIS ASA. til Europriser! Høsten 2017
 Q3-18 EUROPRIS ASA Høsten 2017 LEKRE HJEM til Europriser! 2 CONTENTS / HIGHLIGHTS HIGHLIGHTS THIRD QUARTER 2018 5.8 per cent increase in group revenues to NOK 1,352 million (NOK 1,278 million) o Growth
Presentation of results for the third quarter 2018
 Presentation of results for the third quarter 2018 CEO Pål Wibe CFO Espen Eldal 31 October 2018 Norway s leading discount variety retailer Highlights in the third quarter Group revenue (NOK million) 5.8%
Presentation of results for the fourth quarter and full year 2017
 Presentation of results for the fourth quarter and full year 2017 CEO Pål Wibe CFO Espen Eldal 1 February 2018 Norway s leading discount variety retailer Highlights in the fourth quarter Group revenues
Europris Group Q Interim report
 Europris Group Q1 2015 Interim report 1 Introduction to Europris Europris is Norway s largest discount variety retailer by sales. The Group offers its customers a broad assortment of quality private label
HIGHLIGHTS FIRST QUARTER 2018
 Q1-18 EUROPRIS ASA 2 CONTENTS / HIGHLIGHTS HIGHLIGHTS FIRST QUARTER 2018 Timing of Easter distorts comparability of numbers before end of first half year Strong increase in group revenues to NOK 1,199
HIGHLIGHTS CONTENTS SECOND QUARTER 2017 FIRST HALF 2017 FINANCIAL REVIEW FINANCIAL STATEMENTS KEY FIGURES ALTERNATIVE PERFORMANCE MEASURES
 EUROPRIS ASA Q2-17 2 CONTENTS / HIGHLIGHTS HIGHLIGHTS SECOND QUARTER 2017 Group revenues increased 12.7 per cent to NOK 1,406 million (1,248 million)» 5.7 per cent growth on a like-for-like basis primarily
Presentation of results for the first quarter 2018
 Presentation of results for the first quarter 2018 CEO Pål Wibe CFO Espen Eldal 19 April 2018 Norway s leading discount variety retailer Highlights in the first quarter Timing of Easter distorts comparability
HIGHLIGHTS THIRD QUARTER 2017
 Q3-17 EUROPRIS ASA 2 CONTENTS / HIGHLIGHTS HIGHLIGHTS THIRD QUARTER 2017 Group revenues increased 5.0 per cent to NOK 1,278 million (1,218 million)» 3.2 per cent like-for-like growth, better than the market
CAGNY Conference. February 22, 2018
 CAGNY Conference February 22, 2018 Disclaimer This presentation has been prepared and issued by Nomad Foods Limited (the "Company"). This Presentation has been provided solely for information and background.
Investor Presentation. December 2018
 Investor Presentation December 2018 Disclaimer This Presentation has been prepared and issued by Nomad Foods Limited (the "Company"). This Presentation has been provided solely for information and background.
Investor Presentation. April 2018
 Investor Presentation April 2018 Disclaimer This presentation has been prepared and issued by Nomad Foods Limited (the "Company"). This Presentation has been provided solely for information and background.
dbaccess Global Consumer Conference June 12, 2018
 dbaccess Global Consumer Conference June 12, 2018 Disclaimer This Presentation has been prepared and issued by Nomad Foods Limited (the "Company"). This Presentation has been provided solely for information
Deutsche Bank Leveraged Finance Conference October 2018
 Deutsche Bank Leveraged Finance Conference October 2018 Disclaimer Forward Looking Statements Disclaimer Some of the statements in this presentation are forward-looking statements within the meaning of
HIGHLIGHTS INTERIM REPORT Q XXL ASA. Q3 Growth
 INTERIM REPORT Q3 2017 XXL ASA HIGHLIGHTS Total revenues of NOK 2 417 million (NOK 2 080 million), up 16 per cent Like-for-like growth of 6 per cent EBITDA of NOK 252 million (NOK 214 million) Solid results
Norwegian Finans Holding ASA. Investor Presentation for Contemplated Private Placement April 2016
 Norwegian Finans Holding ASA Investor Presentation for Contemplated Private Placement April 2016 Disclaimer THIS PRESENTATION (HEREINAFTER REFERRED TO AS THE PRESENTATION ) HAS BEEN PREPARED BY NORWEGIAN
This presentation contains forward-looking statements, which are based on current expectations and projections about future events, and include all
 This presentation contains forward-looking statements, which are based on current expectations and projections about future events, and include all statements other than statements of historical facts,
2016 ANNUAL RESULTS FEBRUARY 2017
 2016 ANNUAL RESULTS INTRODUCTION: FRANK VAN ZANTEN CHIEF EXECUTIVE HIGHLIGHTS CONSISTENT AND PROVEN STRATEGY GOOD SET OF RESULTS 184m COMMITTED ACQUISITION SPEND ON 14 ACQUISITIONS ADJUSTED EARNINGS PER
H RESULTS PRESENTATION
 H1 2018 RESULTS PRESENTATION 03.09.2018 H1 2018 RESULTS PRESENTATION DISCLAIMER This presentation (the "Presentation") has been prepared and is issued by, and is the sole responsibility of Telepizza Group,
Lindorff. Company Presentation. November 2016
 Lindorff Company Presentation November 06 Disclaimer IMPORTANT INFORMATION Not for distribution in or into the United States, Australia, Canada, Japan or any other jurisdiction in which such distribution
Interim results 6 months ended 31 July September 2018
 Interim results 6 months ended 31 July 2018 25 September 2018 1 Forward-looking statements This presentation contains certain forward-looking statements with respect to the financial condition, results
1H 2018 Results Presentation
 1H 2018 Results Presentation Agenda of the presentation 1. Executive Summary 2. Summary of Eurocash parts (segments) 3. Market overview 4. Eurocash Financials 2 1. Executive summary WHOLESALE - STRONG
The Food Travel Experts.
 The Food Travel Experts www.foodtravelexperts.com SSP Group plc Annual Results 2016 29 November 2016 Presentation structure 1. Group highlights Kate Swann 2. Financial review Jonathan Davies 3. Business
2018 Jefferies Consumer Conference June 19, Trevor Lang EVP and Chief Financial Officer
 2018 Jefferies Consumer Conference June 19, 2018 Trevor Lang EVP and Chief Financial Officer Forward-Looking Statements This presentation and the associated webcast contain forward-looking statements,
INTERIM REPORT Q XXL ASA HIGHLIGHTS. Q2 Growth
 INTERIM REPORT Q2 2014 XXL ASA HIGHLIGHTS Total revenues of NOK 1 246 million (NOK 945 million), up 32 per cent EBITDA increased by 47 per cent to NOK 184 million Successful opening in Finland One new
HUGO BOSS First Nine Months Results 2011
 HUGO BOSS First Nine Months Results 2011 Mark Langer (CFO) November 2, 2011 Conference Call, First Nine Months Results 2011 HUGO BOSS November 2, 2011 2 / 30 AGENDA OPERATIONAL HIGHLIGHTS FIRST NINE MONTHS
HIGHLIGHTS INTERIM REPORT Q XXL ASA. YTD Growth. Q4 Growth
 INTERIM REPORT Q4 2017 XXL ASA HIGHLIGHTS Total revenues of NOK 2 525 million (NOK 2 151 million), up 17 per cent Like-for-like growth of 7 per cent EBITDA of NOK 332 million (NOK 286 million) Strong cash
Henkel AG & Co. KGaA. Klaus Keutmann Frankfurt,
 Henkel AG & Co. KGaA Klaus Keutmann Frankfurt, 21.01.2015 Disclaimer This information contains forward-looking statements which are based on current estimates and assumptions made by the corporate management
Investor Presentation
 Investor Presentation September 2018 Disclaimer This presentation contains forward-looking statements. You can generally identify forward-looking statements by our use of forward-looking terminology such
Financial Results. Düsseldorf, December 11, 2018
 Financial Results Düsseldorf, December 11, 2018 NOTICE TO RECIPIENTS This presentation and any materials distributed in connection herewith (together, the Presentation ) have been prepared by Douglas GmbH
Investor Presentation
 Investor Presentation June 2018 Safe Harbor Statement This presentation contains forward-looking statements. You can generally identify forward-looking statements by our use of forward-looking terminology
FIRST-HALF 2017 RESULTS. 27 July 2017
 FIRST-HALF 2017 RESULTS 27 July 2017 Disclaimer FORWARD LOOKING STATEMENTS This presentation contains certain statements that constitute "forward-looking statements", including but not limited to statements
Investor Presentation. May 2015
 Investor Presentation May 2015 AGENDA 1 - Our markets, a significant opportunity 2 Cnova is built on two strong companies: Cdiscount and Cnova Brasil 3 - The development of marketplaces: a key element
HIGHLIGHTS INTERIM REPORT Q XXL ASA. Q1 Growth
 INTERIM REPORT Q1 2018 XXL ASA HIGHLIGHTS Total revenues of NOK 2 070 million (NOK 1 713 million), up 21 per cent E-commerce growth of 42 per cent EBITDA of NOK 51 million (NOK 34 million) Solid cash flow
TELECONFERENCE Q2 2018
 TELECONFERENCE Q2 2018 Copenhagen, 9 August 2018 1 Disclaimer Certain statements in this presentation constitute forwardlooking statements. Forward-looking statements are statements (other than statements
As of September 2014, fiscal year-end
 As of September 2014, fiscal year-end Company Highlights Sally Beauty Holdings is a leading international specialty retailer and distributor of professional beauty products Annual consolidated sales of
Interim report Q2 2015
 Introduction to Kid Kid is a leading Norwegian retailer in the home textile market, typified by products like duvets, pillows, curtains, bed linens and other accessories and decorating items. Currently
November O KEY Group S.A. Russia & CIS 1-1 Conference London
 November 2011 O KEY Group S.A. Russia & CIS 1-1 Conference London Disclaimer By attending the meeting where this presentation is made, or by reading the presentation slides, you agree to be bound by the
Financial Results. Düsseldorf, 30 August 2018
 Financial Results Düsseldorf, 30 August 2018 NOTICE TO RECIPIENTS This presentation and any materials distributed in connection herewith (together, the Presentation ) have been prepared by Douglas GmbH
Interim report Q4 2018
 Interim report Q4 2018 Interim report Q4 2018 Kid ASA Dear Shareholders The fourth quarter of 2018 was the best three month period ever for Kid. The early winter and Christmas season is extremely busy
16 May M FY 2017/18 FINANCIAL RESULTS
 16 May 2018 6M FY 2017/18 FINANCIAL RESULTS NOTICE TO RECIPIENTS This presentation and any materials distributed in connection herewith (together, the Presentation ) have been prepared by Douglas GmbH
Disclaimer. Important notice
 XXL ASA Q2 2018 Disclaimer Important notice The following presentation is being made only to, and is only directed at, persons to whom such presentation may lawfully be communicated ( relevant persons
EVRY intends to apply for a listing on Oslo Børs
 NOT FOR PUBLICATION, DISTRIBUTION OR RELEASE, DIRECTLY OR INDIRECTLY, IN OR INTO THE UNITED STATES OF AMERICA, AUSTRALIA, CANADA, JAPAN, SOUTH AFRICA OR ANY JURISDICTION WHERE TO DO SO MIGHT CONSTITUTE
9M 2018 RESULTS PRESENTATION
 9M 2018 RESULTS PRESENTATION 12.11.2018 9M 2018 RESULTS PRESENTATION DISCLAIMER This presentation (the "Presentation") has been prepared and is issued by, and is the sole responsibility of Telepizza Group,
Investor Presentation
 Investor Presentation Results for the year ended 31 December 2017 26 April 2018 Disclaimer Forward-looking statements This presentation may include forward-looking statements. All statements other than
Q Results presentation
 Q1 2018 Results presentation 12 May 2016 1 15 May, 2018 Disclaimer This presentation (the "Presentation") has been prepared and is issued by, and is the sole responsibility of Telepizza Group, S.A. ( Telepizza"
Full year and Q results March 15, 2017
 Full year and Q4 2016 results March 15, 2017 Disclaimer This document and its related communication ( Presentation ) have been issued by windeln.de SE and its subsidiaries ( Company ) and do not constitute
Cover-More Group. UBS Australasia Conference. November 2015
 Cover-More Group UBS Australasia Conference November 2015 Executive summary: FY15 overview Cover-More delivered another year of double digit earnings growth, with offshore business growing substantially.
PRESENTATION BAADER INVESTMENT CONFERENCE. Munich 18 September 2017
 PRESENTATION BAADER INVESTMENT CONFERENCE Munich 18 September 2017 DISCLAIMER AND NOTES To the extent that statements in this presentation do not relate to historical or current facts, they constitute
London, 6 September 2018
 London, 6 September 2018 NOTICE TO RECIPIENTS This presentation and any materials distributed in connection herewith (together, the Presentation ) have been prepared by Douglas GmbH (the Company ) solely
MADE TO TRADE. Goldman Sachs 18 th Annual Global Retailing Conference. Dr Eckhard Cordes, CEO 8 September 2011 METRO AG 2011
 MADE TO TRADE. Goldman Sachs 18 th Annual Global Retailing Conference Dr Eckhard Cordes, CEO 8 September 2011 METRO AG 2011 Disclaimer and Notes To the extent that statements in this presentation do not
FIRST-HALF 2018 RESULTS 30 JULY 2018
 FIRST-HALF 2018 RESULTS 30 JULY 2018 Disclaimer FORWARD LOOKING STATEMENTS This presentation contains certain statements that constitute "forward-looking statements", including but not limited to statements
Worldline H Results Worldline. Presentation to Investors September 2018
 Presentation to Investors September 2018 Disclaimer This document contains forward-looking statements that involve risks and uncertainties, including references, concerning the Group's expected growth
The Food Travel Experts.
 The Food Travel Experts www.foodtravelexperts.com Presentation structure 1. Group highlights Kate Swann 2. Financial review Jonathan Davies 3. Business review Kate Swann 4. Q&A All 2 Group highlights Strong
2012 Interim Results - Presentation ZURICH, 23 AUGUST 2012
 2012 Interim Results - Presentation ZURICH, 23 AUGUST 2012 Agenda - Highlights - Financials - Outlook 2 Strong position in Asia leads to improved operating results for HY 2012 Turnover +26.7% Negative
MAISONS DU MONDE: FULL-YEAR 2018 RESULTS
 PRESS RELEASE MAISONS DU MONDE: FULL-YEAR 2018 RESULTS Strong performance in line with targets Continued solid momentum in online and international sales Focus on strategic pillars to deliver further profitable
HIGHLIGHTS INTERIM REPORT Q XXL ASA. Q2 Growth
 INTERIM REPORT Q2 2018 XXL ASA HIGHLIGHTS Total revenues of NOK 2 331 million (NOK 2 054 million), up 14 per cent E-commerce growth of 38 per cent Three new store openings Strong growth but pressure on
Year-end report 2017 Press and analyst presentation
 Year-end report 2017 Press and analyst presentation 8 February, 2018 Per Strömberg, CEO Sven Lindskog, CFO In brief Good sales momentum in Sweden Robust underlying EBIT and cash flow Strong online growth
TELENOR GROUP - DNB NORDIC TMT CONFERENCE Sigve Brekke, CEO
 TELENOR GROUP - DNB NORDIC TMT CONFERENCE 2017 Sigve Brekke, CEO DISCLAIMER The following presentation is being made only to, and is only directed at, persons to whom such presentation may lawfully be
Acquisition of Jack Wolfskin. November 2018
 Acquisition of Jack Wolfskin November 2018 Important notices Forward-Looking Statements: During this presentation, any statements relating to future plans, events, financial results, performance or prospects,
As of March, 2011 SALLYBEAUTY HOLDINGS, INC. 1
 As of March, 2011 HOLDINGS, INC. 1 Cautionary Notice Regarding Forward-Looking Statements Cautionary Notice Regarding Forward-Looking Statements Statements in this presentation and the schedules hereto
TUI Travel PLC Q3 Results 8 th August Thomson Couples Oceanis Beach & Spa, Kos
 TUI Travel PLC Q3 Results 8 th August 2014 Thomson Couples Oceanis Beach & Spa, Kos Agenda Q3 Results Q3 Overview Financial Performance Delivering Against Our Growth Levers Current Trading & Outlook Q&A
EVRY ASA Q PRESENTATION CEO BJÖRN IVROTH CFO HENRIK SCHIBLER
 1 EVRY ASA Q1 2018 PRESENTATION CEO BJÖRN IVROTH CFO HENRIK SCHIBLER Agenda Group highlights Business update Financial highlights Business area performance Targets and Concluding remarks Q&A 2 Group highlights
Presentation of Annual Report Klaus Holse, CEO, SimCorp A/S Thomas Johansen, CFO, SimCorp A/S
 Presentation of Annual Report 2014 Klaus Holse, CEO, SimCorp A/S Thomas Johansen, CFO, SimCorp A/S Disclaimer This presentation contains certain forward-looking statements and expectations in respect of
FY2017 RESULTS. - March 8 th,
 FY2017 RESULTS - March 8 th, 2018 - I 2017 key business highlights 2017 KEY BUSINESS HIGHLIGHTS strategic projects transforming the group for the long term Implementation of our omni-channel vision with
Self Storage Group intends to apply for a listing on Oslo Børs
 NOT FOR DISTRIBUTION OR RELEASE, DIRECTLY OR INDIRECTLY, IN OR INTO THE UNITED STATES, CANADA, AUSTRALIA, HONG KONG, SOUTH AFRICA OR JAPAN OR ANY OTHER JURISDICTION IN WHICH THE DISTRIBUTION OR RELEASE
HUGO BOSS First Half Year Results 2014
 HUGO BOSS First Half Year Results 2014 Claus-Dietrich Lahrs (CEO), Mark Langer (CFO) Metzingen, July 31, 2014 Conference Call, First Half Year Results 2014 HUGO BOSS July 31, 2014 2 / 42 Agenda Half Year
Investor Presentation S E P T E M B E R
 Investor Presentation S E P T E M B E R 2 0 1 6 Disclosure Regarding Forward-Looking Statements This presentation contains forward-looking statements. These forward-looking statements reflect the views
STOCK EXCHANGE RELEASE
 28 April 2016 The final offering price in Tokmanni Group Corporation s initial public offering has been set at EUR 6.70 per share Tokmanni Group Corporation ( Tokmanni or the Company ) today announces
Q Results presentation
 Q1 2016 Results presentation 12 May 2016 1 Disclaimer This presentation (the "Presentation") has been prepared and is issued by, and is the sole responsibility of Telepizza Group, S.A. ( Telepizza" or
2013 Interim Results. 14 August 2013
 2013 Interim Results 14 August 2013 1 This presentation contains statements that are, or may be, forward-looking regarding the group's financial position and results, business strategy, plans and objectives.
Interim report Q2 2018
 Interim report Q2 2018 Dear Shareholders Interim report Q2 2018 Kid ASA The second quarter is our most weather-dependent period of the year as we target the Norwegian consumer s outdoor home environment.
Migros Ticaret A.Ş. 9M 2017 Financial Results. Migros 2016 Sustainability Report released
 Migros Ticaret A.Ş. 9M 2017 Financial Results Migros 2016 Sustainability Report released Disclaimer Statement Migros Ticaret A.Ş. (the Company ) has prepared this presentation for the sole purpose of providing
Ontex Q3 2018: Further progress in challenging environment
 Ontex Q3 2018: Further progress in challenging environment Q3 LFL revenue ex Brazil +3%, outperforming flat hygiene markets Continuous focus on value: price/mix +2.9% Important milestones achieved in Brazil
Disclaimer. Worldline
 1 Disclaimer This communication does not contain or constitute an offer of Worldline s shares for sale or an invitation or inducement to invest in Worldline s shares in France, the United States of America
Q presentation. 5 February 2015
 Q4 2014 presentation 5 February 2015 Agenda Highlights Financial overview Market outlook Q4 Highlights Strong finish to a record year Revenue of NOK 7 549 million, up 10.3% EBITDA* of NOK 396 million,
FULL YEAR RESULTS PRESENTATION WELL POSITIONED FOR CONTINUED GROWTH. 3 April 2017
 FULL YEAR RESULTS PRESENTATION WELL POSITIONED FOR CONTINUED GROWTH 3 April 2017 AGENDA Introduction and overview John Hornby Financial review David Main Strategic progress and outlook John Hornby Questions
Half-year 2012 Results. August 1, 2012
 Half-year 2012 Results August 1, 2012 Disclaimer All forward-looking statements are Schneider Electric management s present expectations of future events and are subject to a number of factors and uncertainties
The Food Travel Experts.
 The Food Travel Experts www.foodtravelexperts.com Presentation structure 1. Group highlights Kate Swann 2. Financial review Jonathan Davies 3. Business review Kate Swann 4. Q&A All 2 Group highlights Good
Company Presentation. H1 13 September Delivery Hero SE. Company Presentation.
 Company Presentation H1 13 September 1 Our Clear Vision AMAZING FOOD Create an amazing takeaway experience AMAZING ORDERING AMAZING SERVICE 2 We Are an Online Food Ordering and Delivery Marketplace USER
Cloetta and LEAF to merge Creating a Nordic market leader. December 16, 2011
 Cloetta and LEAF to merge Creating a Nordic market leader December 16, 2011 Presenters Olof Svenfelt Lennart Bylock Bengt Baron Chairman of Cloetta Board member of Malfors Promotor, current majority shareholder
Fixed Income Investor Presentation August 2016
 InterContinental O2, London Fixed Income Investor Presentation August 2016 Table of contents 1. Introduction to IHG p3 2. Our Strategy p7 3. Financial Performance p13 DISCLAIMER RECIPIENTS ATTENTION IS
SMA SOLAR TECHNOLOGY AG Analyst / Investor Presentation Quarterly Financial Results: January to March 2014
 SMA SOLAR TECHNOLOGY AG Analyst / Investor Presentation Quarterly Financial Results: January to March 2014 Pierre-Pascal Urbon, CEO; Lydia Sommer, CFO May 15, 2014 Disclaimer IMPORTANT LEGAL NOTICE This
home24 Earnings Presentation Q November 2018
 home24 Earnings Presentation Q3-8 27 November 208 0 Our mission: to be the online destination for Home & Living Huge and uniquely attractive Home & Living market opportunity of EUR 7 billion Leading pure-play
Roadshow Zurich // MainFirst. HUGO BOSS Company Handout August 6, Roadshow Zurich // MainFirst HUGO BOSS August 7, / 52
 Roadshow Zurich // MainFirst HUGO BOSS Company Handout August 6, 2014 Roadshow Zurich // MainFirst HUGO BOSS August 7, 2014 2 / 52 Agenda Half Year Results 2014 Update on Key Strategic Initiatives Outlook
2015 FY RESULTS. / IR Team / Tel: ext
 2015 FY RESULTS / IR Team / Tel: +34 91 398 54 00 ext. 33890 investor.relations@diagroup.com 1 Disclaimer This document does not constitute or form part of any purchase, sales or Exchange offer, nor is
Roadshow Scandinavia // equinet
 Roadshow Scandinavia // equinet HUGO BOSS Company Handout August 12-14, 2014 Dennis Weber, Head of Investor Relations Roadshow Scandinavia // equinet HUGO BOSS August 12-14, 2014 2 / 52 Agenda Half Year
H & M HENNES & MAURITZ AB FULL YEAR REPORT
 H & M HENNES & MAURITZ AB FULL YEAR REPORT 1 December 2006 30 November 2007 Sales excluding VAT for the H&M Group for the financial year amounted to SEK 78,346 m (68,400), an increase of 15 percent. In
Roadshow London // Deutsche Bank
 Roadshow London // Deutsche Bank HUGO BOSS Company Handout August 6, 2014 Mark Langer (CFO) & Dennis Weber (Head of Investor Relations) Roadshow London // Deutsche Bank HUGO BOSS August 6, 2014 2 / 52
January O KEY Group S.A. The Russia FORUM 2012
 January 2012 O KEY Group S.A. The Russia FORUM 2012 Disclaimer By attending the meeting where this presentation is made, or by reading the presentation slides, you agree to be bound by the following limitations:
INVESTOR PRESENTATION LONDON 14 JANUARY 2014
 European leader in the Equipment Rental Market RENT LOXAM, RENT RELAX INVESTOR PRESENTATION LONDON 14 JANUARY 2014 DISCLAIMER This presentation does not constitute or form part of and should not be construed
Rent-A-Center today is
 INVESTOR PRESENTATION FIRST QUARTER 2014 Safe Harbor This presentation contains forward-looking statements that involve risks and uncertainties. Such forward-looking statements generally can be identified
Henkel Roadshow Q November, 2014
 Henkel Roadshow Q3 2014 November, 2014 Disclaimer This information contains forward-looking statements which are based on current estimates and assumptions made by the corporate management of Henkel AG
Investor Meeting Presentation
 Investor Meeting Presentation November 2014 Investor Meeting Presentation HUGO BOSS November 2014 2 / 54 Agenda Update on Key Strategic Initiatives Nine Months Results 2014 Outlook Investor Meeting Presentation
Checkpoint Systems Acquisition Investor Update March 2 nd Geoffrey T. Martin, President & CEO Sean P. Washchuk, Senior Vice President & CFO
 Checkpoint Systems Acquisition Investor Update March 2 nd 2016 Geoffrey T. Martin, President & CEO Sean P. Washchuk, Senior Vice President & CFO Disclaimer This presentation contains forward looking information
A Transformation NASDAQ: LCUT March 2018
 A Transformation NASDAQ: LCUT www.lifetimebrands.com March 2018 FORWARD LOOKING STATEMENTS This presentation contains forward-looking statements, including statements concerning Lifetime s future prospects