A Reminder on Forward-looking Statements
|
|
|
- Harry Hunt
- 5 years ago
- Views:
Transcription


1
2 A Reminder on Forward-looking Statements This presentation contains forward-looking statements within the meaning of the Private Securities Litigation Reform Act of 1995 that are based on management s current expectations and assumptions. These forward-looking statements are subject to certain risks and uncertainties that could cause actual results to differ materially from the potential results discussed in the forwardlooking statements. In particular, our predictions about future net sales and earnings could be affected by a variety of factors, including: competitive dynamics in the consumer foods industry and the markets for our products, including new product introductions, advertising activities, pricing actions and promotional activities of our competitors; economic conditions, including changes in inflation rates, interest rates, tax rates, or the availability of capital; product development and innovation; consumer acceptance of new products and product improvements; consumer reaction to pricing actions and changes in promotion levels; acquisitions or dispositions of businesses or assets; changes in capital structure; changes in the legal and regulatory environment, including labeling and advertising regulations and litigation; impairments in the carrying value of goodwill, other intangible assets, or other long-lived assets, or changes in the useful lives of other intangible assets; changes in accounting standards and the impact of significant accounting estimates; product quality and safety issues, including recalls and product liability; changes in consumer demand for our products; effectiveness of advertising, marketing and promotional programs; changes in consumer behavior, trends and preferences, including weight loss trends; consumer perception of health-related issues, including obesity; consolidation in the retail environment; changes in purchasing and inventory levels of significant customers; fluctuations in the cost and availability of supply chain resources, including raw materials, packaging and energy; disruptions or inefficiencies in the supply chain; volatility in the market value of derivatives used to manage price risk for certain commodities; benefit plan expenses due to changes in plan asset values and discount rates used to determine plan liabilities; failure or breach of our information technology systems; foreign economic conditions, including currency rate fluctuations; and political unrest in foreign markets and economic uncertainty due to terrorism or war. The company undertakes no obligation to publicly revise any forward-looking statements to reflect any future events or circumstances


3
4 First Quarter Fiscal 2015 Financial Summary ($ in Millions, Except per Share) $ % Change Constantcurrency % Change* Net Sales $4,268-2% -1% Segment Operating Profit* Net Earnings Attributable to General Mills Diluted EPS Certain Items Affecting Comparability.06 Adjusted Diluted EPS*.61-13% -13% *Non-GAAP measures. See appendix for reconciliation
5 First Quarter Fiscal 2015 Components of Net Sales Growth As Reported +1pt -1pt -2pts -2pts Volume Price & Mix Foreign Exchange Total Net Sales
6 First Quarter Fiscal 2015 U.S. Retail Segment Results Segment Net Sales -5% vs. LY Segment Operating Profit -25% vs. LY % Change vs. LY Net Sales Pounds Snacks +3% + Small Planet Foods +2 + Yoplait +1 + Frozen -6 Flat Big G Cereals -9 Baking Products -11 Meals -13 -DD Total U.S. Retail -5% -2%
7 Trade Merchandising Expense Drivers Higher New Product Activity Merchandising Programs Less Effective Difficult Comparison to Year Ago
8 Merchandising Trends vs. Last Year General Mills % Volume Sold With Quality Merchandising (Index: Q1 F14 = 100) General Mills Quality Merchandising % Discount (Index: Q1 F14 = 100) Q1 F14 Q1 F15 Q1 F14 Q1 F15 Source: Nielsen XAOC FYTD ended


9 First Quarter Fiscal 2015 Convenience Stores & Foodservice Segment Net Sales +1% vs. LY Segment Operating Profit +18% vs. LY Q1 Net Sales Growth Yogurt +34% Frozen Breakfast +13 Snacks +6 Biscuits +3 Cereal -8 Mixes -9 Total Priority Platforms +4%


 Latin America +20% Asia / Pacific")
10 First Quarter Fiscal 2015 International Segment Constant-currency Segment Net Sales* +6% vs. LY Constant-currency Segment Operating Profit* +17% vs. LY Q1 Constant-currency Net Sales* (Change vs. LY) Latin America +20% Asia / Pacific +4 Europe +4 Canada -2 *Non-GAAP measures. See appendix for reconciliation
11 First Quarter Fiscal 2015 Segment Operating Profit ($ in Millions) $ % Change Constant Currency % Change* Total Segment Operating Profit* $690-15% -15% U.S. Retail International Convenience Stores & Foodservice *Non-GAAP measures. See appendix for reconciliation


12 First Quarter Fiscal 2015 Joint Venture Results After-tax Earnings: $26MM; +5% vs. LY* CPW Net Sales -1%** HDJ Net Sales +3** *Growth rate in constant currency. Non-GAAP measure. See appendix for reconciliation. **Growth rates in constant currency
13 First Quarter Fiscal 2015 Other Income Statement Items Unallocated Corporate Expense Decreased Excluding Mark-to-market Effects Restructuring and other Exit Costs of $14MM Pre-tax Excluded from Adjusted Diluted EPS Adjusted Effective Tax Rate 32.3% vs. 32.2% LY* Average Number of Diluted Shares Outstanding Down 5% *Non-GAAP measure. See appendix for reconciliation
14 Fiscal 2015 Core Working Capital ($ in Millions) Q1 F15 F14 Accounts Receivable $1,623 $1,638 Inventories 1,823 1,774 Accounts Payable 1,571 1,
15 First Quarter Fiscal 2015 Cash Flow Highlights Q1 Operating Cash Flow ($ in Millions) Uses of Cash $381 $329 Fixed Asset Investment = $149MM Dividends Paid = $254MM Share Repurchases = $462MM F14 F
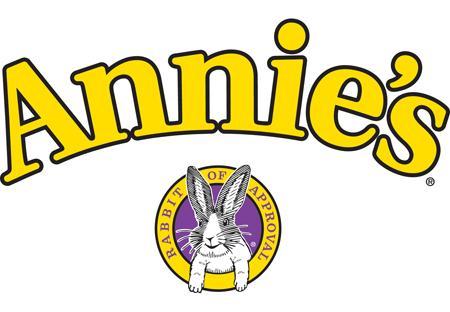
16 Annie s Acquisition Annie s Fiscal 2014 Net Sales = $204 Million Purchase Price = $46 per Share in Cash Funded through Debt No Impact on F15 Share Repurchase Plan Accretive in First 12 Months After Closing* Expect Transaction to Close in Calendar 2014 *Excludes purchase accounting adjustments and transaction and integration expenses
17 Fiscal 2015 Financial Targets Mid Single-digit Growth in Constant-currency Net Sales*, including 53 rd Week Mid Single-digit Growth in Constant-currency Segment Operating Profit* High Single-digit Growth in Constant-currency Adjusted Diluted EPS* *Non-GAAP measures


18

19 Global Supply Chain Strategy Lead With Safety Total Employee Engagement ROC Our World Grow Our Business


20 Holistic Margin Management COGS Productivity Mix Management Offset Inflation Admin Processes HMM Pricing Consumer & Trade Programs Consumer Investment
21 General Mills Input Cost Inflation +10% Avg: +4-5% +4% +3% +4% +3% F11 F12 F13 F14 F15 Plan Supply Chain costs including raw materials, energy, wages, benefits, handling costs
22 On Pace To Achieve Our HMM Goal (COGS HMM, Fiscal Years, $ in Millions) $4,000 $2,000 >$ Cumulative Savings 2015 Plan Cumulative Savings Goal


23 2015 HMM Projects End-to-end Optimization Pouso Alegre, Brazil Factory HMM $10MM Savings Global Sourcing $5MM Savings $10MM Savings
24 HMM Has Helped Maintain Margins Gross Margin % of Sales 35.5% 35.6% 39.6% 40.0% 36.3% 36.1% 35.6% F08 F09 F10 F11 F12 F13 F
25 Project Century Overview North America Supply Chain Asset Optimization Project Objectives: Streamline & Simplify Position Supply Chain for Future Growth $100 Million Cumulative Savings by F17 Material Savings Beginning in F


26
27 Today s Operating Environment Convenience Stores & Foodservice: Stable U.S. Retail: Category Trends Weakened in Q1 Aggregate Retail Sales -1% vs. LY International Markets: Growth Slowed Somewhat
28 U.S. Retail First Quarter Operating Summary Dessert Mixes, Meal Products, and Frozen Vegetables Drove U.S. Retail Volume Decline Good Progress on Top F15 Priorities: Cereal, Yogurt, and Snacks


29 Big G Continued Market Share Gains Q1 Highlights RTE Cereal Dollar Share: 31.1%, +0.3pts vs LY Source: Nielsen XAOC FYTD ended


30 Renewed Sales and Market Share Growth for Yoplait Division Q1 Highlights Yoplait Retail Sales +3% Dollar Share 24.4%, +0.5pts vs LY Source: Nielsen XAOC FYTD ended


31 Continued Strong Snacks Momentum Fiber One Nature Valley Fruit Snacks Q1 % Change Retail Sales Q1 Change Market Share Grain Snacks +6% +2.9 pts Fruit Snacks +5% +2.1 pts Source: Nielsen XAOC FYTD ended


32 Natural & Organic Foods Q1 Natural/Organic Snacks Retail Sales +17% Cause-related Consumer Investment Source: Nielsen XAOC FYTD ended , SPINS FYTD ended


33 Expanding Our Portfolio


34 Additional First Quarter Highlights Totino s Old El Paso (Shelf-stable and Frozen) Q1 % Change Retail Sales Q1 Change Market Share Pizza +7% +0.8 pts Q1 Old El Paso Retail Sales +7% Hot Snacks +3% +1.2 pts Source: Nielsen XAOC FYTD ended ; Old El Paso data includes frozen and shelf stable ex-snack aisle
35 Growing Share in Majority of Key U.S. Retail Categories Q1 Dollar Share +/- LY Grain Snacks 43.7% 2.9pts Fruit Snacks RTS Soup Frozen Hot Snacks Frozen Pizza Yogurt RTE Cereal Dry Packaged Dinners Mexican Aisle Products* Refrig. Baked Goods Frozen Vegetables Dessert Mixes * Excludes snack aisle Source: Nielsen XAOC FYTD ended


36 Convenience Stores & Foodservice First Quarter Fiscal 2015 Net Sales Growth Yogurt Snacks +34% +6% Frozen Breakfast +13%


37 International Highlights Europe Region Häagen-Dazs Old El Paso Q1 Retail Sales +5% Q1 Retail Sales +12% Yoplait UK Q1 Retail Sales +7% France Q1 Retail Sales +5% Source: Nielsen & IRI latest quarter ended July


38 International Highlights Asia/Pacific Region Häagen-Dazs Constant-currency Net Sales +9%* Q1 Wanchai Ferry New Items * Actual net sales in local currency translated to USD at a fixed exchange rate


39 International Highlights Latin America Region Successful Festa Junina Execution Q1 Launch


40 Second Quarter Initiatives Progresso Soup Season Key Baking Season International Media Support & Innovation
41 Today s General Mills Fiscal 2015 Update Maintaining Outlook for Full Year Sales and Earnings Growth Top Priority is Accelerating Net Sales Growth Ongoing HMM Program and New Cost-reduction Efforts to Boost Efficiency and Sharpen Focus
42 Additional Information Related to the Annie s Transaction The tender offer described in this document has not yet commenced. This document and the description contained herein is neither an offer to purchase nor a solicitation of an offer to sell shares of Annie s, Inc. At the time the tender offer is commenced, General Mills, Inc. and its wholly owned subsidiary, Sandy Acquisition Corporation, intend to file with the Securities and Exchange Commission (the SEC ) a Tender Offer Statement on Schedule TO containing an offer to purchase, a form of letter of transmittal and other documents relating to the tender offer, and Annie s intends to file with the SEC a Solicitation/Recommendation Statement on Schedule 14D-9 with respect to the tender offer. General Mills, Sandy Acquisition Corporation and Annie s intend to mail these documents to the stockholders of Annie s. These documents will contain important information about the tender offer and stockholders of Annie s are urged to read them carefully when they become available. Stockholders of Annie s will be able to obtain a free copy of these documents (when they become available) and other documents filed by Annie s, General Mills or Sandy Acquisition Corporation with the SEC at the website maintained by the SEC at In addition, stockholders will be able to obtain a free copy of these documents (when they become available) from the information agent named in the offer to purchase or from General Mills
43 Reconciliation of Total Segment Operating Profit (Fiscal Years, $ in Millions) Q U.S. Retail $457 $612 International Convenience Stores & Foodservice Total Segment Operating Profit $690 $812 Unallocated Corporate Items Restructuring, Impairment, and Other Exit Costs 14 3 Operating Profit $558 $735 Table does not foot due to rounding
44 Reconciliation of Adjusted Diluted EPS and Related Constant-currency Growth Rate (Fiscal Years) Q Diluted EPS $0.55 $ % Mark-to-market Effects Restructuring Change Adjusted Diluted EPS $0.61 $ % Impact of Foreign Currency Exchange -- Adjusted Diluted EPS On a Constant-currency Basis -13%
45 Reconciliation of Constant-currency Net Sales Growth (Fiscal Years) Q % Change in Net Sales as Reported Impact of Foreign Currency Exchange % Change in Net Sales on a Constantcurrency Basis Europe 9% 5 pts 4% Canada Asia/Pacific Latin America Total International 2% -4 pts 6% Total Net Sales -2% -1 pts -1%
46 Reconciliation of Constant-currency International Segment Operating Profit Growth (Fiscal Years) Q % Change in Segment Operating Profit as Reported Impact of Foreign Currency Exchange % Change in Segment Operating Profit on a Constantcurrency Basis International Segment Operating Profit 16% -1 pts 17%
47 Reconciliation of Constant-currency Total Segment Operating Profit Growth (Fiscal Years) Q % Change in Total Segment Operating Profit as Reported Impact of Foreign Currency Exchange % Change in Total Segment Operating Profit on a Constantcurrency Basis Total Segment Operating Profit -15% %
48 Reconciliation of Constant-currency After-tax JV Earnings (Fiscal Years) Q % Change in After-tax JV Earnings as Reported Impact of Foreign Currency Exchange % Change in After-tax JV Earnings on a Constantcurrency Basis Total After-tax Earnings from Joint Ventures 7% 2 pts 5%
49 As Reported $479 $153 $656 $212 Mark-to-market effects Restructuring Costs As Adjusted $542 $175 $660 $213 Effective Tax Rate: Reconciliation of Tax Rate Excluding Items (Fiscal Years, $ in Millions) Q Pre-tax Earnings* Income Taxes Q Pre-tax Earnings* Income Taxes As Reported 31.8% 32.3% As Adjusted 32.3% 32.2% * Earnings before income taxes and after-tax earnings from joint ventures. Table does not foot due to rounding
50 Full Year Historical Data for Changes to International Segment Operating Profit and Unallocated Corporate Items Beginning in the first quarter of fiscal 2015, we changed how we assess segment operating performance to exclude the asset and liability remeasurement impact of hyperinflationary economies. We revised the amounts previously reported for International segment operating profit and unallocated corporate items. These changes had no effect on previously reported consolidated net sales, operating segments' net sales, operating profit, net earnings attributable to General Mills or earnings per share. We are providing investors revised historical financial information to assist them in making comparisons with our current presentation. Fiscal Year (Dollars in Millions) As Reported Operating Profit: U.S. Retail $ 2,311.5 $ 2,392.9 $ 2,295.3 $ 2,347.9 $ 2,385.1 International Convenience Stores and Foodservice Total Segment Operating Profit $ 3,091.7 $ 3,197.7 $ 3,011.6 $ 2,945.6 $ 2,840.5 Unallocated Corporate Items Divestiture (Gain) (65.5) - - (17.4) - Restructuring, Impairment, and Other Exit Costs Operating Profit $ 2,957.4 $ 2,851.8 $ 2,562.4 $ 2,774.5 $ 2,606.1 As Changed Operating Profit: U.S. Retail $ 2,311.5 $ 2,392.9 $ 2,295.3 $ 2,347.9 $ 2,385.1 International Convenience Stores and Foodservice Total Segment Operating Profit $ 3,153.9 $ 3,222.9 $ 3,011.6 $ 2,945.6 $ 2,854.5 Unallocated Corporate Items Divestiture (Gain) (65.5) - - (17.4) - Restructuring, Impairment, and Other Exit Costs Operating Profit $ 2,957.4 $ 2,851.8 $ 2,562.4 $ 2,774.5 $ 2,
51 Fiscal 2014 Quarterly Data for Changes to International Segment Operating Profit and Unallocated Corporate Items Beginning in the first quarter of fiscal 2015, we changed how we assess segment operating performance to exclude the asset and liability remeasurement impact of hyperinflationary economies. We revised the amounts previously reported for International segment operating profit and unallocated corporate items. These changes had no effect on previously reported consolidated net sales, operating segments' net sales, operating profit, net earnings attributable to General Mills or earnings per share. We are providing investors revised historical financial information to assist them in making comparisons with our current presentation. Fiscal 2014 (Dollars in Millions) 1st Qtr 2nd Qtr 3rd Qtr 4th Qtr Annual As Reported Operating Profit: U.S. Retail $ $ $ $ $ 2,311.5 International Convenience Stores and Foodservice Total Segment Operating Profit $ $ $ $ $ 3,091.7 Unallocated Corporate Items Divestiture (Gain) (65.5) (65.5) Restructuring, Impairment, and Other Exit Costs Operating Profit $ $ $ $ $ 2,957.4 As Changed Operating Profit: U.S. Retail $ $ $ $ $ 2,311.5 International Convenience Stores and Foodservice Total Segment Operating Profit $ $ $ $ $ 3,153.9 Unallocated Corporate Items Divestiture (Gain) (65.5) (65.5) Restructuring, Impairment, and Other Exit Costs Operating Profit $ $ $ $ $ 2,
General Mills. Fiscal 2016 First Quarter Results
 General Mills Fiscal 2016 First Quarter Results A Reminder on Forward-looking Statements This presentation contains forward-looking statements within the meaning of the Private Securities Litigation Reform
General Mills. Fiscal rd Quarter Results. March 19,
 General Mills Fiscal 2014 3 rd Quarter Results March 19, 2014 6582-1 This presentation contains forward-looking statements within the meaning of the Private Securities Litigation Reform Act of 1995 that
GENERAL MILLS. Fiscal 2018 Second Quarter Results. December 20, 2017
 GENERAL MILLS Fiscal 2018 Second Quarter Results December 20, 2017 A Reminder on Forward-looking Statements This presentation contains forward-looking statements within the meaning of the Private Securities
GENERAL MILLS. Fiscal 2018 First Quarter Results. September 20, 2017
 GENERAL MILLS Fiscal 2018 First Quarter Results September 20, 2017 Don Mulligan EVP, Chief Financial Officer A Reminder on Forward-looking Statements This presentation contains forward-looking statements
GENERAL MILLS. Fiscal 2018 Fourth Quarter and Full-year Results. June 27, 2018
 GENERAL MILLS Fiscal 2018 Fourth Quarter and Full-year Results June 27, 2018 A Reminder on Forward-looking Statements This presentation contains forward-looking statements within the meaning of the Private
GENERAL MILLS FISCAL 2019 FIRST-QUARTER EARNINGS SEPTEMBER 18, 2018
 GENERAL MILLS FISCAL 2019 FIRST-QUARTER EARNINGS SEPTEMBER 18, 2018 A Reminder on Forward-looking Statements This presentation contains forward-looking statements within the meaning of the Private Securities
GENERAL MILLS FISCAL 2019 THIRD-QUARTER EARNINGS MARCH 20, 2019
 GENERAL MILLS FISCAL 2019 THIRD-QUARTER EARNINGS MARCH 20, 2019 1 A Reminder on Forward-looking Statements This presentation contains forward-looking statements within the meaning of the Private Securities
GENERAL MILLS FISCAL 2019 SECOND-QUARTER EARNINGS DECEMBER 19, 2018
 GENERAL MILLS FISCAL 2019 SECOND-QUARTER EARNINGS DECEMBER 19, 2018 1 A Reminder on Forward-looking Statements This presentation contains forward-looking statements within the meaning of the Private Securities
GENERAL MILLS. Fiscal 2018 Third Quarter Results. March 21, 2018
 GENERAL MILLS Fiscal 2018 Third Quarter Results March 21, 2018 A Reminder on Forward-looking Statements This presentation contains forward-looking statements within the meaning of the Private Securities
fourth quarter. Earnings contributed by the extra week totaled approximately $0.04 per diluted share. U.S. Retail Segment Results
 General Mills Reports Fourth Quarter And Full Year Fiscal Results Fiscal 2016 Plans Include Increased Levels of Core Brand Renovation, Strong New Product Innovation, and Continued Progress on Cost Savings
General Mills Reports Fourth Quarter And Full Year Fiscal 2015 Results
 General Mills Reports Fourth Quarter And Full Year Fiscal 2015 Results Fiscal 2016 Plans Include Increased Levels of Core Brand Renovation, Strong New Product Innovation, and Continued Progress on Cost
GENERAL MILLS REPORTS FISCAL 2019 SECOND-QUARTER RESULTS AND REAFFIRMS FULL-YEAR GUIDANCE
 FOR IMMEDIATE RELEASE December 19, Contact: (analysts) Jeff Siemon: 763-764-2301 (media) Kelsey Roemhildt: 763-764-6364 GENERAL MILLS REPORTS FISCAL 2019 SECOND-QUARTER RESULTS AND REAFFIRMS FULL-YEAR
Excluding certain items affecting comparability, earnings per share grew 23 percent to $0.97, exceeding the consensus of analyst estimates.
 General Mills Reports Strong Results for Fiscal 2010 Third Quarter Company Raises Full-year EPS Guidance MINNEAPOLIS, Mar 24, 2010 (BUSINESS WIRE) -- General Mills (NYSE: GIS) today reported financial
General Mills Achieves Record-Level Results in Fiscal 2010 Company Sees Continuing Growth in Fiscal 2011
 General Mills Achieves Record-Level Results in Fiscal 2010 Company Sees Continuing Growth in Fiscal 2011 MINNEAPOLIS, Jun 29, 2010 (BUSINESS WIRE) -- General Mills (NYSE: GIS) today reported strong results
GENERAL MILLS REPORTS FISCAL 2018 SECOND-QUARTER RESULTS
 News/Information Investor Relations P. O. Box 1113 Minneapolis, MN 55440 FOR IMMEDIATE RELEASE December 20, Contact: (analysts) Jeff Siemon: 763-764-2301 (media) Bridget Christenson: 763-764-6364 GENERAL
GENERAL MILLS REPORTS STRONG FISCAL 2019 THIRD-QUARTER RESULTS AND UPDATES FULL-YEAR GUIDANCE
 News/Information FOR IMMEDIATE RELEASE Investor Relations P. O. Box 1113 Minneapolis, MN 55440 March 20, Contact: (analysts) Jeff Siemon: 763-764-2301 (media) Rob Litt: 763-764-6364 GENERAL MILLS REPORTS
GENERAL MILLS REPORTS FISCAL 2019 FIRST-QUARTER RESULTS
 News/Information Investor Relations P. O. Box 1113 Minneapolis, MN 55440 FOR IMMEDIATE RELEASE September 18, 2018 Contact: (analysts) Jeff Siemon: 763-764-2301 (media) Kelsey Roemhildt: 763-764-6364 GENERAL
Putting the Consumer First 86th Annual Shareholders Meeting September 23, 2014
 7459-1 A Reminder on Forward-looking Statements This presentation contains forward-looking statements within the meaning of the Private Securities Litigation Reform Act of 1995 that are based on management
GENERAL MILLS REPORTS FOURTH-QUARTER AND FULL-YEAR FISCAL 2018 RESULTS; PROVIDES 2019 OUTLOOK
 News/Information Investor Relations P. O. Box 1113 Minneapolis, MN 55440 FOR IMMEDIATE RELEASE June 27, 2018 Contact: (analysts) Jeff Siemon: 763-764-2301 (media) Bridget Christenson: 763-764-6364 GENERAL
Nov. 23, Nov. 24, 2013 % Change. Nov. 23, 2014
 Consolidated Statements of Earnings and Supplementary Information GENERAL MILLS, INC. AND SUBSIDIARIES (Unaudited) (In Millions, Except per Share Data) % Change % Change Net sales $ 4,712.2 $ 4,875.7 (3.4)%
CAGNY 2019 FEBRUARY 19, 2019
 CAGNY 2019 FEBRUARY 19, 2019 A Reminder on Forward-looking Statements This presentation contains forward-looking statements within the meaning of the Private Securities Litigation Reform Act of 1995 that
Bethany Quam. SVP; Group President, Europe & Australia
 Bethany Quam SVP; Group President, Europe & Australia Europe & Australia Segment F17 Net Sales: $1.8 Billion Yogurt Ice Cream F17 Segment Operating Profit: $164 Million Mexican Snacks Focused on 4 of 5
Global Growth and Returns GENERAL MILLS 01 ANNUAL REPORT
 Global Growth and Returns GENERAL MILLS 01 ANNUAL REPORT GLOBAL GROWTH AND RETURNS At General Mills, we serve the world by making food people love. Our goal is to create market-leading growth to deliver
2016 FIRST QUARTER FINANCIAL RESULTS
 Kellogg Company Kellogg Company 2016 FIRST QUARTER FINANCIAL RESULTS Forward Looking Statements This presentation contains, or incorporates by reference, forward looking statements with projections concerning,
Kellogg Company FOURTH QUARTER 2017 FINANCIAL RESULTS February 8, 2018
 Kellogg Company FOURTH QUARTER 2017 FINANCIAL RESULTS February 8, 2018 Forward-Looking Statements This presentation contains, or incorporates by reference, forward-looking statements with projections concerning,
Third Quarter 2010 Earnings
 Kellogg Company Third Quarter 2010 Earnings Forward-Looking Statements This presentation contains, or incorporates by reference, forward-looking statements with projections concerning, among other things,
Kellogg Company THIRD QUARTER 2017 FINANCIAL RESULTS October 31, 2017
 Kellogg Company THIRD QUARTER 2017 FINANCIAL RESULTS October 31, 2017 Forward-Looking Statements This presentation contains, or incorporates by reference, forward-looking statements with projections concerning,
Kellogg Company 2016 THIRD QUARTER FINANCIAL RESULTS November 1, 2016
 Kellogg Company 2016 THIRD QUARTER FINANCIAL RESULTS Agenda Overview Financials North America Europe Latin America Asia Pacific Summary John Bryant, Chairman & Chief Executive Officer Ron Dissinger, Chief
Kellogg Company February 21, Boca Raton February 21, 2018
 Boca Raton February 21, 2018 Deploy For Growth Forward-Looking Statements This presentation contains, or incorporates by reference, forward-looking statements with projections concerning, among other things,
FY18 Q3 Earnings Presentation
 FY18 Q3 Earnings Presentation March 22, 2018 Today s Presenters Brian Kearney Investor Relations Sean Connolly President and Chief Executive Officer Dave Marberger Chief Financial Officer 2 Forward-Looking
UNITED STATES SECURITIES AND EXCHANGE COMMISSION Washington, D.C FORM 10-Q
 UNITED STATES SECURITIES AND EXCHANGE COMMISSION Washington, D.C. 20549 FORM 10-Q (Mark One) QUARTERLY REPORT PURSUANT TO SECTION 13 OR 15(d) OF THE SECURITIES EXCHANGE ACT OF 1934 FOR THE QUARTERLY PERIOD
Mondelēz International Q Results. July 27, 2016
 Mondelēz International Q2 2016 Results July 27, 2016 1 Forward-Looking Statements This presentation contains a number of forward-looking statements. Words, and variations of words, such as will, expect,
Fourth-Quarter Sales Increased 7 Percent; Organic Sales Decreased 2 Percent
 Print Page Close Window Campbell Reports Fourth-Quarter and Full-Year Results Fourth-Quarter Sales Increased 7 Percent; Organic Sales Decreased 2 Percent Fourth-Quarter Adjusted EPS from Continuing Operations
(GIS-NYSE) SUMMARY. Risk Level *
 SUMMARY. Risk Level *") January 23, 2015 General Mills Inc. Current Recommendation SUMMARY DATA NEUTRAL Prior Recommendation Outperform Date of Last Change 07/14/2005 Current Price (01/22/15) $54.78 Target Price $58.00 52-Week
January 23, 2015 General Mills Inc. Current Recommendation SUMMARY DATA NEUTRAL Prior Recommendation Outperform Date of Last Change 07/14/2005 Current Price (01/22/15) $54.78 Target Price $58.00 52-Week
Q2 Fiscal 2017 Earnings Commentary
 Q2 Fiscal 2017 Earnings Commentary August 31, 2017 The financial measures discussed below include both GAAP and adjusted non-gaap financial measures. In connection with the restructuring of its ivivva
CAMPBELL REPORTS FIRST-QUARTER RESULTS
 FOR IMMEDIATE RELEASE INVESTOR CONTACT: MEDIA CONTACT: Ken Gosnell Thomas Hushen (856) 342-6081 (856) 342-5227 ken_gosnell@campbellsoup.com thomas_hushen@campbellsoup.com CAMPBELL REPORTS FIRST-QUARTER
FORM 10 Q. GENERAL MILLS INC gis. Filed: March 30, 2007 (period: February 25, 2007)
") FORM 10 Q GENERAL MILLS INC gis Filed: March 30, 2007 (period: February 25, 2007) Quarterly report which provides a continuing view of a company's financial position Table of Contents Part I. FINANCIAL
FORM 10 Q GENERAL MILLS INC gis Filed: March 30, 2007 (period: February 25, 2007) Quarterly report which provides a continuing view of a company's financial position Table of Contents Part I. FINANCIAL
GENERAL MILLS INC ( GIS ) 10 Q Quarterly report pursuant to sections 13 or 15(d) Filed on 9/22/2010 Filed Period 8/29/2010
 10 Q Quarterly report pursuant to sections 13 or 15(d) Filed on 9/22/2010 Filed Period 8/29/2010") GENERAL MILLS INC ( GIS ) 10 Q Quarterly report pursuant to sections 13 or 15(d) Filed on 9/22/2010 Filed Period 8/29/2010 Table of Contents (Mark One) UNITED STATES SECURITIES AND EXCHANGE COMMISSION
GENERAL MILLS INC ( GIS ) 10 Q Quarterly report pursuant to sections 13 or 15(d) Filed on 9/22/2010 Filed Period 8/29/2010 Table of Contents (Mark One) UNITED STATES SECURITIES AND EXCHANGE COMMISSION
McCormick & Company, Inc. 2nd Quarter 2017 Financial Results and Outlook June 29, 2017
 McCormick & Company, Inc. 2nd Quarter 2017 Financial Results and Outlook June 29, 2017 1 The following slides accompany a June 29, 2017 presentation to investment analysts. This information should be read
Mondelēz International Q Results. November 5, 2014
 Mondelēz International Q3 2014 Results November 5, 2014 1 Forward-looking statements This slide presentation contains a number of forward-looking statements. Words, and variations of words, such as will,
McCormick & Company, Inc. 1 st Quarter 2018 Financial Results and Outlook
 McCormick & Company, Inc. 1 st Quarter 2018 Financial Results and Outlook March 27, 2018 The following slides accompany a March 27, 2018, earnings release conference call. This information should be read
UNITED STATES SECURITIES AND EXCHANGE COMMISSION Washington, D.C FORM 10-Q
 UNITED STATES SECURITIES AND EXCHANGE COMMISSION Washington, D.C. 20549 FORM 10-Q (Mark One) QUARTERLY REPORT PURSUANT TO SECTION 13 OR 15(d) OF THE SECURITIES EXCHANGE ACT OF 1934 FOR THE QUARTERLY PERIOD
Kellogg Company SECOND QUARTER 2017 FINANCIAL RESULTS August 3, 2017
 Kellogg Company SECOND QUARTER 2017 FINANCIAL RESULTS August 3, 2017 Forward-Looking Statements This presentation contains, or incorporates by reference, forward-looking statements with projections concerning,
Second Quarter 2018 Financial Review and Analysis (preliminary, unaudited)
") Second Quarter 2018 Financial Review and Analysis (preliminary, unaudited) Supplemental Presentation Materials Unless otherwise indicated, comparisons are to the same period in the prior year. 1 Second
Second Quarter 2018 Financial Review and Analysis (preliminary, unaudited) Supplemental Presentation Materials Unless otherwise indicated, comparisons are to the same period in the prior year. 1 Second
FLOWERS FOODS, INC. REPORTS FOURTH QUARTER AND FULL YEAR 2017 RESULTS
 FLOWERS FOODS, INC REPORTS FOURTH QUARTER AND FULL YEAR 2017 RESULTS February 07, 2018 THOMASVILLE, Ga, Feb 7, 2018 /PRNewswire/ -- Flowers Foods, Inc (NYSE: FLO), producer of Nature's Own, Wonder, Tastykake,
Fourth Quarter & Full-Year Fiscal 2018 Results. Strategy & Portfolio Review
 Fourth Quarter & Full-Year Fiscal 2018 Results Strategy & Portfolio Review 1 Forward-Looking Statements The factors that could cause actual results to vary materially from those anticipated or expressed
Q4 & FY 2018 Results. January 30, 2019
 Q4 & FY 2018 Results January 30, 2019 This presentation contains a number of forwardlooking statements. Words, and variations of words, such as will, expect, may, believe, estimate, deliver, potential,
McCormick & Company, Inc. 3rd Quarter 2017 Financial Results and Outlook September 28, 2017
 McCormick & Company, Inc. 3rd Quarter 2017 Financial Results and Outlook September 28, 2017 1 The following slides accompany a September 28, 2017 earnings release conference call. This information should
First Quarter 2018 Financial Review and Analysis (preliminary, unaudited)
") First Quarter 2018 Financial Review and Analysis (preliminary, unaudited) Supplemental Presentation Materials Unless otherwise indicated, comparisons are to the same period in the prior year. 1 First Quarter
First Quarter 2018 Financial Review and Analysis (preliminary, unaudited) Supplemental Presentation Materials Unless otherwise indicated, comparisons are to the same period in the prior year. 1 First Quarter
Q Results July 25, 2018
 Q2 2018 Results July 25, 2018 1 Forwardlooking statements This presentation contains a number of forwardlooking statements. Words, and variations of words, such as will, expect, believe, estimate, deliver,
UNITED STATES SECURITIES AND EXCHANGE COMMISSION Washington, D.C FORM 10-Q
 UNITED STATES SECURITIES AND EXCHANGE COMMISSION Washington, D.C. 20549 FORM 10-Q (Mark One) QUARTERLY REPORT PURSUANT TO SECTION 13 OR 15(d) OF THE SECURITIES EXCHANGE ACT OF 1934 FOR THE QUARTERLY PERIOD
Q Results. October 29, 2018
 Q3 2018 Results October 29, 2018 Forwardlooking Statements This presentation contains a number of forwardlooking statements. Words, and variations of words, such as will, expect, may, should, believe,
FOURTH QUARTER 2017 EARNINGS PRESENTATION FEBRUARY 8, 2018
 FOURTH QUARTER 2017 EARNINGS PRESENTATION FEBRUARY 8, 2018 REGARDING FORWARD-LOOKING STATEMENTS Statements contained in this press release that are not historical facts are forward-looking statements.
Fourth Quarter and Full Year 2018 Financial Review and Analysis
 Fourth Quarter and Full Year 2018 Financial Review and Analysis (preliminary, unaudited) Supplemental Presentation Materials Unless otherwise indicated, comparisons are to the same periods in the prior
Avery Dennison Jefferies Industrials Conference
 Avery Dennison Jefferies Industrials Conference August 9, 2016 Anne Bramman SVP and Chief Financial Officer 1 Avery Dennison Investor Presentation Forward-Looking Statements Certain statements contained
Forward Looking Statement
 Forward Looking Statement This presentation contains, or incorporates by reference, forward looking statements with projections concerning, among other things, the Company s global growth and efficiency
Q4 Fiscal 2017 Earnings Commentary. March 27, 2018
 Q4 Fiscal 2017 Earnings Commentary March 27, 2018 The financial measures discussed below include both GAAP and adjusted non-gaap financial measures. In connection with the restructuring of its ivivva operations,
Full-Year & Q Results. January 31, 2018
 Full-Year & Q4 2017 Results January 31, 2018 Forward-looking statements This presentation contains a number of forward-looking statements. Words, and variations of words, such as will, expect, could, likely,
October 27, 2015 Media Contact: Dan Turner WILMINGTON, Del Investor Contact:
 October 27, 2015 Media Contact: Dan Turner WILMINGTON, Del. 302-996-8372 daniel.a.turner@dupont.com Investor Contact: 302-774-4994 DuPont Reports 3Q Operating EPS of $0.13; YTD Operating EPS of $2.49 Cost
Q Results May 1, 2018
 Q1 2018 Results May 1, 2018 1 Forward-looking statements This presentation contains a number of forward-looking statements. Words, and variations of words, such as will, expect, should, plan, believe,
McCormick & Company, Inc. Second quarter 2009 financial results and business outlook June 25, 2009
 McCormick & Company, Inc. Second quarter 2009 financial results and business outlook June 25, 2009 The following slides accompany a June 25, 2009 presentation to investment analysts. This information should
Annual Report 2013 Healthy Growth. General Mills
 Annual Report 2013 Healthy Growth General Mills Our Fiscal 2013 Financial Highlights 52 weeks 52 weeks In millions, except per share and ended ended return on capital data May 26, 2013 May 27, 2012 Change
PepsiCo Reports First Quarter 2018 Results; Reaffirms 2018 Financial Targets
 PepsiCo Reports First Quarter 2018 Results; Reaffirms 2018 Financial Targets Reported (GAAP) First Quarter 2018 Results First Quarter Net revenue growth 4.3% Foreign exchange impact on net revenue 2% EPS
McCormick & Company, Inc. 4th Quarter 2016 Financial Results and Outlook January 25, 2017
 McCormick & Company, Inc. 4th Quarter 2016 Financial Results and Outlook January 25, 2017 The following slides accompany a January 25, 2017 presentation to investment analysts. This information should
McCormick & Company, Inc. 2 nd Quarter 2018 Financial Results and Outlook
 McCormick & Company, Inc. 2 nd Quarter 2018 Financial Results and Outlook June 28, 2018 The following slides accompany a June 28, 2018, earnings release conference call. This information should be read
Kimberly-Clark Announces Year-End 2014 Results And 2015 Outlook
 January 23, 2015 Kimberly-Clark Announces Year-End 2014 Results And 2015 Outlook DALLAS, Jan. 23, 2015 /PRNewswire/ -- Kimberly-Clark Corporation (NYSE: KMB) today reported year-end 2014 results and provided
CHIEF EXECUTIVE OFFICER REMARKS
 Announces Fiscal 2019 Third Quarter Results ORRVILLE, Ohio, February 26, 2019 -- (NYSE: SJM) today announced results for the third quarter ended January 31, 2019, of its 2019 fiscal year. Financial results
Mondelēz International 2013 Results. February 12, 2014
 Mondelēz International 2013 Results February 12, 2014 1 Forward-looking statements This slide presentation contains a number of forward-looking statements. Words, and variations of words, such as will,
CHIEF EXECUTIVE OFFICER REMARKS
 Announces Fiscal 2016 Third Quarter Results ORRVILLE, Ohio, February 23, 2016 -- (NYSE: SJM) today announced results for the third quarter ended January 31, 2016, of its 2016 fiscal year. All comparisons
The J. M. Smucker Company
 The J. M. Smucker Company Fourth Quarter Fiscal 2018 Earnings SUPPLEMENTARY INFORMATION June 7, 2018 Consolidated Results ($ in millions, except per share data) FY18 Q4 FY17 Q4 YoY Change Net Sales $1,781
Adjusted EBITDA decreased 1.9 percent to $17.7 million as compared to $18.0 million 1 in the comparable period in fiscal 2017;
 BOB EVANS REPORTS SECOND QUARTER FY 2018 RESULTS Net sales increase 22.3 percent to $117.6 million compared to $96.2 million 1 in the comparable period in fiscal 2017; net sales increased 6.2 percent excluding
CHURCH & DWIGHT CO., INC.
 News Release CHURCH & DWIGHT CO., INC. Contact: Rick Dierker Chief Financial Officer 609-806-1200 CHURCH & DWIGHT REPORTS Q3 RESULTS REPORTED SALES +11.2%, ORGANIC SALES +3.2% Q3 EPS EXCEEDS OUTLOOK EXPECT
MEAD JOHNSON NUTRITION REPORTS FIRST QUARTER 2017 RESULTS
 MEAD JOHNSON NUTRITION REPORTS FIRST QUARTER 2017 RESULTS CHICAGO, Ill., April 27, 2017 - Mead Johnson Nutrition Company (NYSE: MJN) today announced its financial results for the quarter ended March 31,
Kellogg Company Reports First Quarter 2018 Results, Reaffirms Full-Year Earnings Guidance, and Updates Guidance for Increased West Africa Investments
 Exhibit 99.1 Kellogg Company Financial News Release Analyst Contact: John Renwick, CFA (269) 961-9050 Media Contact: Kris Charles (269) 961-3799 Kellogg Company Reports First Quarter 2018 Results, Reaffirms
First Quarter Fiscal 2019 Business Review & Outlook. November 8, 2018
 ` First Quarter Fiscal 2019 Business Review & Outlook November 8, 2018 Safe Harbor Statement Safe Harbor Statement Certain statements contained in this presentation release constitute forward-looking statements
Sanford Bernstein Conference Rockwell Automation
 Sanford Bernstein Conference Rockwell Automation Keith D. Nosbusch Chairman and CEO May 31, 2013 Rev 5058-CO900D Safe Harbor Statement This presentation contains statements (including certain projections
FINANCIAL REVIEW. R. Steve Kinsey. Chief Financial Officer and Chief Administrative Officer
 FINANCIAL REVIEW R. Steve Kinsey Chief Financial Officer and Chief Administrative Officer Information Regarding Forward-Looking Statements Statements contained in this press release that are not historical
Q Earnings. November 1, 2017
 Q4 2017 Earnings November 1, 2017 Forward-Looking Statements and Non-GAAP Measures Forward-Looking Statements This presentation contains certain forward-looking statements within the meaning of the U.S.
Second Quarter 2011 Review. July 28, John V. Faraci Chairman & Chief Executive Officer
 John V. Faraci Chairman & Chief Executive Officer Second Quarter 2011 Review July 28, 2011 Tim S. Nicholls Senior Vice President & Chief Financial Officer Forward-Looking Statements Certain statements
GENERAL MILLS, INC. (Exact name of registrant as specified in its charter)
") UNITED STATES SECURITIES AND EXCHANGE COMMISSION Washington, D.C. 20549 FORM 10-Q (Mark One) QUARTERLY REPORT PURSUANT TO SECTION 13 OR 15(d) OF THE SECURITIES EXCHANGE ACT OF 1934 FOR THE QUARTERLY PERIOD
UNITED STATES SECURITIES AND EXCHANGE COMMISSION Washington, D.C. 20549 FORM 10-Q (Mark One) QUARTERLY REPORT PURSUANT TO SECTION 13 OR 15(d) OF THE SECURITIES EXCHANGE ACT OF 1934 FOR THE QUARTERLY PERIOD
January 28, 2014 Media Contact: Patty Seif WILMINGTON, Del Investor Contact:
 January 28, 2014 Media Contact: Patty Seif WILMINGTON, Del. 302-774-4482 patricia.r.seif@dupont.com Investor Contact: 302-774-4994 DuPont Reports 4Q and Full-Year 2013 Operating EPS of $.59 and $3.88;
Waste Management, Inc. Condensed Consolidated Statements of Operations (In Millions, Except Per Share Amounts) (Unaudited)
 (Unaudited)") Condensed Consolidated Statements of Operations (In Millions, Except Per Share Amounts) Quarters Ended June 30, Operating revenues $ 3,158 $ 2,952 Costs and expenses: Operating 1,996 1,786 Selling, general
Condensed Consolidated Statements of Operations (In Millions, Except Per Share Amounts) Quarters Ended June 30, Operating revenues $ 3,158 $ 2,952 Costs and expenses: Operating 1,996 1,786 Selling, general
Third Quarter 2015 Earnings Call. October 21, 2015
 Third Quarter 2015 Earnings Call October 21, 2015 Forward-Looking Statements This presentation may contain statements, estimates or projections that constitute forward-looking statements as defined under
McCORMICK REPORTS DOUBLE DIGIT THIRD QUARTER SALES AND PROFIT GROWTH AND INCREASES 2018 EARNINGS PER SHARE OUTLOOK
 FOR IMMEDIATE RELEASE McCORMICK REPORTS DOUBLE DIGIT THIRD QUARTER SALES AND PROFIT GROWTH AND INCREASES 2018 EARNINGS PER SHARE OUTLOOK HUNT VALLEY, Md., September 27, 2018 - McCormick & Company, Incorporated
THE J. M. SMUCKER COMPANY
 Richard Smucker Chief Executive Officer THE J. M. SMUCKER TEAM RICHARD SMUCKER Chief Executive Officer MARK SMUCKER President, U.S. Retail Coffee PAUL SMUCKER WAGSTAFF President, U.S. Retail Consumer Foods
Conagra Brands Acquisition of Pinnacle Foods and FY18 Q4 Earnings Presentation
 Conagra Brands Acquisition of Pinnacle Foods and FY18 Q4 Earnings Presentation June 27, 2018 Today s Presenters Brian Kearney Investor Relations Sean Connolly President and Chief Executive Officer Dave
PepsiCo, Inc. Q Earnings Call Reconciliation of GAAP and Non-GAAP Information (unaudited) 1
 1") PepsiCo, Inc. Q3 2017 Earnings Call 1 In discussing financial results and guidance, we refer to core results, core constant currency results, organic results, free cash flow and free cash flow excluding
PepsiCo, Inc. Q3 2017 Earnings Call 1 In discussing financial results and guidance, we refer to core results, core constant currency results, organic results, free cash flow and free cash flow excluding
Fourth Quarter 2018 Results Presentation. January 31, 2019
 Fourth Quarter 2018 Results Presentation January 31, 2019 1 Cautionary Statement on Forward-Looking Statements & Non-GAAP Measures This presentation contains forward-looking statements within the meaning
FOR IMMEDIATE RELEASE Michael J. Monahan (651)
") News Release Ecolab Inc. 370 Wabasha Street North St. Paul, Minnesota 55102 FOR IMMEDIATE RELEASE Michael J. Monahan (651) 250-2809 ECOLAB REPORTED AND ADJUSTED FIRST QUARTER DILUTED EPS $0.77; ADJUSTED
News Release Ecolab Inc. 370 Wabasha Street North St. Paul, Minnesota 55102 FOR IMMEDIATE RELEASE Michael J. Monahan (651) 250-2809 ECOLAB REPORTED AND ADJUSTED FIRST QUARTER DILUTED EPS $0.77; ADJUSTED
Kimberly-Clark Announces Year-End 2018 Results and 2019 Outlook and Introduces K-C Strategy 2022
 Kimberly-Clark Announces Year-End 2018 Results and 2019 Outlook and Introduces K-C Strategy 2022 January 23, 2019 DALLAS, Jan. 23, 2019 /PRNewswire/ -- Kimberly-Clark Corporation (NYSE: KMB) today reported
Kraft Foods Reports Strong Revenue and Income Growth As It Begins Cadbury Integration
 May 6, Kraft Foods Reports Strong Revenue and Income Growth As It Begins Cadbury Integration Net revenues grew 26.0% to $11.3 billion; Combined Organic Net Revenues(1) grew 3.9%, reflecting 3.3 percent
Acquisition of AdvancePierre
 Acquisition of AdvancePierre Investor Presentation April 2017 Forward-Looking Statements This communication contains forward-looking statements, including statements regarding the expected consummation
McCormick & Company, Inc. 4th Quarter 2018 Financial Results and 2019 Outlook
 McCormick & Company, Inc. 4th Quarter 2018 Financial Results and 2019 Outlook January 24 th 2019 The following slides accompany a January 24 th 2019, earnings release conference call. This information
Supplemental Information
 Supplemental Information 2 nd Quarter Fiscal 2018 May 7, 2018 Today s Speakers Tom Hayes President & CEO Stewart Glendinning EVP & CFO 2 Forward-Looking Statements Certain information contained in this
WHITEWAVE FOODS REPORTS RECORD FOURTH QUARTER AND FULL YEAR 2014 RESULTS CONTINUED STRONG GROWTH EXPECTATIONS FOR 2015
 WHITEWAVE FOODS REPORTS RECORD FOURTH QUARTER AND FULL YEAR 2014 RESULTS CONTINUED STRONG GROWTH EXPECTATIONS FOR 2015 Net Sales Increased 34% in Q4 and 35% in FY 2014 Organic Net Sales Increased 11% in
THE KRAFT HEINZ COMPANY REPORTS SECOND QUARTER 2015 RESULTS FOR KRAFT FOODS GROUP, INC. AND H.J. HEINZ HOLDING CORPORATION
 Contacts: Michael Mullen (media) Christopher Jakubik, CFA (investors) Michael.Mullen@KraftHeinzCompany.com ir@kraftheinzcompany.com THE KRAFT HEINZ COMPANY REPORTS SECOND QUARTER 2015 RESULTS FOR KRAFT
October 22, 2013 Media Contact: Patty Seif WILMINGTON, Del Investor Contact:
 October 22, 2013 Media Contact: Patty Seif WILMINGTON, Del. 302-774-4482 patricia.r.seif@dupont.com Investor Contact: 302-774-4994 DuPont Delivers 3Q 2013 Operating Earnings of $.45 per Share Sales Increase
McCormick & Company, Inc.
 McCormick & Company, Inc. Bernstein Strategic Decisions Conference May 30, 2018 FORWARD-LOOKING INFORMATION Certain information contained in this release, including statements concerning expected performance
Helen of Troy Limited Reports Third Quarter Fiscal 2018 Results
 NEWS RELEASE Helen of Troy Limited Reports Third Quarter Fiscal 2018 Results 1/8/2018 Delivers Consolidated Net Sales Revenue Growth of 1.9%; Core Business Growth of 1.3% Reports GAAP Diluted Loss Per
McCormick & Company, Inc. Fourth quarter 2010 financial results and business outlook January 26, 2011
 McCormick & Company, Inc. Fourth quarter 2010 financial results and business outlook January 26, 2011 The following slides accompany a January 26, 2011 presentation to investment analysts. This information