First Half FY13. Results Presentation March 2013
|
|
|
- Richard Douglas
- 5 years ago
- Views:
Transcription


1 First Half FY13 Results Presentation March 2013
2 Summary information Disclaimer This presentation contains summary information of TOX Solutions Limited ( TOX ) and is dated March The information is this presentation does not purport to be complete or comprehensive, and does not purport to summarise all information that an investor should consider when making an investment decision. It should be read in conjunction with TOX s other periodic and continuous disclosure announcements lodged with the Australian Securities Exchange ( ASX ), which are available at Not investment advice This presentation is not a prospectus or a product disclosure statement under the Corporations Act 2001 (Cth) and has not been lodged with the Australian Securities and Investment Commission ( ASIC). The information provided in this presentation is not intended to be relied upon as advice to investors or potential investors and has been prepared without taking into account the recipient s investment objectives, financial circumstances or particular needs. Those individual objectives, circumstances and needs should be considered, with professional advice, when deciding if an investment is appropriate. Financial data All dollar values are in Australian dollars (A$) and financial data is presented within the financial year end of 30 June unless otherwise stated. Risks of investment An investment in TOX shares is subject to investment and other known and unknown risks, some of which are beyond the control of TOX. Tox does not guarantee any particular rate of return or the performance of TOX nor does it guarantee the repayment of capital from TOX or any particular tax treatment. You should have regard to (among other things) the risks outlined in this presentation. Forward looking statements This presentation contains certain forward looking statements. The words anticipate, believe, expect, project, forecast, estimate, likely, intend, should, could, may, target, plan, and other similar expressions are intended to identify forward-looking statements. Indication of, and guidance on, future earnings and financial position and performance are also forward looking statements. Such forward-looking statements are not guarantees of future performance and involve known and unknown risks, uncertainties and other factors, many of which are beyond the control of TOX, that may cause actual results to differ materially from those expressed or implied in such statement. There can be no assurance that actual outcomes will both differ materially from these statements. You should not place undue reliance on forward-looking statements and neither TOX nor any of its directors, employees, servants, advisers or amend assume any obligation to update such information. Not for distribution or release in the United States This presentation has been prepared for publication in Australian and may not be distributed or released on United States. This presentation does not constitute an offer or shares for sale in the United States or in any other jurisdiction in which such an offer would be illegal. 2
3 Agenda Contents 1 Capital Structure 2 Corporate Strategy 3 1H FY13 Results 4 1H FY13 Key Highlights 6 Operations 7 Outlook 3
4 Capital Structure 4 ASX CODE TOX Shares on issue 115,999,858 Unlisted employee options No. of shareholders 2,287,500 3,500 (approx) Market Capitalisation Substantial shareholders $350 m (approx) Australian Foundation Investment Co 8.2% Fisher Funds Management Ltd 7.3% National Australia Bank 6.8% 4

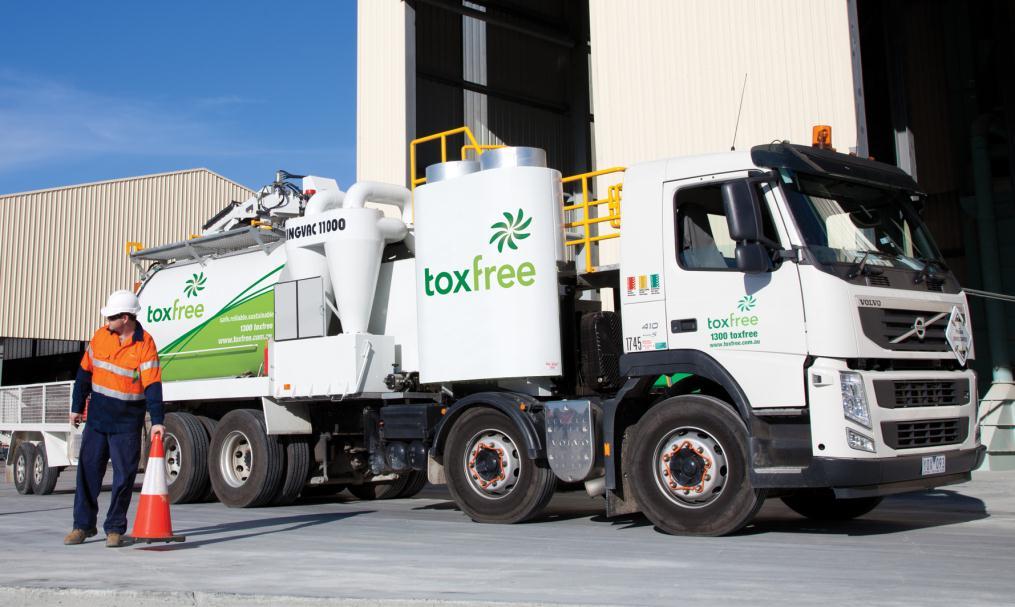
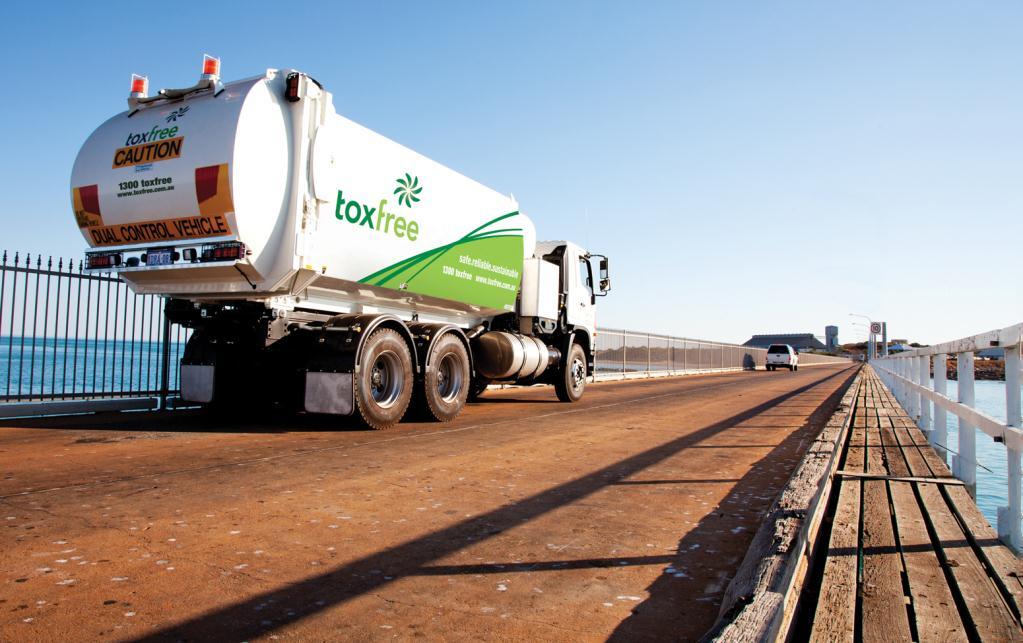
5 Company Profile One of the largest industrial service and waste management businesses in Australia Strategically located facilities Unique licenses and specialist technologies Provide diverse number of industrial and waste services to all market sectors Resource sector and hazardous waste focus Focus on competitive advantage through safety, service delivery, sustainable waste management practices, treatment licenses and technologies Growth - combination of acquisition, green field development, organic and contract growth 5


6 Corporate Strategy 1. Leader in Hazardous Waste Management Nationally Best Technologies Best Licences Best People High barriers to entry Servicing all industry sectors 2. Provide a broad range of Industrial Services to Blue Chip clients under long term contract Mining Oil and Gas Infrastructure Heavy manufacturing Government 3. Provide all waste services in all regional resource hubs of Australia Resource focus - WA, QLD and NT Total waste management services Municipal Commercial Industrial / Construction 6 6

7 Service locations 7
 EBIT up 38% to $17.9M* (FY12: $12.9M) Underlying NPAT up 38% to $10.8M* (FY12: $7.")
 Solid cash flow from operations = $25.")
8 FY13 First Half Financial Highlights Revenue up 43% to $131.6M (FY12: $92.2M) EBITDA up 39% to $28.0M* (FY12: $20.1M) EBIT up 38% to $17.9M* (FY12: $12.9M) Underlying NPAT up 38% to $10.8M* (FY12: $7.9M) Statutory NPAT up 33% to $10.5M (FY12: $7.9M) EPS up 16% to 9.34* cents (FY12: 8.06 cents) Solid cash flow from operations = $25.7M, 93% of EBITDA Net debt to equity = 33% (FY12: 30%) *excludes SSAA write off ($1.59M) and MMS add back ($1.27M) 8


9 FY13 First Half - Key Highlights Strong operational performance from divisions and contracts linked to the resource sector including the Pilbara, South West WA and Surat Basin Expansion of services in central Queensland with acquisition of Absolute Liquid Waste in Toowoomba and Racelog in Roma Award of a contract with Rio Tinto (Pacific Aluminum) for the Boyne Smelter in Gladstone Integration of recent acquisitions continues as planned plan Commenced services to the offshore oil and gas sector in WA Investment in Business Development team with tender pipeline in excess of $150 M tendered and pending 9
10 FY13 First Half Results Group Results 1H FY13 ($ 000) 1H FY12 ($ 000) % Change Revenue 131,623 92,188 43% EBITDA* 28,006 20,136 39% Depreciation (10,124) (7,190) 41% EBIT* 17,882 12,946 38% Gross Interest (2,675) (1,470) 82% Profit before tax* 15,207 11,476 33% Income tax expense (4,426) (3,612) 23% Underlying net profit after tax* 10,781 7,864 37% Statutory net profit after tax 10,463 7,864 33% EPS (cents)* % Number of shares on issue at balance date (million) * exclude SSAA write off ($1.59M) and MMS add back ($1.27M) % 10
11 Group Cash Flow 1H FY13 ($ 000) 1H FY12 ($ 000) % Change Gross operating cash flow 25,655 14,946 72% Net interest paid (2,462) (1,234) 100% Income taxes paid (8,801) (2,718) 224% Net operating cash flows 14,392 10,994 31% Net purchases of PP&E (12,862) (5,487) 134% Payments for acquisitions (4,892) (15,106) (67%) Net investing cash flows (17,754) (21,399) (17%) Net proceeds from borrowings/(repayment of borrowings) Dividends paid Proceeds from the issue of share capital (net of capital raising costs) 7,074 8,314 (15%) (4,613) (2,895) 59% 36 28,375 (100%) Net financing cash flows 2,497 33,794 (93%) Net increase/(decrease) in cash (865) 23,389 (104%) Cash at the beginning of the half year 18,924 14,513 30% Cash at the end of the half year 18,059 37,902 (52%) 11
12 Balance Sheet 31 December 2012 ($ 000) 30 June 2012 ($ 000) % Change Cash 18,059 18,924 (5%) Trade and other receivables 61,497 52,731 17% Inventories (14%) Prepayments 2,284 2,265 1% Tax assets 9,149 8,076 13% Property, plant and equipment 102,445 96,673 6% Intangibles 93,350 93,826 (1%) Total assets 287, ,809 5% Trade and other payables 29,979 28,714 4% Loans and borrowings 73,679 66,605 11% Provisions 4,889 5,221 (6%) Employee benefits 5,803 4,158 40% Tax liabilities 4,314 7,447 (42%) Total liabilities 118, ,145 6% Total equity 168, ,664 5% NET DEBT TO EQUITY 33% 30% 10% 12

13 Cash flow and balance sheet Solid cash flow conversion: 93% of EBITDA Comfortable gearing of 33% net debt to equity Excellent banking relationship and headroom funding available Debtor days at 77 days good quality but some late payments occurred 13
14 FY13 First Half Results - Industrial services $ 000 1H13 1H12 Variance Revenue 35,440 34,168 4% EBIT 4,831 5,773 (16%) EBIT margin 1H13 2H12 1H12 14% 12% 17% Western Australian (Pilbara and South West) and Central Queensland (Surat basin, Mackay and Gladstone) operations and contracts performed strongly Acquired Absolute Liquid Waste Toowoomba (exposure to Surat basin) Focus on expansion of services to offshore oil and gas gaining momentum Victoria met expectation services a diverse range of market sectors Manufacturing and infrastructure sectors were weak Closed Sydney metro branch amalgamated services with St Marys Opened new branch in Hunter Valley in line with strategy Targeted business development strategy in place approx. $40 M of tenders pending 14
15 FY13 First Half Results - Waste services $ 000 1H13 1H12 Variance Revenue 65,381 42,262 55% EBIT 14,788 10,255 44% EBIT margin 1H13 2H12 1H12 23% 23% 24% Pilbara, Kimberley and South West regions all met expectations Toll Energy (Gorgon) contract has continued to perform well Toxfree achieving over 1,200 days without LTI Awarded extension of the existing total waste management contract with Rio Tinto Iron Ore Fortescue Metals Group (FMG) contract performing well Awarded a waste services contract with Rio Tinto (Pacific Aluminum) for the Boyne Smelter in Gladstone Gladstone performing well however APLNG contract still not meeting expectations Targeted business development strategy in place approx. $110 M of tenders pending 15
16 FY13 First Half Results Hazardous waste $ 000 1H13 1H12 Variance Revenue 30,802 15,758 95% EBIT 8,753 5,204 68% EBIT margin 1H13 2H12 1H12 28% 28% 33% Integration of DMX assets and consolidation of services to improve efficiencies continues Streamlining of waste treatment and investigation into new technologies to improve productivity Growth in volumes of hazardous waste from the resource sector during the period Melbourne, Kwinana and Pilbara operations as well as destruction of scheduled wastes performed well Manufacturing sector was weak - reduced volumes of waste in Brisbane and Sydney SSAA production in Brisbane has ceased ($1.59M write off) Commenced operations in Tasmania 16
17 FY13 First Half Results Corporate $ 000 1H13 1H12 Variance Revenue EBIT (10,490) (8,286) 27% Health and Safety a reduction in All Injury Frequency Rate of 8% Appointment of Mr Reg Yarran, as Indigenous Engagement Coordinator and endorsement of Toxfree s Reconciliation Action Plan Corporate overhead includes $2.7M regional overheads and health, safety and environmental resources Increased by 27% in line with a larger company revenue growth of 44% Includes due diligence, integration, systems development, improved and greater insurance cover and legal costs of $1M Corporate costs 8% of revenue down from 9% on pcp 17

18 Outlook Expecting similar market conditions to continue in the second half Major contracts and regional resource hubs expected to perform well Contribution from recent acquisitions of Absolute Waste and Racelog in the second half Continued growth from central Queensland operations expected Newly established Hunter Valley operations Approximately $600 M pa identified market for waste and industrial service contracts - $150 M tendered and pending Systems integration of recently acquired businesses continues Hazardous Waste focus on revenue diversification, operational efficiencies and new technologies 18
 419 310 792 Michael Constable Chief Financial Officer Email: m.constable@toxfree.com.au Tel: +61 3 9541 4700 Mob: + 61 (0) 419 504 003 19")
19 Questions Steve Gostlow Managing Director Tel: Mob: +61 (0) Jason Dixon Executive General Manager - Corporate and Risk j.dixon@toxfree.com.au Tel: Mob: + 61 (0) Michael Constable Chief Financial Officer m.constable@toxfree.com.au Tel: Mob: + 61 (0)


20 THANK YOU
Macquarie Securities Western Australia Forum. 15 October 2014
 Macquarie Securities Western Australia Forum 15 October 2014 Disclaimer Summary information This presentation contains summary information of TOX Solutions Limited ( TOX ) and is dated 15 October 2014.
FIRST HALF FINANCIAL YEAR 2018 RESULTS PRESENTATION
 FIRST HALF FINANCIAL YEAR 2018 RESULTS PRESENTATION 15 February 2018 Steve Gostlow, Managing Director 2 Our corporate ideals are based on safety, reliability and sustainability. 1H18 - Highlights Safety
ASX Small to Mid Caps Conference Singapore and Hong Kong. October 2011
 ASX Small to Mid Caps Conference Singapore and Hong Kong October 2011 Disclaimer Summary information This presentation contains summary information of TOX Solutions Limited ( TOX ) and is dated June 2011.
Strategic Acquisition and Capital Raising
 30 April 2013 Strategic Acquisition and Capital Raising ASX Limited Tox Free Solutions Limited ( Toxfree ) today announces that it has signed a binding asset acquisition agreement under which Toxfree will
For personal use only
 Text UBS Australasia Conference Steve Gostlow, Managing Director 8 November 2016 Agenda Toxfree overview Our strategy Creating Australia's leading waste and industrial services specialist Acquisition of
Annual Report. 30 June 2016 ABN
 Annual Report 30 June 2016 ABN 27 058 596 124 Contents Page 30 June 2016 Contents Page Corporate Directory 3 Strategy 5 Managing Director s Review of Operations 11 Environment, Social and Corporate Governance
Full Year Results Presentation 22 August 2011
 Full Year Results Presentation 22 August 2011 Summary $5.4m trading NPAT profit, a 32% increase on FY10 trading NPAT of $4.1m. $37.7m reported NPAT loss for FY11, including $39.1m one-off impairments and
For personal use only
 Strategic Acquisition to Enhance Hazardous Waste Strategy 15 December 2011 ASX Limited Tox Free Solutions Limited ( Toxfree ) today announces that it has signed a binding acquisition agreement with DoloMatrix
Strategic Expansion Of Toxfree s Technical And Environmental Services In NSW Through The Acquisition Of Worth Recycling. safe.reliable.
 Strategic Expansion Of Toxfree s Technical And Environmental Services In NSW Through The Acquisition Of Worth Recycling safe.reliable.sustainable Disclaimer This document has been prepared and issued by
NRW HOLDINGS LIMITED ANNUAL GENERAL MEETING 28 th November 2012
 NRW HOLDINGS LIMITED 2012 ANNUAL GENERAL MEETING 28 th November 2012 DISCLAIMER AND IMPORTANT NOTICE 2 Information, including forecast financial information in this presentation should not be considered
Half Year Results Presentation 14 February 2012
 Half Year Results Presentation 14 February 2012 Key Highlights 1H12 $8.0m reported profit after tax, up 186% or $5.2m from $2.8m in 1H11. 1H12 $6.9m trading profit after tax, up 36% or $1.8m from $5.1m
Annual General Meeting of Shareholders 2017
 Annual General Meeting of Shareholders 2017 22 November 2017 ASX Limited Chairman s address and Managing Director s presentation Please find following the Chairman s address and Managing Director s presentation
For personal use only. NRW HOLDINGS Macquarie Western Australia Forum 2018
 NRW HOLDINGS Macquarie Western Australia Forum 2018 1 RESULTS OVERVIEW Revenue: $754.3M (1) double the same period last year. EBITDA (2): $93.5M compared to $58.9M in the prior comparative period. Net
ANNUAL REPORT 30 JUNE safe.reliable.sustainable ABN
 ANNUAL REPORT 30 JUNE safe.reliable.sustainable ABN 27 058 596 124 Contents Corporate Directory 1 Review of Operations 2 Directors Report 9 Corporate Governance Statement 20 Financial Report 24 Auditor
FY18 FULL YEAR RESULTS REVENUE UP 18%, NPAT UP 43%, FREE CASH FLOW UP 87% FINAL DIVIDEND UP 27%
 FY18 FULL YEAR RESULTS REVENUE UP 18%, NPAT UP 43%, FREE CASH FLOW UP 87% FINAL DIVIDEND UP 27% All operating divisions organically increased revenue and earnings Strong cash flow and cash conversion Acquisition
Middlemount Coal Contract and Capital Raising Presentation 14 April 2011
 Middlemount Coal Contract and Capital Raising Presentation 14 April 2011 **Not for distribution or release in the United States or to US Persons** Disclaimer and important notice This investor presentation
For the Financial Year Ended 30 June 2013
 Annual Results For the Financial Year Ended 30 June 2013 Record Profit Record Revenue Record Cash Record Year Managing Director & CEO: Paul Dalgleish Chief Financial Officer: Andrew Walsh 22 August 2013
2015 Annual General Meeting. October2015
 2015 Annual General Meeting October2015 FY15 Results Significant restructuring and capital management to support profit recovery in FY16. Statutory EBIT loss of $33.2m Statutory NPAT loss of $36.9m Trading
2014 Half Year Results. 18 February 2014 TOGETHER WE DELIVER.
 2014 Half Year Results 18 February 2014 TOGETHER WE DELIVER. Company Profile Monadelphous Group Limited (ASX:MND) is a S&P/ASX 100 company that provides construction, maintenance and industrial services
A S X A N N O U N C E M E N T
 A S X A N N O U N C E M E N T DATE: 24 February 2016 Attached is the Presentation regarding Pact s Half year Financial Results for the half year ended 31 December 2015. The Presentation will occur at 10am
Strategic Acquisition of Daniels Health Australia and Entitlement Offer
 NOT FOR DISTRIBUTION OR RELEASE IN THE UNITED STATES 26 October 2016 Highlights Strategic Acquisition of Daniels Health Australia and Entitlement Offer Tox Free Solutions Limited ( Toxfree ) today announces
 ASX ANNOUNCEMENT DATE: 22 February 2017 Attached is the Presentation regarding Pact s Half year Financial Results for the half year ended 31 December 2016. The Presentation will occur at 10am (Melbourne
BROKER PRESENTATION JUNE 2017
 PACIFIC ENERGY LIMITED ASX : PEA BROKER PRESENTATION JUNE 2017 Important Notice and Disclaimer This presentation has been prepared by (PEA) for information purposes only. This presentation is not a product
2017 FULL YEAR RESULTS
 2017 FULL YEAR RESULTS ESTABLISHING LEADING POSITIONS IN NEW GROWTH SECTORS Malcolm Bundey Managing Director and CEO Richard Betts Chief Financial Officer 16 August 2017 Pact Group Holdings Ltd ABN: 55
For personal use only
 FY18 Half Year Results For the six months ended 31 December 2017 21 February 2018 Disclaimer Forward looking statements This presentation contains certain forward-looking statements, including with respect
Boom Logistics Limited. Half Year Results Presentation. 25 February Boom Logistics Limited. Half Year Results Presentation.
 Boom Logistics Limited Half Year Results Presentation 25 February 2011 Boom Logistics Limited Half Year Results Presentation 25 February 2011 Summary $5.1m trading NPAT for 1H11, up $4.6m from prior corresponding
For personal use only
 Investor Presentation Half Year Results to 31 December 2016 24 February 2017 PETER CAUGHEY, CEO & MANAGING DIRECTOR 1 Agenda Overview Financials Business conditions, strategy and outlook 2 Overview 1H17
FY 2012 Full Year Results Presentation. August 2012
 FY 2012 Full Year Results Presentation August 2012 FY 2012 Full Year Results Presentation Outline 1.Key Messages 2.Business Strategy 3.Business Performance FY12 4.Financial Review FY12 5.Business Outlook
Annual General Meeting 14 November 2013
 Annual General Meeting 14 November 2013 Disclaimer and additional information This presentation has been prepared by and concerns Calibre Group Limited (Calibre), and consists of these slides and any accompanying
Strategic Acquisition and Capital Raising 21 March 2016
 Not for release in the United States Strategic Acquisition and Capital Raising 21 March 2016 ASX Limited Tox Free Solutions Limited ( Toxfree ) today announces that it has signed a binding agreement under
Half Year Results. For the 6 Months to 31 December Managing Director & CEO: Dr Paul Dalgleish. Chief Financial Officer: Mr Andrew Phipps
 Half Year Results For the 6 Months to 31 December 2013 Managing Director & CEO: Dr Paul Dalgleish Chief Financial Officer: Mr Andrew Phipps 18 February 2014 1 Delivering Returns To Shareholders Revenue
TOX FREE 2010 ANNUAL REPORT. contents
 Annual Report 30 June TOX FREE ANNUAL REPORT contents Corporate Directory 3 Review of Operations 4 Directors Report 9 Corporate Governance Statement 20 Financial Report 25 Independent Auditor s Report
Tabcorp Holdings Limited 2015/16
 Tabcorp Holdings Limited ABN 66 063 780 709 2015/16 Full Year Results Presentation 4 August 2016 Draft version 15 (01-08-13) FY16 overview Statutory results NPAT $169.7m, down 49.3% EPS 20.4 cents per
2017 INVESTOR PRESENTATION SEPTEMBER 2017
 PACIFIC ENERGY LIMITED ASX : PEA 2017 INVESTOR PRESENTATION SEPTEMBER 2017 Important Notice and Disclaimer This presentation has been prepared by (PEA) for information purposes only. This presentation
For personal use only
 A S X A N N O U N C E M E N T DATE: 24 August 2016 FY2016 RESULTS PRESENTATION Attached is the Presentation regarding Pact s Financial Results for the year ended 30 June 2016. The Presentation will occur
30 June 2015 Full Year Results Presentation August 2015
 30 June 2015 Full Year Results Presentation August 2015 FY15 Results Significant restructuring and capital management to support profit recovery in FY16. Statutory EBIT loss of $33.2m Statutory NPAT loss
For personal use only
 Growthpoint Properties Australia (ASX Code: GOZ) Growthpoint Properties Australia Trust ARSN 120 121 002 Growthpoint Properties Australia Limited ABN 33 124 093 901 AFSL 316409 For personal use only www.growthpoint.com.au
MERMAID MARINE AUSTRALIA LTD Morgan Stanley Emerging Companies Conference 14 th June 2012
 MERMAID MARINE AUSTRALIA LTD Morgan Stanley Emerging Companies Conference 14 th June 2012 Disclaimer This document contains general background information about the activities of Mermaid Marine Australia
OVERVIEW. Operating cash flow $447.8 million, EBITDA conversion 92.8% Total revenue 1 $7,394 million, down 0.5%
 OVERVIEW Total revenue 1 $7,394 million, down 0.5% Earnings Before Interest and Tax (EBIT) $276.9 million, down 10.6%. Down 1.5% adjusting for $13 million Capital Metro bid costs and $15 million reduction
Transpacific FY15 Half Year Results Presentation
 Transpacific FY15 Half Year Results Presentation Robert Boucher CEO Brendan Gill CFO 20 February 2015 - Disclaimer Forward looking statements - This presentation contains certain forward-looking statements,
Appendix 4D. Half Year Report to the Australian Stock Exchange
 Appendix 4D to the Australian Stock Exchange Name of Entity Boom Logistics Limited ABN 28 095 466 961 Half Year Ended 31 December 2014 Previous Corresponding Reporting Period 31 December 2013 Results for
Cleanaway Waste Management Limited
 Cleanaway Waste Management Limited Australia s leading total waste management services company FY16 Results Presentation For the twelve months ended 30 June 2016 19 August 2016 Vik Bansal CEO and Managing
Adelaide Brighton Ltd ACN
 Level 1 157 Grenfell Street Adelaide SA 5000 GPO Box 2155 Adelaide SA 5001 Adelaide Brighton Ltd ACN 007 596 018 Telephone (08) 8223 8000 International +618 8223 8000 Facsimile (08) 8215 0030 www.adbri.com.au
For personal use only
 Financial Results Half year ended 31 December 2016 15 February 2017 Agenda Results Overview Galdino Claro, Group CEO Financial Results Fred Knechtel, Group CFO Strategic Progress & Outlook Galdino Claro,
For personal use only ACQUISITION OF BEST TRACTOR PARTS INVESTOR PRESENTATION
 ACQUISITION OF BEST TRACTOR PARTS INVESTOR PRESENTATION 27 August 2012 CLICK TO EDIT MASTER TITLE 2 2 2 IMPORTANT NOTICE AND DISCLAIMER This presentation and these materials (together the Presentation
COLLINS FOODS LIMITED
 COLLINS FOODS LIMITED 2014 FINANCIAL YEAR RESULTS 25 June 2014 FY14 financial overview $m FY13 FY14 WA impact (1) Significant items (2) FY14 Underlying Change versus FY13 Underlying Revenue 423.9 440.6
For personal use only
 Affinity Education Group Full Year 2014 Results 27 February 2015 2014 Highlights FY 2014 Earnings Growth Underlying EBITDA of $17.9m (1) and underlying NPAT of $11.4m (1) Underlying EPS of 8.1 cents (1)
Watpac Limited. 30 June 2018 Full Year Results Presentation. 23 August 2018
 Watpac Limited 30 June 2018 Full Year Results Presentation 23 August 2018 Full year group snapshot Capital Earnings Asset Values Work-in-hand Strategy Strong liquidity maintained Full repayment of equipment
25 February The Manager Market Announcements Australian Securities Exchange Limited 20 Bridge Street SYDNEY NSW 2000.
 Level 1 157 Grenfell Street Adelaide SA 5000 GPO Box 2155 Adelaide SA 5001 Adelaide Brighton Ltd ACN 007 596 018 Telephone (08) 8223 8000 International +618 8223 8000 Facsimile (08) 8215 0030 www.adbri.com.au
Half Year Results Presentation March 2011 Tony Caruso CEO & Managing Director Chris Kneipp Financial Controller
 Mastermyne Group Limited FY2011 Half Year Results Presentation March 2011 Tony Caruso CEO & Managing Director Chris Kneipp Financial Controller Disclaimer The following disclaimer applies to this presentation
For personal use only
 Mantra Group H1FY2015 Results Presentation 26 February 2015 Important notice and disclaimer Important notice and disclaimer This document is a presentation of general background information about the activities
APA investor information and FY14 highlights. September 2014
 APA investor information and FY14 highlights September 2014 About APA Group APA is Australia s largest gas infrastructure business Gas transmission pipelines and storage Owning and operating two thirds
Investor Presentation. ASX: SGM USOTC: SMSMY
 Investor Presentation ASX: SGM USOTC: SMSMY www.simsmm.com Business Highlights Company Global leader in metals and electronics recycling with $4.7 billion in annual sales revenue Operations in 20 countries
FY18 Results Presentation Bravura Solutions Limited. 28 August 2018
 FY18 Results Presentation Bravura Solutions Limited 28 August 2018 Important notice and disclaimer The information contained in this document (including this notice) and discussed at this presentation
FY19 half year results
 FY19 half year results For the six months ended 31 December 2018 14 February 2019 Gordon Ballantyne Managing Director & Chief Executive Officer Michael Sammells Chief Financial Officer 1 1HFY19 returned
Level 7, 200 St Georges Terrace Perth WA 6000 Telephone (08) Facsimile (08)
 Facsimile (08)") 23 August Australian Stock Exchange Limited Exchange Centre Level 4 20 Bridge Street SYDNEY NSW 2000 Dear Sir / Madam Perth Level 7, 200 St Georges Terrace Perth WA 6000 Telephone (08) 9420 1111 Facsimile
23 August Australian Stock Exchange Limited Exchange Centre Level 4 20 Bridge Street SYDNEY NSW 2000 Dear Sir / Madam Perth Level 7, 200 St Georges Terrace Perth WA 6000 Telephone (08) 9420 1111 Facsimile
Prime Financial Group Ltd (ASX: PFG) Full Year 2018 Results Presentation
 Full Year 2018 Results Presentation") Prime Financial Group Ltd (ASX: PFG) Full Year 2018 Results Presentation 29 August 2018 Click here to access accompanying Full Year 2018 Results Presentation podcast Key Points 1. Exposure to favourable
Prime Financial Group Ltd (ASX: PFG) Full Year 2018 Results Presentation 29 August 2018 Click here to access accompanying Full Year 2018 Results Presentation podcast Key Points 1. Exposure to favourable
2011 Interim Results. Keith Gordon, Managing Director & Chief Executive Officer Stephen Gobby, Chief Financial Officer
 2011 Interim Results Keith Gordon, Managing Director & Chief Executive Officer Stephen Gobby, Chief Financial Officer Emeco 2011 Interim Results Overview Financials Strategy & Outlook Questions Appendices
For personal use only
 23 August 2013 Full Year Results June 2013 We attach an Investor Presentation for the FY13 Full Year Results. As previously announced, a results briefing for analysts will be held at 10:30am Sydney time
Tabcorp Holdings Limited. 2014/15 Full Year Results Presentation 13 August 2015
 Tabcorp Holdings Limited ABN 66 063 780 709 2014/15 Full Year Results Presentation 13 August 2015 Draft version 15 (01-08-13) FY15 overview Statutory NPAT $334.5m, up 157.5%, comprising of: NPAT from continuing
ASG GROUP DELIVERS SOLID GROWTH ACROSS ALL KEY FINANCIAL INDICATORS
 ASG GROUP LIMITED ASX ANNOUNCEMENT: H1 RESULTS RELEASE DATE: 28 TH FEBRUARY 2012 ASG GROUP DELIVERS SOLID GROWTH ACROSS ALL KEY FINANCIAL INDICATORS Financial Highlights: Revenue of $76.04 million, an
Interim Financial Report
 Contents Directors report 3 Consolidated Statement of Comprehensive Income 5 Consolidated Statement of Financial Position 6 Consolidated Statement of Changes in Equity 7 Consolidated Statement of Cash
Developing a Diversified Minerals Portfolio Investor Presentation August 2017
 1 Developing a Diversified Minerals Portfolio Investor Presentation August 2017 2 Important Notices This presentation has been prepared by BC Iron Limited ABN 21 120 646 924 ( BCI ). This document contains
AUB GROUP LTD FULL YEAR RESULTS
 AUB GROUP LTD FULL YEAR RESULTS FOR THE PERIOD ENDED 30 JUNE 207 (FY7) 28 TH AUGUST 207 Page - AUB Group Ltd FY7 Results NOTICE SUMMARY INFORMATION This document has been prepared by AUB Group Limited
For personal use only
 Appendix 4D Results for announcement to the market (ACN 104 113 760) This half-year report is provided to the Australian Securities Exchange (ASX) under ASX listing Rule 4.2A.3. Current reporting period:
Presentation Agenda. Half year result to 31 December Integration Update. Boom Logistics Operations. Market Outlook. Summary.
 Page 1 Presentation Agenda Half year result to 31 December 2003 Integration Update Boom Logistics Operations Market Outlook Summary Page 2 Half Year Result to 31 December 2003 Page 3 Financial Result Summary
2018 HALF YEAR RESULTS
 NRW HOLDINGS 2018 HALF YEAR RESULTS Forrestfield-Airport Link, Perth WA 20 FEBRUARY 2018 RESULTS OVERVIEW Revenue of $345.3M (1) up 95% on the same period last year Underlying EBITDA(2) of $40.3M up 38%
MERMAID MARINE AUSTRALIA LTD Half Year Results 31 December 2011 Investor Presentation
 MERMAID MARINE AUSTRALIA LTD Half Year Results 31 December 2011 Investor Presentation Disclaimer This document contains general background information about the activities of Mermaid Marine Australia Limited
PRESENTATION. FY14 Half Year Results. Donald McGurk Managing Director and CEO. Michael Barton Chief Financial Officer
 INVESTOR PRESENTATION FY14 Half Year Results Donald McGurk Managing Director and CEO Michael Barton Chief Financial Officer 3 March 2014 Important Notice and Disclaimer Disclaimer This presentation has
Watpac Limited. 31 December 2016 Half Year Results Presentation. 16 February 2017
 Watpac Limited 31 December 2016 Half Year Results Presentation 16 February 2017 1H FY17 Group financial summary Construction earnings down; Civil & Mining improves and project funding capacity substantially
For personal use only. Tempo Australia Ltd (ASX:TPP) Investor Presentation 27 th July An emerging resource services company
 Investor Presentation 27 th July An emerging resource services company") Tempo Australia Ltd (ASX:TPP) Investor Presentation 27 th July 2012 An emerging resource services company Disclaimer This presentation by Tempo Australia Ltd and the information contained herein should
Tempo Australia Ltd (ASX:TPP) Investor Presentation 27 th July 2012 An emerging resource services company Disclaimer This presentation by Tempo Australia Ltd and the information contained herein should
(RBD) INVESTOR PRESENTATION
 INVESTOR PRESENTATION") RESTAURANT BRANDS NEW ZEALAND LIMITED (RBD) INVESTOR PRESENTATION MAY 2018 RUSSEL CREEDY GROUP CHIEF EXECUTIVE OFFICER GRANT ELLIS GROUP CHIEF FINANCIAL OFFICER 1 OUTLINE Restaurant Brands 101 FY18 Results
RESTAURANT BRANDS NEW ZEALAND LIMITED (RBD) INVESTOR PRESENTATION MAY 2018 RUSSEL CREEDY GROUP CHIEF EXECUTIVE OFFICER GRANT ELLIS GROUP CHIEF FINANCIAL OFFICER 1 OUTLINE Restaurant Brands 101 FY18 Results
For personal use only. F Y R e s u l t s P r e s e n t a t i o n
 F Y 2 0 1 6 R e s u l t s P r e s e n t a t i o n Our Brands 2 Disclaimer The material in this presentation has been prepared by Bapcor Limited ( Bapcor ) ABN 80 153 199 912 and is general background information
For personal use only
 ASX ANNOUNCEMENT 18 February 2016 RCR FINANCIAL RESULTS FOR THE HALF YEAR ENDED 31 DECEMBER 2015: RESULTS FOR ANNOUNCEMENT TO MARKET In accordance with Listing Rule 4.2A, RCR Tomlinson Ltd (ASX: RCR) enclose
FY18 1 ST HALF RESULTS
 26 FEBRUARY 2018 FY18 1 ST HALF RESULTS Chief Executive Officer : Chief Financial Officer : John Croll James Orlando isentia.com AGENDA Overview of H1 FY18 Results Strategic Focus H1 FY18 Financial Performance
COLLINS FOODS LIMITED
 COLLINS FOODS LIMITED FY16 FINANCIAL YEAR RESULTS 28 June 2016 FY16: growth across all key financial metrics $m FY15 Underlying [1] FY16 Statutory FY16 Significant Items [2] FY16 Underlying Change vs FY15
For personal use only 1H17 RESULTS PRESENTATION
 For personal use only 1H17 RESULTS PRESENTATION KEY PERFORMANCE METRICS FOR 1H17 OPERATIONAL FINANCIAL CAPITAL MANAGEMENT 1,408 settlements Up 10% $19.8m 1H17 operating profit after tax Up 7% 24.8% gearing
Interim Financial Report
 Interim Financial Report For Half Year Ended 31 December 2016 Table of Contents Page Results for Announcement to the Market Appendix 4D 2 Directors Report 3 Auditor s Independence Declaration 7 Consolidated
FY17 Results Presentation. Chris Sutherland, Managing Director 24 May 2017
 FY17 Results Presentation Chris Sutherland, Managing Director 24 May 2017 Important notice and disclaimer The information contained in this presentation is for information purposes only and does not constitute
Bell Potter Emerging Leaders Conference
 Bell Potter Emerging Leaders Conference Sydney, 24 October 2017 Leon Allen, Managing Director and CEO Disclaimer This presentation has been prepared by QANTM Intellectual Property Limited ACN 612 441 326
Toxfr ee Annual Report 2015 Annual Report safe.reliable.sustainable
 Annual Report Toxfree s focus is simple; solve customers problems and do it safely. Contents Corporate directory 01 About us 03 Vision and values 04 FY15 Key highlights 05 Chairman s report 07 Managing
FY2018 Half Year Results Presentation 1 March 2018
 FY2018 Half Year Results Presentation Brands AMA Group Overview Vehicle Panel Repair Vehicle Protection Products & Accessories Automotive Electrical & Cable Accessories Automotive Component Remanufacturing
E&A LIMITED. Extraordinary General Meeting. For personal use only. 12 April 2017
 E&A LIMITED Extraordinary General Meeting Extraordinary General Meeting 12 April 2017 Agenda: Chairman & Managing Director s Address 1. Delisting from the Australian Securities Exchange (ASX) 2. Proposed
FY18 RESULTS PRESENTATION
 FY18 RESULTS PRESENTATION KEY PERFORMANCE METRICS FOR FY18 OPERATIONAL FINANCIAL CAPITAL MANAGEMENT STRATEGIC GROWTH 2,257 lots under contract with a value of $616m $49.1m FY18 operating profit after tax
Interim Financial Report for the half year ended 31 December 2014
 Contents Directors report 3 Condensed Consolidated Statement of Comprehensive Income 6 Condensed Consolidated Statement of Financial Position 7 Condensed Consolidated Statement of Changes in Equity 8 Condensed
For personal use only
 ASX ANNOUNCEMENT 11 February 2015 Financial summary Results for the six months ended 31 December 2014 1H15 % change Sales revenue 1 ($m) 1,001.9 906.3 10.6% EBITDA 2 ($m) 49.3 43.9 12.3% EBITDA 2 margin
Credit Suisse Annual Asian Investment Conference
 Adelaide Brighton Limited Credit Suisse Annual Asian Investment Conference Hong Kong, 27 30 March 2017 Martin Brydon Chief Executive Officer and Managing Director Adelaide Brighton Limited Overview of
13 APRIL WestConnex M4 East, New South Wales. Refer to ASX/Media Release for further information
 ANALYST AND INVESTOR PRESENTATION 1Q17 RESULTS Marcelino Fernández Verdes, Executive Chairman Adolfo Valderas, Chief Executive Officer Angel Muriel, Chief Financial Officer WestConnex M4 East, New South
For personal use only
 NRW Holdings Limited (ASX: NWH) ABN 95 118 300 217 For the Half-Year Ended 31 December 2014 220142013 1 APPENDIX 4D RESULTS FOR ANNOUNCEMENT TO THE MARKET For the Half-Year Ended 31 December 2014 NRW Holdings
Calibre Group Half Year Results MARCH 2018
 Calibre Group Half Year Results MARCH 2018 Contents Calibre Overview Financial Review Operational Review Summary 2 Calibre Overview Calibre is a trusted partner within the resources, urban, technologies,
NATIONAL STORAGE REIT (NSR) 2018 ANNUAL GENERAL MEETING ADDRESSES
 2018 ANNUAL GENERAL MEETING ADDRESSES") P 1800 683 290 A Level 23, 71 Eagle Street, Brisbane QLD 4000 P GPO Box 3239 QLD 4001 E invest@nationalstorage.com.au nationalstorage.com.au 14 November 2018 ASX Market Announcements Office ASX Limited
P 1800 683 290 A Level 23, 71 Eagle Street, Brisbane QLD 4000 P GPO Box 3239 QLD 4001 E invest@nationalstorage.com.au nationalstorage.com.au 14 November 2018 ASX Market Announcements Office ASX Limited
COLLINS FOODS LIMITED. MORGANS ANNUAL QLD CONFERENCE 8 October 2014
 COLLINS FOODS LIMITED MORGANS ANNUAL QLD CONFERENCE 8 October 2014 Page 1 Chief Executive Officer Graham Maxwell Collins Foods Limited 170 KFC restaurants across Queensland, Western Australia and Northern
17 April Genex Power s Kidston Solar Farm, Queensland, UGL. Refer to ASX/Media Release for further information
 ANALYST AND INVESTOR PRESENTATION 1Q RESULTS 2018 Marcelino Fernández Verdes, Executive Chairman Michael Wright, Chief Executive Officer Stefan Camphausen, Chief Financial Officer Genex Power s Kidston
NOT FOR DISTRIBUTION OR RELEASE IN THE UNITED STATES BANK OF QUEENSLAND LIMITED ABN
 Retail Entitlement Offer Details of a 3 for 26 renounceable pro rata Entitlement Offer of Bank of Queensland ordinary shares ( New Shares ) at an offer price of $10.75 per New Share. Retail Entitlement
Western Australia Iron Ore Overview. Michael Bailey General Manager, Port Operations
 Western Australia Iron Ore Overview Michael Bailey General Manager, Port Operations Disclaimer Forward looking statements This release contains forward looking statements, including statements regarding:
For personal use only. FY2017 H1 Results February 2017
 For personal use only FY2017 H1 Results February 2017 The half year in review Broader automotive market supported by record new vehicle sales in Australia and New Zealand Strong Automotive earnings growth
APA s Infrastructure connecting Australia s energy future.
 APA s Infrastructure connecting Australia s energy future. Presentation by Mick McCormack, Managing Director & CEO To the Macquarie Australia Conference 02 May 2017 disclaimer This presentation has been
For personal use only
 Affinity Education Group (ASX:AFJ) Morgans Conference 10 October 2014 Disclaimer This presentation contains general information in summary form which is current as at 10 October 2014. It presents financial
ANNUAL GENER AL MEETING 2016
 ANNUAL GENER AL MEETING 2016 16 November 2016 Pact Group Holdings Ltd ABN: 55 145 989 644 R APHAEL GEMINDER CHAIRMAN FINANCIAL HIGHLIGHTS 2016 Sales revenue $1,381.3M NPAT (before sigificant items) 1 Total
Helping you move the Earth TM. 1H07 Results Presentation. 22 February 2007
 Helping you move the Earth TM 1H07 Results Presentation 22 February 2007 1H07 Results Analyst Presentation V2 05060D937-803573d1 Disclaimer and Important notice This presentation may contain forward looking