CMP: INR270 TP: INR316(+17%) Buy
|
|
|
- Asher Banks
- 5 years ago
- Views:
Transcription
 1,552 M.Cap.(INRb)/(USDb) 418.9 / 6.2 52-Week Range (INR) 274 / 185 1, 6, 12 Rel. Per (%) 3/27/13 Avg Val, INRm 566 Free float (%) 49.")
 8.3 11.1 17.2 RoCE (%) 8.9 11.8 17.6 Payout (%) 49.4 24.3 14.8 Div. Yield 4.0 2.7 2.4 EV/EBITDA (x) 25.2 20.6 13.")
 2QCY16 revenues of INR25.4b (+2% YoY) missed estimates of INR27.9b, led by muted volume growth (5.88mt, -3.2% YoY). Dismal volumes were offset by an improvement in realizations (+8.")
, representing a 15-quarter high, mainly led by strong realizations of INR4,412/ton (+7.2% QoQ, +3.7% YoY).")
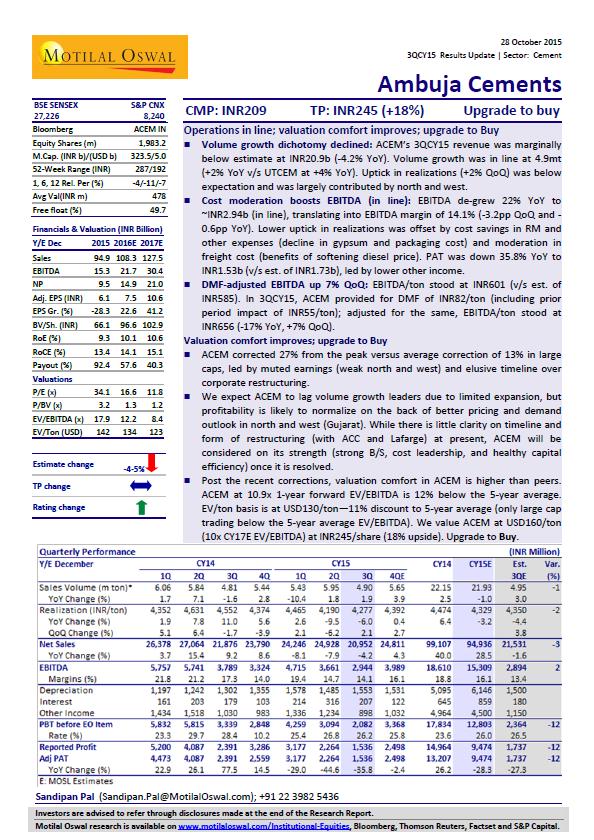
1 BSE SENSEX S&P CNX 27,977 8,591 Motilal Oswal values your support in the Asiamoney Brokers Poll 2016 for India Research, Sales and Trading team. We request your ballot. Bloomberg ACEM IN Equity Shares (m) 1,552 M.Cap.(INRb)/(USDb) / Week Range (INR) 274 / 185 1, 6, 12 Rel. Per (%) 3/27/13 Avg Val, INRm 566 Free float (%) 49.7 Financials & Valuations (INR b) Y/E Dec E 2017E Net Sales EBITDA NP EPS (INR) EPS Gr. (%) BV/Sh. (INR) RoE (%) RoCE (%) Payout (%) Div. Yield EV/EBITDA (x) EV/Ton (USD) Estimate change TP change Rating change 26 July QCY16 Results Update Sector: Cement CMP: INR270 TP: INR316(+17%) Buy Strong realizations help boost profitability to 15-quarter high Volumes disappointing: (ACEM) 2QCY16 revenues of INR25.4b (+2% YoY) missed estimates of INR27.9b, led by muted volume growth (5.88mt, -3.2% YoY). Dismal volumes were offset by an improvement in realizations (+8.9% QoQ, +5.3% YoY). Profitability at 15-quarter high: EBITDA grew 59% YoY to INR5.8b, translating into margin of 22.9% (+5.4pp QoQ, +8.2pp YoY). EBITDA/ton stood at INR1,009 (+INR300 QoQ, +INR394 YoY), representing a 15-quarter high, mainly led by strong realizations of INR4,412/ton (+7.2% QoQ, +3.7% YoY). North region performance was the best with a 12% YoY improvement in pricing. PAT stood at INR4b (in line with estimates, +76.5% YoY). ACEM s profitability should witness a meaningful improvement in the coming quarters if its favorable cost structure, growth momentum and the prevailing spot cement prices remain intact. Cost structure improved: Significant savings in unitary cost (-5% YoY, +2% QoQ) driven by a sharp fall in energy cost (-9% YoY) and freight cost, coupled with strong realizations, boosted profitability. Pet coke mix increased to 60% (v/s 45% in 2QCY15). ACC and ACEM synergy: The deal has been cleared by the Cabinet Committee on Economic Affairs. Although this is not factored into our estimates, it is factored in dilution of shares, which is compensated by taking ACC s value in our SOTP. Valuation and views: While ACEM s growth potential remains muted due to its limited expansion, we believe better utilization headroom in faster-growing regions (viz. north and east) should offer some resilience. ACEMs core strengths are intact, and have room to fortify further once the restructuring overhang eases. Its balance sheet strength with INR50b of net cash and annual OCF visibility of INR20-30b over CY16-17 offer comfort on long-term scalability. We increase our EPS estimates for CY16E/CY17E by 2%/7%. The stock trades at 15x CY17E EV/EBITDA and USD187/ton. Maintain Buy with a TP of INR316/share (17% upside). Jinesh Gandhi (Jinesh@MotilalOswal.com); Aashumi Mehta (Aashumi.Mehta@MotilalOswal.com); Investors are advised to refer through important disclosures made at the last page of the Research Report. Motilal Oswal research is available on Bloomberg, Thomson Reuters, Factset and S&P Capital.
2 Exhibit 1: Volume growth low; Realizations stable Volume (MT) Net Realization (INR/ton) 4,257 4,556 4,521 4,293 4,271 4,297 4,099 4,142 4,352 4,631 4,552 4,376 4,465 4,190 4,277 4,300 4,053 4, Exhibit 2: Margins dipped on higher cost EBITDA (INR m) EBITDA Margin (%) QCY12 2QCY12 3QCY12 4QCY12 1QCY13 2QCY13 3QCY13 4QCY13 1QCY14 2QCY14 3QCY14 4QCY14 1QCY15 2QCY15 3QCY15 4QCY15 1QCY16 2QCY16 1QCY12 2QCY12 3QCY12 4QCY12 1QCY13 2QCY13 3QCY13 4QCY13 1QCY14 2QCY14 3QCY14 4QCY14 1QCY15 2QCY15 3QCY15 4QCY15 1QCY16 2QCY16 7,470 7,223 5,673 4,282 5,118 4,920 2,533 2,890 5,757 5,741 3,789 3,324 4,715 3,661 2,944 3,042 4,235 5,813 Exhibit 3: EBITDA at INR1009/ton, driven by strong realizations EBITDA (INR/Ton) 1QCY12 2QCY12 3QCY12 4QCY12 1QCY13 2QCY13 3QCY13 4QCY13 1QCY14 2QCY14 3QCY14 4QCY14 1QCY15 2QCY15 3QCY15 4QCY15 1QCY16 2QCY16 1,208 1,283 1, ,009 Exhibit 4: Income statement (INR/ton) 2QCY16 2QCY15 YoY (%) 1QCY16 QoQ (%) Net Realization 4,412 4, , Raw Material Staff Cost Power & Fuel Freight 1,147 1, , Other exp Total Cost 3,403 3, , EBITDA 1, Exhibit 5: Revised estimates Source: MOSL, Company (INR b) CY16E CY17E Rev Old Chg (%) Rev Old Chg (%) Volumes (MT) Realizations (INR/Ton) 4,286 4, ,686 4, Net Sales EBITDA (INR/Ton) Net Profit EPS (INR) Source: MOSL 26 July
3 Exhibit 6: Cost Analysis (INR/ton) Cost Analysis (INR/ton) 1QCY15 2QCY15 3QCY15 4QCY15 1QCY16 2QCY16 Realization 4,465 4,190 4,277 4,300 4,053 4,412 Raw Material Staff Cost Power & fuel Freight 1,143 1,202 1,131 1,132 1,168 1,147 Other expenditure , Total Cost per ton 3,597 3,574 3,676 3,744 3,343 3,403 EBITDA ,009 Source: MOSL, Company Valuation discount offers comfort; Buy Factoring in sub-normal volume growth, but profitability to normalize: We expect ACEM to underperform growth volume due to limited expansion. However, better utilization headroom in faster growing regions viz. north and east (60-70% which is lower than regional utilizations) should offer resilience. Volume underperformance (v/s UTCEM) has reduced in recent quarters with better growth in key operating region viz. north, east and Gujarat. We factor in for 6.5% CAGR in volume over FY16-18 v/s 8.5% for UTCEM. Due to better demand outlook, we expect north and Gujarat to post stronger realization growth, aiding normalization of profitability for ACEM with peers Core strength intact, could emerge stronger once overhang eases: ACEM has historically generated superior RoCE due to better capital discipline (lower plough back) and top quartile EBITDA/ton. Cost efficiency is still one of the best among peers. ACEM s balance sheet strength with ~INR50b of net cash (net cash even after INR35b payment for restructuring) and annual OCF visibility of INR20-30b over CY16-17, offer comforts on future scalability. Group consolidation will lead synergy benefits (via cement-clinker swaps, market segmentations, marketing team alliance, supply chain management and fixed cost rationalizations). Management earlier guided for INR7-9b synergies between ACC-ACEM (not factored in estimates). Maintain Buy: Post recent corrections, valuation comfort in ACEM are higher compared to peers. ACEM trades at 20.6x/13.6x CY16/17E EV/EBITDA. We value ACEM at USD187/ton (15x CY17E EV/EBITDA) at INR316/share (17% upside). Maintain buy. 26 July
4 Story in charts Exhibit 7: Growth to underperform due to limited expansion Capacity (MT) Dispatches (MT) Cap. Util (%) CY08 CY09 CY10 CY11 CY12 CY13 CY14 CY15 CY16E CY17E Exhibit 9: EBITDA/ton has upside potential from synergies Exhibit 8: Expect better realizations in north-west to benefit EBITDA (INR b) Margin (%) CY08 CY09 CY10 CY11 CY12 CY13 CY14 CY15E CY16E CY17E Exhibit 10: Trend in EPS EBITDA/ton ,112 1, , ,090 EPS (INR) EPS Growth (%) CY02 CY03 CY04 CY05 CY06 CY07 CY08 CY09 CY10 CY11 CY12 CY13 CY14 CY15 CY16E CY17E CY08 CY09 CY10 CY11 CY12 CY13 CY14 CY15E CY16E CY17E Exhibit 11: High mix of north and west West 38% South 2% Central Exports 2% 3% East 18% North 37% Exhibit 12: B/S strength to address cash outgo on merger CFO (INR m) CAPEX (INR m) FCF (INR m) CY08 CY09 CY10 CY11 CY12 CY13 CY14E CY15 CY16ECY17E 26 July
5 Financials and Valuations Income Statement (INR Million) Y/E December E 2017E Net Sales 85,043 96,749 90,868 99,107 93,683 97, ,542 Change (%) Total Expenditure 65,656 72,074 75,386 80,497 79,321 79,391 87,895 % of Sales EBITDA 19,387 24,675 15,482 18,610 14,362 18,519 26,647 Change (%) Margin (%) Depreciation 4,452 5,373 4,901 5,095 6,257 6,170 6,140 EBIT 14,935 19,302 10,581 13,515 8,105 12,349 20,507 Interest Other Income - Rec. 2,978 4,042 4,349 4,964 4,535 5,000 7,500 PBT before EO Exp. 17,387 22,588 14,280 17,834 11,722 16,586 27,157 EO Exp/(Inc) 358 3,570-3,269-1, PBT after EO Exp. 17,029 19,018 17,549 19,591 11,165 16,797 27,157 Current Tax 3,613 6,048 4,603 4,627 3,090 4,603 6,789 Deferred Tax 1, Tax Rate (%) Reported PAT 12,289 12,971 12,946 14,964 8,076 12,194 19,825 PAT Adj for EO Items 12,547 15,435 10,464 13,207 8,478 12,041 19,825 Change (%) Balance Sheet (INR Million) Y/E December E 2017E Equity Share Capital 3,069 3,084 3,092 3,100 3,104 3,971 3,971 Total Reserves 77,626 84,966 91,764 97,934 99, , ,942 Net Worth 80,694 88,051 94, , , , ,913 Def. Liabilities 6,436 5,483 5,643 5,890 5,649 5,649 6,192 Total Loans Capital Employed 87,597 93, , , , , ,605 Gross Block 97, , , , , , ,050 Less: Accum. Depn. 35,158 43,213 47,637 52,732 58,989 65,158 71,298 Net Fixed Assets 61,865 58,624 60,625 64,173 59,062 56,392 52,752 Capital WIP 4,868 5,201 6,949 5,000 6,000 7,500 10,000 Investments 8,643 16,558 17,885 21,727 22, , ,106 Curr. Assets 40,043 43,864 44,187 48,108 54,297 44,857 63,542 Inventory 9,250 9,839 9,339 8,884 8,955 9,389 9,414 Debtors 2,409 2,134 2,315 2,280 2,864 2,280 2,667 Cash & Bank Bal 20,691 22,537 23,411 24,581 28,484 21,922 37,966 Others 7,694 9,353 9,122 12,364 13,995 11,266 13,494 Curr. Liability & Prov. 27,822 30,318 28,856 31,894 32,675 31,647 35,794 Creditors 15,909 15,904 17,845 19,806 21,477 19,576 21,673 Provisions 11,913 14,414 11,011 12,088 11,197 12,071 14,122 Net Current Assets 12,221 13,545 15,332 16,215 21,622 13,210 27,747 Appl. of Funds 87,597 93, , , , , ,605 E: MOSL Estimates 26 July
6 Financials and Valuations Ratios Y/E December E 2017E Basic (INR) EPS Cash EPS BV/Share DPS Payout (%) Valuation (x) P/E Cash P/E P/BV EV/Sales EV/EBITDA EV/Ton (Cap) - US$ Dividend Yield (%) Return Ratios (%) RoE RoCE RoIC Working Capital Ratios Asset Turnover (x) Debtor (Days) Inventory (Days) Work Cap (Days) Leverage Ratio (x) Current Ratio Debt/Equity Cash Flow Statement (INR Million) Y/E December E 2017E Op. Profit before Tax 20,260 25,393 15,482 18,610 14,362 18,519 26,647 Interest/Div. Recd. 1,555 2,340 4,349 4,964 4,535 5,000 7,500 Direct Taxes Paid -4,722-6,399-4,603-4,627-3,090-4,603-7,333 (Inc)/Dec in WC ,505 1,850 1,507 CF from Operations 16,890 20,917 14,316 19,234 14,303 20,766 28,321 EO Income 0 0 3,269 1, CF from Op. incl EO Exp 16,890 20,917 17,585 20,991 13,746 20,976 28,321 (inc)/dec in FA -6,233-6,870-8,650-6,694-2,145-5,000-5,000 Free Cash Flow 10,657 14,047 8,935 14,297 11,600 15,976 23,321 (Pur)/Sale of Invest. -1,700-7,157-1,326-3, ,845 0 CF from Investments -7,933-14,027-9,976-10,537-2, ,845-5,000 Issue of Shares ,412 82,779 0 (Inc)/Dec in Debt Interest Paid Dividend Paid -5,697-4,964-6,462-9,241-3,629-6,984-6,970 CF from Fin. Activity -4,748-5,044-6,735-9,284-7,164 75,306-7,277 Inc/Dec of Cash 4,209 1, ,170 3,903-6,562 16,044 Add: Beginning Bal. 16,482 20,691 22,537 23,411 24,581 28,484 21,922 Closing Balance 20,690 22,537 23,411 24,581 28,484 21,922 37,966 E: MOSL Estimates 26 July

7 Corporate profile Company description Ambuja Cement, a part of the Holcim group, is the third largest cement company in India with total capacity of 28.8mt under its control. It is one of the lowest cost producers of cement, with focus on structurally sound markets of North, West and East. It is also the largest exporter of cement from India. Exhibit 1: Sensex rebased Source: MOSL/Bloomberg Exhibit 2: Shareholding pattern (%) Jun-16 Mar-16 Jun-15 Promoter DII FII Others Note: FII Includes depository receipts Source: Capitaline Exhibit 3: Top holders Holder Name % Holding Aberdeen Global Indian Equity Limited 2.5 Europacific Growth Fund 1.9 Source: Capitaline Exhibit 4: Top management Name Designation Exhibit 5: Directors Name Name N S Sekhsaria Chairman Haigreve Khaitan Nasser Munjee Bernard Terver Vice Chairman Omkar Goswami Rajendra P Chitale Suresh Neotia Ajay Kapur Rajiv Gandhi Chairman Emeritus Managing Director & CEO Company Secretary Shailesh Haribhakti Christof Haessig Usha Sangwan B L Taparia Eric Olsen Source: Capitaline *Independent Exhibit 6: Auditors Name P M Nanabhoy & Co S R B C & Co LLP Type Cost Auditor Statutory Exhibit 7: MOSL forecast v/s consensus EPS MOSL Consensus (INR) forecast forecast Variation (%) CY CY Source: Bloomberg Source: Capitaline 26 July


8 PRODUCT GALLERY Our recent reports on Ambuja Cement Our recent reports on Cement sector Our recent reports on other Cement companies
9 N O T E S 26 July
.")
 is not")

10 Disclosures This document has been prepared by Motilal Oswal Securities Limited (hereinafter referred to as Most) to provide information about the company (ies) and/sector(s), if any, covered in the report and may be distributed by it and/or its affiliated company(ies). This report is for personal information of the selected recipient/s and does not construe to be any investment, legal or taxation advice to you. This research report does not constitute an offer, invitation or inducement to invest in securities or other investments and Motilal Oswal Securities Limited (hereinafter referred as MOSt) is not soliciting any action based upon it. This report is not for public distribution and has been furnished to you solely for your general information and should not be reproduced or redistributed to any other person in any form. This report does not constitute a personal recommendation or take into account the particular investment objectives, financial situations, or needs of individual clients. Before acting on any advice or recommendation in this material, investors should consider whether it is suitable for their particular circumstances and, if necessary, seek professional advice. The price and value of the investments referred to in this material and the income from them may go down as well as up, and investors may realize losses on any investments. Past performance is not a guide for future performance, future returns are not guaranteed and a loss of original capital may occur. MOSt and its affiliates are a full-service, integrated investment banking, investment management, brokerage and financing group. We and our affiliates have investment banking and other business relationships with a some companies covered by our Research Department. Our research professionals may provide input into our investment banking and other business selection processes. Investors should assume that MOSt and/or its affiliates are seeking or will seek investment banking or other business from the company or companies that are the subject of this material and that the research professionals who were involved in preparing this material may educate investors on investments in such business. The research professionals responsible for the preparation of this document may interact with trading desk personnel, sales personnel and other parties for the purpose of gathering, applying and interpreting information. Our research professionals are paid on twin parameters of performance & profitability of MOSt. MOSt generally prohibits its analysts, persons reporting to analysts, and members of their households from maintaining a financial interest in the securities or derivatives of any companies that the analysts cover. Additionally, MOSt generally prohibits its analysts and persons reporting to analysts from serving as an officer, director, or advisory board member of any companies that the analysts cover. Our salespeople, traders, and other professionals or affiliates may provide oral or written market commentary or trading strategies to our clients that reflect opinions that are contrary to the opinions expressed herein, and our proprietary trading and investing businesses may make investment decisions that are inconsistent with the recommendations expressed herein. In reviewing these materials, you should be aware that any or all of the foregoing among other things, may give rise to real or potential conflicts of interest. MOSt and its affiliated company(ies), their directors and employees and their relatives may; (a) from time to time, have a long or short position in, act as principal in, and buy or sell the securities or derivatives thereof of companies mentioned herein. (b) be engaged in any other transaction involving such securities and earn brokerage or other compensation or act as a market maker in the financial instruments of the company(ies) discussed herein or act as an advisor or lender/borrower to such company(ies) or may have any other potential conflict of interests with respect to any recommendation and other related information and opinions.; however the same shall have no bearing whatsoever on the specific recommendations made by the analyst(s), as the recommendations made by the analyst(s) are completely independent of the views of the affiliates of MOSt even though there might exist an inherent conflict of interest in some of the stocks mentioned in the research report Reports based on technical and derivative analysis center on studying charts company's price movement, outstanding positions and trading volume, as opposed to focusing on a company's fundamentals and, as such, may not match with a report on a company's fundamental analysis. In addition MOST has different business segments / Divisions with independent research separated by Chinese walls catering to different set of customers having various objectives, risk profiles, investment horizon, etc, and therefore may at times have different contrary views on stocks sectors and markets. Unauthorized disclosure, use, dissemination or copying (either whole or partial) of this information, is prohibited. The person accessing this information specifically agrees to exempt MOSt or any of its affiliates or employees from, any and all responsibility/liability arising from such misuse and agrees not to hold MOSt or any of its affiliates or employees responsible for any such misuse and further agrees to hold MOSt or any of its affiliates or employees free and harmless from all losses, costs, damages, expenses that may be suffered by the person accessing this information due to any errors and delays. The information contained herein is based on publicly available data or other sources believed to be reliable. Any statements contained in this report attributed to a third party represent MOSt s interpretation of the data, information and/or opinions provided by that third party either publicly or through a subscription service, and such use and interpretation have not been reviewed by the third party. This Report is not intended to be a complete statement or summary of the securities, markets or developments referred to in the document. While we would endeavor to update the information herein on reasonable basis, MOSt and/or its affiliates are under no obligation to update the information. Also there may be regulatory, compliance, or other reasons that may prevent MOSt and/or its affiliates from doing so. MOSt or any of its affiliates or employees shall not be in any way responsible and liable for any loss or damage that may arise to any person from any inadvertent error in the information contained in this report. MOSt or any of its affiliates or employees do not provide, at any time, any express or implied warranty of any kind, regarding any matter pertaining to this report, including without limitation the implied warranties of merchantability, fitness for a particular purpose, and non-infringement. The recipients of this report should rely on their own investigations. This report is intended for distribution to institutional investors. Recipients who are not institutional investors should seek advice of their independent financial advisor prior to taking any investment decision based on this report or for any necessary explanation of its contents. Most and it s associates may have managed or co-managed public offering of securities, may have received compensation for investment banking or merchant banking or brokerage services, may have received any compensation for products or services other than investment banking or merchant banking or brokerage services from the subject company in the past 12 months. Most and it s associates have not received any compensation or other benefits from the subject company or third party in connection with the research report. Subject Company may have been a client of Most or its associates during twelve months preceding the date of distribution of the research report MOSt and/or its affiliates and/or employees may have interests/positions, financial or otherwise of over 1 % at the end of the month immediately preceding the date of publication of the research in the securities mentioned in this report. To enhance transparency, MOSt has incorporated a Disclosure of Interest Statement in this document. This should, however, not be treated as endorsement of the views expressed in the report. Motilal Oswal Securities Limited is registered as a Research Analyst under SEBI (Research Analyst) Regulations, SEBI Reg. No. INH Pending Regulatory inspections against Motilal Oswal Securities Limited: SEBI pursuant to a complaint from client Shri C.R. Mohanraj alleging unauthorized trading, issued a letter dated 29th April 2014 to MOSL notifying appointment of an Adjudicating Officer as per SEBI regulations to hold inquiry and adjudge violation of SEBI Regulations; MOSL replied to the Show Cause Notice whereby SEBI granted us an opportunity of Inspection of Documents. Since all the documents requested by us were not covered we have requested to SEBI vide our letter dated June 23, 2015 to provide pending list of documents for inspection. List of associate companies of Motilal Oswal Securities Limited -Click here to access detailed report Analyst Certification The views expressed in this research report accurately reflect the personal views of the analyst(s) about the subject securities or issues, and no part of the compensation of the research analyst(s) was, is, or will be directly or indirectly related to the specific recommendations and views expressed by research analyst(s) in this report. The research analysts, strategists, or research associates principally responsible for preparation of MOSt research receive compensation based upon various factors, including quality of research, investor client feedback, stock picking, competitive factors and firm revenues Disclosure of Interest Statement AMBUJA CEMENTS Analyst ownership of the stock No Served as an officer, director or employee - No A graph of daily closing prices of securities is available at and Regional Disclosures (outside India) This report is not directed or intended for distribution to or use by any person or entity resident in a state, country or any jurisdiction, where such distribution, publication, availability or use would be contrary to law, regulation or which would subject MOSt & its group companies to registration or licensing requirements within such jurisdictions. For Hong Kong: This report is distributed in Hong Kong by Motilal Oswal capital Markets (Hong Kong) Private Limited, a licensed corporation (CE AYY-301) licensed and regulated by the Hong Kong Securities and Futures Commission (SFC) pursuant to the Securities and Futures Ordinance (Chapter 571 of the Laws of Hong Kong) SFO. As per SEBI (Research Analyst Regulations) 2014 Motilal Oswal Securities (SEBI Reg No. INH ) has an agreement with Motilal Oswal capital Markets (Hong Kong) Private Limited for distribution of research report in Kong Kong. This report is intended for distribution only to Professional Investors as defined in Part I of Schedule 1 to SFO. Any investment or investment activity to which this document relates is only available to professional investor and will be engaged only with professional investors. Nothing here is an offer or solicitation of these securities, products and services in any jurisdiction where their offer or sale is not qualified or exempt from registration. The Indian Analyst(s) who compile this report is/are not located in Hong Kong & are not conducting Research Analysis in Hong Kong. For U.S. Motilal Oswal Securities Limited (MOSL) is not a registered broker - dealer under the U.S. Securities Exchange Act of 1934, as amended (the"1934 act") and under applicable state laws in the United States. In addition MOSL is not a registered investment adviser under the U.S. Investment Advisers Act of 1940, as amended (the "Advisers Act" and together with the 1934 Act, the "Acts), and under applicable state laws in the United States. Accordingly, in the absence of specific exemption under the Acts, any brokerage and investment services provided by MOSL, including the products and services described herein are not available to or intended for U.S. persons. This report is intended for distribution only to "Major Institutional Investors" as defined by Rule 15a-6(b)(4) of the Exchange Act and interpretations thereof by SEC (henceforth referred to as "major institutional investors"). This document must not be acted on or relied on by persons who are not major institutional investors. Any investment or investment activity to which this document relates is only available to major institutional investors and will be engaged in only with major institutional investors. In reliance on the exemption from registration provided by Rule 15a-6 of the U.S. Securities Exchange Act of 1934, as amended (the "Exchange Act") and interpretations thereof by the U.S. Securities and Exchange Commission ("SEC") in order to conduct business with Institutional Investors based in the U.S., MOSL has entered into a chaperoning agreement with a U.S. registered broker-dealer, Motilal Oswal Securities International Private Limited. ("MOSIPL"). Any business interaction pursuant to this report will have to be executed within the provisions of this chaperoning agreement. The Research Analysts contributing to the report may not be registered /qualified as research analyst with FINRA. Such research analyst may not be associated persons of the U.S. registered broker-dealer, MOSIPL, and therefore, may not be subject to NASD rule 2711 and NYSE Rule 472 restrictions on communication with a subject company, public appearances and trading securities held by a research analyst account. For Singapore Motilal Oswal Capital Markets Singapore Pte Limited is acting as an exempt financial advisor under section 23(1)(f) of the Financial Advisers Act(FAA) read with regulation 17(1)(d) of the Financial Advisors Regulations and is a subsidiary of Motilal Oswal Securities Limited in India. This research is distributed in Singapore by Motilal Oswal Capital Markets Singapore Pte Limited and it is only directed in Singapore to accredited investors, as defined in the Financial Advisers Regulations and the Securities and Futures Act (Chapter 289), as amended from time to time. In respect of any matter arising from or in connection with the research you could contact the following representatives of Motilal Oswal Capital Markets Singapore Pte Limited: Varun Kumar Kadambari Balachandran Varun.kumar@motilaloswal.com kadambari.balachandran@motilaloswal.com Contact : (+65) (+65) / Office Address:21 (Suite 31),16 Collyer Quay,Singapore Motilal Oswal Securities Ltd Motilal Oswal Tower, Level 9, Sayani Road, Prabhadevi, Mumbai Phone: reports@motilaloswal.com 26 July
ECOSCOPE. Real GDP growth eases on lower net indirect taxes. The Economy Observer. Real GVA growth exactly as expected
 31 August 2016 ECOSCOPE The Economy Observer Real GDP growth eases on lower net indirect taxes Real GVA growth exactly as expected India s real gross domestic product (GDP) grew at the slowest pace in
Expect capacity-led rerating; maintain Buy
 BSE SENSEX S&P CNX 27,238 8,400 Stock Info Bloomberg SRCM IN Equity Shares (m) 34.8 52-Week Range (INR) 18519/9350 1, 6, 12 Rel. Per (%) -2/-3/32 M.Cap. (INR b) 523.7 M.Cap. (USD b) 7.7 Avg Val, INRm 216.4
CMP: INR2,013 TP: INR2,384 (+18%) DBEL to be merged with OCL India
 DBEL to be merged with OCL India") BSE SENSEX S&P CNX 27,459 8,497 CMP: INR2,013 TP: INR2,384 (+18%) DBEL to be merged with OCL India 7 November 2016 Update Sector: Cement Dalmia Bharat Buy Stock Info Bloomberg DBEL IN Equity Shares (m)
BSE SENSEX S&P CNX 27,459 8,497 CMP: INR2,013 TP: INR2,384 (+18%) DBEL to be merged with OCL India 7 November 2016 Update Sector: Cement Dalmia Bharat Buy Stock Info Bloomberg DBEL IN Equity Shares (m)
CMP: INR475 TP: INR609 (+28%) Buy
 Buy") 10 April 2017 Update Sector: Automobiles Tata Motors BSE SENSEX S&P CNX 29,576 9,181 Stock Info Bloomberg TTMT IN Equity Shares (m) 3,395.9 52-Week Range (INR) 599 / 373 1, 6, 12 Rel. Per (%) -1/-21/8
10 April 2017 Update Sector: Automobiles Tata Motors BSE SENSEX S&P CNX 29,576 9,181 Stock Info Bloomberg TTMT IN Equity Shares (m) 3,395.9 52-Week Range (INR) 599 / 373 1, 6, 12 Rel. Per (%) -1/-21/8
CMP: INR320 TP: INR164(-49%) Sell Intending to exit UK execution is key!
 Sell Intending to exit UK execution is key!") 31 March 2016 Update Sector: Metals Tata Steel BSE SENSEX S&P CNX 25,342 7,738 Stock Info Bloomberg TATA IN Equity Shares (m) 971.2 52-Week Range (INR) 384/200 1, 6, 12 Rel. Per (%) 18/54/10 M.Cap. (INR
31 March 2016 Update Sector: Metals Tata Steel BSE SENSEX S&P CNX 25,342 7,738 Stock Info Bloomberg TATA IN Equity Shares (m) 971.2 52-Week Range (INR) 384/200 1, 6, 12 Rel. Per (%) 18/54/10 M.Cap. (INR
CMP: INR2,623 TP: INR2,875 (+10%) Neutral
 Neutral") 21 March 2017 Update Sector: Healthcare Dr Reddy s Labs BSE SENSEX S&P CNX 29,485 9,122 Bloomberg DRRD IN Equity Shares (m) 170.4 M.Cap.(INR b)/(usd b) 447.0 / 6.6 52-Week Range (INR) 3689 / 2602 1, 6,
21 March 2017 Update Sector: Healthcare Dr Reddy s Labs BSE SENSEX S&P CNX 29,485 9,122 Bloomberg DRRD IN Equity Shares (m) 170.4 M.Cap.(INR b)/(usd b) 447.0 / 6.6 52-Week Range (INR) 3689 / 2602 1, 6,
CMP: INR615 TP: INR755(+23%) Buy Nominee Gold has some new competition on the block
 Buy Nominee Gold has some new competition on the block") BSE SENSEX S&P CNX 25,653 7,861 16 May 2016 Update Sector: Fertilizers PI Industries CMP: INR615 TP: INR755(+23%) Buy Nominee Gold has some new competition on the block We recently interacted with the
BSE SENSEX S&P CNX 25,653 7,861 16 May 2016 Update Sector: Fertilizers PI Industries CMP: INR615 TP: INR755(+23%) Buy Nominee Gold has some new competition on the block We recently interacted with the
CMP: INR1,044 TP: INR970 (-7%) Neutral Sale of Healthcare business margin accretive
 Neutral Sale of Healthcare business margin accretive") BSE SENSEX S&P CNX 24,646 7,485 4 March 2016 Update Sector: Capital Goods Siemens CMP: INR1,044 TP: INR970 (-7%) Neutral Sale of Healthcare business margin accretive Stock Info Bloomberg SIEM IN Equity
BSE SENSEX S&P CNX 24,646 7,485 4 March 2016 Update Sector: Capital Goods Siemens CMP: INR1,044 TP: INR970 (-7%) Neutral Sale of Healthcare business margin accretive Stock Info Bloomberg SIEM IN Equity
Exhibit 5: Per ton analysis (incl Windmills, INR m)
") 3 August 2016 1QFY17 Results Update Sector: Cement BSE SENSEX S&P CNX 27,698 8,545 Motilal Oswal values your support in the Asiamoney Brokers Poll 2016 for India Research, Sales and Trading team. We request
3 August 2016 1QFY17 Results Update Sector: Cement BSE SENSEX S&P CNX 27,698 8,545 Motilal Oswal values your support in the Asiamoney Brokers Poll 2016 for India Research, Sales and Trading team. We request
Amara Raja Batteries. CMP: INR517 TP: INR560 Buy
 BSE SENSEX S&P CNX 25,665 7,672 Bloomberg AMRJ IN Equity Shares (m) 170.8 M.Cap. (INR b) / (USD b) 88.2/1.4 52-Week Range (INR) 520/208 1, 6, 12 Rel. Per (%) 5/21/97 Financials & Valuation (INR Million)
ABB India to remain a key sourcing hub
 BSE SENSEX S&P CNX 27,430 8,485 Stock Info Bloomberg IN Equity Shares (m) 211.9 52-Week Range (INR) 1433/963 1, 6, 12 Rel. Per (%) -4/-21/-17 M.Cap. (INR b) 231.0 M.Cap. (USD b) 3.4 Avg Val, INRm 93.6
CMP: INR949 TP: INR1,140 (+20%) Buy
 Buy") BSE SENSEX S&P CNX 26,766 8,204 Stock Info Bloomberg PVRL IN Equity Shares (m) 46.7 52-Week Range (INR) 977/617 1, 6, 12 Rel. Per (%) 3/15/47 M.Cap. (INR b)/ (USD b) 44.3/0.7 Avg Val ( INR m) 157 Free
BSE SENSEX S&P CNX 26,766 8,204 Stock Info Bloomberg PVRL IN Equity Shares (m) 46.7 52-Week Range (INR) 977/617 1, 6, 12 Rel. Per (%) 3/15/47 M.Cap. (INR b)/ (USD b) 44.3/0.7 Avg Val ( INR m) 157 Free
Financial integrity intact; FDA resolution the key
 BSE Sensex S&P CNX 25,842 7,843 19 November 2015 Update Sector: Healthcare Dr. Reddy s Lab CMP: INR3,287 TP: INR4,000 (+22%) Buy Stock Info Bloomberg DRRD IN Equity Shares (m) 170.4 M.Cap. (INR b)/(usd
Bata India. CMP: INR415 TP: INR483 (+16%) Upgrade to Buy Aggressive, focused strategy to drive growth. Upgrading to Buy
 Upgrade to Buy Aggressive, focused strategy to drive growth. Upgrading to Buy") BSE SENSEX S&P CNX 26,393 8,143 Stock Info Bloomberg BATA IN Equity Shares (m) 128.5 52-Week Range (INR) 614 / 400 1, 6, 12 Rel. Per (%) -6/-24/-17 M.Cap. (INR b) 53.3 M.Cap. (USD b) 0.8 Avg Val, INRm
BSE SENSEX S&P CNX 26,393 8,143 Stock Info Bloomberg BATA IN Equity Shares (m) 128.5 52-Week Range (INR) 614 / 400 1, 6, 12 Rel. Per (%) -6/-24/-17 M.Cap. (INR b) 53.3 M.Cap. (USD b) 0.8 Avg Val, INRm
CMP: INR158 TP: INR199 (+26%) Buy NTPC FY16 annual report analysis
 Buy NTPC FY16 annual report analysis") BSE SENSEX S&P CNX 28,060 8,650 Stock Info Bloomberg NTPC IN Equity Shares (m) 158.0 52-Week Range (INR) 170/112 1, 6, 12 Rel. Per (%) 1/10/24 M.Cap. (INR b) 13449.0 M.Cap. (USD b) 20.1 Avg. Val, INR m
BSE SENSEX S&P CNX 28,060 8,650 Stock Info Bloomberg NTPC IN Equity Shares (m) 158.0 52-Week Range (INR) 170/112 1, 6, 12 Rel. Per (%) 1/10/24 M.Cap. (INR b) 13449.0 M.Cap. (USD b) 20.1 Avg. Val, INR m
JSW Energy. CMP: INR59 TP: INR84 (+42%) Buy Valuations heavily discounting merchant capacities
 Buy Valuations heavily discounting merchant capacities") BSE SENSEX S&P CNX 26,653 8,225 Stock Info Bloomberg JSW IN Equity Shares (m) 1640 52-Week Range (INR) 88 / 54 1, 6, 12 Rel. Per (%) -6/-14/-34 M.Cap. (INR b) 109.9 M.Cap. (USD b) 1.6 Avg Val, INRm 223
BSE SENSEX S&P CNX 26,653 8,225 Stock Info Bloomberg JSW IN Equity Shares (m) 1640 52-Week Range (INR) 88 / 54 1, 6, 12 Rel. Per (%) -6/-14/-34 M.Cap. (INR b) 109.9 M.Cap. (USD b) 1.6 Avg Val, INRm 223
CMP: INR113 TP: INR180(+59%) Buy Some pricing pressure, but fundamentals are strong
 Buy Some pricing pressure, but fundamentals are strong") 6 July 2017 Update Sector: Metals NMDC BSE SENSEX S&P CNX 31,246 9,638 Motilal Oswal values your support in the Asiamoney Brokers Poll 2017 for India Research, Sales and Trading team. We request your ballot.
6 July 2017 Update Sector: Metals NMDC BSE SENSEX S&P CNX 31,246 9,638 Motilal Oswal values your support in the Asiamoney Brokers Poll 2017 for India Research, Sales and Trading team. We request your ballot.
CMP: INR830 TP: INR1,040(+25%) Buy Driving value through simplification
 Buy Driving value through simplification") BSE SENSEX S&P CNX 30,435 9,429 18 May 2017 Update Sector: Utilities CMP: INR830 TP: INR1,040(+25%) Buy Driving value through simplification Stock Info Bloomberg IN Equity Shares (m) 133.2 52-Week Range
BSE SENSEX S&P CNX 30,435 9,429 18 May 2017 Update Sector: Utilities CMP: INR830 TP: INR1,040(+25%) Buy Driving value through simplification Stock Info Bloomberg IN Equity Shares (m) 133.2 52-Week Range
Castrol India. CMP: INR407 TP: INR474 (+16%) Neutral
 Neutral") BSE SENSEX S&P CNX 23,089 7,019 Bloomberg CSTRL IN Equity Shares (m) 494.6 M.Cap. (INR b) / (USD b) 201/2.9 52-Week Range (INR) 518 / 370 1, 6, 12 Rel. Per (%) 3/3/6 Avg Val (INR m) 128 Free float (%)
BSE SENSEX S&P CNX 23,089 7,019 Bloomberg CSTRL IN Equity Shares (m) 494.6 M.Cap. (INR b) / (USD b) 201/2.9 52-Week Range (INR) 518 / 370 1, 6, 12 Rel. Per (%) 3/3/6 Avg Val (INR m) 128 Free float (%)
CMP: INR681 TP: INR815(+20%) Buy
 Buy") BSE SENSEX S&P CNX 28,335 8,768 Bloomberg TRCL IN Equity Shares (m) 238 M.Cap.(INRb)/(USDb) 162 / 2.4 52-Week Range (INR) 728 / 355 1, 6, 12 Rel. Per (%) 12/22/63 Avg Val, INRm 135 Free float (%) 57.7
BSE SENSEX S&P CNX 28,335 8,768 Bloomberg TRCL IN Equity Shares (m) 238 M.Cap.(INRb)/(USDb) 162 / 2.4 52-Week Range (INR) 728 / 355 1, 6, 12 Rel. Per (%) 12/22/63 Avg Val, INRm 135 Free float (%) 57.7
CMP: INR1,952 TP: INR2,246(+15%)
") 6 February 2017 3QFY17 Results Update Sector: Cement Dalmia Bharat BSE SENSEX S&P CNX 28,439 8,801 Bloomberg DBEL IN Equity Shares (m) 88.8 M.Cap.(INRb)/(USDb) 173.3 / 2.7 52-Week Range (INR) 2090 / 605
6 February 2017 3QFY17 Results Update Sector: Cement Dalmia Bharat BSE SENSEX S&P CNX 28,439 8,801 Bloomberg DBEL IN Equity Shares (m) 88.8 M.Cap.(INRb)/(USDb) 173.3 / 2.7 52-Week Range (INR) 2090 / 605
Hardick Bora
 BSE Sensex S&P CNX 19,990 6,069 Bloomberg JOL IN Equity Shares (m) 159.3 M.Cap. (INR b)/(usd b) 26.0/0.5 52-Week Range (INR) 248/154 1,6,12 Rel. Perf. (%) -18/-28/-34 Financials & Valuation (INR b) Y/E
Attractive valuations could be illusory
 Company update Sector: Cement ACC BSE Sensex S&P CNX 28,797 8,867 Stock Info Bloomberg ACC IN Equity Shares (m) 188.0 52-Week Range (INR) 1,738/1,173 1, 6, 12 Rel. Per (%) -4/20/11 M.Cap. (INR b) 310.8
CMP: INR158 TP: INR195 (+24%) Buy Lowering crude oil price estimates
 Buy Lowering crude oil price estimates") BSE SENSEX S&P CNX 30,858 9,504 Stock Info Bloomberg ONGC IN Equity Shares (m) 12,833 52-Week Range (INR) 212 / 141 1, 6, 12 Rel. Per (%) -9/-33/-5 M.Cap. (INR b) 2,335.7 M.Cap. (USD b) 34.4 Avg Val, INRm
BSE SENSEX S&P CNX 30,858 9,504 Stock Info Bloomberg ONGC IN Equity Shares (m) 12,833 52-Week Range (INR) 212 / 141 1, 6, 12 Rel. Per (%) -9/-33/-5 M.Cap. (INR b) 2,335.7 M.Cap. (USD b) 34.4 Avg Val, INRm
Dispatches impacted by destocking at power plants
 BSE Sensex S&P CNX 28,532 8,810 2 September 2016 Update Sector: Utilities Coal India CMP: INR333 TP: INR370 (+11) Buy Stock Info Bloomberg COAL IN Equity Shares (m) 6,316.4 52-Week Range (INR) 9/272 1,
CMP: INR164 TP: INR198(+21%) Buy Project commissioning augurs well for capitalization
 Buy Project commissioning augurs well for capitalization") 12 July 2017 Update Sector: Utilities NTPC BSE SENSEX S&P CNX 31,805 9,816 Motilal Oswal values your support in the Asiamoney Brokers Poll 2017 for India Research, Sales and Trading team. We request your
12 July 2017 Update Sector: Utilities NTPC BSE SENSEX S&P CNX 31,805 9,816 Motilal Oswal values your support in the Asiamoney Brokers Poll 2017 for India Research, Sales and Trading team. We request your
Jaypee Infratech. CMP: INR33 TP: INR45 Buy
 BSE SENSEX S&P CNX 2,550,318 Bloomberg JPIN IN Equity Shares (m) 1,388.9 M.Cap. (INR b) / (USD b) 51.3/0.9 52-Week Range (INR) 2/1 1,, 12 Rel. Per (%) 1/9/-3 Financials & Valuation (INR m) Y/E Mar 201
JSW Steel. CMP: INR670 TP: INR391 Sell Merger with JSW Ispat
 BSE SENSEX S&P CNX 17,384 5,254 Bloomberg JSTL IN Equity Shares (m) 223.1 52-Week Range (INR) 885/464 1,6,12 Rel. Perf. (%) -5/-12/-10 M.Cap. (INR b) 149.5 M.Cap. (USD b) 2.7 Valuation summary (INR b)
Sanjay Jain Pavas Pethia
 BSE Sensex S&P CNX 19,561 5,923 Bloomberg SAIL IN Equity Shares (m) 4,130.4 M.Cap. (INR b)/(usd b) 334.6/6.2 52-Week Range (INR) 116/76 1,6,12 Rel. Perf. (%) -11/-17/-38 Financials & Valuation (INR b)
No major improvement in value proposition expected
 Sector Update 18 July 2017 Oil & Gas Motilal Oswal values your support in the Asiamoney Brokers Poll 2017 for India Research, Sales and Trading team. We request your ballot. Refer to our report on Oil
Individual Housing Loans: Rationalization of Risk-Weights and LTV Ratios
 8 October 2015 Sector Update Financials Individual Housing Loans: Rationalization of Risk-Weights and LTV Ratios Significant capital release for HFCs; Limited benefits for banks Event: RBI reduces risk
Stress test: Weak capital servicing ratios to drive pricing discipline
 Stress test: Weak capital servicing ratios to drive pricing discipline Operating performance near trough; expect gradual improvement 20 Update Cement Our analysis of a cross-section of cement companies
CMP: INR388 TP: INR465(+20%) Buy
 Buy") BSE SENSEX S&P CNX 30,858 9,504 29 June 2017 Update Sector: Technology Tech Mahindra CMP: INR388 TP: INR465(+20%) Buy Steeper-than-anticipated challenges at the start of the year Revenue headwinds to add
BSE SENSEX S&P CNX 30,858 9,504 29 June 2017 Update Sector: Technology Tech Mahindra CMP: INR388 TP: INR465(+20%) Buy Steeper-than-anticipated challenges at the start of the year Revenue headwinds to add
CMP: INR492 TP: INR550 (+12%) Buy
 Buy") BSE SENSEX S&P CNX 25,302 7,750 Bloomberg TRCL IN Equity Shares (m) 238.1 M.Cap.(INR b)/(usd b) 117.1 / 1.7 52-Week Range (INR) 515/293 1, 6, 12 Rel. Per (%) 8/34/76 Avg Val, (INR m) 85 Free float (%)
BSE SENSEX S&P CNX 25,302 7,750 Bloomberg TRCL IN Equity Shares (m) 238.1 M.Cap.(INR b)/(usd b) 117.1 / 1.7 52-Week Range (INR) 515/293 1, 6, 12 Rel. Per (%) 8/34/76 Avg Val, (INR m) 85 Free float (%)
Jinesh Gandhi Sandipan Pal
 BSE Sensex S&P CNX 20,224 6,157 Bloomberg BCORP IN Equity Shares (m) 77.0 M.Cap. (INR b)/(usd b) 20.5/0.4 52-Week Range (INR) 342/202 1,6,12 Rel. Perf. (%) 6/-15/-23 Financials & Valuation (INR b) Y/E
CMP: INR826 TP: INR810 (-2%) Neutral
 Neutral") 8 December 2015 Update Sector: Consumer Hindustan Unilever BSE SENSEX S&P CNX 25,310 7,702 CMP: INR826 TP: INR810 (-2%) Neutral Maneuvering pricing in a deflationary environment Delayed winter a risk for
8 December 2015 Update Sector: Consumer Hindustan Unilever BSE SENSEX S&P CNX 25,310 7,702 CMP: INR826 TP: INR810 (-2%) Neutral Maneuvering pricing in a deflationary environment Delayed winter a risk for
CMP: INR179 TP: INR205 (+14%) Buy
 Buy") BSE SENSEX S&P CNX 27,747 8,509 Motilal Oswal values your support in the Asiamoney Brokers Poll 2016 for India Research, Sales and Trading team. We request your ballot. Bloomberg EXID IN Equity Shares
BSE SENSEX S&P CNX 27,747 8,509 Motilal Oswal values your support in the Asiamoney Brokers Poll 2016 for India Research, Sales and Trading team. We request your ballot. Bloomberg EXID IN Equity Shares
No significant jump in retail electronic payments post demonetization
 No significant jump in retail electronic payments post demonetization Confirms a considerable dent in consumer demand in 4Q2016 29 December 2016 ECOSCOPE The Economy Observer The government s attempts
Birla Corporation. CMP: INR484 TP: INR590 (+22%) Buy
 Buy") BSE SENSEX S&P CNX 28,851 8,712 Bloomberg BCORP IN Equity Shares (m) 77.0 M.Cap. (INR b) / (USD b) 37.3/0.6 52-Week Range (INR) 615/226 1, 6, 12 Rel. Per (%) 1/5/64 Avg Val (INRm)/Vol 000 34/72 Free float
BSE SENSEX S&P CNX 28,851 8,712 Bloomberg BCORP IN Equity Shares (m) 77.0 M.Cap. (INR b) / (USD b) 37.3/0.6 52-Week Range (INR) 615/226 1, 6, 12 Rel. Per (%) 1/5/64 Avg Val (INRm)/Vol 000 34/72 Free float
Dr Urjit Patel to maintain continuity of monetary policy stance
 Dr Urjit Patel to maintain continuity of monetary policy stance Appointment helps retain government s credibility to fight against inflation 22 August 2016 ECOSCOPE The Economy Observer The government
Sohail Halai Alpesh Mehta
 BSE Sensex S&P CNX 20,039 6,064 Bloomberg IDBI IN Equity Shares (m) 1,278.4 M.Cap. (INR b)/(usd b) 144.9/2.7 52-Week Range (INR) 122/82 1,6,12 Rel.Perf.(%) -1/6/2 Financials & Valuation (INR b) Y/E March
April 2017: Off-take growth remains strong
 BSE Sensex S&P CNX 29,9 9,3 2 May 17 Update Sector: Utilities Coal India CMP: INR275 TP: INR3 (+%) Buy April 17: Off-take growth remains strong E-auction realization impacted by weaker mix in March 17
City Union Bank BUY. 24 February 2016 INR82
 SECTOR: FINANCIAL STOCK INFO. BSE Sensex : 23410 BLOOMBERG CUBK:IN BUY S&P CNX : 7110 REUTERS CODE CTBK.NS Initiating Coverage INR82 (INR CR) Y/E MARCH FY16E FY17E FY18E We recommend 'BUY' on for a target
Decent performance by the sector in a tough quarter
 Sector Update 17 February 2017 Cement MOSL Cement Universe volume (mt) trend Volume (mt) 3QFY17 YoY 5.5-9% 11.4-1% 1.7-11% 2.4 21% 4.9 3.6 20% 1.9-1.8 2.0 2 1.3 19% Volumes in Jan-17 revive to pre-demonetization
Jinesh Gandhi Chirag Jain
 BSE Sensex S&P CNX 19,561 5,923 Bloomberg EIM IN Equity Shares (m) 27.0 M.Cap. (INR b)/(usd b) 72.0/1.3 52-Week Range 3,240/1,620 1,6,12 Rel. Perf. (%) -4/17/40 Financials & Valuation (INR b) Y/E Dec 2013E
IDFC Bank. CMP: INR63 TP: INR68 (8%) Neutral
 Neutral") BSE SENSEX S&P CNX 27,882 8,641 Bloomberg IDFCBK IN Equity Shares (m) 3392.6 M.Cap.(INRb)/(USDb) 214.4 /3.2 52-Week Range (INR) 83 /44 1, 6, 12 Rel. Per (%) -4/21/-10 Avg Val, INRm 536 Free float (%) 47.1
BSE SENSEX S&P CNX 27,882 8,641 Bloomberg IDFCBK IN Equity Shares (m) 3392.6 M.Cap.(INRb)/(USDb) 214.4 /3.2 52-Week Range (INR) 83 /44 1, 6, 12 Rel. Per (%) -4/21/-10 Avg Val, INRm 536 Free float (%) 47.1
CMP: INR78 TP: INR88 (+13%) Neutral
 Neutral") BSE SENSEX S&P CNX 23,759 7,216 Bloomberg ICEM IN Equity Shares (m) 307.2 M.Cap.(INRb)/(USDb) 23.9 / 0.4 52-Week Range (INR) 112/64 1, 6, 12 Rel. Per (%) -17/9/1 Avg Val, (INR m) 314 Free float (%) 71.8
BSE SENSEX S&P CNX 23,759 7,216 Bloomberg ICEM IN Equity Shares (m) 307.2 M.Cap.(INRb)/(USDb) 23.9 / 0.4 52-Week Range (INR) 112/64 1, 6, 12 Rel. Per (%) -17/9/1 Avg Val, (INR m) 314 Free float (%) 71.8
V-Guard Industries. CMP: INR1,591 TP: INR1,625 (+2%) Neutral
 Neutral") BSE SENSEX S&P CNX 28,052 8,639 Motilal Oswal values your support in the Asiamoney Brokers Poll 2016 for India Research, Sales and Trading team. We request your ballot. Bloomberg VGRD IN Equity Shares
BSE SENSEX S&P CNX 28,052 8,639 Motilal Oswal values your support in the Asiamoney Brokers Poll 2016 for India Research, Sales and Trading team. We request your ballot. Bloomberg VGRD IN Equity Shares
CMP: INR350 TP: INR375 Downgrade to Neutral
 BSE Sensex S&P CNX 19,497 5,897 Bloomberg COAL IN Equity Shares (m) 6,316.4 M.Cap. (INR b)/(usd b) 2,211/41 52-Week Range (INR) 386/301 1,6,12 Rel. Perf. (%) 1/-11/-5 Financials & Valuation (INR b) Y/E
CMP: INR865 TP: INR1,015 (+17%) Buy Building blocks for strong growth
 Buy Building blocks for strong growth") BSE SENSEX S&P CNX 29,647 9,174 Stock Info Bloomberg KMB IN Equity Shares (m) 1,840 52-Week Range (INR) 885 / 656 1, 6, 12 Rel. Per (%) 5/5/10 M.Cap. (INR b) 1,580.8 M.Cap. (USD b) 24.4 Avg Val, INRm 1618
BSE SENSEX S&P CNX 29,647 9,174 Stock Info Bloomberg KMB IN Equity Shares (m) 1,840 52-Week Range (INR) 885 / 656 1, 6, 12 Rel. Per (%) 5/5/10 M.Cap. (INR b) 1,580.8 M.Cap. (USD b) 24.4 Avg Val, INRm 1618
Oil & Gas. India FY16 POL consumption growth at 8 year high of 11% Petroleum, oil and lubricants (POL) consumption grows at double digits
 consumption grows at double digits") 13 April 2016 India POL consumption growth at 8 year high of 11% Except kerosene, all products grew at 8-25%; Gasoline/diesel at 14.5%/7.5% Petroleum, oil and lubricants (POL) consumption grows at double
13 April 2016 India POL consumption growth at 8 year high of 11% Except kerosene, all products grew at 8-25%; Gasoline/diesel at 14.5%/7.5% Petroleum, oil and lubricants (POL) consumption grows at double
To voluntarily stop supplies to US
 BSE Sensex S&P CNX 26,272 7,831 24 July 2014 Update Sector: Healthcare Ipca Laboratories CMP: INR728 TP: INR930 Buy Stock Info Bloomberg IPCA IN Equity Shares (m) 126.2 52-Week Range (INR) 907/609 1, 6,
Niket Shah
 BSE Sensex S&P CNX 20,213 6,147 Bloomberg VGRD IN Equity Shares (m) 29.8 M.Cap. (INR b)/(usd b) 14.6/0.3 52-Week Range (INR) 591/180 1,6,12 Rel. Perf. (%) -8/-6/138 Financial summary (INR b) Y/E March
ECOSCOPE. 3QFY16 CAD/GDP corrects to 1.3% The Economy Observer. Balance of Payments. See surplus in 4Q and to remain low in FY17; INR to correct still
 3QFY16 CAD/GDP corrects to 1.3% See surplus in 4Q and to remain low in FY17; INR to correct still 21 March 216 ECOSCOPE The Economy Observer Balance of Payments 3QFY16 CAD/GDP at 1.3% and trade deficit
India Cements. CMP: INR107 TP: INR113 (+6%) Neutral
 Neutral") BSE SENSEX S&P CNX 28,805 8,712 Bloomberg ICEM IN Equity Shares (m) 307.2 M.Cap. (INR b) / (USD b) 32.8/0.5 52-Week Range (INR) 134/48 1, 6, 12 Rel. Per (%) 19/-14/68 Avg Val,INRm/Vol 000 291/2988 Free
BSE SENSEX S&P CNX 28,805 8,712 Bloomberg ICEM IN Equity Shares (m) 307.2 M.Cap. (INR b) / (USD b) 32.8/0.5 52-Week Range (INR) 134/48 1, 6, 12 Rel. Per (%) 19/-14/68 Avg Val,INRm/Vol 000 291/2988 Free
Growth conviction, market share focus intact
 BSE Sensex S&P CNX 29,136 8,809 17 February 2015 Update Sector: Cement CMP: INR3,082 TP: INR3,505 (+14%) Buy Growth conviction, market share focus intact Kotputli plant visit takeaways high emphasis on
CMP: INR473 TP: INR545(+15%) Buy Mega merger on the anvil
 Buy Mega merger on the anvil") BSE SENSEX S&P CNX 26,626 8,170 Stock Info Bloomberg MAXF IN Equity Shares (m) 267.0 52-Week Range (INR) 514/303 1, 6, 12 Rel. Per (%) 22/14/24 M.Cap. (INR b) 126.2 M.Cap. (USD b) 1.9 Avg Val ( INRm) 170
BSE SENSEX S&P CNX 26,626 8,170 Stock Info Bloomberg MAXF IN Equity Shares (m) 267.0 52-Week Range (INR) 514/303 1, 6, 12 Rel. Per (%) 22/14/24 M.Cap. (INR b) 126.2 M.Cap. (USD b) 1.9 Avg Val ( INRm) 170
Siddharth Bothra
 BSE Sensex S&P CNX 19,152 5,797 Bloomberg CSTRL IN Equity Shares (m) 494.6 M.Cap. (INR b)/(usd b) 158/2.9 52-Week Range (INR) 338/223 1,6,12 Rel. Perf. (%) 12/-3/26 Financials & Valuation (INR b) Y/E March
Widening the moat. CMP: INR3,353 TP: INR3,870 (+15%) Buy
 Buy") BSE Sensex S&P CNX 27,990 8,633 23 August 2016 Update Sector: Consumer Britannia Industries CMP: INR3,353 TP: INR3,870 (+15%) Buy Widening the moat Stock Info Bloomberg BRIT IN Equity Shares (m) 119.9
BSE Sensex S&P CNX 27,990 8,633 23 August 2016 Update Sector: Consumer Britannia Industries CMP: INR3,353 TP: INR3,870 (+15%) Buy Widening the moat Stock Info Bloomberg BRIT IN Equity Shares (m) 119.9
Just Dial. CMP: INR1,129 TP: INR1,475 Buy
 BSE SENSEX S&P CNX 23,871 7,109 Bloomberg JUST IN Equity Shares (m) 70.2 M.Cap. (INR b) / (USD b) 79.2/1.3 52-Week Range (INR) 1,774/589 1, 6, 12 Rel. Per (%) -18/-7/- Financials & Valuation (INR m) Y/E
Gujarat Pipavav Port. CMP: INR162 TP: INR212 (31%) Buy
 Buy") BSE SENSEX S&P CNX 26,838 8,112 Bloomberg GPPV IN Equity Shares (m) 483.4 M.Cap. INR b /USD b 162.3/2.5 52-Week Range (INR) 262/156 1, 6, 12 Rel. Per (%) -15/-26/3 Avg Val INRm 248 Free float (%) 57.0
BSE SENSEX S&P CNX 26,838 8,112 Bloomberg GPPV IN Equity Shares (m) 483.4 M.Cap. INR b /USD b 162.3/2.5 52-Week Range (INR) 262/156 1, 6, 12 Rel. Per (%) -15/-26/3 Avg Val INRm 248 Free float (%) 57.0
RJio sturdy as Battle Royale gets exciting
 RJio sturdy as Battle Royale gets exciting 2 December Sector 2016 Update Sector Telecom Update Crosses 50m subscriber base mark, earlier than our expectation Telecom Extends free usage till March 17 as
CMP: INR550 TP: INR630 (+15%) Buy
 Buy") 24 July 2017 1QFY18 Results Update Sector: Media Zee Entertainment BSE SENSEX S&P CNX 32,246 9,966 Motilal Oswal values your support in the Asiamoney Brokers Poll 2017 for India Research, Sales and Trading
24 July 2017 1QFY18 Results Update Sector: Media Zee Entertainment BSE SENSEX S&P CNX 32,246 9,966 Motilal Oswal values your support in the Asiamoney Brokers Poll 2017 for India Research, Sales and Trading
Hardick Bora 4QCY12 Results Update Sector: Healthcare Sanofi India CMP: INR2,307 TP: INR2,015 Neutral
 BSE Sensex S&P CNX 19,332 5,855 Bloomberg SANL IN Equity Shares (m) 23.0 M.Cap. (INR b)/(usd b) 53.1/1.0 52-Week Range (INR) 2,450/2,002 1,6,12 Rel. Perf. (%) 9/-1/-4 Financials & Valuation (INR b) Y/E
CMP: INR162 TP: INR225(+39%) Buy
 Buy") 10 February 2016 Q3FY16 Results Update Sector: Real Estate BSE SENSEX S&P CNX 23,759 7,216 Bloomberg PEPL IN Equity Shares (m) 375.0 M.Cap.(INRb)/(USDb) 64.0 / 0.9 52-Week Range (INR) 299/166 1, 6, 12
10 February 2016 Q3FY16 Results Update Sector: Real Estate BSE SENSEX S&P CNX 23,759 7,216 Bloomberg PEPL IN Equity Shares (m) 375.0 M.Cap.(INRb)/(USDb) 64.0 / 0.9 52-Week Range (INR) 299/166 1, 6, 12
REPORT THREADBARE. New accounting standards from FY The ART of annual report analysis
 23 February 2015 ANNUAL New accounting standards from FY16-17 Financial reporting set for revamp with introduction of Ind-AS The Government has unveiled a roadmap to implement Ind-AS (equivalent IFRS standards)
Eicher Motors. CMP: INR9,281 TP: INR11,401 Buy
 BSE SENSEX S&P CNX 25,881 7,727 Bloomberg EIM IN Equity Shares (m) 27.1 M.Cap. (INR b) / (USD b) 251.5/4.1 52-Week Range (INR) 9,350/2,975 1, 6, 12 Rel. Per (%) 9/83/144 Financials & Valuation (INR Million)
CMP: INR270 TP: INR335(+24%) Buy Takes price hike disguised as evacuation charges
 Buy Takes price hike disguised as evacuation charges") BSE SENSEX S&P CNX 33,777 10,444 Stock Info Bloomberg COAL IN Equity Shares (m) 6,207 52-Week Range (INR) 332/234 1, 6, 12 Rel. Per (%) -2/2/-36 M.Cap. (INR b) 1,673.5 M.Cap. (USD b) 26.1 Avg Val, INRm
BSE SENSEX S&P CNX 33,777 10,444 Stock Info Bloomberg COAL IN Equity Shares (m) 6,207 52-Week Range (INR) 332/234 1, 6, 12 Rel. Per (%) -2/2/-36 M.Cap. (INR b) 1,673.5 M.Cap. (USD b) 26.1 Avg Val, INRm
Cross service charges at INR m/quarter
 BSE SENSEX S&P CNX 19,636 5,940 Cummins India CMP: INR504 TP: INR585 Buy LHP products to be an important growth driver Cross service charges at INR100-200m/quarter 20 February 2013 Update Sector: Capital
Zee Entertainment. CMP: INR535 TP: INR610 (+14%) Buy. Attempts to fix hole in the ship via sports assets sale
 Buy. Attempts to fix hole in the ship via sports assets sale") BSE SENSEX S&P CNX 28, 423 8,775 Stock Info Bloomberg Z IN Equity Shares (m) 960.4 M.Cap. (INR b)/(usd b) 371.7/5.8 52-Week Range (INR) 402 / 265 52-Week Range (INR) 545 / 350 1, 6, 12 Rel. Per (%) 5/20/33
BSE SENSEX S&P CNX 28, 423 8,775 Stock Info Bloomberg Z IN Equity Shares (m) 960.4 M.Cap. (INR b)/(usd b) 371.7/5.8 52-Week Range (INR) 402 / 265 52-Week Range (INR) 545 / 350 1, 6, 12 Rel. Per (%) 5/20/33
Idea Cellular. CMP: INR159 TP: INR200 Buy
 BSE SENSEX S&P CNX 19,164 5,678 Bloomberg IDEA IN Equity Shares (m) 3,316.2 M.Cap. (INR b) / (USD b) 513.7/8.4 52-Week Range (INR) 176/72 1, 6, 12 Rel. Per (%) 12/45/83 Financials & Valuation (INR Billion)
Can Fin Homes BUY. 23 September 2015 INR821
 SECTOR: FINANCIAL Can Fin Homes STOCK INFO. BSE Sensex : 25590 BLOOMBERG CANF:IN BUY S&P CNX : 7812 REUTERS CODE CNFH.NS Re-Initiating Coverage INR821 Y/E MARCH FY15 FY16E (INR CR) FY17E We recommend 'BUY'
IDFC Bank. CMP: INR61 TP: INR62 (2%) Neutral Focus on inorganic opportunities; stressed assets stable
 Neutral Focus on inorganic opportunities; stressed assets stable") BSE SENSEX S&P CNX 30,133 9,352 Bloomberg IDFCBK IN Equity Shares (m) 3392.6 M.Cap.(INR b)/(usdb) 207.0 / 3.0 52-Week Range (INR) 83 / 44 1, 6, 12 Rel. Per (%) -2/-29/0 Avg. Val, INR m 621 Free float (%)
BSE SENSEX S&P CNX 30,133 9,352 Bloomberg IDFCBK IN Equity Shares (m) 3392.6 M.Cap.(INR b)/(usdb) 207.0 / 3.0 52-Week Range (INR) 83 / 44 1, 6, 12 Rel. Per (%) -2/-29/0 Avg. Val, INR m 621 Free float (%)
CMP: INR317 TP: INR333 (+5%) Neutral
 Neutral") BSE SENSEX S&P CNX 25,229 7,733 Bloomberg GPL IN Equity Shares (m) 216.3 M.Cap.(INR b)/(usd b) 69.7 / 1. 52-Week Range (INR) 375/238 1, 6, 12 Rel. Per (%) 3/3/32 Avg Val, (INR m) 772 Free float (%) 25.1
BSE SENSEX S&P CNX 25,229 7,733 Bloomberg GPL IN Equity Shares (m) 216.3 M.Cap.(INR b)/(usd b) 69.7 / 1. 52-Week Range (INR) 375/238 1, 6, 12 Rel. Per (%) 3/3/32 Avg Val, (INR m) 772 Free float (%) 25.1
NTPC CMP: INR169 TP: INR191 Buy
 BSE SENSEX S&P CNX 18,625 5,664 Bloomberg NTPC IN Equity Shares (m) 8,245.5 52-Week Range (INR) 190/139 1,6,12 Rel. Perf. (%) 3/-4/-11 M.Cap. (INR b) 1,393.5 M.Cap. (USD b) 26.0 26 October 2012 2QFY13
CMP: INR865 TP: INR1,000 (+16%) Buy
 Buy") BSE SENSEX S&P CNX 25,400 7,783 Bloomberg DBEL IN Equity Shares (m) 88.8 M.Cap.(INR b)/(usd b) 76.8 / 1.1 52-Week Range (INR) 959/510 1, 6, 12 Rel. Per (%) 1/22/76 Avg Val, (INR m) 30 Free float (%) 42.6
BSE SENSEX S&P CNX 25,400 7,783 Bloomberg DBEL IN Equity Shares (m) 88.8 M.Cap.(INR b)/(usd b) 76.8 / 1.1 52-Week Range (INR) 959/510 1, 6, 12 Rel. Per (%) 1/22/76 Avg Val, (INR m) 30 Free float (%) 42.6
CMP: INR176 TP: INR228 (+30%) Buy
 Buy") 23 May 2017 4QFY17 Results Update Sector: Logistics Allcargo Logistics BSE SENSEX S&P CNX 30,365 9,386 Bloomberg AGLL IN Equity Shares (m) 245.7 M.Cap.(INRb)/(USDb) 43.0 / 0.7 52-Week Range (INR) 222 /
23 May 2017 4QFY17 Results Update Sector: Logistics Allcargo Logistics BSE SENSEX S&P CNX 30,365 9,386 Bloomberg AGLL IN Equity Shares (m) 245.7 M.Cap.(INRb)/(USDb) 43.0 / 0.7 52-Week Range (INR) 222 /
Automobiles Maruti Suzuki
 MSIL IN Equity Shares (m) 302 M.Cap. (INR b)/(usd b) 2,025/31.6 52-Week Range (INR) 7249 / 3868 1, 6, 12 Rel. Per (%) 5/22/55 Sales 680.3 806.6 937.2 EBITDA 104.7 127.9 154.5 Adj. PAT 74.2 88.9 110.2 Adj.
CMP: INR859 TP: INR810 (-6%) Neutral
 Neutral") 18 December 2015 Update Sector: Consumer Hindustan Unilever BSE SENSEX S&P CNX 25,519 7,762 CMP: INR859 TP: INR810 (-6%) Neutral Foray into Premium Ayurvedic Hair Oil First Acquisition in a decade Stock
18 December 2015 Update Sector: Consumer Hindustan Unilever BSE SENSEX S&P CNX 25,519 7,762 CMP: INR859 TP: INR810 (-6%) Neutral Foray into Premium Ayurvedic Hair Oil First Acquisition in a decade Stock
Jinesh Gandhi Chirag Jain
 BSE Sensex S&P CNX 19,722 5,995 Bloomberg EIM IN Equity Shares (m) 27.0 M.Cap. (INR b)/(usd b) 88.1/1.6 52-Week Range (INR) 3,285/1,620 1,6,12 Rel. Perf. (%) 10/20/36 Financials & Valuation (INR b) Y/E
Hindustan Zinc. CMP: INR194 TP: INR208 (+7%) Neutral
 Neutral") BSE SENSEX S&P CNX 27,711 8,510 Motilal Oswal values your support in the Asiamoney Brokers Poll 2016 for India Research, Sales and Trading team. We request your ballot. Bloomberg HZ IN Equity Shares (m)
BSE SENSEX S&P CNX 27,711 8,510 Motilal Oswal values your support in the Asiamoney Brokers Poll 2016 for India Research, Sales and Trading team. We request your ballot. Bloomberg HZ IN Equity Shares (m)
CMP: INR346 TP: INR411(+19%) Buy Opportunity in the blip
 Buy Opportunity in the blip") BSE SENSEX S&P CNX 25,87 7,98 26 December 216 Update Sector: Oil & Gas Petronet LNG CMP: INR346 TP: INR411(+19%) Buy Opportunity in the blip Expect LNG prices to soften Stock Info Bloomberg PLNG IN Equity
BSE SENSEX S&P CNX 25,87 7,98 26 December 216 Update Sector: Oil & Gas Petronet LNG CMP: INR346 TP: INR411(+19%) Buy Opportunity in the blip Expect LNG prices to soften Stock Info Bloomberg PLNG IN Equity
Pidilite Industries. CMP: INR164 TP: INR186 Buy
 BSE SENSEX S&P CNX 16,640 5,043 Bloomberg PIDI IN Equity Shares (m) 506.1 52-Week Range (INR) 188/134 1,6,12 Rel. Perf. (%) 1/20/5 M.Cap. (INR b) 83.0 M.Cap. (USD b) 1.5 27 July 2012 1QFY13 Results Update
Oberoi Realty. CMP: INR240 TP: INR297 Buy
 BSE SENSEX S&P CNX 25,642 7,664 Bloomberg OBER IN Equity Shares (m) 328.2 M.Cap. (INR b) / (USD b) 78.8/1.3 52-Week Range (INR) 276/154 1, 6, 12 Rel. Per (%) -8/-7/-6 Financials & Valuation (INR m) Y/E
May-14. Jan-14. Jun-14. Dec-13. Aug-13. Sep-13. Nov-13. Feb-14. Oct-13. Mar-14. Apr-14. Will recent momentum in North-Central India sustain?
 Sector Update 2 February 2016 Cement Update North/Central India-based players could be favorable bets Recovery in sight growth sustainability to revive pricing Cement Industry feedback suggests signs of
Shoppers Stop. CMP: INR339 TP: INR355 Neutral
 BSE SENSEX S&P CNX 20,684 6,145 Bloomberg SHOP IN Equity Shares (m) 83.1 M.Cap. (INR b) / (USD b) 28.1/0.5 52-Week Range (INR) 494/331 1, 6, 12 Rel. Per (%) -7/-16/-28 Financials & Valuation (INR b) Y/E
CMP: INR326 TP: INR370(+14%) Buy Import substitution to pick up; strong forward booking
 Buy Import substitution to pick up; strong forward booking") BSE SENSEX S&P CNX 27,698 8,545 Motilal Oswal values your support in the Asiamoney Brokers Poll 2016 for India Research, Sales and Trading team. We request your ballot. Stock Info Bloomberg COAL IN Equity
BSE SENSEX S&P CNX 27,698 8,545 Motilal Oswal values your support in the Asiamoney Brokers Poll 2016 for India Research, Sales and Trading team. We request your ballot. Stock Info Bloomberg COAL IN Equity
Sanofi India. CMP: INR2,200 TP: INR1,848 Neutral
 BSE SENSEX S&P CNX 16,846 5,110 Bloomberg SANL IN Equity Shares (m) 23.0 52-Week Range (INR) 2,430/1,980 1,6,12 Rel. Perf. (%) 3/-3/15 M.Cap. (INR b) 50.7 M.Cap. (USD b) 0.9 26 July 2012 2QCY12 Results
CMP: INR1,047 TP: INR1,300 (+24%) Much-awaited SEBI guidelines on options finally out
 Much-awaited SEBI guidelines on options finally out") BSE SENSEX S&P CNX 31,103 9,607 Stock Info Bloomberg MCX IN Equity Shares (m) 51 52-Week Range (INR) 1,420/919 1, 6, 12 Rel. Per (%) -8/-36/-10 M.Cap. (INR b) 53.4 M.Cap. (USD b) 0.8 Avg Val, INRm 485.0
BSE SENSEX S&P CNX 31,103 9,607 Stock Info Bloomberg MCX IN Equity Shares (m) 51 52-Week Range (INR) 1,420/919 1, 6, 12 Rel. Per (%) -8/-36/-10 M.Cap. (INR b) 53.4 M.Cap. (USD b) 0.8 Avg Val, INRm 485.0
Century Plyboards (I) Limited
 Limited") ANTIQUE STOCK BROKING LIMITED 2 November 2017 1 Current Reco Previous Reco CMP Basudeb Banerjee +91 22 4031 3443 basudeb.banerjee@antiquelimited.com Market data Sensex : 33,600 Sector : Mid Cap Market
ANTIQUE STOCK BROKING LIMITED 2 November 2017 1 Current Reco Previous Reco CMP Basudeb Banerjee +91 22 4031 3443 basudeb.banerjee@antiquelimited.com Market data Sensex : 33,600 Sector : Mid Cap Market
CMP: INR124 TP: INR172 Buy. Benefit of two major motorcycle launches not priced in. Improved industry outlook and recent launch success drive upgrades
 BSE Sensex S&P CNX 24,717 7,359 Stock Info Bloomberg TVSL IN Equity Shares (m) 475.1 52-Week Range (INR) 138/28 1, 6, 12 Rel. Per (%) 34/111/210 M.Cap. (INR b) 59.1 M.Cap. (USD b) 1.0 Financial Snapshot
Sandipan Pal QFY13 Results Update Sector: Real Estate Unitech CMP: INR29 TP: INR44 Buy
 BSE Sensex S&P CNX 19,608 5,933 Bloomberg UT IN Equity Shares (m) 2,438.8 M.Cap. (INR b)/(usd b) 70/1.3 52-Week Range (INR) 41/18 1,6,12 Rel. Perf. (%) -27/24/-13 Financials & Valuation (INR b) Y/E March
Unitech. CMP: INR20 TP: INR30 Buy
 BSE SENSEX S&P CNX 16,328 4,943 Bloomberg UT IN Equity Shares (m) 2,438.8 52-Week Range (INR) 38/17 1,6,12 Rel. Perf. (%) -25/-14/-34 M.Cap. (INR b) 48.8 M.Cap. (USD b) 0.9 16 May 2012 4QFY12 Results Update
Canara Bank. CMP: INR419 TP: INR525 Buy
 BSE SENSEX S&P CNX 18,817 5,724 Bloomberg CBK IN Equity Shares (m) 443.0 52-Week Range (INR) 566/349 1,6, 12 Rel.Perf.(%) -7/-18/-17 M.Cap. (INR b) 170.3 M.Cap. (USD b) 3.0 7 November 2012 2QFY13 Results
IndusInd Bank. CMP: INR345 TP: INR419 Buy
 BSE SENSEX S&P CNX 17,504 5,332 Bloomberg IIB IN Equity Shares (m) 467.7 52-Week Range (INR) 352/222 1,6,12 Rel.Perf.(%) 13/25/34 M.Cap. (INR b) 161.4 M.Cap. (USD b) 3.1 20 April 2012 4QFY12 Results Update
CMP: INR567 TP: INR632(+11%) Buy
 Buy") BSE SENSEX S&P CNX 3,28 9,595 Bloomberg HPCL IN Equity Shares (m),6 M.Cap.(INRb)/(USDb) 58.6 / 8.7 52-Week Range (INR) 584 / 275, 6, 2 Rel. Per (%) -3/5/83 Avg Val, INRm 83 Free float (%) 48.9 Financials
BSE SENSEX S&P CNX 3,28 9,595 Bloomberg HPCL IN Equity Shares (m),6 M.Cap.(INRb)/(USDb) 58.6 / 8.7 52-Week Range (INR) 584 / 275, 6, 2 Rel. Per (%) -3/5/83 Avg Val, INRm 83 Free float (%) 48.9 Financials
CPCB-2: Important long-term driver
 BSE Sensex S&P CNX 20,860 6,217 19 December 2013 Update Sector: Capital Goods Cummins India CMP: INR461 TP: INR540 Buy Stock Info Bloomberg KKC IN Equity Shares (m) 277.2 52-Week Range (INR) 550/365 1,
SKS Microfinance. CMP: INR478 TP: INR589 (+23%) Buy Clouds of uncertainty cleared. RBI to be the sole regulator of the MFI sector
 Buy Clouds of uncertainty cleared. RBI to be the sole regulator of the MFI sector") BSE SENSEX S&P CNX 24,188 7,351 Stock Info Bloomberg SKSM IN Equity Shares (m) 126.3 52-Week Range (INR) 590 / 369 1, 6, 12 Rel. Per (%) 5/5/16 M.Cap. (INR b)/(usd b) 61.1/0.9 12M Avg Val (INR M) 868 Free
BSE SENSEX S&P CNX 24,188 7,351 Stock Info Bloomberg SKSM IN Equity Shares (m) 126.3 52-Week Range (INR) 590 / 369 1, 6, 12 Rel. Per (%) 5/5/16 M.Cap. (INR b)/(usd b) 61.1/0.9 12M Avg Val (INR M) 868 Free
CMP: INR397 TP: INR378 (-5%) Neutral
 Neutral") BSE SENSEX S&P CNX 27,942 8,638 Bloomberg WONH IN Equity Shares (m) 56.5 M.Cap.(INRb)/(USDb) 22.4/0.3 52-Week Range (INR) 430/311 1, 6, 12 Rel. Per (%) 3/-5/23 Avg Val, INRm/ Vol m 37 Free float (%) 29.0
BSE SENSEX S&P CNX 27,942 8,638 Bloomberg WONH IN Equity Shares (m) 56.5 M.Cap.(INRb)/(USDb) 22.4/0.3 52-Week Range (INR) 430/311 1, 6, 12 Rel. Per (%) 3/-5/23 Avg Val, INRm/ Vol m 37 Free float (%) 29.0
S4A An ammunition to cut the debt trap
 Sector Update 14 June 2016 Financials Please refer our detailed report dated 1 March 2016 S4A An ammunition to cut the debt trap Positive for corporate lenders; Prefer SBIN, BOB and ICICIBC The RBI has