2018/4/27. Contents. Financial Highlights, Year ended in March 31, Copyright DAITO TRUST CONSTRUCTION CO., LTD.
|
|
|
- Amelia Rice
- 5 years ago
- Views:
Transcription


1 Financial Highlights, Year ended in March 31, Contents 2 1
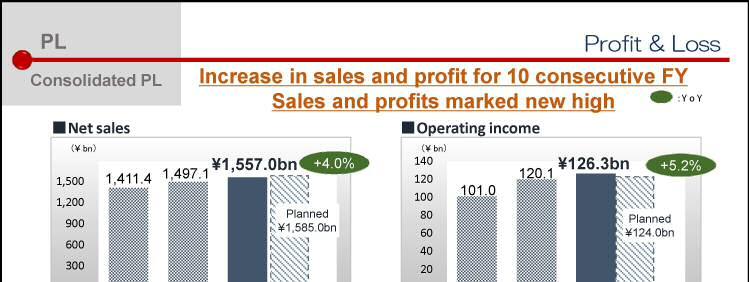
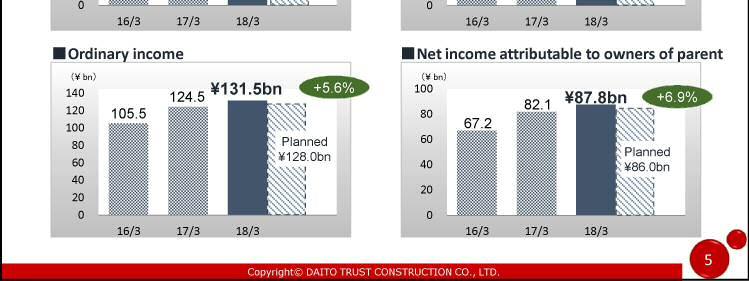
2 Financial Results, Year ended in March 31,218 3 Results in FY ended in March 218 Highlights 1. Increase in sales and profit for 1 consecutive FY Marked record high 2. Orders received 651. bn.6% Y o Y Occupancy rate( rent basis ) p Y o Y Maintain sound level 3. ROE 3.5.7p Y o Y 4. Shareholder returns Annual dividend Plan 583 Dividend increase + 47 Acquisition and retirement of treasury stock Plan 26.4bn 1.43mn shares Payout ratio 5. Acquisition and retirement of treasury stock 3. Divided increase for 9 consecutive FY Total return ratio
3 3
4 PL Construction Segment Gross profit margin Operating income margin 31.7% 31.5% [.2p] 17.5% 17.4% [.1p] Gross profit margin Operating income margin 5% 4% 3% 2% 1% % 29.6% 15.2% 31.7% 31.5% Planned 3.6% 17.5% 17.4% Gross profit margin Operating income margin 7 PL Real Estate Segment bn Net sales % Gross profit % Operating income Net sales Gross profit Operating income Planned 869.7bn Planned 76.3bn Planned 32.4 bn Increase due to the change of accounting period of House Leave Co., Ltd. (from Feb. to Mar.) 8 4

![2p] [ ] Gross profit margin Operating income margin 12% 9% 8.](/docs-images/88/117287090/images/5-2.jpg "1% 8.8% 9.1% 6% 3%")
5 PL Real Estate Segment Gross profit margin Operating income margin 8.8% 9.1% [+.3p] 3.6% 3.8% [+.2p] [ ] Gross profit margin Operating income margin 12% 9% 8.1% 8.8% 9.1% 6% 3% 2.9% 3.6% 3.8% % Gross profit margin Operating income margin 9 5
6 PL SG&A expenses bn SG&A expenses % SG&A expenses ratio to sales SG&A expenses SG&A expenses ratio to sales % 11.% [.p] % 11.% 11.% SG&A expenses SG&A expenses ratio to sales Planned bn % [ ] Variance from previous FY 4% 3% 2% 1% 11 Financial Review Consolidated BS bn Current Liabilities Current Liabilities Current Assets 59.7 Fixed Liabilities Current Assets Fixed Liabilities Fixed Assets Total Liabilities Net Assets Fixed Assets Total Liabilities Net Assets Total Assets Total Liabilities & Net Assets Total Assets Total Liabilities & Net Assets % 3, mn shares 2.2bn 35.6% 4, % 1.24mn shares 24.7bn 12 6
7 Financial Review Consolidated CF Cash and cash equivalents at the beginning of FY18/3 Cash flows from operating activities Major breakdown items Net income before income tax bn Payment of income taxes 53.4bn Rent uncollected due to holiday at the end of month etc. 15.2bn Cash flows from investing activities Major breakdown items Acquisition of Hilton Hotel, Malaysia 13.2bn Purchase of new software systems 7.bn Purchase of solar power generation panels 3.2bn Cash flows from financing activities Major breakdown items Borrowing and repayment of long-term loans + 45.bn Payment of dividends 43.9bn Acquisition of treasury stock 27.9bn Cash and cash equivalents at the end of FY18/3 13 Items related to orders received Orders received Amount of Orders received 651.bn.6 Y o Y Amount of orders received throughout each FY bn Amount of orders received in each quarter bn bn Q 2Q 3Q 4Q 1Q 2Q 3Q 4Q 1Q 2Q 3Q 4Q 14 7
8 Items related to orders received Amount of orders received in each region Order received ( bn) Orders received 15 Items related to orders received Amount of orders in hand Orders in hand 895.3bn.1% YoY 1,
9 Items related to orders received Efficiency in acceptance of order 3,313 7 YoY 16.51mn +.16mn YoY 4, 3, 2, 1, 3,42 3, Number of sales representatives Amount of orders received per sales representative 17 Items related to orders received Index Mid-rise ratio Rebuild ratio 21.7%.5p YoY 34.7% +3.p YoY 4% 3% 2% 1% 2.5% 22.2% 21.7% 4% 3% 2% 1% 31.3% 31.7% 34.7% Total rebuild ratio Daito APT rebuild ratio (breakdown) 6.5% 4.5% 4.5% % % 18 9
10 Items related to orders received Index Average price of orders received 1.6mn mn YoY Cancellation ratio 17.7% +.7p YoY % 2% 15.5% 17.% 17.7% 4 1% 2 % 19 Items related to orders received Index Orders received 4,5 4, 3,5 3, 2,5 2, 1,5 1, % 12.5% 83.% 1,446 1,72 1,245 1, % 13.4% 14.1% 92.1% 96.6% 1,55 1, , , % 98.9% 82.7% 82.6% 88.% 82.4% 86.4% 76.3% Q 2Q 3Q 4Q 1Q 2Q 3Q 4Q 1Q 2Q 3Q 4Q 1Q 2Q 3Q 4Q FY17/3 FY18/3 FY17/3 FY18/3 YoY 22% 2% 18% 16% 14% 12% 1% 8% 6% 4% 2% % 2 1
11 Items related to tenancy recruitment Number of tenancy recruitment Number of tenancy recruitment Residential use Commercial use 296, % YoY 293, % YoY 2, % YoY Number of tenancy recruitment YoY 3, 278, ,4 293,34 2, 15.6% 15.6% 15.3% 1, Number of tenancy recruitment YoY 3,112 3, 2,783 2,678 2, 1, 93.3% 89.4% 96.2% Number of tenancy agreements YoY YoY 21 Items related to tenancy recruitment Occupancy rate Continuously maintains sound level of occupancy residential use 96 commercial use 94 Residential use units Commercial use 97.2% +.3p YoY 98.4% +.1p YoY Occupancy ratio 1% 96.8% 96.9% 97.2% 9% Occupancy ratio 1% 98.2% 98.3% 98.4% 9% 8% 8% 7% 7% Rent basis as occupancy rate = 1% - {(Lease fee payment for vacant rental housing) / (Aggregate amount of rent [%])} 22 11
12 Items related to tenancy recruitment Occupancy rate Residential use units Commercial use 98.4% +.5p YoY 97.7% +.1p YoY 1% 9% 97.5% 97.9% 98.4% 22,322 2,451 25, 2, 1% 9% 8% 97.5% 97.6% 97.7% ,2 8 8% 16,949 15, 7% 4 7% 1, Occupancy Vacancy rate unit Number of Vacancy unit Number-based occupancy rate 6% Occupancy Vacancy rate unit Number of Vacancy unit Number-based occupancy rate Number-based as occupancy rate = (Number of occupancy units) / (Number of units under management) 23 Items related to tenant recruitment Number of recruitment 1, 18% 16% Numbers of recuruitment 8, 6, 4, 2, 15.% 14.7% 13.7% 17.3% 19.%16.4% 111.6% 14.2% 3,264 31,214 26,312 43,942 32,996 33,227 29,36 33,82 34,9 29,351 45, % 17.9%12.2% 11.2% 15.4% 11.5% 16.6% 11.2% 51,691 35,623 35,429 31,276 52,329 1Q 2Q 3Q 4Q 1Q 2Q 3Q 4Q 1Q 2Q 3Q 4Q 1Q 2Q 3Q 4Q 14% YoY 12% 1% 8% 6% 4% 2% % 24 12
13 Items related to tenancy recruitment Occupancy rate in each region 1% 75% Continuously maintains high level of occupancy in each region Daito s nationwide average 97.2% 95.% 96.9% 97.1% 96.6% 97.9% 97.2% 97.2% 96.% 97.7% 95.% 97.2% 96.9% 96.% 97.3% 96.8% 97.4% 96.7% 97.4% 5% 25% % Occupancy rate as of March 217 Occupancy rate as of March Financial Forecasts, Year ending in March
14 Forecasts for FY ending in March 219 Consolidated PL Net sales 1,6 1, , ,557. Ordinary Income ,64.bn 17/3 18/3 19/3 plan Forecast increase of sales and income, updating record-high for 11 consecutive FY Operating income +5.3% +1.3% bn 17/3 18/3 19/3 plan Net income attributable to owners of parent +1.1% +2.5% 133.bn bn Y o Y /3 18/3 19/3 plan 17/3 18/3 19/3 plan 27 Forecasts for FY ending in March 219 Forecast of completion bn Net sales % Gross profit % Gross Profit margin ratio : Variance from previous FY bn 4% 6 35% % % 3% 3.8% 29.8% 25% 17/3 18/3 19/3 plan Net sales Gross Profit margin ratio 28 14


15 Forecast of FY ending in March 219 Forecast of orders received 8 6 Forecast of amount of orders received 683.bn +4.9 Y o Y Number of sales representatives at the end of Mar. 219 forecast Amount of orders received per sales representative , Y o Y 16.7mn +.19mn Y to Y 4, 3, 2 3,383 3,313 3, , , /3 18/3 19/3 plan 15 17/3 18/3 19/3 plan Number of sales representatives Amount of orders received per sales representative specialized in support of 29 Forecast of FY ending in March 219 Strategy for receiving orders 3 15


16 Forecast of FY ending in March 219 Strategy for receiving orders First multifamily residential building which fulfills the ZEH standards 31 Forecasts of FY ending in March 219 Forecast of tenancy recruitment Number of tenancy recruitment 296,18 34,5 +2.9% Residential use 293,34 31,9 +2.9% Commercial use 2,678 2,6 2.9% 35, 3, 25, 2, 15, 1, 5, 96.9% 97.2% 97.% 1% 293,34 31,9 278,693 9% 8% 7% 17/3 18/3 19/3 plan Number of tenancy agreements Occupancy rate 1% 5, 98.3% 98.4% 98.4% 4, 9% 3, 2,783 2,678 2,6 2, 8% 1, 7% 17/3 18/3 19/3 plan Number of tenancy agreements Occupancy rate 32 16
17 Shareholders return policy 33 Shareholders return Planned for FY ended in March 218 Divided increase for 9 consecutive FY 34 17
18 Shareholders return Forecast in FY ending in March 219 Shareholder return out of profit for FY ending in March 219 (Forecast) Annual Dividend per share YoY, Payout ratio Breakdown Interim dividend 297 Year-end dividend 298 Acquisition and retirement of treasury stock current net income s ROE Continue Total return Divided increase for 1 consecutive FY 1,5 yen 1, /3 15/3 19/3(plan) 2% 15% 1% 5% %
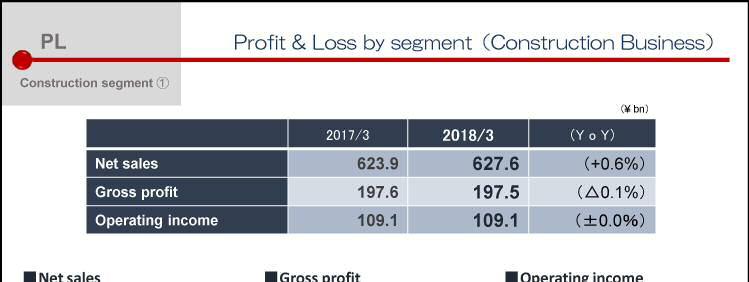
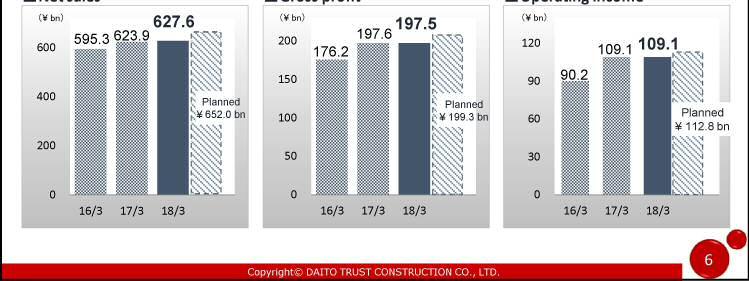
19 Construction business mn 17/3 18/3 19/3(plan) Y o Y(Plan) Net sales 623,91 627, % 663, +5.6% Gross profit 197, ,51.1% 197,3.1% (Gross profit margin) 31.7% 31.5%.2p 29.8% 1.7 Operating income 19,143 19,145.% 15,8 3.1% (Operating income margin) 17.5% 17.4%.1p 16.% 1.4 Real estate business 17/3 18/3 19/3(plan) mn Y o Y(Plan) Net sales 824, , % 92, +5.6% Gross profit 72,71 79, % 83,5 +5.6% (Gross profit margin) 8.8% 9.1% +.3p 9.1%. Operating income 29,621 33, % 37,1 +11.% (Operating income margin) 3.6% 3.8% +.2p 4.% +.2 Other businesses mn 17/3 18/3 19/3(plan) Y o Y(Plan) Net sales 48,551 57, % 57, 1.7% Gross Profit 15,24 2, % 22,4 +9.5% (Gross profit margin) 31.4% 35.3% +3.9p 39.3% +4. Operating income 7,472 1, % 11,7 +7.5% (Operating income margin) 15.4% 18.8% +3.4p 2.5% mn FY 217/3 FY 218/3 Y o Y FY 219/3 Plan Net sales 646, , % 665,6 Construction 623, , % 663, Real estate & others 22,926 7, % 2,6 Gross profit 2,55 196,43 2.1% 196,5 Construction 196, , % 194,8 Real estate & others 3,7 2, % 1,7 SG&A expenses 131, ,32 +.% 134,5 Operating income 68,568 64, % 62, Ordinary Income 85,422 92, % 95, Net income 59,926 69, % 72,
20 mn 217/3 Y o Y 219/3 Plan 217/3 Y o Y 219/3 Plan Net sales 6,664 8, % 8,3 4,758 4, % 5,14 Gross profit % % 281 SG&A expenses Operating income Ordinary Profit % % % % % % 219 Net income % % FY 216/3 FY 217/3 FY 218/3 Amount Ratio Amount Ratio Amount Ratio Y o Y mn Lease up of rental housing units 79,324 (91.5%) 755,2 (91.6%) 798,799 (91.7%) +5.8% Building and repairs 28,794 (3.7%) 26,14 (3.1%) 24,567 (2.8%) 5.6% Brokerage of real estate 16,213 (2.1%) 17,652 (2.1%) 16,964 (1.9%) 3.9% Rent Guarantee business 6,431 (.8%) 9,72 (1.2%) 1,954 (1.3%) +12.9% Electricity Business 4,288 (.6%) 6,119 (.7%) 7,311 (.8%) +19.5% Leasing Business 2 6,55 (.8%) 6,266 (.8%) 6,71 (.7%) 3.1% Others 3,7 (.5%) 3,884 (.5%) 6,719 (.8%) +73.% Total 774,87 (1.%) 824,642 (1.%) 871,388 (1.%) +5.7% 4 2
21 Real estate business mn 217/3 19/3 Plan 217/3 19/3 Plan Net sales 792, , % 881,7 15,766 21,7 Gross profit 56,981 61, % 62,3 6,615 9,4 SG&A Expenses Operating income Ordinary income 18,77 22, % 21,8 68 4,953 7,2 38,273 39, % 4,5 68 1,662 2,2 41,875 44, % 45,6 68 1,773 3, 29,588 31, % 32,4 68 1,184 2, It changed its trade name from Daito Building Management Co.,Ltd. on April 1, 217. Established in November 216, started full-scale activities from the end of May mn Real estate business House Leave 217/3 19/3 Plan 217/3 219/3 Plan Net sales 9,72 1, % 12,732 1,19 1, % 11,355 Gross profit 9,11 1, % 11,745 9,92 1, % 1,99 SG&A Expenses Operating income Ordinary income 1,428 2, % 3,852 8,973 9, % 9,813 7,681 7,29 5.1% 7, , % 1,96 7,692 7, % 7,897 1,177 1, % 1,344 5,28 4, % 5, %
22 Net Other businesses (Financial business Daito Finance House Guard D.T.C mn 217/3 217/3 217/3 Net sales 1,391 1, % 1,332 1,964 2, % 2,829 3,334 3,328.2% 3,359 Gross profit 1,85 1, % 1, , % 1,323 1,355 1, % 1,351 SG&A expenses Operating Income Ordinary Income % % 1, % , % ,338 1, % 1, , % ,353 1,15 15.% 1, % ,353 1,15 15.% 1, mn Other businesses Gas supply business Care business Gaspal Group Care Partner 217/3 217/3 Net sales 23,596 25, +5.9% 27,231 11,411 11, % 11,736 Gross profit 9,621 1, % 11,873 1,31 1, % 1,173 SG&A Expenses Operating Income Ordinary income 5,816 6, % 7, % 1,23 3,85 4, % 4, % 15 3,752 4, % 4, % , % 3, %
23 mn Other businesses Energy business Overseas business Daito Energy 217/3 217/3 217/3 Net sales 4,59 11, % 4,219 2,69 3, % 3, ,584 Gross profit SG&A Expenses Operating Income Ordinary income % 168 1,144 1, % 1, , % , % 1, , % person 5, 4, 3, 2, 1, End of March 217 End of March 218 End of March 219 Plan Sales representatives in construction business Engineers Sales representatives in real estate business Total employees right axis 15, 14, 13, 12, 11, 1, 9, Total employees 13,17 13, ,22 Sales representative in construction business 3,383 3, ,47 Engineers 3,243 3, ,58 Sales representative in real estate business 1,136 1, ,


24 bn % % 63.4% 67.5% 8% 6% 2 4% 1 2% % Amount of orders received from repeater Composition ratio of repeat Composition ratio of repeat Number of orders received from repeater Total number of orders received 47 24

25 Rent-based occupancy rate Residential use Commercial use Rent-based occupancy rate 14/3 15/3 Y o Y 96.9% 96.7% 96.8% 96.9% 97.2% +.3p 96.8% 97.9% 98.2% 98.3% 98.4% +.1p , number of units under management aggregate amount of managed rent (monthly average) number of units under management aggregate amount of managed rent (monthly average) 5 25
26 Japan Housing, Finance 5.6% Agency, 9.3%, Major 7.8% national, banks, 11.% 11.4% 17/3 Agricultural/Fisheries Others, Cooperative, 5.1% 2.%, 1.5% Regional banks, 6.7%, 6.% Agricultural/Fisheries Cooperative, 6.7% Major national banks, 1.5% Shinkin banks, 11.% FY18/3 Others, 2.8% Regional banks, 54.8% Shinkin Japan Housing, banks, 14.1% 11.5% Finance Agency, 14.2% The amount 969.7bn The amount 914.5bn
27 53. Disclaimer of warranties for the contents Daito pays careful attention about the information carried on this documents. However, Daito can not offer the guarantee about the accuracy, reliability, safety, etc. Please recognize the information about future forecast that Daito may offer is prediction of Daito at a certain time and is uncertain.. Copyright etc. All the information offered on this documents is protected by the law of the Copyright Act and others. Quotation, reproduction and the duplicate without Daito's authorization are prohibited
Ⅰ.Results in FY ending in March Ⅱ.Forecasts in FY ending in March Ⅲ.Shareholders Return Policy 34. Ⅳ.
 Report on Settlement of Accounts for FY ending in March 31 216 Financial Highlights, Year ending in March 31, 216 1 Contents Ⅰ.Results in FY ending in March 216 3 Ⅱ.Forecasts in FY ending in March 217
Financial Highlights, Year ended March 31, 2012
 Financial Highlights, Year ended March 31, 212 Contents Ⅰ.Financial Results 3 Ⅱ.Financial Forecasts 11 Ⅲ.Mid-term Plan 21 Ⅳ.Topics 24 Ⅴ.Appendix 27 Ⅰ. Financial results Ⅰ-1 Financial highlights Increase
45 th Term. Three Months (1st quarter) ended DAITO REPORT CONTENTS
 ended DAITO REPORT CONTENTS") th Term Three Months (st quarter) ended DAITO REPORT CONTENTS P P P P P P7 P8 TO OUR SHAREHOLDERS Naomi Kumakiri President and Representative Director, Chief Executive Officer Daito Trust Construction
th Term Three Months (st quarter) ended DAITO REPORT CONTENTS P P P P P P7 P8 TO OUR SHAREHOLDERS Naomi Kumakiri President and Representative Director, Chief Executive Officer Daito Trust Construction
ORIX Reports Annual Consolidated Financial Results for the Fiscal Year Ended March 31, 2018
 ORIX Reports Annual Consolidated Financial Results for the Fiscal Year Ended March 31, 218 313.1bn yen in Net Income, up 15% YoY Net Income Increased for the ninth Consecutive Year New Record Net Income
Consolidated Financial Results
 ORIX Corporation (TSE: 8591; NYSE: IX) Consolidated Financial Results For the Consolidated Fiscal Year Ended March 31, 2013 May 10, 2013 Haruyuki Urata Shintaro Agata Takao Kato Deputy President & CFO
2: The supplied housing business contributed to earnings. The Company s sound supplied stocks bolstered its performance.
 Sekisui House, Ltd. Third Quarter of (February 1, through October 31, ) Summary of Consolidated Financial Results 1. Topics in the Third Quarter 2. Overview 3. Segment Information 1. Sales and Orders 2.
ORIX Reports Annual Consolidated Financial Results for the Fiscal Year Ended March 31, 2016
 ORIX Reports Annual Consolidated Financial Results for the Fiscal Year Ended March 31, 2016 260.2bn yen in Net Income, up 11% YoY Net Income Increased for the Seventh Consecutive Year New Record High Net
Asset Managers Holdings. February 2010 Fiscal Year (March 2009 February 2010) Corporate Presentation
 Corporate Presentation") Asset Managers Holdings February 2010 Fiscal Year (March 2009 February 2010) Corporate Presentation April 26, 2010 Laying the Foundation for Stable, Long-term Growth Corporate Name Change to Ichigo Group
Asset Managers Holdings February 2010 Fiscal Year (March 2009 February 2010) Corporate Presentation April 26, 2010 Laying the Foundation for Stable, Long-term Growth Corporate Name Change to Ichigo Group
Consolidated Financial Results
 ORIX Corporation (TSE: 8591; NYSE: IX) Consolidated Financial Results For the Consolidated Fiscal Year Ended March 31, 2013 May 10, 2013 Copyright 2013 ORIX Corporation All rights reserved. Disclaimer
Star Asia Investment Corporation
 3468 Tokyo Stock Exchange REIT Analyst Hideo Kakuta Index Summary----------------------------------------------------------------------------------------------------------------------------------------------------------------------------
Result Review on 2 nd Qtr of Fiscal 2017 that ends in March October 27, 2017
 Result Review on 2 nd Qtr of Fiscal 217 that ends in March 218 October 27, 217 Table of contents Overview of Consolidated Financial Results Financial Summary Total Revenues Commissions Trading Profit and
Matsui Securities Co., Ltd.
 Matsui Securities Co., Ltd. (First Section of TSE: 8628) Annual Results for FY217 January 218 Table of Contents Section 1 Financial Summary 6 Section 2 Results of Operation 16 Section 3 Recent Developments
ORIX Reports Annual Consolidated Financial Results for the Fiscal Year Ended March 31, 2015
 ORIX Reports Annual Consolidated Financial Results for the Fiscal Year Ended March 31, 215 234.9bn yen in Net Income, up 25% YoY Net Income Increased for the Sixth Consecutive Year New Record High Net
ORIX Corporation (TSE: 8591; NYSE: IX)
") ORIX Corporation (TSE: 8591; NYSE: IX) Consolidated Financial Results First Quarter Consolidated Financial Results For the Three Month Period Ended April 1 June 30, 2012 Haruyuki Urata Shintaro Agata Takao
ORIX Corporation (TSE: 8591; NYSE: IX) Consolidated Financial Results First Quarter Consolidated Financial Results For the Three Month Period Ended April 1 June 30, 2012 Haruyuki Urata Shintaro Agata Takao
FY19/2 Q1 Earnings. Operating Profit (JPY million) YOY. Net Assets per Equity Ratio (JPY million) (JPY million)
 YOY. Net Assets per Equity Ratio (JPY million) (JPY million)") Ichigo Preserves and Improves Real Estate [Provisional Translation Only] This English translation of the original Japanese document is provided solely for information purposes. Should there be any discrepancies
Ichigo Preserves and Improves Real Estate [Provisional Translation Only] This English translation of the original Japanese document is provided solely for information purposes. Should there be any discrepancies
ORIX Corporation. Consolidated Financial Results For the Consolidated Fiscal Year Ended March 31, May 16, 2017 (TSE: 8591; NYSE: IX)
") ORIX Corporation Consolidated Financial Results For the Consolidated Fiscal Year Ended March 31, 2017 Makoto Inoue Kazuo Kojima President & CEO Deputy President & CFO May 16, 2017 (TSE: 8591; NYSE: IX)
ORIX Corporation Consolidated Financial Results For the Consolidated Fiscal Year Ended March 31, 2017 Makoto Inoue Kazuo Kojima President & CEO Deputy President & CFO May 16, 2017 (TSE: 8591; NYSE: IX)
Trends of Major Performance Indicators. Trend in Net Income (JPY Bn) Segment Profits Breakdown ( )
 Segment Profits Breakdown ( )") ORIX Reports Consolidated Financial Results for Q2 FY2016.3 161.3bn yen in Net Income, up 14% YoY, Profit Growth for the Same Period for Six Consecutive Fiscal Years New Record Total Revenues and Net Income
ORIX Reports Consolidated Financial Results for Q2 FY2016.3 161.3bn yen in Net Income, up 14% YoY, Profit Growth for the Same Period for Six Consecutive Fiscal Years New Record Total Revenues and Net Income
Financial Results for FY2017 and Forecasts for FY2018. May 9, 2018 NTT Urban Development Corporation
 Financial Results for FY2017 and Forecasts for FY2018 May 9, 2018 NTT Urban Development Corporation Financial Results for FY2017(J GAAP) While operating revenue and income declined due to a fall in sales
ORIX Corporation. Consolidated Financial Results For the Consolidated Fiscal Year Ended March 31, May 16, 2017 (TSE: 8591; NYSE: IX)
") ORIX Corporation Consolidated Financial Results For the Consolidated Fiscal Year Ended March 31, 2017 Makoto Inoue Kazuo Kojima President & CEO Deputy President & CFO May 16, 2017 (TSE: 8591; NYSE: IX)
ORIX Corporation Consolidated Financial Results For the Consolidated Fiscal Year Ended March 31, 2017 Makoto Inoue Kazuo Kojima President & CEO Deputy President & CFO May 16, 2017 (TSE: 8591; NYSE: IX)
ORIX Corporation (TSE: 8591; NYSE: IX)
") ORIX Corporation (TSE: 8591; NYSE: IX) Consolidated Financial Results First Quarter Consolidated Financial Results For the Three Month Period Ended April 1 June 30, 2012 Haruyuki Urata Shintaro Agata Takao
ORIX Corporation (TSE: 8591; NYSE: IX) Consolidated Financial Results First Quarter Consolidated Financial Results For the Three Month Period Ended April 1 June 30, 2012 Haruyuki Urata Shintaro Agata Takao
<Consolidated> Financial Results (FY2012 vs. FY2011)
") Reference Materials Results Consolidated Financial Results (FY2012 vs. FY2011) P.1 Non-consolidated Financial Results (FY2012 vs. FY2011) P.2 Key Indices of Business Activities (FY2012 vs. FY2011) P.3
Reference Materials Results Consolidated Financial Results (FY2012 vs. FY2011) P.1 Non-consolidated Financial Results (FY2012 vs. FY2011) P.2 Key Indices of Business Activities (FY2012 vs. FY2011) P.3
STARTIA, INC Tokyo Stock Exchange First Section
 Company Research and Analysis Report FISCO Ltd. http://www.fisco.co.jp 伪伪 In the middle of shifting gears towards the achievement of the new middle term plan and the growth after the plan. Startia
COMPANY RESEARCH AND ANALYSIS REPORT. Prospect Co., Ltd. Tokyo Stock Exchange Second Section. 13-Nov FISCO Ltd. Analyst.
 3528 Tokyo Stock Exchange Second Section Analyst Noboru Terashima Index Summary----------------------------------------------------------------------------------------------------------------------------------------------------------------------------
Consolidated Financial Results of Fiscal Year 2017
 Consolidated Financial Results of Fiscal Year 2017 Company name: DISCO Corporation Stock code number: 6146 (Tokyo Stock Exchange 1st Section) URL: http://www.disco.co.jp Telephone number: 81-3-4590-1099
Financial Results for FY2017 and Strategy
 Financial Results for FY2017 and Strategy Recruit Holdings Co., Ltd. Masumi Minegishi President, CEO, and Representative Director Keiichi Sagawa CFO and Senior Managing Corporate Executive Officer May
FY2016 1Q Topics. Future forecasts We will strive to set record highs in revenue and operating income for the fourth consecutive year.
 Topics Business performance Revenue and operating income for set new record highs Revenue: 61 billion (+110.3% YOY) Operating income: 8.5 billion (+211.7% YOY) Profit attributable to owners of parent 5.3
TOREX SEMICONDUCTOR LTD. ( 6616 TSE 1st Section )
") TOREX SEMICONDUCTOR LTD. ( 6616 TSE 1st Section ) Overall Management Indicator Based on the data as of May 218 June 15, 218 ( All 29 sectors ) Score Ranking Score (5 as average in all companies) 3 4 5
TOREX SEMICONDUCTOR LTD. ( 6616 TSE 1st Section ) Overall Management Indicator Based on the data as of May 218 June 15, 218 ( All 29 sectors ) Score Ranking Score (5 as average in all companies) 3 4 5
million yen % (39.5) 10.2 million yen 8,855 8,654
 10.2 million yen 8,855 8,654") Fiscal Year Ended December 2007 Financial Results (Non-consolidated) February 18, 2008 Corporate Name: AIRTECH JAPAN, LTD. Stock Exchange Listing: Tokyo Stock Exchange Stock Code: 6291 URL: http://www.airtech.co.jp
Fiscal Year Ended December 2007 Financial Results (Non-consolidated) February 18, 2008 Corporate Name: AIRTECH JAPAN, LTD. Stock Exchange Listing: Tokyo Stock Exchange Stock Code: 6291 URL: http://www.airtech.co.jp
Q1/FY2017 Supplemental IR information
 Q1/FY2017 Supplemental IR information (FYE March 2018) August 7, 2017 FUJI OIL HOLDINGS INC. Table of Contents 1 Q1/FY2017 profit and loss summary 3 2 Q1/FY2017 Key points of financial accounting 3 3 Q1/FY2017
Ⅰ.Results in FY ended in March 31, Ⅱ.Forecasts of FY ending in March 31, Ⅳ.Shareholder Return Policy 36
 Report on Settlement of Accounts for FY ended in March 31 217 Financial Highlights, Year ended in March 31, 217 1 Contents Ⅰ.Results in FY ended in March 31,217 3 Ⅱ.Forecasts of FY ending in March 31,218
Consolidated Financial Statements (Japanese Accounting Standard) November 10, 2017 (For the six months ended September 30, 2017)
 November 10, 2017 (For the six months ended September 30, 2017)") Consolidated Financial Statements (Japanese Accounting Standard) November 10, 2017 (For the six months ended September 30, 2017) Name of Company Listed: Leopalace21 Corporation Stock Listing: Tokyo Stock
Consolidated Financial Statements (Japanese Accounting Standard) November 10, 2017 (For the six months ended September 30, 2017) Name of Company Listed: Leopalace21 Corporation Stock Listing: Tokyo Stock
Financial Results for the Fiscal Year ended March 2018 AIFUL CORPORATION
 Financial Results for the Fiscal Year ended March 2018 AIFUL CORPORATION May, 2018 Financial Results Summary (Consolidated) Business Situation Forecast for the FY2019/3 Financial Results of AIFUL Financial
FY2010 Earnings & EV Results
 FY2010 Earnings & EV Results May 12, 2011 This document is intellectual property of Samsung Life. Therefore, it is strictly prohibited to copy or send to outside of your organization without formal permission
Ichigo Group Holdings Co., Ltd. (2337)
") Feb. 2012 Fiscal Year (March 2011 February 2012) Corporate Presentation Ichigo Group Holdings Co., Ltd. (2337) April 26, 2012 2012 Ichigo Group Holdings Co., Ltd. All rights reserved. www.ichigo-holdings.co.jp/english
Feb. 2012 Fiscal Year (March 2011 February 2012) Corporate Presentation Ichigo Group Holdings Co., Ltd. (2337) April 26, 2012 2012 Ichigo Group Holdings Co., Ltd. All rights reserved. www.ichigo-holdings.co.jp/english
Consolidated Financial Highlights
 Disclaimer Regarding Forward-looking Statements Any statements in this document, other than those of historical fact, are forward-looking statements about the future performance of Eizo and its group companies,
Medium-Term Business Plan (Revised Version) Year ended March 31, 2016 ~ Year ending March 31, 2018
 Year ended March 31, 2016 ~ Year ending March 31, 2018") Medium-Term Business Plan (Revised Version) March 31, 2016 ~ August, 2016 Medium-term Business Plan -M1 Trust 2018 - Background to Revision of the Plan 1) Changes in market conditions surrounding the generics
Medium-Term Business Plan (Revised Version) March 31, 2016 ~ August, 2016 Medium-term Business Plan -M1 Trust 2018 - Background to Revision of the Plan 1) Changes in market conditions surrounding the generics
ORIX Corporation. First Quarter Consolidated Financial Results For the Three-Month Period Ended June 30, Hitomaro Yano
 ORIX Corporation First Quarter Consolidated Financial Results For the Three-Month Period Ended June 3, 218 1 Hitomaro Yano July 3, 218 Director Executive Officer Head of Treasury and Accounting Headquarters
Japan Securities Finance Co., Ltd.
 8511 Tokyo Stock Exchange First Section Analyst Nozomu Kunishige Index Summary----------------------------------------------------------------------------------------------------------------------------------------------------------------------------
COMPANY RESEARCH AND ANALYSIS REPORT. Prospect Co., Ltd. Tokyo Stock Exchange Second Section. 8-Jun FISCO Ltd. Analyst.
 3528 Tokyo Stock Exchange Second Section Analyst Noboru Terashima Index Summary----------------------------------------------------------------------------------------------------------------------------------------------------------------------------
Matsui Securities Co., Ltd.
 Matsui Securities Co., Ltd. (First Section of Tokyo Stock Exchange: 8628) Financial Results for 1H FY25 November 25 Contents Section 1 Highlights of 1H FY25 2 Section 2 Summary of Financial Results (Consolidated)
3 rd Quarter FY2018. Financial Results. ended Dec. 31, 2017
 3 rd Quarter FY2018 Financial Results ended Dec. 31, 2017 1. 3 rd Quarter FY2018 Financial Results 2. FY2018 Financial Forecasts 1-1) Overview of 3 rd Quarter Financial Results
FACTBOOK For the fiscal year ended March 31, 2014
 Hakuten CO., LTD. 2173/JASDAQ FACTBOOK For the fiscal year ended March 31, 214 CONTENTS Corporate Profile 1 Business Overview 4 Medium-Term Management Plan 6 Nonconsolidated Balance Sheet 8 Nonconsolidated
Reference Materials. Page. Results
 Results Reference Materials Consolidated Financial Results (FY2014 vs. FY2013) P.1 Balance Sheet (as of March 31, 2015 vs. as of March 31, 2014) P.2 Non-consolidated Financial Results (FY2014 vs. FY2013)
Summary of Consolidated Financial Results For the Fiscal Year Ended September 30, 2015 Based on Japanese GAAP
 Note: Please note that this document is a Japanese-English translation of the summary of the official announcement in Japanese Kessan Tanshin for reference purposes only. Summary of Consolidated Financial
Results for the Fiscal Year Ended March May 18, 2017
 Results for the Fiscal Year Ended March 2017 May 18, 2017 Copyright 2017 JAPAN POST BANK CO., LTD. All Rights Reserved. 1 Table of Contents 1. Overview of FY2017/3 Results Overview of Business Results
FY 3/2018 Financial Overview and FY 3/2019 Forecast. (Information meeting for fiscal year ended March 31, 2018)
") FY 3/2018 Financial Overview and FY 3/2019 Forecast (Information meeting for fiscal year ended March 31, 2018) May 14, 2018 Contents 1 FY3/18 Results FY3/19 Forecast 1. Summary 2. Segment Sales and Recurring
FY 3/2018 Financial Overview and FY 3/2019 Forecast (Information meeting for fiscal year ended March 31, 2018) May 14, 2018 Contents 1 FY3/18 Results FY3/19 Forecast 1. Summary 2. Segment Sales and Recurring
Sales: Billion, up 44% YoY Ordinary Income: 3.17 Billion, up 34% YoY (Compares with 25% YoY Growth in Previous Interim)
") 8th Term Interim FY12/07 Earnings Announcement Presentation August 10th, 2007 en-japan inc. (Stock Code: 4849) 8 th Term Interim FY12/07 Highlights Our First Time to Achieve 10 Billion in Sales During
8th Term Interim FY12/07 Earnings Announcement Presentation August 10th, 2007 en-japan inc. (Stock Code: 4849) 8 th Term Interim FY12/07 Highlights Our First Time to Achieve 10 Billion in Sales During
dex.html Nobuhito Inatsuki, Executive Director
 (REIT) Financial Report for the Fiscal Period Ended August 2018 October 17, 2018 REIT Securities Issuer: REIT Investment Corporation Listing: Tokyo Stock Exchange Securities Code: 3488 URL: https://xymaxreit.co.jp/en/in
Financial Results for the Second Quarter Ended September 30, 2013 (FY13 Q1-Q2)
") Financial Results for the Second Quarter Ended September 30, 2013 (FY13 Q1-Q2) October 29, 2013 OMRON Corporation Omron Corporation Contents 1. FY13 1H (Q1-Q2) Results & Full-Year Forecast FY13 1H Results
Financial Results for the Second Quarter Ended September 30, 2013 (FY13 Q1-Q2) October 29, 2013 OMRON Corporation Omron Corporation Contents 1. FY13 1H (Q1-Q2) Results & Full-Year Forecast FY13 1H Results
B-Lot Company Limited
 3452 TSE Mothers Analyst Hideo Kakuta Index Summary--------------------------------------------------------------------------------------------------------------------------------------------------------------------------
Financial Results for 2Q FY2018 (September 1, 2017 November 30, 2017) January 11, 2018
 January 11, 2018") Financial Results for 2Q FY2018 (September 1, 2017 November 30, 2017) January 11, 2018 2Q FY2018 Financial Results Basic policy of the mid-term management plan (FY2016 to FY2018) formulated to achieve
Financial Results for 2Q FY2018 (September 1, 2017 November 30, 2017) January 11, 2018 2Q FY2018 Financial Results Basic policy of the mid-term management plan (FY2016 to FY2018) formulated to achieve
Bupa Arabia for Cooperative Insurance Co. Insurance BUPA ARABIA 8210.SE
 Jan-17 Jan-17 Feb-17 Mar-17 Apr-17 May-17 Jun-17 Jul-17 Aug-17 Sep-17 Oct-17 Nov-17 Dec-17 Bupa Arabia for Cooperative Insurance Co. Recommendation Overweight Current Price (SAR) 91.95 Target Price (SAR)
Ichigo Group Holdings Co., Ltd. (2337)
") Feb. 2012 Fiscal Year H1 (March 2011 August 2011) Corporate Presentation Ichigo Group Holdings Co., Ltd. (2337) October 20, 2011 www.ichigo-holdings.co.jp/english Creating peace of mind through honest
Feb. 2012 Fiscal Year H1 (March 2011 August 2011) Corporate Presentation Ichigo Group Holdings Co., Ltd. (2337) October 20, 2011 www.ichigo-holdings.co.jp/english Creating peace of mind through honest
Consolidated Financial Highlights. Fiscal Year Ended Mar 31, 2006
 Consolidated Financial Highlights Fiscal Year Ended Mar 31, 2006 Table of Contents 1. Consolidated Statements of Income 2. Consolidated Balance Sheets 3. Selling, general and administrative expenses 4.
Consolidated Financial Results for 3Q FY2018
 Consolidated Financial Results for 3Q FY2018 February 1, 2019 Fuji Electric Co., Ltd. 2019 Fuji Electric Co., Ltd. All rights reserved. 1 Summary of Consolidated Financial Results for (Apr. - Dec.) FY2018
Yuexiu REIT (405 HK)
") Equity Research Property Yuexiu REIT (405 HK) Buy (initiation) Target price: HK$5.90 Premium investment property portfolio, attractive dividend yield; initiate at Buy First HK-listed China property REIT,
Equity Research Property Yuexiu REIT (405 HK) Buy (initiation) Target price: HK$5.90 Premium investment property portfolio, attractive dividend yield; initiate at Buy First HK-listed China property REIT,
Ichigo Group Holdings Co., Ltd. (2337)
") Feb. 2012 Fiscal Year Q1 (March 2011 May 2011) Corporate Presentation Ichigo Group Holdings Co., Ltd. (2337) July 21, 2011 www.ichigo-holdings.co.jp/english Creating peace of mind through honest and committed
Feb. 2012 Fiscal Year Q1 (March 2011 May 2011) Corporate Presentation Ichigo Group Holdings Co., Ltd. (2337) July 21, 2011 www.ichigo-holdings.co.jp/english Creating peace of mind through honest and committed
Financial Results for First Quarter FY2018
 Financial Results for First Quarter August 3, 2018 2018 MITSUBISHI HEAVY INDUSTRIES, LTD. All Rights Reserved. Table of Contents I. Financial Results - Summary of Financial Results 3 - Financial Results
Financial Highlignts for the Fiscal Year ended March 31, 2011
 May 12, 2011 Financial Highlignts for the Fiscal Year ended March 31, 2011 Meitec Corporation 1. Consolidated Operating Results for the Fiscal Year ended March 31, 2011 (1) Net Sales and Income Net Sales
Revenue and income set record highs for the fifth consecutive year. Revenue reached more than 300 billion on the 20th anniversary of the foundation.
 Revenue and income set record highs for the fifth consecutive year. Revenue reached more than 300 billion on the 20th anniversary of the foundation. Revenue: Ordinary income: Profit attributable to owners
Consolidated Financial Results FY2013/03 for the year Ended March 31, 2013
 May 14, 2013 Consolidated Financial Results FY2013/03 for the year Ended March 31, 2013 0 Disclaimer This presentation contains current plans, expectations and strategies, which include forward-looking
Samsung SDS 1Q15 Earnings Release. April 2015
 Samsung SDS 1Q15 Earnings Release April 2015 Disclaimer The financial information in this document are consolidated earnings results based on K-IFRS. This document is provided for the convenience of investors
Materials for FY2014 2Q Results Briefing - Conference Call
 Materials for 2Q Results Briefing - Conference Call Nov. 19, 2014 (Wed) Contents Summary of FY 2014 2Q Results Consolidated Earnings for FY 2014 2Q Page 1-3 Domestic Non-life Insurance Companies Page 4-8
Internet Disclosure Information in Connection with the Notice of the 67th General Meeting of Shareholders
 This notice has been translated from the original notice in Japanese. In the event of any discrepancy, the original notice in Japanese shall prevail. Internet Disclosure Information in Connection with
11-Year Consolidated Financial Highlights
 11-Year Consolidated Financial Highlights As of March 31, 2017 2007.3 2008.3 2009.3 2010.3 Net Sales ( million) 1,376,958 1,487,496 1,660,162 1,415,718 Operating Profit ( million) 162,315 70,048 65,204
The 39th Information Meeting The 30th Long-Term Management Plan Change to the bank creating regional vitality (April 2015 ~ March 2018)
") The First Section of Tokyo Stock Exchange: 8359 The 39th Information Meeting The 3th Long-Term Management Plan Change to the bank creating regional vitality (April 215 ~ March 218) May 18, 217 This document
The First Section of Tokyo Stock Exchange: 8359 The 39th Information Meeting The 3th Long-Term Management Plan Change to the bank creating regional vitality (April 215 ~ March 218) May 18, 217 This document
Financial Results for the year ended 31 st March, 2008 and Financial Results Forecast for the year ending 31 st March, 2009
 Financial Results for the year ended 31 st March, 2008 and Financial Results Forecast for the year ending 31 st March, 2009 April 24, 2008 Akihisa Fujinuma, Chairman and President, CEO&COO Contents 1.
ORIX Corporation. First Quarter Consolidated Financial Results For the Three-Month Period Ended June 30, 2017
 ORIX Corporation First Quarter Consolidated Financial Results For the Three-Month Period Ended June 3, 217 Kazuo Kojima Deputy President & CFO Shintaro Agata Corporate Executive Vice President, Head of
ORIX Corporation. Second Quarter Consolidated Financial Results For the Six-Month Period Ended September 30, 2018
 ORIX Corporation Second Quarter Consolidated Financial Results For the Six-Month Period Ended September 30, 2018 Makoto Inoue Director, Representative Executive Officer President & CEO 1 October 29, 2018
February 5, 2015 Sojitz Corporation
 Financial for the Third Quarter Ended December 31, 2014 (Reference) February 5, 2015 Sojitz Corporation Index I. Financial for the Third Quarter and Full Year Forecast of Fiscal Year Ending March 31, 2015
Topics. 1. Full Year FY2017 Performance P Q FY2017 Performance P FY2018 Consolidated Performance Forecast & Shareholder returns
 Topics 1. Full Year FY2017 Performance P.2 2. 4Q FY2017 Performance P.14 3. FY2018 Consolidated Performance Forecast & Shareholder returns P.23 4. Business Overview P.26 5. Supplementary Materials P.44
Briefing Material for 1Q Results of the Fiscal Year Ending March 2015
 Briefing Material for 1Q Results of the Fiscal Year Ending March 2015 NIPPON EXPRESS CO., LTD. IR Group, Corporate Planning Division July 31, 2014 A. of 1Q C. Proportion of sales from overseas-related
Financial Results for FY2018 3Q
 Financial Results for FY218 3Q 218 OSG Corporation October, 218 OSG Corporation Contents Operating Income with graphics OSG at a glance Overseas sales ratio Financial summary Net sales by product segment
27 July 2018 Interim Results
 27 July 2018 Interim Results for the half year ended 30 June 2018 Disclaimer This presentation may contain forward-looking statements, including forward-looking statements within the meaning of the United
Business performance <FY2018>
 Business performance Revenue and profits set record highs for the sixth consecutive year. Revenue: 390.7 billion (+28.3% YOY) Operating income: 46.0 billion (+27.5% YOY) Profit attributable to owners
ORIX Corporation. Consolidated Financial Results For the Consolidated Fiscal Year Ended March 31, 2018
 ORIX Corporation Consolidated Financial Results For the Consolidated Fiscal Year Ended March 31, 218 1 Makoto Inoue Kazuo Kojima Hitomaro Yano May 1, 218 Director, Representative Executive Officer President
Flash Report for the Fiscal Year Ended December 31, 2016 [Japan GAAP] (on a consolidated basis) February 13, 2017
![Flash Report for the Fiscal Year Ended December 31, 2016 [Japan GAAP] (on a consolidated basis) February 13, 2017](/thumbs/95/123620510.jpg "Flash Report for the Fiscal Year Ended December 31, 2016 [Japan GAAP] (on a consolidated basis) February 13, 2017") Flash Report for the Fiscal Year Ended December 31, 2016 [Japan GAAP] (on a consolidated basis) February 13, 2017 Company Name: OPT Holding, Inc. Stock Exchange Listing: Tokyo Stock Code: 2389 URL http://www.opt.ne.jp/english/holding/
Flash Report for the Fiscal Year Ended December 31, 2016 [Japan GAAP] (on a consolidated basis) February 13, 2017 Company Name: OPT Holding, Inc. Stock Exchange Listing: Tokyo Stock Code: 2389 URL http://www.opt.ne.jp/english/holding/
Resona Holdings, Inc. Consolidated Financial Results for Fiscal Year 2016 (April 1, March 31, 2017/ Unaudited) <under Japanese GAAP>
 <under Japanese GAAP>") May 12, 2017 Resona Holdings, Inc. Consolidated Financial Results for Fiscal Year 2016 (April 1, 2016 - March 31, 2017/ Unaudited) Code number: 8308 Stock exchange listings: Tokyo
May 12, 2017 Resona Holdings, Inc. Consolidated Financial Results for Fiscal Year 2016 (April 1, 2016 - March 31, 2017/ Unaudited) Code number: 8308 Stock exchange listings: Tokyo
Results Briefing. For the Year Ended March 31, May 16, 2017
 Results Briefing For the Year Ended March 31, 2017 May 16, 2017 *NOTICE: This document is a translation of the original Japanese document and is only for reference purposes. In the event of any discrepancy
Consolidated Financial Results for the Fiscal Year Ended March 31, 2018 Japanese GAAP
 This document has been translated from the Japanese original "Kessan Tanshin" disclosed at the Tokyo Stock Exchange on May 14, 2018 and prepared for reference purpose only. In the event of any discrepancy
FY2016 Financial Results
 FY2016 Financial Results President Keiichi Kobayashi Director, Corporate Executive Vice President General Manager, the Finance & Procurement Division and General Manager, Global Group Management Division
The Company for Cooperative Insurance Insurance TAWUNIYA AB 8010.SE
 Apr-17 May-17 Jun-17 Jul-17 Aug-17 Sep-17 Oct-17 Nov-17 Dec-17 Jan-18 Feb-18 Mar-18 Apr-18 Recommendation Overweight Current Price (SAR) 82.60 Target Price (SAR) 101.13 Upside/Downside (%) 22.4% As of
Financial Highlights for the Fiscal Year ended March 31, 2012
 (Note) This document has been translated from the Japanese original for reference purposes only. In the event of any discrepancy between this translation and the Japanese original, the original shall prevail.
ZENKOKU HOSHO Co., Ltd.
 Financial Results for the Six Months Ended September 30, 2016 ZENKOKU HOSHO Co., Ltd. November 2016 Table of Contents I. Overview of Financial Results P 3 II. Future Prospects P 10 1 Summary of Business
February 2, 2018 Sojitz Corporation
 Financial for the Third Quarter Ended December 31, 2017 (Reference) February 2, 2018 Sojitz Corporation Index I. Summary of Financial for the Third Quarter Ended December 31, 2017 II. Financial for the
4Q FY2017 Earnings Announcement
 Daiwa Securities Group 4Q Earnings Announcement April 27, 218 This presentation may contain forward-looking statements about the Daiwa Securities Group. You can identify these statements by the fact that
FY12/13 Financial Results and Follow-up Interview
 2427 TSE1 OUTSOURCING Inc. Financial Results and Follow-up Interview OUTSOURCING Inc., hereinafter the Company or OS Group, announced its business results, and Trias Corporation conducted an interview
Leopalace21 Corporation
 Explanatory Session the Fiscal Year Ended March 27 May 27 Leopalace21 Corporation This document and reference materials may contain ward-looking statements, so please understand that actual results may
MIROKU JYOHO SERVICE 9928 Tokyo Stock Exchange First Section
 Company Research and Analysis Report FISCO Ltd. http://www.fisco.co.jp 伪伪 Sustainable Growth and Establishment of a New Earnings Foundation Drive Record Earnings Miroku Jyoho Service Co., Ltd. (hereafter
Profit attributable to owners of parent. Year-on-year change [%]
![Profit attributable to owners of parent. Year-on-year change [%]](/thumbs/89/101180473.jpg "Profit attributable to owners of parent. Year-on-year change [%]") Summary of Consolidated Financial Statements for the Second Quarter Fiscal 2018 (JPGAAP) October 31, 2018 Tokuyama Corporation Stock exchange listings: Tokyo (URL http://www.tokuyama.co.jp/eng/) Local
Summary of Consolidated Financial Statements for the Second Quarter Fiscal 2018 (JPGAAP) October 31, 2018 Tokuyama Corporation Stock exchange listings: Tokyo (URL http://www.tokuyama.co.jp/eng/) Local
Consolidated Financial Results for 1H FY2017
 Consolidated Financial Results for 1H FY2017 October 27, 2017 Fuji Electric Co., Ltd. 2017Fuji Electric Co., Ltd. All rights reserved. 1 Summary of Consolidated Financial Results for 1H FY2017 (YoY Comparison)
Luk Fook (590 HK) Hold Target price: HK$ Downgrade to Hold on more challenging HK & Macau market outlook. Equity Research Consumer Discretionary
 Hold Target price: HK$ Downgrade to Hold on more challenging HK & Macau market outlook. Equity Research Consumer Discretionary") Equity Research Consumer Discretionary Luk Fook (590 HK) Hold Target price: HK$24.60 Albert Yip, CFA SFC CE No. ADT599 albertyip@gfgroup.com.hk +852 3719 1010 GF Securities (Hong Kong) Brokerage Limited
Equity Research Consumer Discretionary Luk Fook (590 HK) Hold Target price: HK$24.60 Albert Yip, CFA SFC CE No. ADT599 albertyip@gfgroup.com.hk +852 3719 1010 GF Securities (Hong Kong) Brokerage Limited
MARUI GROUP CO., LTD. Financial Results Briefing for Fiscal 2014
 MARUI GROUP CO., LTD. Financial Results Briefing for Fiscal 2014 May 14, 2015 Today s Agenda 1. Overview of Performance in Fiscal 2014 2. Progress of Medium-Term Management Plan and Future Initiatives
Don Quijote Holdings Co., Ltd. Results for FY 2018
 Don Quijote Holdings Co., Ltd. Results for FY 2018 Earnings Results July 1, 2017 - June 30, 2018 August 10, 2018 Earnings summary 12 months to June 2018 12 months to June 2017 Actual Share YoY Actual Share
Financial Results for FY2016 1H (Apr.-Sep.)
") Financial Results for FY2016 (Apr.-Sep.) October 31, 2016 2012 MITSUBISHI HEAVY INDUSTRIES, LTD. All Rights Reserved. Table of Contents Ⅰ. FY2016 Financial Results - Summary of Financial Results 3 - Financial
Financial Results for FY2016 (Apr.-Sep.) October 31, 2016 2012 MITSUBISHI HEAVY INDUSTRIES, LTD. All Rights Reserved. Table of Contents Ⅰ. FY2016 Financial Results - Summary of Financial Results 3 - Financial
Results Briefing FY2013 3Q
 Securities Code: 6770 Results Briefing FY2013 3Q Friday, January 31, 2014 COPYRIGHT(C)2013 ALPS ELECTRIC CO.,LTD. ALL RIGHT RESERVED. Contents FY2013 3Q Summary of Financial Results P. 2-7 FY2013 Consolidated
Autumn Presentation. la foncière parisienne
 Autumn 2017 Presentation I. Background II. Portfolio centered on Paris Central Business District III. Key aspects of TERREÏS Model IV. H1 2017 Results 2 TERREÏS at a glance Property investment company
Financial and Business Results
 Financial and Business Results First Quarter of Fiscal Year Ending March 31, 2009 Investors Meeting Shinsei Bank, Limited July 31, 2008 Agenda Part 1. Thierry Porté, President and Chief Executive Officer
Second Quarter of the Fiscal Year Ending March 31, 2018 Results Briefing Information Materials Entrust Inc.
 Second Quarter of the Fiscal Year Ending March 31, 2018 Results Briefing Information Materials Entrust Inc. Securities Code: 7191 The opinions and projections stated in these information materials reflect
TOTO Corporate Report
 1 th ANNIVERSARY TOTO Corporate Report 217 Financial and Non-financial Data Financial Data Ten-Year Summary of Selected Financial Data (Unit: Million yen) FY27 (March 31, 28) FY28 (March 31, 29) FY29 (March