Consolidated Financial Results
|
|
|
- Rosanna Daniel
- 5 years ago
- Views:
Transcription
1 ORIX Corporation (TSE: 8591; NYSE: IX) Consolidated Financial Results For the Consolidated Fiscal Year Ended March 31, 2013 May 10, 2013 Copyright 2013 ORIX Corporation All rights reserved.
2 Disclaimer These materials have been prepared by ORIX Corporation ( ORIX or the Company ) solely for your information and are subject to change without notice. The information contained in these materials has not been independently verified and its accuracy is not guaranteed. No representations, warranties or undertakings, express or implied, are made as to, and no reliance should be placed on, the accuracy, fairness, or completeness, or correctness of the information or the opinions presented or contained in these materials. These materials contain forward-looking statements that reflect the Company s intent, belief and current expectations about future events and financial results. These statements can be recognized by the use of words such as expects, plans, will, estimates, projects, intends, or words of similar meaning. These forward-looking statements are not guarantees of future performance. They are based on a number of assumptions about the Company s operations and are subject to risks, uncertainties and other factors beyond the Company s control. Accordingly, actual results may differ materially from these forward-looking statements. Factors that could cause such differences include, but are not limited to, those described under Risk Factors in the Company s most recent annual report on Form 20-F filed with the U.S. Securities and Exchange Commission and under Business Risk of the securities report (yukashouken houkokusho) filed with the Director of the kanto local Finance Bureau. Some of the financial information in these materials is unaudited. These materials contain non-gaap financial measures, including adjusted long-term and interest-bearing debt, adjusted total assets and adjusted ORIX Corporation shareholders equity, as well as adjusted segment profit and other measures and ratios calculated on the basis thereof. These non-gaap financial measures should not be considered in isolation or as a substitute for the most directly comparable financial measures included in our consolidated financial statements and presented in accordance with U.S. GAAP. Reconciliations of these non-gaap financial measures to the most directly comparable U.S. GAAP measures are included in these materials on pages 34 to 35. The Company believes that it will be considered a passive foreign investment company for United States Federal income tax purpose in the year to which these consolidated financial results relate and for the foreseeable future by reason of the composition of its assets and the nature of its income. A U.S. holder of the shares or ADSs of the Company is therefore subject to special rules generally intended to eliminate any benefits from the deferral of U.S. Federal income tax that a holder could derive from investing in a foreign corporation that does not distribute all of its earnings on a current basis. Investors should consult their tax advisors with respect to such rules, which are summarized in the Company s annual report. Nothing in this document shall be considered as an offer to sell or solicitation of an offer to buy any security, commodity or other instrument, including securities issued by the Company or any affiliate thereof. Copyright 2013 ORIX Corporation All rights reserved. 1
3 Contents I. Overview P.3 II. III. Future Direction Segment Results and Strategies P5 P.5 P.7 IV. Major Investment Activities V. Real Estate t Segment VI. Asset Quality P.15 P.16 P.17 VII. Funding P.18 VIII. Summary P.21 Appendix Copyright 2013 ORIX Corporation All rights reserved. 2
4 I. Overview FY13.3 FY14.3 Achieved 111.9bn yen in Net Income, up 34%YoY Announced acquisition of Robeco Increase dividends from 90 to 130 yen Aim for 135bn yen in Net Income (21% increase) *Net Income refers to Net Income Attributable to ORIX Corporation Shareholders (Target) Per share data has been adjusted retrospectively to reflect the stock split on April 1 for all periods presented Copyright 2013 ORIX Corporation All rights reserved. 3
5 I. Overview Status of Shareholders Equity Approx. 100bn yen added due to conversion of convertible bonds Put to active and effective use as source for next growth Employed Capital Ratio and ROE (Forecast) Copyright 2013 ORIX Corporation All rights reserved. 4


6 II. Future Direction Acquisition of Robeco Acquisition of world s leading AM Company Acceleration of Finance + Services Further expansion of global business foundation Europe Americas ORIX Office Robeco Office Asia Middle East p Japan Copyright 2013 ORIX Corporation All rights reserved. 5
7 II. Future Direction Increase investments t that t match Finance + Services, both domestically and overseas Take good risks nimbly by enhancing expertise Create new market while shifting to new battleground Aim to achieve 10% ROE in FY16.3 Copyright 2013 ORIX Corporation All rights reserved. 6
8 III. Segment Results and Strategies Segment Profits All segments increased profits, Investment and Operation and Retail significantly grew profits in FY13.3 Trend in Segment Profits (Target) Copyright 2013 ORIX Corporation All rights reserved. 7
9 III. Segment Results and Strategies Segment Assets Increases in Maintenance Leasing, Retail, and Overseas Business Trend in Segment Assets (Forecast) Copyright 2013 ORIX Corporation All rights reserved. 8
10 III. Segment Results and Strategies 1. Corporate Financial Services Base Revenue Breakdown* (FY13.3) Examples of service related revenues - Solar panel sales - Insurance agency commission * Base Revenues = Base profit before deduction of SGA - Interest related revenues: Includes direct finance leases, interest on loans and investment securities, equity in net income (loss) of affiliates, etc. - Service related revenues: Includes operating leases, life insurance premiums, other operating revenues, etc. (corresponding expenses have been deducted) - Interest expense is divided according to the proportion of interest related assets and service related assets and deducted from both revenues Enhance Matrix Sales Continue to strengthen solar panel sales Copyright 2013 ORIX Corporation All rights reserved. 9
11 III. Segment Results and Strategies 2. Maintenance Leasing Base Revenue Breakdown (FY13.3) Examples of service related revenues - Maintenance revenues - Rental revenues Further expand customer base and scale Promote streamlining of operations and enhance cost control Maintain stable high profitability Copyright 2013 ORIX Corporation All rights reserved. 10
12 III. Segment Results and Strategies 3. Real Estate Base Revenue Breakdown (FY13.3) Examples of service related revenues - Real estate rental revenues - Facility operation revenues Increase base profit mainly through h real estate operating business Expand fee revenues leveraging expertise Maintain asset composition ratio of 15 20% Copyright 2013 ORIX Corporation All rights reserved. 11
13 III. Segment Results and Strategies 4. Investment & Operation Base Revenue Breakdown (FY13.3) Examples of service related revenues - Loan servicing fee - Solar panel sales Increase revenues from environment and energy business Expand active investment both domestically and overseas Promote mega solar business ahead of the original plan Copyright 2013 ORIX Corporation All rights reserved. 12
14 III. Segment Results and Strategies 5. Retail Base Revenue Breakdown (FY13.3) Examples of service related revenues - Life insurance premiums Increase card loan balance Expand sector and scale of life insurance operation Copyright 2013 ORIX Corporation All rights reserved. 13
15 III. Segment Results and Strategies 6. Overseas Business Base Revenue Breakdown (FY13.3) Examples of service related revenues - M&A advisory fee - Aircraft operating lease revenues U.S.: Continue to enhance fee business Asia: Expand assets, capture economic growth Securely close Robeco acquisition Copyright 2013 ORIX Corporation All rights reserved. 14


16 IV. Major Investment Activities July 2012 Japan August 2013 (Plan) Global April 2012 Japan Dec Japan ORIX Credit Robeco KINREI Net Protections Card Loan Business Asset Management Business Manufacturing of Frozen Foods and Restaurant Operation E-Commerce Deferred Payment Clearance Service Dec Korea Feb Mongolia March 2013 Japan May 2013 Japan (Plan) STX Energy Energy Business The Mongolia Opportunities FundⅠ Investment in Mining and Infrastructure Asahi Fiber Glass 1 st Holdings Manufacturing of Glass Fiber Planning, Development, and Maintenance of Software Copyright 2013 ORIX Corporation All rights reserved. 15


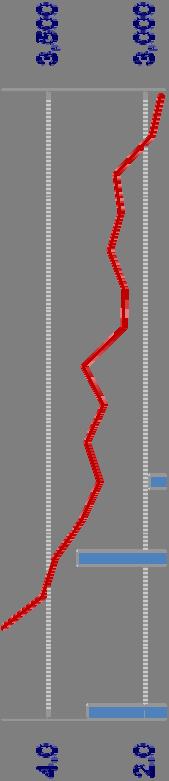
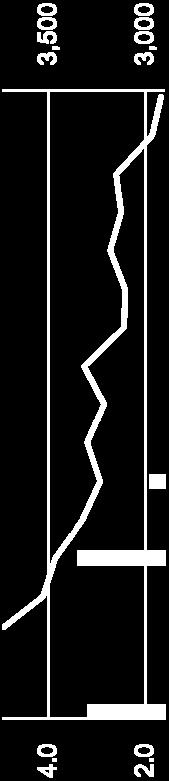
17 V. Real Estate Segment Accounts for approx. 18% of total segment assets Control percentage between 15-20% going forward Trend in Segment Assets Trend in Base Profit 1, , , , Copyright 2013 ORIX Corporation All rights reserved. 16


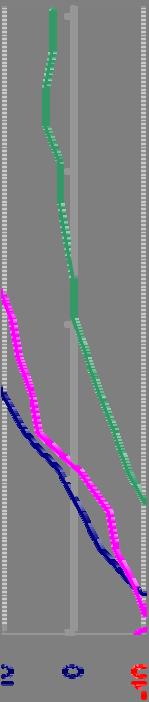
18 VI. Asset Quality Non-performing ratio decreased d to 6.4% Coverage ratio against loans individually evaluated for impairment is approx. 92% Trend in Non-Performing Ratio* Coverage Ratio of Loans Individually Evaluated for Impairment * (90+ Days Past-Due Direct Financing Leases Days Past-Due Loans Not Individually Evaluated for Impairment + Loans Individually Evaluated for Impairment)/(Investment in Direct Financing Leases + Installment Loans) *Sum of amount expected to be fully collected through collaterals from loans individually evaluated for impairment (38.0) and amount expected dto be collected dthrough hcollaterals l from impaired loans requiring valuation allowance (77.9). Copyright 2013 ORIX Corporation All rights reserved. 17


19 VII. Funding Funding Structure, Trend in Share of Long-Term Debt, Funding Cost Well-balanced funding structure Pursue stable and lengthened maturities for each funding option Breakdown of Funding Sources (As of Mar / Excluding ABS, CMBS) Trend in Long-Term Debt Share and Funding Cost Copyright 2013 ORIX Corporation All rights reserved. 18


 Copyright 2013 ORIX")
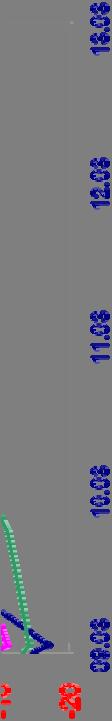
20 VII. Funding Liquidity on-hand/ Maturity Ladder Continue to maintain ample liquidity on-hand Expect to issue bonds within maturity amount Liquidity vs. Short-term Liabilities Straight Bond Maturity Ladder (as of Mar.31, 2013) Copyright 2013 ORIX Corporation All rights reserved
21 VII. Funding Bond Issuances Issued Amount Term (year) Issued to Coupon T Spread ORIX /Domestic Bond 160 Apr 25,2012 JPY 20 bil 5 Retail Investors 1.060% 76bp 161 Jun 18,2012 JPY 30 bil 5 Retail Investors 0.902% 67bp 162 Jun 7,2012 JPY 10 bil 5 Institutional Investors 0.902% 67bp 163 Aug 7,2012 JPY 15 bil 5 Institutional Investors 0.746% 56bp 164 Aug 7,2012 JPY 10 bil 7 Institutional Investors 1.146% 75bp 165 Sep 12,2012 JPY 40 bil 5 Retail Investors 0.777% 54bp 166 Dec 7,2012 JPY 35 bil 5 Retail Investors 0.725% 53bp 167 Mar 7,2013 JPY 15 bil 5 Institutional Investors 0.508% 39bp 168 Mar 7,2013 JPY 10 bil 7 Institutional Investors 0.849% 53bp 169 Mar 28,2013 JPY 25 bil 5 Retail Investors 0.513% 39bp FY 2013 JPY 210 bil (Institutional Investors: JPY 60 bil Retail Investors: JPY 150 bil ) 170 Apr 30,2013 JPY 15 bil 5 Retail Investors 0.475% 29bp 171 Apr 30,2013 JPY 20 bil 10 Retail Investors 1.126% 57bp 172 Apr 17,2013 JPY 10 bil 5 Institutional Investors 0.566% 29bp 173 Apr 17,2013 JPY 15 bil 7 Institutional Investors 0.840% 45bp FY 2014 JPY 60 bil (Institutional Investors: JPY 25 bil Retail Investors: JPY 35 bil ) ORIX /Foreign Currenncy Dominated Bond AUD Notes Jul 23,2012 AUD 130mil (JPY 12.7 bil) 3 Retail Investors 4.28% - Local Subsidiary /MTN Bond Thai Baht Bond Apr 4,2012 THB 500mil (JPY 1.6 bil) 3 Institutional Investors 4.45% - Korea Won Bond Jul 24,2012 KRW 30,000mil (JPY 2.5 bil) 2 Institutional Investors 3.87% - Korea Won Bond Sep 26,2012 KRW 30,000mil (JPY 2.5 bil) 2 Institutional Investors 3.63% - Thai Baht Bond Nov 30,2012 THB 500mil (JPY 1.6 bil) 2 Institutional Investors 3.63% - Thai Baht Bond Nov 30,2012 THB 1,000mil (JPY 3.2 bil) 4 Institutional Investors 3.99% - Copyright 2013 ORIX Corporation All rights reserved. 20
22 VIII. Summary Increase investments that match Finance + Services, both domestically and overseas Take good risks nimbly by enhancing expertise Create new market while shifting to new battleground FY14.3 Net Income Target 135bn yen FY16.3 Aim to achieve 10% ROE Copyright 2013 ORIX Corporation All rights reserved. 21
23 Appendix Copyright 2013 ORIX Corporation All rights reserved. 22
24 Appendix(1) Trend in Performance *1 Net Income Attributable to ORIX Corporation Shareholders *2 Performance indicators shown are Non-GAAP financial measures. For a qualitative reconciliation of the most directly comparable financial measures calculated and presented in accordance with U.S. GAAP, please see page 34. Copyright 2013 ORIX Corporation All rights reserved. 23
25 Appendix(2) Profit by Segment Change Corporate Financial Services % Maintenance Leasing % Real Estate % Investment and Oparation % Retail % Overseas Business % Total Segment Profit % The Company evaluates the performance of segments based on income before income taxes and discontinued operations, adjusted for results of discontinued operations, net income attributable to the noncontrolling interests and net income attributable to the redeemable noncontrolling interests before applicable tax effect. Copyright 2013 ORIX Corporation All rights reserved. 24
26 Appendix(3) Assets by Segment & Region Overseas Business Segment Assets by Region Copyright 2013 ORIX Corporation All rights reserved. 25
27 Appendix(4) Funding and Liquidity *1 Marketable Short-term Debt is the total of bonds and MTN expected to reach maturity within 1 year and the balance of CP. *2 Performance indicator is a Non-GAAP financial measure. For a qualitative reconciliation of the most directly comparable financial measures calculated and presented in accordance with U.S. GAAP, please see page 34. Copyright 2013 ORIX Corporation All rights reserved. 26
28 Appendix(5) Segment Performance - 1 Corporate Financial Services Maintenance Leasing Copyright 2013 ORIX Corporation All rights reserved. 27
29 Appendix(6) Segment Performance - 2 Real Estate Investment & Operation Copyright 2013 ORIX Corporation All rights reserved. 28
30 Appendix(7) Segment Performance - 3 Retail Overseas Business Copyright 2013 ORIX Corporation All rights reserved. 29
31 Appendix(8) Real Estate Portfolio Trend in Real Estate Segment Assets by Type * 40.8bn of NRL/specified bonds held by domestic Group companies not included (As of Mar. 2013) NOI Yield and Vacancy Rate Trends Trend in Amount of Rental Property Sales Copyright 2013 ORIX Corporation All rights reserved. 30
32 Appendix(9) Real Estate Portfolio Rental Property Assets by Type (13.3) Rental Property Assets by Region (13.3) Copyright 2013 ORIX Corporation All rights reserved. 31
33 Appendix(10) Asset Quality Asset Quality (Adjusted **) *1 *1 Of the 168.1bn in loans individually evaluated for impairment, 104.0bn is fully covered by collaterals such as real estate. Including 52.2bn in provisions, 92.9% is fully covered *2 (90+ Days Past-Due Direct Financing Leases Days Past-Due Loans Not Individually Evaluated for Impairment + Loans Individually Evaluated for Impairment)/(Investment in Direct Financing Leases + Installment Loans) Trend in Provisions and Provisioning Rate (Adjusted **) * Provisions (Adjusted)/ (Average Investment in Direct Financing Leases + Average Investment in Installment Loans) **The above exclude the effects of adopting the new accounting standards regarding the consolidation of VIEs. Copyright 2013 ORIX Corporation All rights reserved. 32
34 Appendix(11) Reconciliation Table of Non-GAAP Financial Measurement These materials include certain financial measures presented on a basis not in accordance with U.S. GAAP, or non-gaap measures, including total assets and long-term liabilities excluding liabilities in line with securitized transactions (ABS, CMBS), as well as other measures or ratios calculated based thereon, presented on an adjusted basis, which excludes payables under securitized leases, loan receivables and investment in securities and reverses the cumulative effect on retained earnings of applying the new accounting standards for the consolidation of VIEs, effective April 1, (1) Our management believes these non-gaap financial measures may provide investors with additional meaningful comparisons between our financial condition as of March 31, 2013, as compared to prior periods. Effective April 1, 2010, we adopted ASU and ASU , which changed the circumstances under which we are required to consolidate certain VIEs. Our adoption of these new accounting standards caused a significant increase in our consolidated assets and liabilities and a decrease in our retained earnings without affecting the net cash flow and economic effects of our investments in such consolidated VIEs. Accordingly, our management believes that providing financial measures that exclude assets and liabilities attributable to consolidated VIEs as a supplement to financial information calculated in accordance with U.S. GAAP enhances the overall picture of our current financial position and enables investors to evaluate our historical financial and business trends without the large balance sheet fluctuation caused by our adoption of these new accounting standards. (2) Our management believes that in comparing segment information as of March 31, 2013 as compared to prior periods, the provision of the non-gaap financial measure of base profit that excludes capital gains, allowance for doubtful receivables and probable loan losses, and impairments may provide investors with additional meaningful insight regarding segment profit trends. We provide these non-gaap financial measures as supplemental information to our consolidated financial statements prepared in accordance with U.S. GAAP, and they should not be considered in isolation or as a substitute for the most directly comparable U.S. GAAP measures. Reconciliations of these non-gaap financial measures to the most directly comparable financial measures presented in accordance with U.S. GAAP as reflected in our consolidated financial statements for the periods provided, are included in page 34 and 35. Copyright 2013 ORIX Corporation All rights reserved. 33
35 Appendix(12) Reconciliation Table of Non-GAAP Financial Measurement Copyright 2013 ORIX Corporation All rights reserved. 34
36 Appendix(13) Reconciliation Table of Non-GAAP Financial Measurement *1 Base Profit = Segment Profit Capital Gains Provisions Impairments *2 Brokerage commissions and net gains (losses) on investment securities, real estate sales (net of cost), gains (losses) on sales of real estate under operating leases, gains (losses) on sales of subsidiaries and affiliates and liquidation losses, net, and equivalent amount of real estate joint-venture equity method profit for equity in net income (loss) of affiliates. *3 Impairment losses for write-downs of long-lived assets, write-downs of securities, and equivalent amount of costs of real estate sales and equity in net income (loss) of affiliates. Copyright 2013 ORIX Corporation All rights reserved. 35
37 Reference eee Data Copyright 2013 ORIX Corporation All rights reserved. 36


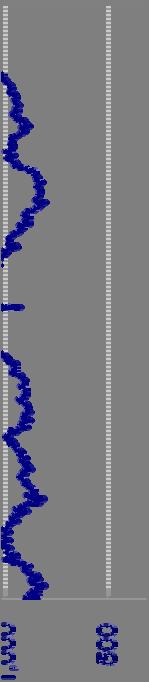
38 Macro Economic Indicators (% Change) National CPI (Ex Fresh Food) (YoY Change) Source: Bloomberg Copyright 2013 ORIX Corporation All rights reserved. 37


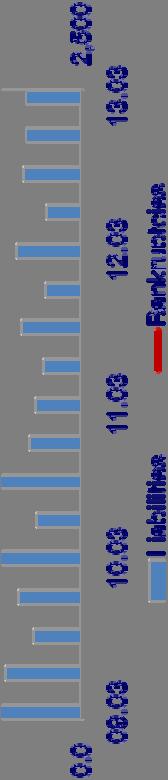

39 Japanese Corporate Indices Corporate Bankruptcies (Quarterly Basis) Tankan Corporate Diffusion Index (JPY Tn) (Cases) Source: Teikoku Databank, Ltd. Source: Bank of Japan Copyright 2013 ORIX Corporation All rights reserved. 38


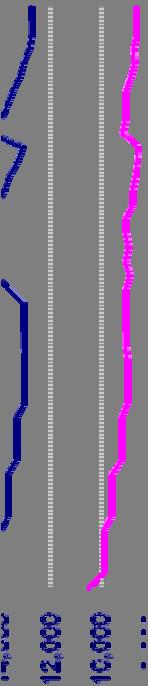
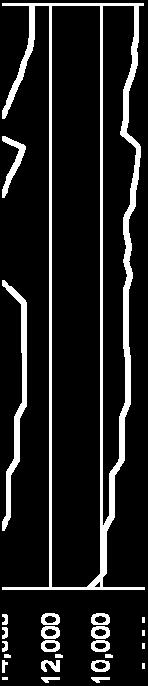


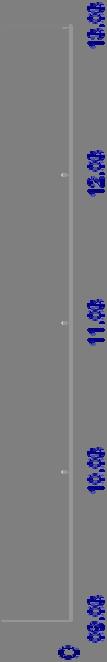
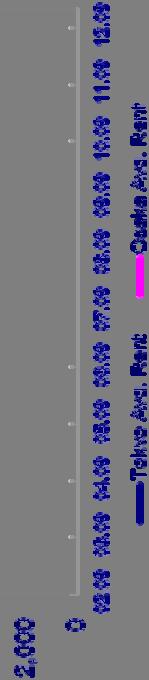
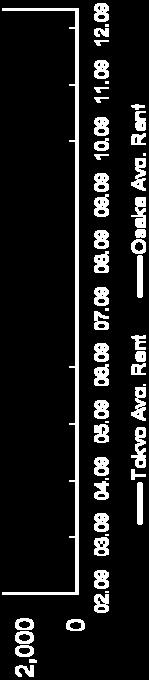
40 Japanese Real Estate Indicators Japan TSE REIT Index Office Rental Rates (Yen per 3.3 m2 ) Source: Tokyo Stock Exchange Source: CBRE Copyright 2013 ORIX Corporation All rights reserved. 3939
41 Domestic Lease Business Indicators Private Equipment Investment New Car Sales (1,000 Units) 90, % 7, % 80,000 70,000 60, % 8.0% 6,000 5, % 10.0% 50, , % 4,000 3, % 6.0% 30,000 20,000 10, % 20% 2.0% 2, , % 20% 2.0% % % Private Equipment Inv. Share of Lease New Car Sales Share of Lease Source: Japan Leasing Association Source: Japan Automotive Leasing Association Copyright 2013 ORIX Corporation All rights reserved. 4040
")
 Source: Agency for Natural Resources and")

42 Other Domestic Indicators Trend in Domestic Supply of Renewable Energy (Primary Energy Supply Basis) Domestic Shipping Amount of Solar Cell (Petajoule) (MW) Source: Agency for Natural Resources and Energy Source: Japan Photovoltaic Energy Association Copyright 2013 ORIX Corporation All rights reserved
43 Other Domestic Indicators The number of M&A (Cases) Source: RECOF Corporation Copyright 2013 ORIX Corporation All rights reserved
44 Other Domestic Indicators Retail Life Insurance Consumer Finance Loans 25,000 20,000 15,000 10,000 5, Retail Life Insurance Premiums Source: Japan Statistics Bureau Source: Japan Financial Services Agency Copyright 2013 ORIX Corporation All rights reserved. 4343
45 Additional Information For annual and more historical data please access our website. A list of major disclosure materials is given below. ORIX Website: URL: / / / IR Website: URL: If you would like to be included d on our list for major news announcements, please send your request to the address below. ORIX Corporation Corporate Planning Department World Trade Center Building., 2-4-1, Hamamatsu-cho, Minato-ku, Tokyo , Japan Tl+813 Tel: Fax: haruyasu_yamada@orix.co.jp Copyright 2013 ORIX Corporation All rights reserved. 44
Consolidated Financial Results
 ORIX Corporation (TSE: 8591; NYSE: IX) Consolidated Financial Results For the Consolidated Fiscal Year Ended March 31, 2013 May 10, 2013 Haruyuki Urata Shintaro Agata Takao Kato Deputy President & CFO
ORIX Corporation (TSE: 8591; NYSE: IX)
") ORIX Corporation (TSE: 8591; NYSE: IX) Consolidated Financial Results First Quarter Consolidated Financial Results For the Three Month Period Ended April 1 June 30, 2012 Haruyuki Urata Shintaro Agata Takao
ORIX Corporation (TSE: 8591; NYSE: IX) Consolidated Financial Results First Quarter Consolidated Financial Results For the Three Month Period Ended April 1 June 30, 2012 Haruyuki Urata Shintaro Agata Takao
ORIX Corporation (TSE: 8591; NYSE: IX) Conference Call First Quarter Consolidated Financial Results For the Three Month Period Ended June 30, 2015
 Conference Call First Quarter Consolidated Financial Results For the Three Month Period Ended June 30, 2015") ORIX Corporation (TSE: 8591; NYSE: IX) Conference Call First Quarter Consolidated Financial Results For the Three Month Period Ended June 3, 215 July 3, 215 Kazuo Kojima Shintaro Agata Takao Kato Deputy
ORIX Corporation (TSE: 8591; NYSE: IX) Conference Call First Quarter Consolidated Financial Results For the Three Month Period Ended June 3, 215 July 3, 215 Kazuo Kojima Shintaro Agata Takao Kato Deputy
ORIX Corporation. First Quarter Consolidated Financial Results For the Three-Month Period Ended June 30, 2017
 ORIX Corporation First Quarter Consolidated Financial Results For the Three-Month Period Ended June 3, 217 Kazuo Kojima Deputy President & CFO Shintaro Agata Corporate Executive Vice President, Head of
ORIX Corporation. Consolidated Financial Results For the Consolidated Fiscal Year Ended March 31, May 16, 2017 (TSE: 8591; NYSE: IX)
") ORIX Corporation Consolidated Financial Results For the Consolidated Fiscal Year Ended March 31, 2017 Makoto Inoue Kazuo Kojima President & CEO Deputy President & CFO May 16, 2017 (TSE: 8591; NYSE: IX)
ORIX Corporation Consolidated Financial Results For the Consolidated Fiscal Year Ended March 31, 2017 Makoto Inoue Kazuo Kojima President & CEO Deputy President & CFO May 16, 2017 (TSE: 8591; NYSE: IX)
ORIX Corporation. (TSE: 8591; NYSE: IX) Second Quarter Consolidated Financial Results For the Six-Month Period Ended September 30, 2015
 Second Quarter Consolidated Financial Results For the Six-Month Period Ended September 30, 2015") ORIX Corporation (TSE: 8591; NYSE: IX) Second Quarter Consolidated Financial Results For the Six-Month Period Ended September 3, 215 October 3, 215 Makoto Inoue Kazuo Kojima President & CEO Deputy President
ORIX Corporation (TSE: 8591; NYSE: IX) Second Quarter Consolidated Financial Results For the Six-Month Period Ended September 3, 215 October 3, 215 Makoto Inoue Kazuo Kojima President & CEO Deputy President
ORIX Corporation. Consolidated Financial Results For the Consolidated Fiscal Year Ended March 31, May 16, 2017 (TSE: 8591; NYSE: IX)
") ORIX Corporation Consolidated Financial Results For the Consolidated Fiscal Year Ended March 31, 2017 Makoto Inoue Kazuo Kojima President & CEO Deputy President & CFO May 16, 2017 (TSE: 8591; NYSE: IX)
ORIX Corporation Consolidated Financial Results For the Consolidated Fiscal Year Ended March 31, 2017 Makoto Inoue Kazuo Kojima President & CEO Deputy President & CFO May 16, 2017 (TSE: 8591; NYSE: IX)
ORIX Corporation. First Quarter Consolidated Financial Results For the Three-Month Period Ended June 30, Hitomaro Yano
 ORIX Corporation First Quarter Consolidated Financial Results For the Three-Month Period Ended June 3, 218 1 Hitomaro Yano July 3, 218 Director Executive Officer Head of Treasury and Accounting Headquarters
ORIX Corporation (NYSE: IX; TSE: 8591)
") ORIX Corporation (NYSE: IX; TSE: 8591) Consolidated Financial Results Supplementary Information for the Fiscal Year Ended March 31, 2012 (May 10, 2012) Financial Highlights Segment Information Segment
ORIX Corporation (NYSE: IX; TSE: 8591) Consolidated Financial Results Supplementary Information for the Fiscal Year Ended March 31, 2012 (May 10, 2012) Financial Highlights Segment Information Segment
ORIX Corporation (NYSE: IX; TSE: 8591)
") ORIX Corporation (NYSE: IX; TSE: 8591) Consolidated Financial Results Supplementary Information for the Three-months Ended June 30, 2012 (July 25, 2012) Contents Financial Highlights Segment Information
ORIX Corporation (NYSE: IX; TSE: 8591) Consolidated Financial Results Supplementary Information for the Three-months Ended June 30, 2012 (July 25, 2012) Contents Financial Highlights Segment Information
ORIX Corporation. Consolidated Financial Results For the Consolidated Fiscal Year Ended March 31, 2018
 ORIX Corporation Consolidated Financial Results For the Consolidated Fiscal Year Ended March 31, 218 1 Makoto Inoue Kazuo Kojima Hitomaro Yano May 1, 218 Director, Representative Executive Officer President
Consolidated Financial Results For the Consolidated Fiscal Year Ended March 31, 2015
 ORIX Corporation (TSE: 8591; NYSE: IX) Consolidated Financial Results For the Consolidated Fiscal Year Ended March 31, 215 May 13, 215 Makoto Inoue Haruyuki Urata President & CEO Deputy President & CFO
Consolidated Financial Results April 1, December 31, 2018
 Consolidated Financial Results April 1, 2018 - January 28, 2019 In preparing its consolidated financial information, ORIX Corporation (the Company ) and its subsidiaries have complied with generally accepted
SECURITIES AND EXCHANGE COMMISSION WASHINGTON, D.C FORM 6-K
 SECURITIES AND EXCHANGE COMMISSION WASHINGTON, D.C. 20549 FORM 6-K REPORT OF FOREIGN PRIVATE ISSUER Pursuant to Rule 13a-16 or 15d-16 OF THE SECURITIES EXCHANGE Act of 1934 For the month of February 2014.
SECURITIES AND EXCHANGE COMMISSION WASHINGTON, D.C FORM 6-K
 SECURITIES AND EXCHANGE COMMISSION WASHINGTON, D.C. 20549 FORM 6-K REPORT OF FOREIGN PRIVATE ISSUER Pursuant to Rule 13a-16 or 15d-16 OF THE SECURITIES EXCHANGE Act of 1934 For the month of August 2014.
Consolidated Financial Results April 1, 2012 June 30, 2012
 Consolidated Financial Results April 1, 2012 June July 25, 2012 In preparing its consolidated financial information, ORIX Corporation and its subsidiaries have complied with accounting principles generally
Consolidated Financial Results from April 1, 2017 to (U.S. GAAP Financial Information for ORIX Corporation and its Subsidiaries) Corporate Name: ORIX
 Corporate Name: ORIX") Consolidated Financial Results April 1, 2017 - January 30, 2018 In preparing its consolidated financial information, ORIX Corporation (the Company ) and its subsidiaries have complied with generally accepted
Consolidated Financial Results April 1, 2017 - January 30, 2018 In preparing its consolidated financial information, ORIX Corporation (the Company ) and its subsidiaries have complied with generally accepted
Consolidated Financial Results Supplementary Information for the Six-month Ended September 30, 2017
 Consolidated Financial Results Supplementary Information for the Six-month Ended September 30, 2017 ORIX Corporation (NYSE: IX; TSE: 8591) October 30, 2017 Contents Page 1 Financial Highlights : Financial
Consolidated Financial Results April 1, 2012 December 31, 2012
 Consolidated Financial Results April 1, 2012 December January 31, 2013 In preparing its consolidated financial information, ORIX Corporation and its subsidiaries have complied with accounting principles
Consolidated Financial Results Supplementary Information for the Three-month Ended June 30, 2018
 Consolidated Financial Results Supplementary Information for the Three-month Ended June 30, 2018 ORIX Corporation (NYSE: IX; TSE: 8591) July 30, 2018 Contents Page 1 Financial Highlights : Financial Highlights,
SECURITIES AND EXCHANGE COMMISSION WASHINGTON, D.C FORM 6-K
 SECURITIES AND EXCHANGE COMMISSION WASHINGTON, D.C. 20549 FORM 6-K REPORT OF FOREIGN PRIVATE ISSUER Pursuant to Rule 13a-16 or 15d-16 OF THE SECURITIES EXCHANGE Act of 1934 For the month of August 2012.
Consolidated Financial Results Supplementary Information for the Fiscal Year Ended March 31, 2018
 Consolidated Financial Results Supplementary Information for the Fiscal Year Ended March 31, 2018 (Five-Year Summary) ORIX Corporation (NYSE: IX; TSE: 8591) Contents Page 1 Financial Highlights : Financial
ORIX Reports Annual Consolidated Financial Results for the Fiscal Year Ended March 31, 2015
 ORIX Reports Annual Consolidated Financial Results for the Fiscal Year Ended March 31, 215 234.9bn yen in Net Income, up 25% YoY Net Income Increased for the Sixth Consecutive Year New Record High Net
ORIX Corporation. Second Quarter Consolidated Financial Results For the Six-Month Period Ended September 30, 2018
 ORIX Corporation Second Quarter Consolidated Financial Results For the Six-Month Period Ended September 30, 2018 Makoto Inoue Director, Representative Executive Officer President & CEO 1 October 29, 2018
Consolidated Financial Results Supplementary Information for the Fiscal Year Ended March 31, 2018
 Consolidated Financial Results Supplementary Information for the Fiscal Year Ended March 31, 2018 ORIX Corporation (NYSE: IX; TSE: 8591) May 9, 2018 Contents Page 1 Financial Highlights : Financial Highlights,
Consolidated Financial Results from April 1, 2017 to (U.S. GAAP Financial Information for ORIX Corporation and its Subsidiaries) Corporate Name: ORIX
 Corporate Name: ORIX") Consolidated Financial Results April 1, 2017 - July 31, 2017 In preparing its consolidated financial information, ORIX Corporation (the Company ) and its subsidiaries have complied with generally accepted
Consolidated Financial Results April 1, 2017 - July 31, 2017 In preparing its consolidated financial information, ORIX Corporation (the Company ) and its subsidiaries have complied with generally accepted
ORIX Reports Annual Consolidated Financial Results for the Fiscal Year Ended March 31, 2018
 ORIX Reports Annual Consolidated Financial Results for the Fiscal Year Ended March 31, 218 313.1bn yen in Net Income, up 15% YoY Net Income Increased for the ninth Consecutive Year New Record Net Income
Consolidated Financial Results April 1, 2015 December 31, 2015
 Consolidated Financial Results April 1, 2015 December 31, 2015 January 27, 2016 In preparing its consolidated financial information, ORIX Corporation and its subsidiaries have complied with generally accepted
Consolidated Financial Results Supplementary Information for the Three-Months Ended June 30, (August 5, 2010)
") Consolidated Financial Results Supplementary Information for the Three-Months Ended June 30, 2010 (August 5, 2010) Contents Key Quarterly Financial Info (1): Balance Sheet Data & New Business Volumes Key
Consolidated Financial Results Supplementary Information for the Three-Months Ended June 30, 2010 (August 5, 2010) Contents Key Quarterly Financial Info (1): Balance Sheet Data & New Business Volumes Key
Trends of Major Performance Indicators. Trend in Net Income (JPY Bn) Segment Profits Breakdown ( )
 Segment Profits Breakdown ( )") ORIX Reports Consolidated Financial Results for Q2 FY2016.3 161.3bn yen in Net Income, up 14% YoY, Profit Growth for the Same Period for Six Consecutive Fiscal Years New Record Total Revenues and Net Income
ORIX Reports Consolidated Financial Results for Q2 FY2016.3 161.3bn yen in Net Income, up 14% YoY, Profit Growth for the Same Period for Six Consecutive Fiscal Years New Record Total Revenues and Net Income
Consolidated Financial Results April 1, 2017 March 31, 2018
 Consolidated Financial Results April 1, 2017 May 9, 2018 In preparing its consolidated financial information, ORIX Corporation (the Company ) and its subsidiaries have complied with generally accepted
ORIX Reports Annual Consolidated Financial Results for the Fiscal Year Ended March 31, 2016
 ORIX Reports Annual Consolidated Financial Results for the Fiscal Year Ended March 31, 2016 260.2bn yen in Net Income, up 11% YoY Net Income Increased for the Seventh Consecutive Year New Record High Net
Consolidated Financial Results April 1, 2009 June 30, 2009
 Consolidated Financial Results April 1, 2009 June August 5, 2009 In preparing its consolidated financial information, ORIX Corporation and its subsidiaries have complied with accounting principles generally
ORIX Corporation. Analysis of Consolidated Financial Results For the Period April 1-June 30, (July 30, 2002)
") ORIX Corporation Analysis of Consolidated Financial Results For the Period April 1-June 30, 2002 (July 30, 2002) Disclaimer Safe Harbor Statement These documents may contain forward-looking statements
ORIX Corporation Analysis of Consolidated Financial Results For the Period April 1-June 30, 2002 (July 30, 2002) Disclaimer Safe Harbor Statement These documents may contain forward-looking statements
SECURITIES AND EXCHANGE COMMISSION WASHINGTON, D.C FORM 6-K
 SECURITIES AND EXCHANGE COMMISSION WASHINGTON, D.C. 20549 FORM 6-K REPORT OF FOREIGN PRIVATE ISSUER Pursuant to Rule 13a-16 or 15d-16 OF THE SECURITIES EXCHANGE Act of 1934 For the month of November 2013.
Consolidated Financial Results April 1, 2008 September 30, 2008
 Consolidated Financial Results April 1, 2008 November 7, 2008 In preparing its consolidated financial information, ORIX Corporation and its subsidiaries have complied with accounting principles generally
Growth Potential of the J-REIT Market
 Growth Potential of the J-REIT Market Japan Securities Summit March 11, 2010, Singapore F. Imanishi Mitsubishi Corp. - UBS Realty, Inc. The opinions expressed in the materials are solely the personal opinions
Overview of 1H, FY3/2013 performance. Sumitomo Mitsui Financial Group, Inc. November 14, 2012
 Overview of FY3/213 performance Sumitomo Mitsui Financial Group, Inc. November 14, 212 Overview of FY3/213 performance SMFG consolidated net income: 1H results exceeded May forecast; revised full year
Financial Section Eleven-Year Summary
 56 ORIX INTEGRATED REPORT 2017 Financial Section Eleven-Year Summary Years Ended March 31 2007 2008 2009 2010 Financial Position: Direct Financing Leases 1,258,404 1,098,128 914,444 756,481 Installment
The 8 th Japanese Financial Conference. September 2006
 The 8 th Japanese Financial Conference September 26 Mizuho Financial Group, Inc. Global Retail Group Global Corporate Group Global Asset & Wealth Management Group Group Strategy Affiliates Mizuho Bank
Consolidated Financial Summary (for the year ended March 31, 2008)
") Consolidated Financial Summary (for the year ended ) April 28, 2008 Company's name: Representative: For inquiry: Scheduled date of General Shareholders' Meeting Mizuho Securities Co., Ltd. ("the Company")
Consolidated Financial Summary (for the year ended ) April 28, 2008 Company's name: Representative: For inquiry: Scheduled date of General Shareholders' Meeting Mizuho Securities Co., Ltd. ("the Company")
Contact Information: ORIX Corporation Corporate Planning Department Tel: Fax: URL:
 July 2, 2013 FOR IMMEDIATE RELEASE Contact Information: ORIX Corporation Corporate Planning Department Tel: +81-3-3435-3121 Fax: +81-3-3435-3154 URL: http://www.orix.co.jp/grp/en/ Announcement regarding
Overview of Earnings for Q2 FY2017
 Overview of Earnings for Q2 FY217 Your Exchange of Choice October 31, 217 I. Business Developments * This document is not subject to the audit procedures required under the Financial Instruments and Exchange
FY3/2016 2nd Quarter Results. November 6, 2015
 2nd Quarter Results (Tokyo Stock Exchange / Nagoya Stock Exchange : 8593) November 6, 2015 Index Ⅰ 2nd Quarter Results Ⅱ Ⅲ Ⅳ Forecast for Progress of Medium-Term Management Plan Appendix 1 Ⅰ 2nd Quarter
Ichigo Group Holdings Co., Ltd. (2337)
") Feb. 2013 Fiscal Year Q3 (March November 2012) Corporate Presentation Ichigo Group Holdings Co., Ltd. (2337) January 17, 2013 2013 Ichigo Group Holdings Co., Ltd. All rights reserved. www.ichigo-holdings.co.jp/english
Feb. 2013 Fiscal Year Q3 (March November 2012) Corporate Presentation Ichigo Group Holdings Co., Ltd. (2337) January 17, 2013 2013 Ichigo Group Holdings Co., Ltd. All rights reserved. www.ichigo-holdings.co.jp/english
ANNOUNCEMENT OF FINANCIAL RESULTS
 FOR IMMEDIATE RELEASE Media Contacts: February 1, 2013 Investor Relations Contacts: Megumi Kitagawa (Japan) Shozo Mizuno (Japan) Global Public Relations Office Corporate Finance & IR Group (Tel: +81-3-3574-5664)
Overview of Earnings for Q2 FY2018
 Overview of Earnings for Q2 FY218 Your Exchange of Choice Japan Exchange Group, Inc. October 3, 218 Contents 1 Business Developments 2 Overview of Earnings for Q2 FY218 IFRS 3 Reference Materials I. Business
Financial Results for 1H FY16/17 (1 April 2016 to 30 September 2016)
") Financial Results for 1H FY16/17 (1 April 2016 to 30 September 2016) 11 November 2016 Stock code: ADQU Important Notice This presentation is intended solely for your information only and does not constitute
Financial Results for 1H FY16/17 (1 April 2016 to 30 September 2016) 11 November 2016 Stock code: ADQU Important Notice This presentation is intended solely for your information only and does not constitute
Entry into Scheme Implementation Deed to Acquire 100% Ownership of TOWER Australia
 December 28, 2010 Koichiro Watanabe President and Representative Director The Dai-ichi Life Insurance Company, Limited Code: 8750 (TSE First section) Entry into Scheme Implementation Deed to Acquire 100%
2018/4/27. Contents. Financial Highlights, Year ended in March 31, Copyright DAITO TRUST CONSTRUCTION CO., LTD.
 Financial Highlights, Year ended in March 31, 218 1 Contents 2 1 Financial Results, Year ended in March 31,218 3 Results in FY ended in March 218 Highlights 1. Increase in sales and profit for 1 consecutive
Financial and Business Results
 Financial and Business Results First Quarter of Fiscal Year Ending March 31, 2009 Investors Meeting Shinsei Bank, Limited July 31, 2008 Agenda Part 1. Thierry Porté, President and Chief Executive Officer
Summary of Financial Results for the First Quarter of Fiscal 2017 Under Japanese GAAP. July 31, 2017
 Summary of Financial Results for the First Quarter of Fiscal 2017 Under Japanese GAAP July 31, 2017 Contents Overview of Income Statement Overview of Balance Sheet Overview of Loans Non-interest Income
Summary of Consolidated Financial Statements for the Six Months ended June 30, 2012 (Japanese GAAP)
") Summary of Consolidated Financial Statements for the Six Months ended June 30, 2012 (Japanese GAAP) August 6, 2012 Company name HORIBA, Ltd. Listed stock exchanges: Tokyo, Osaka Listing code 6856 URL:
Summary of Consolidated Financial Statements for the Six Months ended June 30, 2012 (Japanese GAAP) August 6, 2012 Company name HORIBA, Ltd. Listed stock exchanges: Tokyo, Osaka Listing code 6856 URL:
( PLife REIT ) Q Results Presentation 6 August 2009
 Q Results Presentation 6 August 2009") ( PLife REIT ) Q2 2009 Results Presentation 6 August 2009 Disclaimer This Presentation is focused on comparing actual results for the period from 1 April 2009 to 30 June 2009 ( Q2 2009 ) versus the period
( PLife REIT ) Q2 2009 Results Presentation 6 August 2009 Disclaimer This Presentation is focused on comparing actual results for the period from 1 April 2009 to 30 June 2009 ( Q2 2009 ) versus the period
MIC. Fourth Quarter 2017 Earnings Conference Call Support Slides. February 2018
 MIC Fourth Quarter 2017 Earnings Conference Call Support Slides February 2018 Disclaimer This presentation by Macquarie Infrastructure Corporation (MIC) is proprietary and all rights are reserved. Any
Overview of Earnings for Q3 FY2017
 Overview of Earnings for Q3 FY217 Japan Exchange Group, Inc. January 31, 218 I. Business Developments * This document is not subject to the audit procedures required under the Financial Instruments and
Management Discussion and Analysis
 Management Discussion and Analysis For the second quarter and first half ended June 30, 2018 The Siam Commercial Bank Public Company Limited The Siam Commercial Bank Public Company Limited 9 Ratchadapisek
Pioneer Announces Business Results for 2Q Fiscal 2018
 For Immediate Release November 9, 2017 Pioneer Announces Business Results for 2Q Fiscal 2018 Pioneer Corporation today announced its consolidated second-quarter and six-month business results for the period
Overview of Earnings for 2Q FY2013
 Overview of Earnings for 2Q FY2013 Japan Exchange Group, Inc. October 23, 2013 I. Overview of Earnings for 2Q FY2013 (April 1 September 30, 2013) [Regarding JPX Earnings for previous Fiscal Year] - The
Consolidated Financial Results April 1, 2008 March 31, 2009
 Consolidated Financial Results April 1, 2008 May 8, 2009 In preparing its consolidated financial information, ORIX Corporation and its subsidiaries have complied with accounting principles generally accepted
Disclaimer. kabu.com Securities Co., Ltd.
 Disclaimer This document is an Englishlanguage translation of the nonconsolidated financial summary of the financial results for the third quater of the fiscal year ending March 31, 2013(from April 2012
Digital Realty Reports Second Quarter 2016 Results
 NEWS RELEASE Digital Realty Reports Second Quarter 2016 Results 7/28/2016 SAN FRANCISCO, July 28, 2016 /PRNewswire/ -- Digital Realty Trust, Inc. (NYSE: DLR), a leading global provider of data center,
FX Viewpoint. Tuesday, January 10, Asia Net portfolio capital inflow update
 FX Viewpoint Tuesday, January 1, 217 Asia Net portfolio capital inflow update The net portfolio flow situation has improved in recent weeks (including in the opening week of this year). If the broad dollar
Quarterly Securities Report
 Quarterly Securities Report For the three months ended September 30, 2017 (TRANSLATION) Sony Corporation CONTENTS Page Note for readers of this English translation Cautionary Statement 1 1 I Corporate
Summary of Financial Results for the Third Quarter of Fiscal 2018 Under Japanese GAAP. January 31, 2019
 Summary of Financial Results for the Third Quarter of Fiscal 08 Under Japanese GAAP January 3, 09 Contents Overview of Income Statement Overview of Balance Sheet Overview of Loans Non-interest Income P.
Technical Analysis: Market Insight
 Technical Analysis: Market Insight October 1987 vs. October 2017 Today (Oct. 19, 2017) marks the 30 th anniversary of Black Monday a global market crash during which the S&P 500 dropped 20% in one day.
Japanese Stock Market Outlook. SMAM monthly comments & views - October
 Japanese Stock Market Outlook SMAM monthly comments & views - October 2015 - Executive summary Japanese Economy Japanese economy was dragged by stalling private consumption and exports though extremely
Global Developments & Credit Update
 Global Developments & Credit Update Vera Chaplin Managing Director Asia Pacific Structured Finance Ratings November 2015 Permission to reprint or distribute any content from this presentation requires
Earnings Presentation Material
 Fiscal Year Ended March 31, 2017 Earnings Presentation Material May 2017 J Trust Co., Ltd. Copyright(C)2017 JTRUST Co.,Ltd. All Rights Reserved. Table of contents 1. Key Point of Full-Year Results 2. Overview
BANKING SECTOR. Rationale for report: Banking statistics for January 2017
 BANKING SECTOR Sector Report 2 March 2017 Kelvin Ong,CFA kelvin-ong@ambankgroup.com 03-20362294 Higher deposit growth with stronger CASA momentum Rationale for report: Banking statistics for January 2017
THIRD QUARTER FISCAL YEAR 2018 Earnings Conference Call & Presentation. August 7, 2018 at 9:00 a.m. CT (10:00 a.m. ET)
") THIRD QUARTER FISCAL YEAR 2018 Earnings Conference Call & Presentation August 7, 2018 at 9:00 a.m. CT (10:00 a.m. ET) 1 Third Quarter Fiscal Year 2018 Welcome to Nexeo s Earnings Conference Call and Presentation
THIRD QUARTER FISCAL YEAR 2018 Earnings Conference Call & Presentation August 7, 2018 at 9:00 a.m. CT (10:00 a.m. ET) 1 Third Quarter Fiscal Year 2018 Welcome to Nexeo s Earnings Conference Call and Presentation
Summary of Financial Results for the First Quarter of Fiscal 2018 <Under Japanese GAAP> July 31, 2018
 Summary of Financial Results for the First Quarter of Fiscal 08 July, 08 Contents Overview of Income Statement Overview of Balance Sheet Overview of Loans Non-interest Income P. P.
Result Review on 2 nd Qtr of Fiscal 2017 that ends in March October 27, 2017
 Result Review on 2 nd Qtr of Fiscal 217 that ends in March 218 October 27, 217 Table of contents Overview of Consolidated Financial Results Financial Summary Total Revenues Commissions Trading Profit and
Summary of Consolidated Financial Statements for the Nine Months ended September 30,2012 (Japanese GAAP)
") Summary of Consolidated Financial Statements for the Nine Months ended September 30,2012 (Japanese GAAP) November 6, 2012 Company name HORIBA, Ltd. Listed stock exchanges: Tokyo, Osaka Listing code 6856
Summary of Consolidated Financial Statements for the Nine Months ended September 30,2012 (Japanese GAAP) November 6, 2012 Company name HORIBA, Ltd. Listed stock exchanges: Tokyo, Osaka Listing code 6856
Our Strengths. About ORIX. Trend in Net Income Attributable to ORIX Corporation
 Our Strengths CONTENTS 1 Our Strengths 6 To Our Shareholders A Message from CEO Yoshihiko Miyauchi Medium- and long-term management strategy 1 A Message from COO Yukio Yanase Results for the fiscal year
Pioneer Announces Business Results for 3Q Fiscal 2018
 For Immediate Release February 9, 2018 Pioneer Announces Business Results for 3Q Fiscal 2018 Pioneer Corporation today announced its consolidated third-quarter and nine-month business results for the period
Summary of Financial Results for the Third Quarter of Fiscal 2017 <Under Japanese GAAP> January 31, 2018
 Summary of Financial Results for the Third Quarter of Fiscal 2017 January 31, 2018 Contents Overview of Income Statement Overview of Balance Sheet Overview of Loans Non-interest Income
Consolidated Financial Results for the 1 st Half of FYE 2019
 Consolidated Financial Results for the 1 st Half of SUBARU CORPORATION Toshiaki Okada Corporate Executive Vice President & CFO November 5 th, 2018 1 Summary Consolidated Financial Results for the 1 st
Announcement of Shelf Registration for Disposal of Treasury Stock through (planned) Third-Party Allotment
 Third-Party Allotment") May 9, 2014 FOR IMMEDIATE RELEASE Contact Information: ORIX Corporation Corporate Planning Department Tel: +81-3-3435-3121 Fax: +81-3-3435-3154 URL: www.orix.co.jp/grp/en/ Announcement of Shelf Registration
May 9, 2014 FOR IMMEDIATE RELEASE Contact Information: ORIX Corporation Corporate Planning Department Tel: +81-3-3435-3121 Fax: +81-3-3435-3154 URL: www.orix.co.jp/grp/en/ Announcement of Shelf Registration
Financial Highlights under Japanese GAAP for 3rd Quarter of Fiscal Year Ending March 31, 2018
 Financial Highlights under Japanese GAAP for 3rd Quarter of Fiscal Year Ending March 31, 2018 February 2, 2018 Mitsubishi UFJ Financial Group, Inc. This document contains forward-looking statements regarding
Flash Report for the Fiscal Year ended December 31, 2013 [Japan GAAP] (on a consolidated basis)
![Flash Report for the Fiscal Year ended December 31, 2013 [Japan GAAP] (on a consolidated basis)](/thumbs/91/106826542.jpg "Flash Report for the Fiscal Year ended December 31, 2013 [Japan GAAP] (on a consolidated basis)") Flash Report for the Fiscal Year ended December 31, [Japan GAAP] (on a consolidated basis) January 31, 2014 Company Name: OPT, Inc. Stock exchange listing: Tokyo Stock Code: 2389 URL http://www.opt.ne.jp/
Flash Report for the Fiscal Year ended December 31, [Japan GAAP] (on a consolidated basis) January 31, 2014 Company Name: OPT, Inc. Stock exchange listing: Tokyo Stock Code: 2389 URL http://www.opt.ne.jp/
UNITED STATES SECURITIES AND EXCHANGE COMMISSION Washington, D. C FORM 6-K
 UNITED STATES SECURITIES AND EXCHANGE COMMISSION Washington, D. C. 20549 FORM 6-K Report of Foreign Private Issuer Pursuant to Rule 13a-16 or 15d-16 under the Securities Exchange Act of 1934 For the month
Financial Results for the First Half of the Fiscal Year Ending March 31, 2015
 Financial Results for the First Half of the Fiscal Year Ending March 31, 2015 NOK CORPORATION (7240 / TSE1) November 2014 Disclaimer Any plans, targets, forecasts, strategies, policies and opinions relating
Financial Results. Fiscal Year 3/2013 -Supplementary Information- Sumitomo Mitsui Financial Group, Inc. Sumitomo Mitsui Banking Corporation
 Financial Results Fiscal Year 3/2013 -Supplementary Information- Sumitomo Mitsui Financial Group, Inc. Sumitomo Mitsui Banking Corporation Financial highlights for Table of contents Page 1. Income analysis
Overview of Principal Group Companies and Bases
 Overview of Principal Group Companies and Bases Operations in Japan Principal Established ORIX Business (Acquired) Ownership Corporate Financial Services Leasing, Lending, Other Financial Services Apr.
Financial Results of FY2014 Third Quarter
 Financial Results of FY2014 Third Quarter Mitsubishi Motors Corporation February 3, 2015 FY2014 Third Quarter Financial Results All-new Triton 1 FY2014 1-3Q Results Summary (vs. 1-3Q) Increased Year-on-year
Summary of Financial Results for Fiscal 2017 <Under Japanese GAAP> May 15, 2018
 Summary of Financial Results for Fiscal 07 May 5, 08 Contents Overview of Income Statement Overview of Balance Sheet Overview of Loans Non-interest Income P. P.3 P.4 P.5 Financial
Fuji Heavy Industries Ltd.
 President & CEO, Yasuyuki Yoshinaga Fuji Heavy Industries Ltd. May 9, 2014 0 Business Results for the FYE2014 ( 100M) Consolidated automobile sales FYE2013 FYE2014 YoY 724,000 825,000 High +13.9 % Net
Koichi Mukai Chairman & CEO Founder-Owner
 2Q FY3/19 Financial Results Materials for Institutional Investors COMTURE CORPORATION Transforming needs into solutions October, 2018 Koichi Mukai Chairman & CEO Founder-Owner 1 FY ending March 2019: 2
Financial Results for the Second Quarter of
 Energy and Environment in Harmony Kunitomi CIS Solar Cell Plant and Mega Solar Courtesy of Solar Frontier K.K. Financial Results for the Second Quarter of Fiscal Year Ending March 31, 2012 November 10,
2.1 Supply. Bank of Thailand, January Nominal Farm Income. Manufacturing Production Index (MPI)
") Bank of Thailand, uary 2.1 Supply Farm income continually increased but concentrated in certain crops and regions. Service sector continued to expand, especially for tourism-related activities on the back
Bank of Thailand, uary 2.1 Supply Farm income continually increased but concentrated in certain crops and regions. Service sector continued to expand, especially for tourism-related activities on the back
Japanese Stock Market Outlook. SMAM monthly comments & views - January
 Japanese Stock Market Outlook SMAM monthly comments & views - January 2015 - Executive summary Japanese Economy SMAM forecasts the Japanese economy to bottom-out from the 1Q 2015 as private consumption
Flash Report for the Fiscal Year Ended December 31, 2016 [Japan GAAP] (on a consolidated basis) February 13, 2017
![Flash Report for the Fiscal Year Ended December 31, 2016 [Japan GAAP] (on a consolidated basis) February 13, 2017](/thumbs/95/123620510.jpg "Flash Report for the Fiscal Year Ended December 31, 2016 [Japan GAAP] (on a consolidated basis) February 13, 2017") Flash Report for the Fiscal Year Ended December 31, 2016 [Japan GAAP] (on a consolidated basis) February 13, 2017 Company Name: OPT Holding, Inc. Stock Exchange Listing: Tokyo Stock Code: 2389 URL http://www.opt.ne.jp/english/holding/
Flash Report for the Fiscal Year Ended December 31, 2016 [Japan GAAP] (on a consolidated basis) February 13, 2017 Company Name: OPT Holding, Inc. Stock Exchange Listing: Tokyo Stock Code: 2389 URL http://www.opt.ne.jp/english/holding/
ANNOUNCEMENT OF FINANCIAL RESULTS PANASONIC REPORTS FISCAL 2014 ANNUAL RESULTS
 FOR IMMEDIATE RELEASE Media Contacts: April 28, 2014 Investor Relations Contacts: Megumi Kitagawa (Japan) Hayato Wakabayashi (Japan) Global Public Relations Office Corporate Finance & IR Group (Tel: +81-3-3574-5664)
Matsui Securities Co., Ltd.
 Matsui Securities Co., Ltd. (First Section of Tokyo Stock Exchange: 8628) Financial Results for 1H FY25 November 25 Contents Section 1 Highlights of 1H FY25 2 Section 2 Summary of Financial Results (Consolidated)
Overview of 1Q, FY3/2019 performance. July 30, 2018
 Overview of, FY3/219 performance July 3, 218 This document contains forward-looking statements (as defined in the U.S. Private Securities Litigation Reform Act of 1995), regarding the intent, belief or
~30.00 ~30.00 (Note) Correction from the dividend forecast recently announced: None
 Correction from the dividend forecast recently announced: None") FY2019 March The 1Q Summary of Accounting Statements [Japanese Standards] (consolidated) August 10, 2018 Listed company name Tamagawa Holdings Co., Ltd. Exchange Tokyo Code No. 6838 URL http://www.tmex.co.jp
FY2019 March The 1Q Summary of Accounting Statements [Japanese Standards] (consolidated) August 10, 2018 Listed company name Tamagawa Holdings Co., Ltd. Exchange Tokyo Code No. 6838 URL http://www.tmex.co.jp
UNITED STATES SECURITIES AND EXCHANGE COMMISSION Washington, D. C FORM 6-K
 UNITED STATES SECURITIES AND EXCHANGE COMMISSION Washington, D. C. 20549 FORM 6-K Report of Foreign Private Issuer Pursuant to Rule 13a-16 or 15d-16 under the Securities Exchange Act of 1934 For the month
Markets at a Glance. India Q2 CY For Distributors use only
 Markets at a Glance India Q CY 17 For Distributors use only India Macro Economy Trade Inflation Monetary Sector Valuations Liquidity Macro Economy GDP Emerging vs Developed (In % YoY) Credit Growth vs