eq Group - 12 September 2018
|
|
|
- Catherine Baldwin
- 5 years ago
- Views:
Transcription

1 eq Group - 12 September 2018
2 eq Full service asset manager and corporate finance advisor Asset Management Corporate Finance Investments Oma sijoitustoimint Full service asset manager Advium From own balance sheet Full range of mutual funds Private equity Real estate asset management Assets under management 8.9 bn at 30 June 2018 Mergers and acquisitions Large real-estate transactions ECM transactions Over 180 closed transactions since 2000 Investments in 13 private equity fund and 9 fund of funds 18.4 million invested at 30 June 2018 eq Leading Finnish asset manager Finnish asset manager with strong ownership and committed personnel The personnel owns approximately 40% of eq Nasdaq Helsinki listed Market cap 316 million euro (30 June 2018) CEO: Janne Larma Chairman: Georg Ehrnrooth Personnel: 88 (30 June 2018) 2
3 eq Group Rolling 12 months Net revenue development, rolling 12 months ( m) Operating profit development, rolling 12 months ( m) 45,0 40,0 35,0 30,0 25,0 20,0 15, ,0 18,0 13,0 8, ,0 3,0 5,0 0,0-2,0 Asset Management Investments Consolidated Corporate Finance Group Administration Asset Management Investments Consolidated Corporate Finance Group Administration eq Group s rolling 12-month operating profit has already grown for 17 consecutive quarters. 3
4 Asset Management

5 eq Asset Management Full service asset manager eq Asset Management offers versatile and innovative asset management services to both institutions and individuals Wide selection of asset management services from single fund to discretionary mandates 26 mutual funds Private Equity fund of funds / -mandates Real Estate funds Mutual funds of the international partners Reporting and administration services Excellent track-record Number of personnel 69 Services Institutions High-net-worth individuals Customers Assets under management 8.9 bn SFR 2017 Research: Best quality of the service evaluating investment return, customer services and asset management resources SFR 2017 Research: The second most used asset manager in the market 5
6 SFR research 2017 Most used institutional asset managers Asset management ratings in quality Evli 59% eq 3,86 eq 55% Evli 3,85 Nordea 54% Aktia 3,77 OP 54% Mandatum Life 3,77 SEB Danske Capital Aktia Mandatum Life Fondita Taaleri United Bankers 49% 48% 36% 29% 26% 24% 23% Danske Capital LähiTapiola Taaleri KJK Capital SEB Seligson 3,73 3,73 3,68 3,67 3,67 3,67 LähiTapiola 21% Fondita 3,62 Seligson 13% Nordea 3,57 KJK Capital 11% United Bankers 3,56 Handelsbanken 10% Handelsbanken 3,55 FIM 9% OP 3,54 6
7 Asset Management Rolling 12 months Net revenue development, rolling 12 months ( m) Operating profit development, rolling 12 months ( m) Asset Management segment s rolling 12-month operating profit has already grown for 22 consecutive quarters. 7
8 Asset Management Income statement EUR million 1-6/ /2017 Change % 1-12/2017 NET REVENUE % 33.9 Personnel expenses % Other administrative expenses % -1.7 Depreciation % -0.2 Other operating expenses % -1.3 OPERATING PROFIT % 18.0 Cost-income ratio, % %
9 Asset Management Fee income and Aum EUR million 1-6/ /2017 Change % 1-12/2017 Management fees Traditional AM % 8.9 Management fees Real-estate and PE % 18.4 Other fees % 0.6 Performance based fees % 6.4 TOTAL % 34.3 Assets under management 6/2018 Fee income 1-6/2018 PE 5.4 Billion Investment funds 2.4 Billion Performance based 7% Other fees 1% Traditional AM 25% 6/ Billion 1-6/ Million Business partners and other 1.0 Billion Real-estate and PE 66% 9
10 Asset Management Mutual funds Gros returns 29 June 2018 Since the beginning of the year 12 months 3 years p.a. Morning- Fund Return* Comparison Diff. Return* Comparison Diff. Return* Comparison Diff. star Fixed income funds eq Money Market -0,11 % -0,15 % 0,06 % no rating eq Euro Floating Rate -0,81 % -0,17 % -0,64 % 0,08 % -0,33 % 0,42 % 0,90 % -0,24 % 1,14 % no rating eq Government Bond -0,48 % 0,55 % -1,02 % 0,73 % 1,69 % -0,97 % 2,51 % 2,32 % 0,19 % eq Euro Investment Grade -0,96 % -0,56 % -0,40 % 1,54 % 1,17 % 0,36 % 3,71 % 2,51 % 1,20 % eq High Yield -1,12 % -1,32 % 0,20 % 0,37 % 0,84 % -0,47 % 5,09 % 4,40 % 0,69 % eq Emerging Markets Corporate Bond -3,56 % -3,75 % 0,19 % -1,90 % -2,30 % 0,41 % 1,81 % 2,09 % -0,28 % eq Emerging Markets Corporate Bond Local -3,67 % -3,81 % 1,57 % Equity funds eq Finland 7,73 % 9,64 % -1,91 % 5,78 % 9,78 % -4,00 % 12,45 % 12,78 % -0,33 % eq Nordic Small Cap 2,84 % 6,35 % -3,52 % -6,04 % 7,79 % -13,83 % 9,67 % 11,49 % -1,82 % eq Europe Property 19,03 % 1,62 % 17,41 % 30,38 % 8,84 % 21,54 % 12,37 % 4,81 % 7,56 % eq Europe Dividend -3,54 % -0,48 % -3,07 % -4,19 % 1,44 % -5,63 % 3,16 % 3,16 % -0,00 % eq Frontier Markets -2,25 % -8,33 % 6,08 % 0,26 % -0,66 % 0,92 % 3,31 % 0,57 % 2,75 % eq CO2 10,20 % 3,29 % 6,91 % 15,68 % 8,52 % 7,16 % 12,93 % 6,80 % 6,13 % no rating eq Emerging Asia -10,75 % -1,72 % -9,03 % -5,25 % 7,81 % -13,06 % -1,25 % 5,59 % -6,84 % eq Emerging Dividend 2,12 % -4,00 % 6,12 % 11,34 % 5,70 % 5,64 % 7,24 % 3,97 % 3,28 % eq Emerging Markets Small Cap 6,38 % -5,84 % 12,23 % 16,48 % 3,26 % 13,21 % no rating eq Russia -2,55 % 2,82 % -5,37 % 6,45 % 12,64 % -6,19 % 15,33 % 5,43 % 9,90 % Real Estate Funds eq Care 5,29 % 11,89 % 11,69 % no rating eq Finnish Real Estate 4,96 % 11,91 % 12,30 % no rating Balanced Funds eq Mandate 0,77 % 2,73 % Funds managed by business partners eq Euro Investment Grade Bond Index -0,08 % -0,35 % 0,26 % 1,41 % 1,12 % 0,29 % 2,16 % 2,00 % 0,16 % eq Europe Active 7,70 % -0,48 % 8,18 % no rating eq Europe Stock Index -0,19 % -0,48 % 0,29 % 3,22 % 2,85 % 0,38 % 2,96 % 2,61 % 0,35 % eq Japan Stock Index 0,78 % 0,76 % 0,02 % 7,98 % 7,96 % 0,03 % 4,57 % 4,60 % -0,03 % eq Emerging Markets Stock Index -4,54 % -4,00 % -0,54 % 5,34 % 5,70 % -0,36 % 3,89 % 3,97 % -0,07 % eq US Stock Index 5,25 % 5,27 % -0,02 % 11,07 % 11,08 % -0,01 % 9,54 % 9,51 % 0,03 % Average (funds managed by eq) 1,51 % -0,10 % 1,27 % 4,82 % 3,48 % 0,29 % 6,05 % 3,46 % 1,24 % Funds that have exceeded the comparison index (Funds managed by eq) 47 % 53 % 64 % 10
11 Asset Management eq Real Estate funds eq Care eq Finnish Real Estate Invests in modern care properties Well-diversified portfolio 159 properties Investments in properties catering to different care sectors with a broad geographical spread focusing on Southern Finland Tenants include leading public and private sector care providers Avg. lease maturity: 8 years Vacancy 0% Invests in commercial real estate Currently 33 properties in the investment portfolio Focus on mainly office and retail properties Well-diversified tenant base with blue chip tenants such as Alko, HUS, Kesko, Lidl, Nordea, Posti, Power, SATO, S-Ryhmä, Tokmanni, XXL The properties are located in the Helsinki area and other Finnish growth regions Avg. lease maturity: 6 years Vacancy 5% Invested capital: 787 Equity (NAV): 611m 2018 YTD net subscriptions: 99m Invested capital: 655m Equity (NAV): 551m 2018 YTD net subscriptions: 112m Return 2018 YTD: 4.3% Return from start: 9.0% p.a. Return 2018 YTD: 4.0 % Return from start: 10.2 % p.a. 11
12 Asset Management Private Equity Private Equity - Fund of funds Founded Fund Size Stage Investors 2018 eq PE SF II 98m Investing, 3rd close eq PE X North 141m Investing, 3rd close eq PE SF 138m Fully invested eq PE IX US $105m Investing eq PE VIII North 160m Fully invested eq PE VII US $80m Fully invested eq PE VI North 130m Fully invested Amanda V East 50m Fully invested Amanda IV West 90m Fully invested Amanda III Eastern PE 110m Fully invested Mandatum PE Fund II 20m Fully invested Mandatum PE Fund I 50m Fully invested European Fund Inv. UK 88m Fully invested 15 Reporting services 3.6 Bn Aum 5.4 Bn FoF 1.3 Bn Mandates 0.5 Bn The goal is to set up at least one new fund every year Private Credit Founded Fund Size Stage Investors 2017 eq Private Credit 92m Investing 38 Managed accounts Manages private equity operations of clients Example of clients Church of Finland Finnish Cultural Foundation Technology Industries of Finland and foundations within the field of technology Professional team with lot of experience and exceptional investment success, average return of 21% p.a. (1997-Q2 2018) 12
13 Corporate Finance
14 Corporate Finance Advium Corporate Finance Leading Finnish Corporate Finance advisor Completed over 180 transactions for a value of more than 13 billion euro 14 professionals with experience from Corporate Finance, Private Equity and Real Estate transactions Mergers & acquisitions Leading Finnish M&A advisor Divestments Acquisitions Feasibility studies Other services Some 100 completed transactions since 2000 value of approx. 5.0 billion Real estate transactions # 1 Finnish real estate advisor Portfolio and large single-asset transactions Sale and leaseback transactions Other services Over 80 completed transactions since 2000 value of approx. 9.0 billion TNS Prospera: Advium fourth best M&A advisor in Finland Euromoney: Adviumin has been awarded as best Finnish real estate advisor twelve times since


15 Corporate Finance Select M&A References 15


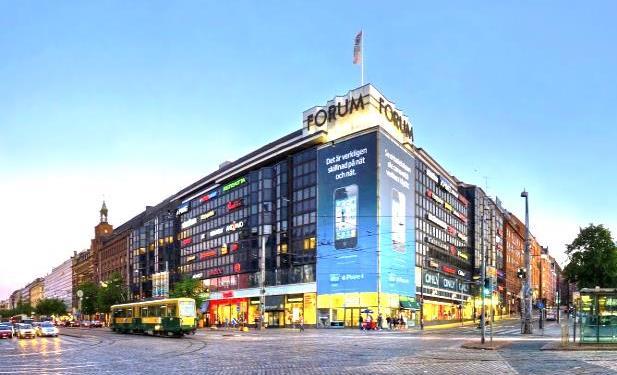

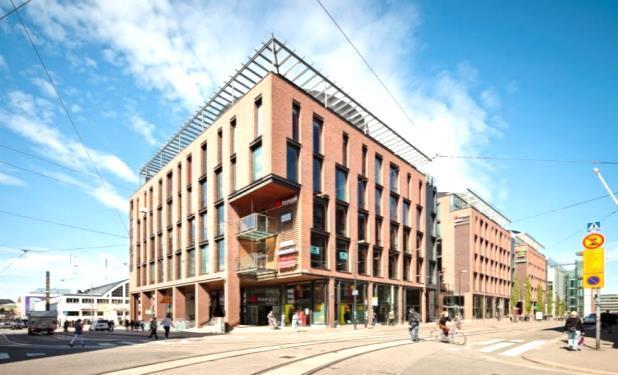
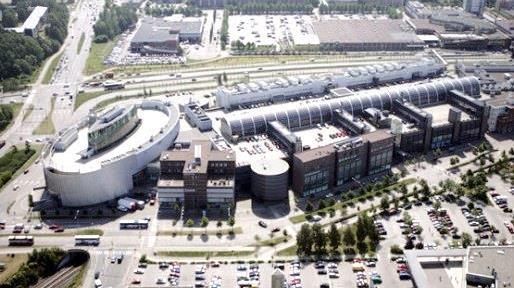
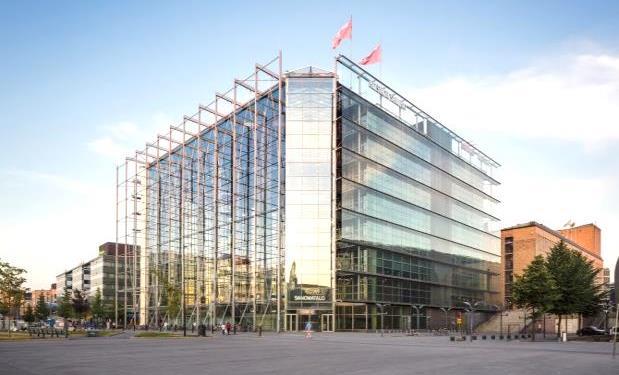
16 Corporate Finance Select Real Estate References Sale of Forum block 16
17 Corporate Finance Key figures Net revenue development, rolling 12 months ( m) Operating profit development, rolling 12 months ( m) EUR million 1-6/ /2017 Change % 1-12/2017 NET REVENUE % 5.2 Personnel expenses % -2.5 Other administrative expenses % -0.4 Depreciation % -0.0 Other operating expenses % -0.3 Impairment losses of receivables OPERATING PROFIT % 2.0 Cost-income ratio, % %
18 Investments
19 Investments Key figures EUR million 1-6/ Returned capital (excl. profit) Distribution of profits Capital calls Net cash flow Market value Share of eq-managed fund of funds 80% 76% 69% Investment commitments Profit and loss: Distribution of profits Value changes recognized through p&l Write-downs Group internal management fee Profit of the Investments segment eq Plc only makes new private equity fund investments in funds managed by eq. In 2018 eq Plc made an EUR 1.0 million investment commitment to the eq PE X North Fund. The value changes of the investments have been recognised through p&l since the beginning of 2018 as a result of the new IFRS 9 standard. 19

20 eq s share
21 Shareholders 30 June 2018 Shareholder Shares % of shares The number of shareholders 1 Fennogens Investments S.A Chilla Capital S.A Anchor Oy Ab Teamet Oy Oy Cevante Ab Fazer Jan Peter Linnalex Ab Lavventura Oy Pinomonte Ab Prius Oy largest shareholders total Nominee registered Other shares Total Q Q Q Q Q Q Flagging announcements 4 June 2018: Fennogens Investments S.A. announced that it had acquired shares of eq Plc so that its holding exceeded the 20 per cent flagging threshold. Rettig Capital Oy Ab (subsidiary Anchor Oy Ab) announced that it had acquired shares of eq Plc so that its exceeded the 15 per cent flagging threshold. Umo Capital Oy announced that it had sold shares of eq Plc so that its holding fell below the 10 and 5 per cent flagging thresholds. eq Group s personnel owns about 40% of the shares eq Plc had shareholders on 30 June 2018 (5 048 shareholders on 31 December 2017) 21
22 Share price development 10,00 9,00 8,00 7,00 6,00 5,00 4,00 eq Plc OMXH 3,00 2,00 1,00 0,00 The Market value of eq Plc was million euro on 7 September
23 Dividend policy and history eq Plc aims at distributing the profit for the financial year as dividend. In addition to the dividend, eq Plc may repay equity to its shareholders from the reserve for invested unrestricted equity. The equity repayment can be paid from the net cash flows of the capital returns and capital calls from own private equity funds operations. When deciding on the dividend and equity repayment, if any, the company shall take into consideration its liquidity, the capital requirements set by authorities and development needs of business operations. 0,60 14% 0,50 0,40 0,30 0,20 0,10 0,15 0,30 0,20 0,20 0,30 0,15 0,35 0,07 0,43 12% 10% 8% 6% 4% 2% Equity repayment Dividend Dividend Yield % 0, % 23
24 eq Group Latest key figures EUR million 1-6/ /2017 Change% 1-12/2017 Net revenue % 40.7 Operating profit % 20.1 Profit for the period % 15.9 Earnings per share (EUR) % 0.43 Cost income -ratio, % % 50.5 Liquid assets % 24.7 Investments in private equity funds %
25 eq Group Balance sheet - 30 June 2018 ASSETS LIABILITIES AND EQUITY (EUR million) 6/ /2017 (EUR million) 6/ /2017 Liquid assets Other liabilities Claims on credit institutions Accruals and deferred income Income tax liabilities Financial assets Deferred tax liabilities Financial securities Private equity fund investments TOTAL LIABILITIES Intangible assets Share capital Tangible assets Fair value reserve Reserve for invested unrestricted equity Other assets Retained earnings Accruals and prepaid expenditure Profit (loss) for the period Income tax receivables Deferred tax assets TOTAL SHAREHOLDERS EQUITY TOTAL ASSETS TOTAL LIABILITIES AND EQUITY Liquid assets 9.2 M Private equity fund investments 18.4 M Interest-bearing liabilities 0.0 Solvency ratio 12.8% 25
Q INTERIM REPORT
 Q3 2016 INTERIM REPORT eq PLC STOCK EXCHANGE RELEASE 3 November 2016 at 8:00 a.m. eq PLC S INTERIM REPORT Q3 2016 eq GROUP'S PROFIT GREW BY 27% January to September 2016 in brief During the period under
FINANCIAL STATEMENTS RELEASE
 2018 FINANCIAL STATEMENTS RELEASE eq PLC FINANCIAL STATEMENTS RELEASE 7 February 2019, at 8:00 AM eq PLC S FINANCIAL STATEMENTS RELEASE 2018 eq S RESULT INCREASED BY 12%, DISTRIBUTION PROPOSAL OF EUR 0.54
Q INTERIM REPORT
 Q2 2015 INTERIM REPORT eq PLC STOCK EXCHANGE RELEASE 13 August 2015 at 08:00 a.m. eq PLC S INTERIM REPORT 1 JANUARY TO 30 JUNE 2015 eq GROUP'S PROFIT GREW BY MORE THAN 75% January to June 2015 in brief
INTERIM REPORT Q2 2014
 INTERIM REPORT Q2 2014 eq PLC STOCK EXCHANGE RELEASE 14 August 2014 at 08:45 a.m. eq PLC S INTERIM REPORT 1 JANUARY TO 30 JUNE 2014 INCOME FROM CLIENT OPERATIONS INCREASED BY ALMOST 50% AND PROFIT MORE
eq ANNUAL REPORT 2017
 ANNUAL REPORT 2017 eq ANNUAL REPORT 2017 CONTENT eq in brief...3 CEO s review... 5 Business areas... 7 Asset Management... 7 Corporate Finance... 14 Investments... 17 Financial Statements and Report by
Amanda Group 3. Year 2010 in Brief 4. CEO s Review 5. Report by the Board of Directors 1 January to 31 December
 Annual Report 2010 Content Amanda Group 3 Year 2010 in Brief 4 CEO s Review 5 Report by the Board of Directors 1 January to 31 December 2010 7 Group 10 Key Ratios, Consolidated 10 Calculation of Key Figures
AFFECTO PLC -- FINANCIAL STATEMENTS BULLETIN FEBRUARY 2013 at MEUR 10-12/ /
 1 FINANCIAL STATEMENTS BULLETIN 2012 AFFECTO PLC -- FINANCIAL STATEMENTS BULLETIN -- 14 FEBRUARY 2013 at 12.30 Affecto Plc's Financial Statements Bulletin 2012 Group key figures MEUR 10-12/12 10-12/11
Sampo plc Annual General Meeting Kari Stadigh Group CEO and President
 Sampo plc Annual General Meeting 2017 Kari Stadigh Group CEO and President 2016 was a good year for Sampo Group EURm 2,000 1,800 1,600 1,400 1,200 1,000 800 600 400 200 0-200 Sampo Group profit before
Shares and shareholders
 Shares and shareholders Shareholders At the end of December 2016, the number of registered shareholders in Caverion was 30,539. At the end of December 2016, a total of 35.1 percent of the were owned by
Pohjola Group. Interim Report for 1 January 30 September Pohjola/IR
 Pohjola Group Interim Report for 1 January 3 September 29 2 Contents Pohjola in Brief 3 Strategy and Financial targets 7 Interim Report for Q1 3/9 14 Review by Business Segment Banking 26 Asset Management
Exel Composites Plc Half-year Financial Report January June "Significant increase in order intake, revenue and operating profit"
 Exel Composites Plc Half-year Financial Report January June 217 "Significant increase in order intake, revenue and operating profit" Key figures January June 217 Revenue, EUR million Order intake, EUR
OKO Bank Presentation. Finnish Economy Finnish Financial Industry OP Bank Group OKO Bank Funding Strategy
 OKO Bank Presentation I II III IV V Finnish Economy Finnish Financial Industry OP Bank Group OKO Bank Funding Strategy 1 I Finnish Economy 2 Nordic countries in a nutshell Iceland Population: 0.3 million
Pohjola February 2009
 Pohjola February 2009 OP-Pohjola Group & Pohjola Bank in brief 2 The leading financial services company in Finland - with a strong diversified presence in Retail and corporate banking Insurance Mutual
INTERIM REPORT 5 NOVEMBER 2015
 Q3 INTERIM REPORT JANUARY SEPTEMBER 2015 5 NOVEMBER 2015 Contents 3 Summary 5 Third quarter 2015 in brief 6 Change in reporting practices as of 1 January 2016 7 Business areas 7 P&C insurance 10 Associated
QT GROUP PLC FINANCIAL STATEMENTS BULLETIN 1 JANUARY DECEMBER 2016
 QT GROUP PLC STOCK EXCHANGE RELEASE, 16 FEBRUARY 2016 at 8:00 QT GROUP PLC FINANCIAL STATEMENTS BULLETIN 1 JANUARY 2016 31 DECEMBER 2016 Qt Group Plc s fourth quarter 2016 STRONG GROWTH IN THE GLOBAL MARKET
Nordea Market s Insurance Seminar January 10, 2011 Group CFO Peter Johansson
 Nordea Market s Insurance Seminar 2011 January 10, 2011 Group CFO Peter Johansson Disclaimer This presentation may contain forward-looking statements that reflect management s current views with respect
INCAP GROUP HALF-YEAR REPORT
 INCAP GROUP HALF-YEAR REPORT January-June 2018 Incap Corporation Half-year financial report 15 August 2018 at 8.00 a.m. (EEST) INCAP GROUP HALF-YEAR FINANCIAL REPORT FOR JANUARY-JUNE 2018 (UNAUDITED):
Danske Bank acquires Sampo Bank. Primary markets and economies
 Danske Bank acquires Sampo Bank Primary markets and economies November 9, 26 Disclaimer This presentation is not for release, publication or distribution in Australia, Canada, the Hong Kong Special Administrative
MEUR 4-6/11 4-6/10 1-6/11 1-6/
 1 INTERIM REPORT 1-6/2011 AFFECTO PLC -- INTERIM REPORT -- 2 AUGUST 2011 at 9.30 AFFECTO PLC'S INTERIM REPORT 1-6/2011 GROUP KEY FIGURES MEUR 4-6/11 4-6/10 1-6/11 1-6/10 2010 Net sales 32.6 28.4 62.7 54.2
Strong Increase in Net Sales and Profit
 1 (16) Ramirent Group s Interim Report January March, 2006 Strong Increase in Net Sales and Profit Net sales increased by 35.4% compared to the first quarter of 2005 and totalled EUR 105.1 (77.6) million
1 Pohjola April 2008
 Pohjola April 2008 1 OP-Pohjola Group & Pohjola Bank in brief 2 The leading financial services company in Finland - with a strong diversified presence in Retail and corporate banking Insurance Mutual Funds
Contents. Sampo Group Interim Report January September Contents. Summary 3
 Contents Contents Summary 3 THIRD quarter 2013 in brief 4 Business areas 5 P&C insurance 5 Associated company Nordea Bank Ab 8 Life insurance 10 Holding 12 Other developments 13 Personnel 13 Remuneration
Morgan Stanley Financial Services Conference
 Morgan Stanley Financial Services Conference Group CEO and President, Björn Wahlroos April 1 st, 2009 Sampo Group s History The 21st century in Sampo Group has been reflected by several structural changes.
Corporate Governance Statement 2016
 Corporate Governance Statement 2016 I. INTRODUCTION eq Plc (the company) is a Finnish public limited liability company the shares of which are listed on Nasdaq Helsinki Ltd (Helsinki Stock Exchange). This
Pohjola November 2008
 Pohjola November 2008 1 OP-Pohjola Group & Pohjola Bank in brief 2 The leading financial services company in Finland - with a strong diversified presence in Retail and corporate banking Insurance Mutual
Incap Group Half-Year Financial Report January-June (unaudited)
") Incap Group Half-Year Financial Report January-June 2017 (unaudited) 23 August 2017 Incap Corporation Half-year financial report 23 August 2017 at 8.00 a.m. (EEST) INCAP GROUP HALF-YEAR FINANCIAL REPORT
Incap Group Half-Year Financial Report January-June 2017 (unaudited) 23 August 2017 Incap Corporation Half-year financial report 23 August 2017 at 8.00 a.m. (EEST) INCAP GROUP HALF-YEAR FINANCIAL REPORT
Supplementary Financial Information JANUARY DECEMBER 2017
 Supplementary Financial Information JANUARY DECEMBER 2017 1 Disclaimer This presentation may contain forward-looking statements that reflect management s current views with respect to certain future events
Supplementary Financial Information JANUARY JUNE 2018
 Supplementary Financial Information JANUARY JUNE 2018 Disclaimer This presentation may contain forward-looking statements that reflect management s current views with respect to certain future events and
Interim Report January-June Nordea Bank Finland Plc
 Interim Report January-June 2004 Nordea Bank Finland Plc Interim Report, January-June 2004 Summary The Finnish economy picked up in the first half of 2004. Private consumption growth remained robust underpinned
Half-Year Report. Second quarter: Business proceeded as planned, full-year outlook unchanged
 Qt Group Plc Stock Exchange Release, 10 August 2017 at 8:00 a.m. Half-Year Report 1 January 2017 30 June 2017 Second quarter: Business proceeded as planned, full-year outlook unchanged April June 2017
PART I STRATEGY AND MARKET POSITION. Strategy
 PART I STRATEGY AND MARKET POSITION Strategy Vision Customers Personnel Investors The most attractive and successful bank in Finland. Growth Profitability Shareholder value Mission To create economic value
AKTIA BANK PLC INTERIM REPORT 1-3/2014
 AKTIA BANK PLC INTERIM REPORT 1-3/2014 Strong Net commission income, Expenses down 4% Operating profit was EUR 16.4 (19.5) million. Net commission income was up 11% but NII down to EUR 25.4 (30.1) million.
Sampo plc Annual General Meeting Kari Stadigh Group CEO and President
 Sampo plc Annual General Meeting 2018 Kari Stadigh Group CEO and President Solid result within insurance EURm 3,000 Sampo Group profit before taxes by segment 2,600 2,482 2,200 1,800 1,668 1,759 1,888
Half Yearly Report January June 2017
 Half Yearly Report January June 2017 Ari Lehtoranta, President and CEO Martti Ala-Härkönen, CFO July 20, 2017 Contents Group development Cash flow and financing Market outlook and guidance for 2017 Operating
NORDIC ALUMINIUM PLC STOCK EXCHANGE RELEASE August 17, am 1/1
 NORDIC ALUMINIUM PLC STOCK EXCHANGE RELEASE August 17, 2012 10.00 am 1/1 Oy Lival Ab s takeover bid for Nordic Aluminium Plc s shares starts on 20 August 2012 Nordic Aluminium Oyj ( Nordic Aluminium or
Half-Year Financial Report 9 AU G U S T
 Q2 Half-Year Financial Report January June 2017 9 AUGUST 2017 Contents Summary 3 Second quarter 2017 in brief 5 Business areas 6 P&C insurance 6 Associated company Nordea Bank AB 9 Life insurance 11 Holding
DIGIA'S FINAL QUARTER 2015: CONTINUED STRONG NET SALES GROWTH (12.2%)
") DIGIA PLC FINANCIAL STATEMENT RELEASE, 4 FEBRUARY 2016 AT 08:00 DIGIA'S FINAL QUARTER 2015: CONTINUED STRONG NET SALES GROWTH (12.2%) Summary January-December Consolidated net sales EUR 107.9 (97.4) million,
DIGIA PLC FINANCIAL STATEMENT RELEASE, 4 FEBRUARY 2016 AT 08:00 DIGIA'S FINAL QUARTER 2015: CONTINUED STRONG NET SALES GROWTH (12.2%) Summary January-December Consolidated net sales EUR 107.9 (97.4) million,
Interim Report January September 2017
 Interim Report January September 2017 Ari Lehtoranta, President and CEO Martti Ala-Härkönen, CFO October 27, 2017 Contents Group development Cash flow and financing Market outlook and guidance for 2017
Financial Statement Release
 2017 Financial Statement Release 7 FE B RUARY 201 8 Contents Summary 3 Fourth quarter in brief 5 Business areas 6 If 6 Topdanmark 9 Associated company Nordea Bank AB 10 Mandatum Life 12 Holding 14 Other
Financial statements
 Qt Group Plc, Stock Exchange Release February 15, 2019, at 8:00 a.m. Financial statements bulletin January 1 December 31, 2018 Net sales increased by 10.2 percent full-year growth was 25.7 percent Fiscal
Interim Statement 1 1 M AY
 Q1 Interim Statement January March 2017 11 MAY 2017 Contents Summary 3 Business areas 5 P&C insurance 5 Associated company Nordea Bank AB 7 Life insurance 9 Holding 11 Other developments 12 Annual General
Detection Technology. Financial statements. and Board of Directors report
 Detection Technology Financial statements and Board of Directors report 2016 2 Detection Technology Board of Directors report 2016 Board of Directors report Financial year 2016 in brief The 2016 financial
STOCK EXCHANGE RELEASE 29 AUGUST 2018 at 9:00 hrs
 DIGITALIST GROUP INTERIM REPORT 1 JANUARY - 30 JUNE 2018 DIGITALIST 2018 INTERNATIONALIZING GROWTH SUMMARY April June 2018 (figures for 2017 in brackets): Turnover EUR 6.2 million (EUR 4.7 million), growth
Ramirent Group s Interim Report January March, 2005
 Ramirent Group s Interim Report January March, 2005 RAMIRENT GROUP S INTERIM REPORT JANUARY MARCH, 2005 FIRST QUARTER HIGHLIGHTS Net sales increased by 26.8% and totalled EUR 77.6 (61.2) million. Operating
Sponda Financial Results Q November 2015
 Sponda Financial Results Q3 2015 3 November 2015 1. Highlights for the Period Kari Inkinen 2. Strategy Implementation Pia Arrhenius 3. Business environment and Business Update Kari Inkinen 4. Financials
INTERIM REPORT H1/2018
 INTERIM REPORT H1/2018 MIKA VIRTANEN, CEO ILKKA MIETTINEN, CFO 16 AUGUST 2018 ROBIT A GENUINE GROWTH COMPANY GROWTH COMPANY ~26% p.a. 19 ~150 Organic and structural growth Sales growth of last 12 years
Financial statements bulletin
 Qt Group Plc Stock Exchange Release, 16 Feb 2018 at 8:00 a.m. Financial statements bulletin 1 January 31 December 2017 Fourth quarter: Net sales increased by 14.3 per cent Fiscal year 2017 Net sales increased
Year-end Report For the period January December 2015 February 12, 2016
 Year-end Report For the period January December February 12, 2016 January December Compared to January December 2014 Net operating profit improved by 35 per cent to EUR 30.3 M (22.4). Profit for the period
Operating result totalled EUR 12.1 (7.3) million, equalling 10.5 (8.0) per cent of net sales.
 million, equalling 10.5 (8.0) per cent of net sales.") PONSSE PLC, STOCK EXCHANGE RELEASE, 19 APRIL 2016, 9:00 a.m. PONSSE S INTERIM REPORT FOR 1 JANUARY 31 MARCH 2016 Net sales amounted to EUR 115.1 (91.2) million. Operating result totalled EUR 12.1 (7.3)
PONSSE PLC, STOCK EXCHANGE RELEASE, 19 APRIL 2016, 9:00 a.m. PONSSE S INTERIM REPORT FOR 1 JANUARY 31 MARCH 2016 Net sales amounted to EUR 115.1 (91.2) million. Operating result totalled EUR 12.1 (7.3)
INTERIM STATEMENT JANUARY MARCH 2016
 INTERIM STATEMENT JANUARY MARCH 2016 11 May 2016 CONTENTS Summary 3 Business areas 5 P&C insurance 5 Associated company Nordea Bank AB 7 Life insurance 9 Holding 11 Other developments 12 Annual General
QT GROUP PLC HALF YEAR FINANCIAL REPORT 1 JANUARY JUNE QT GROUP PLC STOCK EXCHANGE RELEASE, 11 AUGUST 2016 at 8:00
 QT GROUP PLC HALF YEAR FINANCIAL REPORT 1 JANUARY 216 3 JUNE 216 QT GROUP PLC STOCK EXCHANGE RELEASE, 11 AUGUST 216 at 8: CONTINUED STRONG GROWTH Qt Group Plc was formed as a result of the partial demerger
Nordic Institutions Domestic Equity Trade 2003
 Facts about the Survey & Definitions Interviews Response Rate Method & Time & Stockbrokers Overall Performance Knowledge Portion of maximum points 34 Finnish institutions, minimum turnover of Finnish equities
AFFECTO PLC INTERIM REPORT 4 AUGUST 2009 at 9.30 MEUR 4-6/09 4-6/08 1-6/09 1-6/
 1 INTERIM REPORT 1-6/2009 AFFECTO PLC INTERIM REPORT 4 AUGUST 2009 at 9.30 AFFECTO PLC'S INTERIM REPORT 1-6/2009 GROUP KEY FIGURES MEUR 4-6/09 4-6/08 1-6/09 1-6/08 2008 Net sales 26.2 36.2 53.7 69.8 131.6
Interim Report For the period January September 2015 October 27, 2015
 Interim Report For the period January September October 27, January September Compared to January September 2014 Net operating profit improved by 60 per cent to EUR 23.6 M (14.8). Profit for the period
AFFECTO PLC INTERIM REPORT 5 MAY 2009 at 9.30
 1 INTERIM REPORT 1-3/2009 AFFECTO PLC INTERIM REPORT 5 MAY 2009 at 9.30 AFFECTO PLC'S INTERIM REPORT 1-3/2009 GROUP KEY FIGURES MEUR 1-3/09 1-3/08 2008 Net sales 27.5 33.6 131.6 Operational segment result
DIGITALIST GROUP PLC STOCK EXCHANGE RELEASE AT 9:00
 FINANCIAL STATEMENTS RELEASE OF DIGITALIST GROUP 31.12.2017 DIGITALIST 2017 - NEW BEGINNING SUMMARY October - December 2017 (2016 reference figures in brackets): Turnover EUR 6.6 million (EUR 4.5 million),
Pohjola Group. Interim Report Q4/2010 Financial Statements for 2010
 1 Pohjola Group Interim Report Q4/21 Financial Statements for 21 2 Pohjola Group Interim Report Q4/21 Financial Statements for 21 3 Contents Interim Report Q4/21 Financial Statements for 21 4 2 Dividend
977 2, % 8,196 8, % Net gearing 27.5% 34.5% 27.5% 34.5% Equity ratio 52.6% 47.8% 52.6% 47.8%
 Digia s fourth quarter 2012: Operating profit slightly better than expected, despite effects of Qt acquisition and one-off costs of finalised personnel negotiations Summary January-December Consolidated
Half-Year Report. Second quarter: Net sales increased exceptionally strongly 52.2 per cent April June 2018
 Qt Group Plc Stock Exchange Release 9 August 2018 at 8:00 a.m. Half-Year Report 1 January 2018 30 June 2018 Second quarter: Net sales increased exceptionally strongly 52.2 per cent April June 2018 Net
Björn Wahlroos Chairman of the Board
 Sampo plc Annual General Meeting 18 April 2013 Björn Wahlroos Chairman of the Board USA and Euro area industrial production 105 100 2007=100 USA 95 90 85 Euro area 80 2007 2008 2009 2010 2011 2012 2013
Interim Report January September 2013
 Interim Report January September 2013 Juhani Pitkäkoski President and CEO November 1, 2013 Contents Financial development Development by business Financial position Market outlook and guidance July September
CapMan alternative asset manager in the Nordic region and Russia
 CapMan alternative asset manager in the Nordic region and Russia Annual General Meeting 2010 Heikki Westerlund, CEO, CapMan Plc 30 March 2010 CapMan update Market environment Contents Financials 2009 2
Func Food Group Financial Release / Q2 2018
 Func Food Group Financial Release / Q2 2018 Func Food Group Financial Release / Q2 2018 Func Food Group / Q2 2018 3 FUNC FOOD GROUP IN BRIEF Func Food Group ( FFG ) is a Nordic wellness company, which
MUNKSJÖ OYJ Interim Report January-March Materials for innovative product design
 MUNKSJÖ OYJ Interim Report January-March 2014 Materials for innovative product design Page 1 of 25 Positive profitability development Highlights of the first quarter 2014 Net sales amounted to EUR 287.9
Interim Report January-June Sampo Bank Plc
 Interim Report January-June 2009 Sampo Bank Plc --------------------------------------------------------------------------------------------------- Sampo Bank Plc is a Finnish bank which is part of the
Interim Report for January June 2009
 1 (7) Interim Report for January June 2009 Market overview The global economic downturn has significantly decreased the demand for Itella s services. In Finland, the logistic and mail volumes saw a sharp
Future prospects The operating profit of the company is expected to improve compared to 2015.
 Interim report release for the period January 1 - March 31, 2016 TURNOVER DECREASED, ORDERS BOOKED INCREASED The review period in brief (previous year figures in brackets): - Orders booked EUR 5,6 million
Operating result totalled EUR 14.3 (12.1) million, equalling 11.0 (10.5) per cent of net sales.
 million, equalling 11.0 (10.5) per cent of net sales.") PONSSE PLC, STOCK EXCHANGE RELEASE, 25 APRIL 2017, 9:00 a.m. PONSSE S INTERIM REPORT FOR 1 JANUARY 31 MARCH 2017 Net sales amounted to EUR 129.9 (115.1) million. Operating result totalled EUR 14.3 (12.1)
PONSSE PLC, STOCK EXCHANGE RELEASE, 25 APRIL 2017, 9:00 a.m. PONSSE S INTERIM REPORT FOR 1 JANUARY 31 MARCH 2017 Net sales amounted to EUR 129.9 (115.1) million. Operating result totalled EUR 14.3 (12.1)
INTERIM REPORT Q3/2013 November 8, 2013 CEO Magnus Rosén CFO Jonas Söderkvist
 INTERIM REPORT Q3/2013 November 8, 2013 CEO Magnus Rosén CFO Jonas Söderkvist Agenda Highlights Q3 and 1-9/2013 Market outlook Segment review Financial review Company overview Appendix 2 Highlights Q3/2013
Kari Stadigh Group CEO and President
 Sampo plc Annual General Meeting 18 April 2013 Kari Stadigh Group CEO and President The Government is overregulating and we all are shying away from our responsibilities 6 of 10 respondents consider that
DIGIA PLC INTERIM REPORT 1 JANUARY - 31 MARCH 2016
 DIGIA PLC INTERIM REPORT 1 JANUARY - 31 MARCH 2016 NET SALES GROW BY MORE THAN 10 PER CENT IN BOTH BUSINESSES. OPERATING PROFIT IN THE DOMESTIC BUSINESS IMPROVED SIGNIFICANTLY AND QT REMAINED PROFITABLE
Interim Report For the period January March 2012 April 30, 2012, 9.00 am
 Interim Report For the period January March 2012 April 30, 2012, 9.00 am January March 2012 Net operating profit 4 Compared to January March 2011 Net operating profit amounted to EUR -1.1 M (2.1). Profit
Interim report 1 Jan -30 Sep Kari Inkinen CEO
 Interim report 1 Jan -30 Sep 2006 Kari Inkinen CEO 1 2 Market review Business conditions for 2006 Finnish GDP growth estimate is just under 5 %. Inflation estimate for 2006 is 1.6 %. Unemployment estimated
CapMan Plc. Interim Report. 1 January 30 September 2017
 CapMan Plc Interim Report 1 January 30 September 2017 CapMan Real Estate II reached its maximum size with EUR 425 million of equity commitments in its first and final closing in September 2017. HELSINKI
MeritaNordbanken. January - June 1999
 MeritaNordbanken January - June 1999 January-June 1999 Stable performance sustained Operating profit EUR 769 million (FIM 4.6 billion, SEK 6.9 billion), adjusted for items affecting comparability EUR 655
Financial Year February 2009 Kari Inkinen, President and CEO Robert Öhman, CFO
 Financial Year 2008 6 February 2009 Kari Inkinen, President and CEO Robert Öhman, CFO Year 2008 in a nutshell Financial position Property market Operational review Year 2009 Appendix 2 Year 2008 in a nutshell
Handelsbanken: Nordic Mid and Small Cap Seminar, 23 May Aktia Bank Plc
 Handelsbanken: Nordic Mid and Small Cap Seminar, 23 May 2018 Aktia Bank Plc Aktia Bank Plc a local Finnish bank in transformation Outi Henriksson Chief Financial Officer Finance, treasury and IR 1 Banking
OKO BANK PLC INTERIM REPORT 1 APRIL 30 JUNE 2007 WITH PRESIDENT AND CEO'S COMMENTS
 OKO BANK PLC Company Release 9 August 2007 at 8.00 am OKO BANK PLC INTERIM REPORT 1 APRIL 30 JUNE 2007 WITH PRESIDENT AND CEO'S COMMENTS President and CEO's comments: "In the second quarter, consolidated
ASIAKASTIETO GROUP PLC. Interim Report 1 January 30 June 2015
 ASIAKASTIETO GROUP PLC Interim Report 1 January 30 June 2015 Asiakastieto Group Plc Työpajankatu 10 A P.O.Box 16 FI-00581 Helsinki Tel. +358 10 270 7000 investors.asiakastieto.fi Asiakastieto Group s interim
Orkla ASA Announces a Recommended Public Cash Tender Offer for All Shares in Kotipizza Group
 Orkla ASA Announces a Recommended Public Cash Tender Offer for All Shares in Kotipizza Group Oyj Kotipizza Group Oyj / Orkla ASA Stock Exchange Release 22 November 2018 at 8:00 a.m. (CET+1) NOT FOR RELEASE,
Jaakko Pöyry Group Company Presentation For more information:
 Jaakko Pöyry Group Company Presentation 25 For more information: www.poyry.com Global consulting and engineering Core operations based on three know-how clusters: Forest Industry, Energy and Infrastructure
Func Food Group Financial Release / Q2 2017
 Func Food Group Financial Release / Q2 2017 Func Food Group Financial Release / Q2 2017 Func Food Group / Q2 2017 3 FUNC FOOD GROUP IN BRIEF Func Food Group ( FFG ) is a Nordic wellness company, which
Annual General Meeting 2 April, 2009
 Annual General Meeting 2 April, 2009 President and CEO Magnus Rosén 1 2.4.2009 AGM 2009 2009 Ramirent Forward-looking statements A number of forward-looking statements will be made during this presentation.
AKTIA BANK DEBT INVESTOR PRESENTATION 1-9/2017
 AKTIA BANK DEBT INVESTOR PRESENTATION 1-9/2017 EXECUTIVE SUMMARY AKTIA BANK PLC Retail bank with focus on growth areas in Finland Provides services mainly to private customers, small-sized companies and
LASSILA & TIKANOJA PLC: FINANCIAL STATEMENTS 1 JANUARY 31 DECEMBER 2016
 1.2.2017 1 LASSILA & TIKANOJA PLC: FINANCIAL STATEMENTS 1 JANUARY 31 DECEMBER 2016 - Net sales for the final quarter increased by 1.9% to EUR 168.3 million (EUR 165.2 million), operating profit was EUR
Interim Statement 9 MAY 2018
 Q1 Interim Statement JANUARY MARCH 2018 9 MAY 2018 Contents Summary 3 Business areas 5 If 5 Topdanmark 7 Associated company Nordea Bank AB 9 Mandatum Life 10 Holding 12 Other developments 13 Events after
Finnish banking in 2008
 in 28 Federation of Finnish Financial Services in 28 Index 1. Key developments on the banking scene in 28...2 2. Changes in bank structures...3 2.1 Changes in bank structures relatively small...3 2.2 Icelandic
Summary. January-June
 Second quarter 2011: Enterprise Solutions Developed positively, extraordinary Items related to Mobile Solutions' restructuring pushed group's bottom line into red Summary January-June - Consolidated net
Bank of Åland. Debt Investor Presentation October 2017
 Bank of Åland Debt Investor Presentation October 2017 Table of Contents 1. Bank of Åland in Brief 3 2. Bank of Åland Strategy and Market Position 3. Earnings and Capital 4. Asset Quality 5 14 24 5. Liquidity
NET SALES DECREASED, OPERATING PROFIT BACK IN BLACK IN THE SECOND QUARTER
 NET SALES DECREASED, OPERATING PROFIT BACK IN BLACK IN THE SECOND QUARTER April-June 2011: -Net sales decreased by 7% to EUR 67.4 million (EUR 72.2 million in April-June 2010). -Number of chargers delivered
Bank of Åland. Debt Investor Presentation August 2018
 Bank of Åland Debt Investor Presentation August 2018 Table of Contents 1. Bank of Åland in Brief 3 2. Bank of Åland Strategy and Market Position 3. Earnings and Capital 4. Asset Quality 5 14 31 5. Liquidity
INTERIM REPORT Q3 2012
 INTERIM REPORT Q3 1 January 30 September CATELLA AB (publ) Stockholm 23 November THIRD QUARTER OF, JUL SEPT Net sales totalled SEK 221 M (195) Profi t before tax excl items affecting comparability totalled
SOLTEQ PLC S INTERIM REPORT
 Page 1 of 20 Published: 2012-10-18 08:00:00 CEST Solteq Oyj Interim report SOLTEQ PLC S INTERIM REPORT 1.1.-30.9.2012 Solteq Oyj STOCK EXCHANGE BULLETIN 18.10.2012 at 9.00 am - On 22 March 2012, software
PONSSE PLC, STOCK EXCHANGE RELEASE, 23 OCTOBER 2018, 9:00 a.m.
 PONSSE PLC, STOCK EXCHANGE RELEASE, 23 OCTOBER 2018, 9:00 a.m. PONSSE S INTERIM REPORT FOR 1 JANUARY 30 SEPTEMBER 2018 Net sales amounted to EUR 415.9 (Q1-Q3/2017 398.3) million. Q3 net sales amounted
SAMPO HOUSING LOAN BANK PLC
 SAMPO HOUSING LOAN BANK PLC ANNUAL REPORT AND ACCOUNTS 2007 SAMPO HOUSING LOAN BANK PLC C O N T E N T S Board of Directors Report 1 Income statement 5 Balance sheet 6 Statement of changes in equity 7 Cash
Keefe, Bruyette & Woods. Financials Conference. Group CFO Peter Johansson 20 September 2011
 Keefe, Bruyette & Woods 211 UK Day and European Financials Conference Group CFO Peter Johansson 2 September 211 Structure Sampo plc Parent company for the Group Market Cap ~ EUR 11 bn* 21.3% Over 2% Nordea
Debt Investor Presentation. OP-Pohjola Group and issuing entities Pohjola Bank plc and OP Mortgage Bank
 Debt Investor Presentation OP-Pohjola Group and issuing entities Pohjola Bank plc and OP Mortgage Bank www.pohjola.com 2 OP-Pohjola Group Issuing entities are Pohjola Bank plc and OP Mortgage Bank Leading
Board of Directors Report and Financial Statements 2012
 Board of Directors Report and Financial Statements 2012 Contents board of directors report 3 IFRS financial statements 2012 Consolidated Comprehensive Income Statement 10 Consolidated Balance Sheet 11
Contents. Financial Statements. Annual Report Consolidated Income Statement. Consolidated Balance Sheet. Consolidated Cash Flow Statement
 Annual Report 2015 Contents Financial Statements Consolidated Income Statement Consolidated Balance Sheet Consolidated Cash Flow Statement Changes in Shareholders' Equity Basic Information on the Group
Asiakastieto Group s Interim Report : The strong growth continued in the third quarter
 Asiakastieto Group Plc Interim Report Asiakastieto Group s Interim Report 1 (24) ASIAKASTIETO GROUP PLC, STOCK EXCHANGE RELEASE 8 NOVEMBER AT 11.00 EET Asiakastieto Group s Interim Report : The strong