Bank of Åland. Debt Investor Presentation October 2017
|
|
|
- Christal Bennett
- 5 years ago
- Views:
Transcription

1 Bank of Åland Debt Investor Presentation October 2017
2 Table of Contents 1. Bank of Åland in Brief 3 2. Bank of Åland Strategy and Market Position 3. Earnings and Capital 4. Asset Quality Liquidity and Funding Contact Details Appendix

3 1. Bank of Åland in Brief
4 Bank of Åland in brief Bank of Åland Plc A Finnish bank targeting high net worth and affluent individuals Top ranked in customer loyalty Tradition of stability and very low credit losses BBB (stable) rating from S&P Covered bonds program EUR 2 bn combined covered bond/senior Medium Term Note program 2017 (Finnish law) Two cover pools: Cover Pool FIN and Cover Pool SWE Issuance under Finnish Covered Bond Legislation Legal LTV cap at 70% and minimum 2% over-collateralization Published commitment to a strong over-collateralization and six months liquidity in the program AAA (stable) rating from S&P on both Pool FIN and Pool SWE covered bonds 4
5 2. Bank of Åland Strategy and Market Position

6 Three Markets Two Strategies The Åland Islands Finland Sweden 3 offices + 2 rep offices, market share % Full product range offered A bank for everyone 5 offices in affluent parts of Finland, market share 1-2 % Full product range offered but bread and butter services only as complement to Private Banking and Premium Banking services offering Targeted segment: High Net Worth / Affluent Individuals and their companies 3 offices in Sweden's largest cities, market share < 1 % Full product range offered but bread and butter services only as complement to Private Banking and Premium Banking services offering Targeted segment: High Net Worth / Affluent Individuals and their companies 6 6
7 Bank of Åland a relationship bank with focus on Private Banking and Premium Banking customers Established in 1919 on Åland Islands Listed since 1942 on NASDAQ OMX Helsinki Total assets of EUR M, as of Sep 30, 2017 Actively managed assets of EUR M, as of Sep 30, 2017 Approximately 700 employees Operations in the Åland Islands, Finnish mainland and Sweden More than 100,000 customers and top-ranked in customer loyalty A long-standing tradition of stability and very low credit losses At the forefront for introducing new products in Finland 7
8 Bank of Åland History of Strategic Decisions From a local bank supporting development of Åland a poor fishing and agrarian community Listing Expansion to Finnish mainland Turn Bank of Åland s IT department into Crosskey Ab Ltd Expansion to Sweden To a Nordic banking group Foundation with wide product range and personal service targeting high net worth individuals 8 8

9 Bank of Åland vision We create value for ambitious individuals and companies that appreciate relations Private Banking since 1982 Premium banking since 2004 Service Finance 9 Lifestyle Safety 9

10 10 Bank of Åland group legal structure
11 Ownership structure Major owners Share of capital Share of votes Anders Wiklöf with companies 19,1 % 24,2 % Alandia-Bolagen 8,6 % 13,6 % The Family Kamprad Foundation 6,0 % 0,7 % Ålands Ömsesidiga försäkringsbolag 5,9 % 11,6 % Fennogens Investments S.A. (Family Ehrnrooth) 4,1 % 7,0 % 43,7 % 56,9 % Other owners Svenska Litteratursällskapet 1,4 % 3,0 % Föreningen Konstsamfundet 0,5 % 1,1 % Approximately 9,500 shareholders in total, mostly from the Åland Islands. 11
12 Standard & Poor's rating on Bank of Åland Finnish banks A- Business position -2 - Niche bank with geographical concentration to Finland and Sweden Capital and earnings +1 - Strong capital position - Strong equity to assets ratio Risk position -1 - Geographical concentration to Finland and Sweden - Small customer base with concentration risks Liquidity and funding 0 - Above average with very strong deposit base Bank of Åland stand alone rating BBB Cover Pool FIN, Cover Pool SWE +9 - Very low credit losses and stable loan base - Commitment to strong overcollateralization - Commitment to six month liquidity buffer Bank of Åland covered bonds rating AAA 12
13 Scorecard Capital S&P rating uplift for strong capital position Common Equity Tier 1 capital ratio 12.6 percent as of Sep 30, 2017 IRB method for credit risk capital requirement not yet approved for the Swedish credit portfolio Liquidity and Funding Core funding ratio of 91 percent as of Sep 30, 2017 Liquidity reserve at 17 percent of total assets as of Sep 30, 2017 LCR at 109 percent as of Sep 30, 2017 NSFR at 128 percent as of Sep 30, 2017 AAA rating on covered bonds Risk Management Long history of having the lowest loan loss level of all Finnish banks. Loan loss level was 0.06 percent Q No trading positions or complex financial instruments No exposure to GIIPS countries, Russia or Ukraine Strict limits on exposure to financial institutions. Bulk of the exposure is to highly rated Nordic entities Profitability Challenging interest rate environment Positive earnings trend, with Swedish business area now on positive figures for several years Net operating profit of EUR 7.2 M Q Return on equity 10.1 percent Q
14 3. Earnings & Capital
15 Long-term financial targets Return on equity after taxes (ROE) shall exceed 10 per cent. As a bank for investors, with financing knowhow, the Bank of Åland has a business model that shall generate most earnings from operations with limited capital requirements. The Bank of Åland s earnings will benefit from higher interest rates The Bank s capital adequacy, primarily defined as the core tier 1 capital ratio under the Basel regulations, shall clearly exceed all regulatory requirements. The payout ratio shall eventually amount to 50 per cent. This payout ratio target is subject to the condition that the capital adequacy target continues to be achieved. At present, the Bank of Åland is prioritising balanced growth. 15
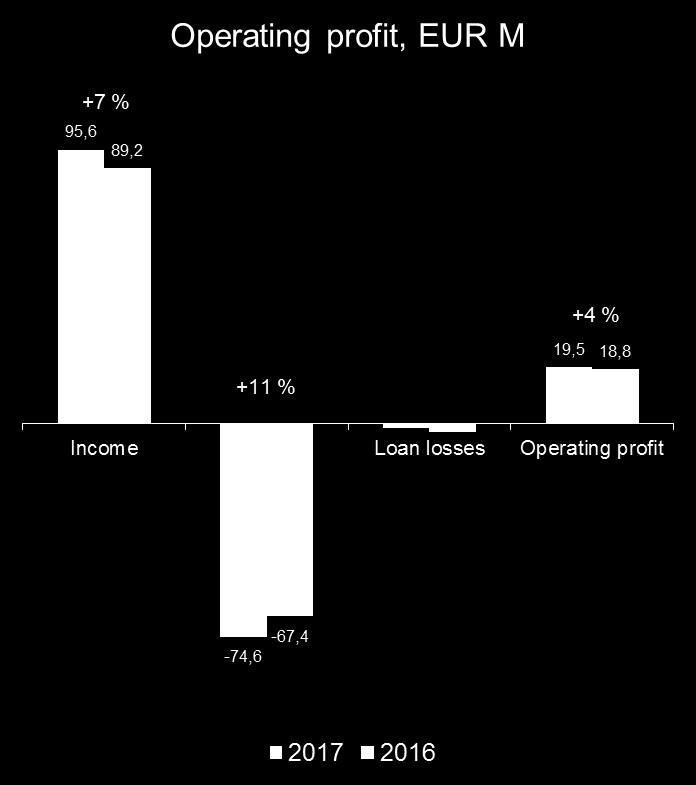
16 Jan-Sep 2017 in summary Net operating profit EUR 19.5 M (18.8 M Jan-Sep 2016) Return on Equity after tax (ROE) 9.2 percent (9.2 Jan-Sep 2016) Take over of EUR M pension assets in the swedish pension system (former Allra funds) Continued heavy interest in the Bank of Åland s housing-related mutual funds. Again a top ranking from Private Banking clients in TNS Sifo Prospera survey Implementation of IT systems in Sweden has resulted in higher costs under the period Green banking: Baltic sea card and Aland index widely recognized Digitalization and new service channels: Dreams with over clients 16

17 in summary


18 18 Bank of Åland business segments
19 Income statement EUR M Q Q % Q % % Net interest income 14,3 13,6 5 13,7 4 41,8 41,1 2 Net comission income 12,2 12,8-5 10, ,1 32,7 13 Net gains and losses on financial items 1,8-0,6 0,5 2,1 3,9-46 IT income 3,6 4,4-18 3,6 2 13,3 10,4 28 Other income 0,3 0,2 35 0,2 22 1,3 1,1 26 TOTAL INCOME 32,2 30,5 5 28, ,6 89,2 7 Staff expenses -14,1-14, ,3 6-45,0-42,2 7 Other expenses -8,3-8,4-2 -6, ,4-20,8 17 Depreciation -2,0-1,7 17-1,5 37-5,3-4,5 17 TOTAL EXPENSES -24,4-25, , ,6-67,4 11 PROFIT BEFORE LOAN LOSSES 7,8 5,5 42 7, ,1 21,8-3 Impairment losses on loans -0,6-0,5 11-0, ,5-3,0-49 OPERATING PROFIT 7,2 5,0 46 6, ,5 18,8 4 Income tax -1,5-1,0 40-1,2 19-4,0-4,0 0 Non-controlling interests 0,0 0,0 0,0 70 0,0 0,0-4 PROFIT ATTRIBUTABLE TO SHAREHOLDERS 5,8 3,9 47 5, ,5 14,8 5 19

20 20 Bank of Åland ROE, percent

21 Business volumes , EUR M * 21


22 Commitment to strong capital ratio Bank of Åland is committed to a strong capital ratio. The core tier 1 capital ratio for a small bank like Bank of Åland is not comparable to larger banks with IRB methods. Standard & Poor s rating method considers Bank of Åland well capitalized, giving a rating uplift of one notch at the current CT1 ratio level. Conservative pay-out policy is to safeguard the capital position 22

23 S&P view: quality of the capital S&P regards Bank of Åland s capital position as strong Capital position is better than that of the large Scandinavian peers S&P RAC ratio makes an attempt to measure capital adequacy with regard to the quality of capital Bank of Åland has all of the capital in CET1 equity and retained earnings 23
24 4. Asset Quality
25 Lending strategy Bank of Åland is a relationship bank with primary focus on customers with investment needs in the Private Banking and Premium Banking segments. Serving the core customers' credit needs are part of our commitment. Bank of Åland is not granting credits as a stand alone product to mass market clients or corporate clients. Every business area (Åland Islands, Finland and Sweden) should have a balanced growth in lending versus deposits. At least half of the lending in every business area should be residential mortgages or have residential property as collateral. Many small loans are preferred to few large loans. 25


26 Balanced growth in the credit portfolio Total lending to the public was EUR M Sep , an increase of 7 percent from a year ago Selective lending to high quality borrowers Asset quality prioritised over lending volume growth and higher returns Lending must always be made in consideration of safeguarding Bank of Åland s strong brand and market reputation Loan loss level 0.06 percent in Q


27 Geographical distribution of mortgage lending Clear concentration to the wealthiest parts of Finland and Sweden As of Sep 30, 2017 approximately 70 % of the loan portfolio in Finland 30 % of the loan portfolio in Sweden According to the business plan growth in the coming years will be mainly in Sweden Stockholm 67% Vaasa 3 % Tampere 13 % Gothenburg 11% Malmö 16% Åland Islands 19 % Turku 14 % Helsinki 47 % 27
28 5. Liquidity and Funding

29 Group funding profile Sep 30, 2017 Demand deposits, time deposits and certificates of deposits from core private customers and their companies are the main funding sources Strong capitalization Covered bonds are the main long term funding instrument Funding profile Sep 30, 2017 Development in the funding profile
30 Funding strategy Covered bond programme was created in early 2012 in order to diversify funding sources and to form a reliable and cost effective funding channel Since the launch of the programme both EUR- and SEK- denominated covered bonds have been issued totalling EUR M outstanding During Bank of Åland built a credit curve 2-10 years in covered bonds Bank of Åland has also issued in SEK senior unsecured to maintain a balanced funding mix Themes Demand conditions and the market situation favour issuance in covered bonds Issuance in Senior unsecured depends on market conditions and upcoming MRELguidelines 30
31 Long term funding Sep 30, 2017 Cover Pool FIN ISIN Nominal Amt Settlement date Maturity date Coupon Currency EUR eq amt Time to maturity XS QUARTLY STIB + 110,0 SEK ,70 XS ,5 EUR ,02 XS ,55 EUR ,67 XS ,375 EUR ,65 XS ,75 EUR ,34 XS EUR ,00 Cover Pool SWE ,39 ISIN Nominal Amt Settlement date Maturity date Coupon Currency EUR eq amt Time to maturity XS QUARTLY STIB + 55,0 SEK ,48 XS QUARTLY STIB + 50,0 SEK ,21 Senior unsecured ,79 ISIN Nominal Amt Settlement date Maturity date Coupon Currency EUR eq amt Time to maturity XS QUARTLY STIB + 90 SEK ,16 XS QUARTLY EUR + 63 EUR , ,39 31
32 Funding tools MTN-program (EUR 2 billion), Finnish jurisdiction Covered Bond, Senior debt and Subordinated debt Tailored to institutional clients CD-program in Sweden (SEK 10 billion), Swedish jurisdiction Other CD s in Finland GMRA GMSLA 32 32

33 Liquidity management Well-diversified maturity profile Limited exposure to short term funding Bank of Aland is committed to continuously cover the next 180 liquidity need for the program in the cover pools Maturing long funding 33 33
34 Liquidity position Very high quality in liquidity reserves The most liquid and tradable assets LCR target reached Conservative approach to market risk within liquidity reserves Assets with short duration Well diversified counterparty risk profile Coordinated cash pools between Finland and Sweden Composition of the liquidity reserve EUR M of total EUR M of total Cash and central banks 360,6 39 % 513,0 57 % Bonds issued by governments and official institutions 141,2 15 % 75,9 8 % Bonds issued by financial institutions 0,0 0 % 0,0 0 % Covered bonds 365,1 39 % 267,5 30 % Deposits 62,3 7 % 49,7 5 % 929,2 906,1 34
35 6. Contact Details
36 Contact Details Peter Wiklöf, CEO Jan-Gunnar Eurell, CFO Heli Huhtala, Head of Group Treasury
37 7. Appendix
38 Key figures Return on equity (ROE), % 9,1 12,0 8,7 3,8 6,6-3,9 Cost/income ratio, % Loan loss level, % 0,11 0,09 0,06 0,14 0,22 0,07 Share of non-performing loans, gross, % 0, ,65 0,50 0,64 0,70 Level of provisions for non-performing loans, % Core funding ratio, % Equity/assets ratio, % 4,3 4,6 4,6 4,7 4,9 5,3 Core Tier 1 capital ratio, % 11, ,9 10,8 10,9 8,4 Total capital ratio, % 13,0 12,9 12,1 15,2 15,7 12,8 Earnings per share, EUR 1,29 1,6 1,12 0,46 0,79-0,54 Equity per share, EUR 14,37 13,99 13,46 12,54 12,21 12,34 Lending to the public, EUR M Deposits from the public, EUR M Shareholders equity, EUR M Risk-weighted assets, EUR M FTE
39 Income statement EUR M Net interest income 55,1 54,0 49,3 42,4 41,2 43,1 36,8 Net comission income 44,9 46,5 46,2 42,4 32,7 38,7 36,8 Other income 20,4 24,4 25,1 23,2 36,5 17,4 25,5 Total income 120,4 124,9 120,6 108,0 110,4 99,2 99,1 Staff costs -57,0-56,0-53,1-51,5-52, ,7 Other expenses -34,2-35,6-43,3-42,0-41,7-43,1-38,5 Total expenses -91,3-91,6-96,4-93, ,1-92,2 Profit before loan losses 29,2 33,3 24,2 14,5 16,3-3,9 6,9 Impairment losses on loans -4,1-3,0-1,8-4,1-6,4-1,8-5,9 Operating profit 25,1 30,3 22,4 10,4 9,9-5,7 1,0 Income taxes -5,4-6,0-4,8-2,7 2,0 0,4-3,2 Profit for the period 19,7 24,3 17,6 7,7 11,9-5,3-2,2 Non-controlling interests 0 0-1,5-1,0-0,6-1,2-0,6 Attributable to the shareholders in Bank of Åland 19,7 24,3 16,1 6,7 11,3-6,5-2,9 39
40 Thank you!
41 Disclaimer The presentation was prepared by Bank of Åland Ltd for use in investor relations. This presentation is not intended for retail customers. This presentation has been prepared on the basis of publicly available information which Bank of Åland considers to be reliable. This presentation may contain forward-looking statements, which are subject to risks, uncertainties, and assumptions. This presentation is being presented solely for your information and is subject to change without notice. No representation or warranty, expressed or implied, is made and no reliance should be placed on the accuracy, actuality, fairness, or completeness of the information presented. This presentation does not constitute an offer or invitation to purchase or subscribe for any shares or debt instruments of the Company, and no part of this presentation shall form the basis of or be relied upon in connection with any contract or commitment. The contents of this presentation may not be reproduced, redistributed or passed on, directly or indirectly, to any other person or published, in whole or in part, for any purpose. 41
Bank of Åland. Debt Investor Presentation August 2018
 Bank of Åland Debt Investor Presentation August 2018 Table of Contents 1. Bank of Åland in Brief 3 2. Bank of Åland Strategy and Market Position 3. Earnings and Capital 4. Asset Quality 5 14 31 5. Liquidity
Bank of Åland. Debt Investor Presentation September 2014
 Bank of Åland Debt Investor Presentation September 2014 Table of Contents 1. Bank of Åland in Brief 3 2. Bank of Åland Strategy and Market Position 3. Earnings and Capital 4. Asset Quality and Cover Pool
Hypo Investor Update Debt Investor Presentation
 Hypo Investor Update 2017 Debt Investor Presentation Published on February 1, 2018 Secure Way for Better Living Hypo Group Overview Founded in 1860 The oldest private credit institution in Finland Retail
Hypo Investor Update 3Q2018. Debt Investor Presentation
 Hypo Investor Update 3Q2018 Debt Investor Presentation Published on October 31, 2018 Secure Way for Better Living Hypo Group Overview Founded in 1860 The oldest private credit institution in Finland Retail
Year-end Report For the period January December 2015 February 12, 2016
 Year-end Report For the period January December February 12, 2016 January December Compared to January December 2014 Net operating profit improved by 35 per cent to EUR 30.3 M (22.4). Profit for the period
Hypo Investor Update 2Q2018. Debt Investor Presentation
 Hypo Investor Update 2Q2018 Debt Investor Presentation Published on August 10, 2018 Secure Way for Better Living Hypo Group Overview Founded in 1860 The oldest private credit institution in Finland Retail
Hypo Investor Update Debt Investor Presentation
 Hypo Investor Update 2019 Debt Investor Presentation Hypo Covered Bond Roadshow February March, 2019 Secure Way for Better Living Hypo Group Overview Founded in 1860 The oldest private credit institution
Common equity Tier 1 ratio
 January December Compared to January-December Net operating profit increased by 4 per cent to EUR 26.0 M (25.1). Profit for the period attributable to shareholders increased by 5 per cent to EUR 20.7 M
Hypo Credit Update 1-4Q2015. Investor Presentation, February 2016
 Hypo Credit Update 1-4Q2015 Investor Presentation, February 2016 Secure Way for Better Living Hypo Group Overview Founded in 1860 The oldest private credit institution in Finland Retail banking, no corporate
Hypo Credit Update 2Q2015. Investor Presentation, August 2015
 Hypo Credit Update 2Q2015 Investor Presentation, August 2015 Secure Way for Better Living Hypo Group Overview Founded in 1860 The oldest private credit institution in Finland Retail banking, no corporate
Interim Report For the period January September 2015 October 27, 2015
 Interim Report For the period January September October 27, January September Compared to January September 2014 Net operating profit improved by 60 per cent to EUR 23.6 M (14.8). Profit for the period
Interim Report For the period January September 2014 October 28, 2014
 Interim Report For the period January September 2014 October 28, 2014 January September 2014 Compared to January September 2013 Net operating profit improved by EUR 8.0 M to EUR 14.8 M (6.8). Profit for
AKTIA BANK DEBT INVESTOR PRESENTATION 1-9/2017
 AKTIA BANK DEBT INVESTOR PRESENTATION 1-9/2017 EXECUTIVE SUMMARY AKTIA BANK PLC Retail bank with focus on growth areas in Finland Provides services mainly to private customers, small-sized companies and
Interim Report For the period January June 2015 July 24, 2015
 Interim Report For the period January June July 24, January June Compared to January June 2014 Net operating profit improved by EUR 9.4 M to EUR 17.3 M (7.9). Profit for the period attributable to shareholders
Morgan Stanley European Financials Conference, London 27 March Jan Erik Back CFO SEB
 Morgan Stanley European Financials Conference, London 27 March 212 Jan Erik Back CFO SEB In the new world, what are SEB s priorities? Relationship banking as the key franchise driver Response to the new
January - September 2016 Compared to January September The third quarter of Compared to the third quarter of 2015
 January - September Compared to January September Net operating profit decreased by 21 per cent to EUR 18.8 M (23.6). Profit for the period attributable to shareholders decreased by 22 per cent to EUR
New Standards update on initiatives
 New Standards update on initiatives Elisabeth Toftmann Klintholm Chief IR Officer Nordea Large Cap Seminar Stockholm, 28 May 2013 Vision Recognised as the most trusted financial partner Customer satisfaction
Swedbank year-end results 2018
 Swedbank year-end results 218 Birgitte Bonnesen (CEO), Anders Karlsson (CFO), Helo Meigas (CRO) Strong financial result in 218 delivered on strategic priorities SELECTED 218 DELIVERIES Continued digitisation
Fact Book January June 2011
 Fact Book January June STOCKHOLM 14 JULY SEB Fact Book January June N Table of contents Table of contents...2 About SEB...3 SEB history...3 Financial targets...3 Organisation...4 Corporate Governance...5
Nykredit Group. Q1/2016 financial results call. CFO, Group Managing Director Søren Holm. 12 May 2016
 Nykredit Group Q1/2016 financial results call CFO, Group Managing Director Søren Holm 12 May 2016 Highlights from Q1 2016 Nykredit announced plans for an IPO, intention to sell domicile and increased margins
Keefe, Bruyette & Woods 2012 European Financials Conference 19 September Niklas Ekvall Head of Group Treasury
 Keefe, Bruyette & Woods 2012 European Financials Conference 19 September 2012 Niklas Ekvall Head of Group Treasury Disclaimer This presentation contains forward-looking statements that reflect management
Swedbank s second quarter 2018 results
 Swedbank s second quarter 218 results Anders Karlsson (CFO), Helo Meigas (CRO) Group financial highlights TOTAL INCOME SEK 11.8bn 12 8 4 Total income, SEKbn Strong loan volume growth Higher commission
Interim Report For the period January September 2011 October 31, 2011, 9.00 am
 Interim Report For the period January September 2011 October 31, 2011, 9.00 am January September 2011 Compared to January September 2010 Net operating profit, excluding restructuring expenses and adjusted
Fact Book. January September 2018 STOCKHOLM 25 OCTOBER 2018
 Fact Book January September STOCKHOLM 25 OCTOBER SEB Fact Book January September Table of contents Table of contents... 2 About SEB... 4 SEB history... 4 Organisation... 5 Share of operating profit...
Bank of America Merrill Lynch 28 September, Jan Erik Back CFO
 Bank of America Merrill Lynch 28 September, 2016 Jan Erik Back CFO 1 Well diversified business in a strong economic environment Operates principally in economically robust AAA rated European countries
Swedbank s third quarter 2018 results
 Swedbank s third quarter 2018 results Birgitte Bonnesen (CEO), Anders Karlsson (CFO), Helo Meigas (CRO) Swedbank in the Baltics Swedbank s customers in the Baltics Market leader with a strong focus on
Swedbank year-end report 2017
 Swedbank year-end report 217 Birgitte Bonnesen (CEO), Anders Karlsson (CFO), Helo Meigas (CRO) Swedish Banking Solid mortgage volume growth SEKm Q4 17 Q3 17 QoQ Net interest income 3 861 3 812 49 Net commission
Fact Book January June 2017 STOCKHOLM 14 JULY 2017
 Fact Book January June 217 STOCKHOLM 14 JULY 217 SEB Fact Book January June 217 Table of contents Table of contents... 2 About SEB... 4 SEB history... 4 Financial targets... 4 Rating... 4 Organisation...
Fact Book January June 2013
 Fact Book January June STOCKHOLM 15 JULY SEB Fact Book January June 1 Table of contents About SEB... 4 Financial targets... 4 Rating... 4 Organisation...5 Full-time equivalents, end of quarter... 5 Corporate
Fact Book January September 2013
 Fact Book January September STOCKHOLM 24 OCTOBER SEB Fact Book January-September 1 Table of contents About SEB... 4 Financial targets... 4 Rating... 4 Organisation...5 Full-time equivalents, end of quarter...
Handelsbanken. January March April 2018
 Handelsbanken January March 2018 25 April 2018 1 Q307 Q407 08 Q208 Q308 Q408 09 Q209 Q309 Q409 10 Q210 Q310 Q410 11 Q211 Q311 Q411 12 Q212 Q312 Q412 13 Q213 Q313 Q413 14 Q214 Q314 Q414 15 Q215 Q315 Q415
INTERIM REPORT For the period January March 2007
 INTERIM REPORT For the period January March 2007 The report period in brief Consolidated net operating profit rose by 28 per cent to 8.1 million euros (Jan Mar 2006: EUR 6.4 M) The profit increase was
Interim report Q3 2017
 Q3 Solid portfolio acquisitions and strong earnings trend July September Total revenue was unchanged at SEK 666m (665). Profit before tax increased 40 per cent to SEK 182m (130). Diluted earnings per share
Fact Book. Annual Accounts 2017 STOCKHOLM 31 JANUARY 2018
 Fact Book Annual Accounts STOCKHOLM 31 JANUARY 218 SEB Fact Book Annual Accounts Table of contents Table of contents... 2 About SEB... 4 SEB history... 4 Financial targets... 4 Rating... 4 Organisation...
Interim Report For the period January March 2015 April 28, 2015
 Interim Report For the period January March 2015 April 28, 2015 January March 2015 Compared to January March Net operating profit improved by EUR 7.1 M to EUR 9.4 M (2.3). Profit for the period attributable
Interim Report For the period January March 2012 April 30, 2012, 9.00 am
 Interim Report For the period January March 2012 April 30, 2012, 9.00 am January March 2012 Net operating profit 4 Compared to January March 2011 Net operating profit amounted to EUR -1.1 M (2.1). Profit
Fact Book January June 2014
 Fact Book January June STOCKHOLM 14 JULY SEB Fact Book January June 1 Table of contents About SEB... 4 Financial targets... 4 Rating... 4 Organisation...5 Full-time equivalents, end of quarter... 5 Corporate
Nordea Mortgage Bank Covered Bonds. Q Debt investor presentation
 Nordea Mortgage Bank Covered Bonds Q3 2018 Debt investor presentation Table of contents 1. In brief 2. Cover pool key characteristics 3. Asset quality 4. Covered bond framework 5. Macro 6. Further information
Common equity Tier 1 ratio
 January September Compared to January September Net operating profit increased by 12 per cent to EUR 21.9 M (19.5). Profit for the period attributable to shareholders increased by 11 per cent to EUR 17.2
Swedbank Year-end report 2014
 Swedbank Year-end report 214 Michael Wolf, CEO Göran Bronner, CFO Anders Karlsson, CRO Swedbank Swedish Banking Strong customer activity SEKm Q4 14 Q3 14 QoQ YoY Net interest income 3 31 3 372-71 -271
ABGSC Swedish Banks Treasury lunches
 ABGSC Swedish Banks Treasury lunches Nov 11, 211 Anders Kvist Head of Group Treasury Balance Sheet, Liquidity & Funding A strong balance sheet structure Sep 21 Balance sheet structure Liquid assets Cash
BoA Merrill Lynch Banking & Insurance CEO Conference London, 25 September 2012
 BoA Merrill Lynch Banking & Insurance CEO Conference London, 25 September 2012 Annika Falkengren President & CEO The message from last year s conference Stability Sustainable growth Continuous improvement
Swedbank s year-end 2013 results
 Swedbank s year-end 2013 results Michael Wolf, CEO Göran Bronner, CFO Anders Karlsson, CRO Swedbank Swedish Banking Stable results SEKm Q4 13 Q3 13 Q/Q Net interest income 3 448 3 473-25 Net commissions
INTERIM REPORT 5 NOVEMBER 2015
 Q3 INTERIM REPORT JANUARY SEPTEMBER 2015 5 NOVEMBER 2015 Contents 3 Summary 5 Third quarter 2015 in brief 6 Change in reporting practices as of 1 January 2016 7 Business areas 7 P&C insurance 10 Associated
Swedbank s third quarter 2013 results
 Swedbank s third quarter 213 results Michael Wolf, CEO Göran Bronner, CFO Anders Karlsson, CRO Swedbank Retail Stable results SEKm Q3 12 Q2 13 Q3 13 Q/Q Y/Y Net interest income 3 45 3 367 3 473 16 68 Net
Year-end report For the period January December 2012 February 15, 2013, 2.00 pm
 Year-end report For the period January December 2012 February 15, 2013, 2.00 pm The fourth quarter of 2012 Compared to the third quarter of 2012 Net operating profit amounted to EUR 14.5 M (-0.5). Of this,
Gjensidige Bank Investor Presentation Q July 2017
 Gjensidige Bank Investor Presentation Q2 2017 14. July 2017 Disclaimer This presentation and the information contained herein have been prepared by and is the sole responsibility of Gjensidige Bank ASA
Goldman Sachs Financials Conference. Sustaining profitability despite challenging funding conditions. Frans Lindelöw
 Goldman Sachs Financials Conference Sustaining profitability despite challenging funding conditions Frans Lindelöw Group Executive Management Berlin, 13 June 2008 Disclaimer This presentation contains
Year-end report For the period January December 2011 February 16, 2012
 Year-end report For the period January December 2011 February 16, 2012 January December 2011 Compared to January December 2010 Net operating profit, excluding restructuring expenses of 5.7 million euros
Handelsbanken January - September October 2013
 Handelsbanken January - September 23 October Q307 Q407 Q108 Q208 Q308 Q408 Q109 Q209 Q309 Q409 Q110 Q210 Q310 Q410 Q111 Q211 Q311 Q411 Q112 Q212 Q312 Q412 Q113 Q213 Q313 Average annual growth in equity
Debt Investor Presentation
 Debt Investor Presentation OP-Pohjola Group and issuing entities Pohjola Bank plc and OP Mortgage Bank www.pohjola.com > Investor Relations > Debt Investors 2 Contents OP-Pohjola Group in Brief 3 Finnish
Debt Investor Presentation
 Debt Investor Presentation OP-Pohjola Group and issuing entities Pohjola Bank plc and OP Mortgage Bank www.pohjola.com > Investor Relations > Debt Investors 2 Contents OP-Pohjola Group in Brief 3 Finnish
H Results Lilja B. Einarsdóttir Hreiðar Bjarnason
 Lilja B. Einarsdóttir CEO Hreiðar Bjarnason CFO DISCLAIMER This presentation is for information purposes only and shall not be construed as an offer or solicitation for the subscription or purchase or
Swedbank s year-end 2011 results. Michael Wolf, CEO Göran Bronner, CFO Håkan Berg, CRO
 Swedbank s year-end 2011 results Michael Wolf, CEO Göran Bronner, CFO Håkan Berg, CRO Delivered according to last years prospects Net profit of SEK 11.7bn for 2011 Core Tier 1 capital ratio of 15.7 per
Gjensidige Bank Boligkreditt AS
 Gjensidige Bank Boligkreditt AS Investor Presentation Q2 2017 14. July 2017 Disclaimer This presentation and the information contained herein have been prepared by and is the sole responsibility of Gjensidige
Fact Book January March 2014
 Fact Book January March 214 STOCKHOLM 25 APRIL 214 SEB Fact Book January March 214 1 Table of contents About SEB... 4 Financial targets... 4 Rating... 4 Organisation...5 Full-time equivalents, end of quarter...
Handelsbanken. January December February 2018
 Handelsbanken January December 7 February 2018 Average annual growth in equity Including dividends* SEK/share 175 Adjusted equity per share Accumulated dividends since 2008 150 125 100 75 50 25 0 Q307
Annika Falkengren. President & CEO. Results 2009
 Annika Falkengren President & CEO Results 29 1 Highlights Q1 29 Strong underlying business SEK 4.8bn before provisions for credit losses and impairment charges Stable cost development Doubled collective
Swedbank s second quarter 2013 results. Michael Wolf, CEO Göran Bronner, CFO Håkan Berg, CRO
 Swedbank s second quarter 213 results Michael Wolf, CEO Göran Bronner, CFO Håkan Berg, CRO Retail Stable results continue SEKm Q2 12 Q1 13 Q2 13 Q/Q Y/Y Net interest income 3 362 3 332 3 367 35 5 Net commissions
Telephone Conference Q2-18 Johan Torgeby President & CEO 17 July, 2018
 Telephone Conference Q2-18 Johan Torgeby President & CEO 17 July, 2018 Highlights Jan-Jun 2018 Pick-up in customer activity following a muted start of the year Broad based demand for SEB s services Strong
POP Bank Group Investor Presentation. April 2018
 POP Bank Group Investor Presentation April 2018 Executive Summary Group Alliance POP Bank Group is a Finnish financial group that offers retail banking services to private customers, small companies and
Nordea Mortgage Bank Covered Bonds Investor presentation Q3 2017
 Nordea Mortgage Bank Covered Bonds Investor presentation Nordea Mortgage Bank Plc overview 100% owned subsidiary of Nordea Bank AB - the largest Nordic financial institution Operates as a mortgage credit
Periodic data Q3 JAN-SEP 2017
 Periodic data Q3 JAN-SEP Periodic data Collector Bank AB, 556597-0513, is a bank and a wholly owned subsidiary of Collector AB, 556560-0797. The business consists of financial services and is divided into
The Mortgage Society of Finland
 Covered Bond Transparency Information The Mortgage Society of Finland Information as at June 30, 2018 Published on August 10, 2018 About the Issuer Hypo Group Overview Founded in 1860 The oldest private
Financial Statement Release
 2017 Financial Statement Release 7 FE B RUARY 201 8 Contents Summary 3 Fourth quarter in brief 5 Business areas 6 If 6 Topdanmark 9 Associated company Nordea Bank AB 10 Mandatum Life 12 Holding 14 Other
Swedbank Christer Trägårdh
 Swedbank 2017-11-28 Christer Trägårdh Background Strong financial position Sweden s largest retail bank with a leading position in our three Baltic home markets ROE target of at least 15% Strong asset
AKTIA BANK Plc Debt Investor presentation
 AKTIA BANK Plc Debt Investor presentation 30.6.2015 Executive Summary Aktia Bank Plc Retail bank with focus on growth areas in Finland Provides services mainly to private customers, small-sized companies
Investor presentation. Result
 Investor presentation Result 2010 Highlights Income Stable earnings from a diversified platform Provisions for credit losses Net credit losses back to pre-crisis levels Strategic alignment Strategic alignment
Highlights of Annual Report January December
 Highlights of Annual Report January December Highlights of Stadshypotek s Annual Report January December SUMMARY OF JANUARY DECEMBER COMPARED WITH JANUARY DECEMBER Income totalled SEK 8,195 million (6,251).
Contents Nordea overview Group Corporate Centre Group Functions Key financial figures Risk, liquidity and capital management Business areas
 Contents Nordea overview Group Corporate Centre - Nordea in brief 3 - Group Corporate Centre Financial highlights 34 - Board of Directors & GEM 4 - Rating 6 Group Functions - Nordea s largest shareholders
Debt Investor Presentation Q2/2012 & H1/2012
 Debt Investor Presentation Q2/2012 & H1/2012 OP-Pohjola Group and issuing entities Pohjola Bank plc and OP Mortgage Bank www.pohjola.com > Investor Relations > Debt Investors Contents OP-Pohjola Group
Nomura Financial Services Conference London, 29 August Jan Erik Back, CFO
 Nomura Financial Services Conference London, 29 August 2012 Jan Erik Back, CFO SEB s strategy remains firm Universal bank in Sweden and the Baltics Corporate bank in the Nordics, Germany and internationally
Handelsbanken. January June July 2017
 Handelsbanken January June 18 July Average annual growth in equity Including dividends* kr / aktie SEK/share 150 Adjusted equity per share Accumulated dividends since 2008 125 100 75 50 25 0 Q307 Q407
Swedbank New York and Boston roadshow, September 24 26, Mikael Inglander, Chief Financial Officer
 Swedbank New York and Boston roadshow, September 24 26, 27 Mikael Inglander, Chief Financial Officer The leading bank in four small countries Sweden Total population: 9.m Private customers: 4.1m Corp.
Contents Nordea overview Group Corporate Centre Group Functions Key financial figures Risk, liquidity and capital management Business areas
 Contents Nordea overview Group Corporate Centre - Nordea in brief 3 - Group Corporate Centre Financial highlights 34 - Board of Directors & GEM 4 - Rating 6 Group Functions - Nordea s largest shareholders
Carnegie Nordic Large Cap Seminar Stockholm 4 March 2008 Mikael Inglander, CFO
 Carnegie Nordic Large Cap Seminar Stockholm 4 March 28 Mikael Inglander, CFO The leading bank in four small countries Sweden Total population: 9.2m Employees: 8,75 Private customers: 4.1m Corp. customers:
Debt Investor Presentation. OP-Pohjola Group and Issuing entities Pohjola Bank plc and OP Mortgage Bank
 1 Debt Investor Presentation OP-Pohjola Group and Issuing entities Pohjola Bank plc and OP Mortgage Bank www.pohjola.com 2 OP-Pohjola Group Issuing entities are Pohjola Bank plc and OP Mortgage Bank Leading
Contents Nordea overview Group Functions Risk, liquidity and capital management Key financial figures General information & Macro
 Contents Nordea overview Group Functions - Nordea in brief 3 - Group Functions, Other Eliminations 36 - Board of Directors & GEM 4 - Rating 6 Risk, liquidity and capital management - Nordea s largest shareholders
Financial Results 2018 Johan Torgeby, President & CEO. Telephone conference 30 January 2019
 Financial Results 2018 Johan Torgeby, President & CEO Telephone conference 30 January 2019 jan-17 apr-17 jul-17 okt-17 jan-18 apr-18 jul-18 okt-18 jan-17 apr-17 jul-17 okt-17 jan-18 apr-18 jul-18 okt-18
Investor presentation. Results 2009
 Investor presentation Results 2009 1 Highlights 2009 Strong underlying business SEK 4.8bn before provisions for credit losses and impairment charges Stable cost development Doubled collective provisions
Jyske Bank SEB Nordic Seminar January 2018
 Jyske Bank SEB Nordic Seminar 2018 10 January 2018 Jyske Bank in brief One of the four large financial institutions in Denmark and a Danish SIFI 3 segments (Banking, Mortgage and Leasing) Estimated market
Swedbank Mortgage AB (publ);
;") SUPPLEMENT DATED AUGUST 23, 2011 TO THE PROSPECTUS DATED MARCH 11, 2011 Swedbank Mortgage AB (publ) (Incorporated with limited liability in the Kingdom of Sweden) U.S.$15,000,000,000 Programme for the
SUPPLEMENT DATED AUGUST 23, 2011 TO THE PROSPECTUS DATED MARCH 11, 2011 Swedbank Mortgage AB (publ) (Incorporated with limited liability in the Kingdom of Sweden) U.S.$15,000,000,000 Programme for the
Handelsbanken. January March April 2014
 Handelsbanken January March 2014 30 April 2014 Q307 Q407 08 Q208 Q308 Q408 09 Q209 Q309 Q409 10 Q210 Q310 Q410 11 Q211 Q311 Q411 12 Q212 Q312 Q412 13 Q213 Q313 Q413 14 Average annual growth in equity Including
Íslandsbanki Factbook
 1Q18 Íslandsbanki Factbook @islandsbanki 440 4000 Supplementary information for market participants (Unaudited) íslandsbanki.is Contents Page Investor relations information 3 Overview Highlights 4 Key
Highlights of annual report
 20 08 Highlights of annual report Lending increased by SEK 91bn (44) to SEK 615bn, of which SEK 44bn was attributable to the branch in Norway which was added during the third quarter. Operating profits
Building for the future
 Building for the future Sanford C. Bernstein Pan-European Strategic Decisions Conference 18 September 2014 Christian Clausen, President and Group CEO Disclaimer This presentation contains forward-looking
Highlights of annual report January December
 20 10 Highlights of annual report January December Highlights of Stadshypotek s annual report January December SUMMARY Income for the January December period was SEK 5,612 million (5,942). Income for the
Year-end report For the period January December 2013 February 14, 2014
 Year-end report For the period January December 2013 February 14, 2014 January December 2013 Compared to January December2012 Net operating profit improved by 5 per cent to EUR 10.4 M (9.9). Excluding
Contents Nordea overview Group Corporate Centre Group Functions Key financial figures Risk, liquidity and capital management Business areas
 Contents Nordea overview Group Corporate Centre - Nordea in brief 3 - Group Corporate Centre Financial highlights 34 - Board of Directors & GEM 4 - Rating 6 Group Functions - Nordea s largest shareholders
Interim report Q October 2008 Jan Lidén President and CEO
 Interim report Q3 2008 23 October 2008 Jan Lidén President and CEO Content Highlights in Q3 results The macro-economic environment Comments on issues in focus Funding and liquidity Credit quality Business
All pictures Q1. images Q2. Images Q Debt Investor Presentation Q3 2015
 Images Q3 2015 Debt Investor Presentation All pictures Q1 All Q3 2015 images Q2 2015 2015 Disclaimer This presentation contains forward-looking statements that reflect management s current views with respect
Annual Accounts Annika Falkengren President & CEO
 Annual Accounts 2014 Annika Falkengren President & CEO Unique economic environment Key Interest rates % 2.00 1.80 1.60 1.40 1.20 1.00 0.80 0.60 0.40 0.20 0.00 Jan-14 Sweden Norway Eurozone Feb-14 Mar-14
KBW 2011 UK and European Financials Conference. Göran Bronner, CFO
 KBW 211 UK and European Financials Conference Göran Bronner, CFO This is Swedbank Market leading retail franchise in its home markets Largest retail bank and fund manager in Sweden 6 % Market shares, May
Contents. Sampo Group Interim Report January September Contents. Summary 3
 Contents Contents Summary 3 THIRD quarter 2013 in brief 4 Business areas 5 P&C insurance 5 Associated company Nordea Bank Ab 8 Life insurance 10 Holding 12 Other developments 13 Personnel 13 Remuneration
INTERIM REPORT January-September 2016
 INTERIM REPORT January-September 2016 THE PERIOD IN BRIEF THE PERIOD JANUARY-SEPTEMBER 2016 COMPARED WITH JANUARY-SEPTEMBER 2015 Total operating income increased by 11.8 % to SEK 322.9 million The loan
Swedbank s third quarter 2017 results
 Swedbank s third quarter 217 results Birgitte Bonnesen (CEO), Anders Karlsson (CFO), Helo Meigas (CRO) Swedish Banking Good loan volume growth SEKm Q3 17 Q2 17 QoQ Net interest income 3 811 3 792 19 Net
INTERIM REPORT FOR THE PERIOD JANUARY SEPTEMBER 2014 SALES AND EARNINGS DECREASED SOMEWHAT IN SPITE OF HIGHER PASSENGER AND CARGO VOLUMES
 Press release INTERIM REPORT FOR THE PERIOD JANUARY SEPTEMBER 2014 SALES AND EARNINGS DECREASED SOMEWHAT IN SPITE OF HIGHER PASSENGER AND CARGO VOLUMES The number of passengers on Viking Line s vessels
Debt Investor Presentation. OP-Pohjola Group and issuing entities Pohjola Bank plc and OP Mortgage Bank
 Debt Investor Presentation OP-Pohjola Group and issuing entities Pohjola Bank plc and OP Mortgage Bank www.pohjola.com 2 OP-Pohjola Group Issuing entities are Pohjola Bank plc and OP Mortgage Bank Leading
Handelsbanken. January September October 2018
 Handelsbanken January September 2018 24 October 2018 1 Q307 Q407 Q108 Q208 Q308 Q408 Q109 Q209 Q309 Q409 Q110 Q210 Q310 Q410 Q111 Q211 Q311 Q411 Q112 Q212 Q312 Q412 Q113 Q213 Q313 Q413 Q114 Q214 Q314 Q414
Danske Nordic Bank Seminar
 Jan Erik Back CFO Danske Nordic Bank Seminar Copenhagen 2 September 2009 1 SEB s competitive position A long-term relationship bank Strong income and balance sheet Q2-recap, liquidity and capital Asset