30, 2018 N A S D A Q : G F N
|
|
|
- Beverly King
- 5 years ago
- Views:
Transcription


1 N A S D A Q : G F N Investor Presentation Through Fiscal Year Ended June 30, 2018
2 2 Safe Harbor Statement Statements in this presentation that are not historical facts are forward-looking statements within the meaning of Section 27A of the Securities Act of 1933, as amended, and Section 21E of the Securities Exchange Act of 1934, as amended. Such forward-looking statements involve risks and uncertainties that could cause actual outcomes and results to differ materially from those described in forward-looking statements. We believe that the expectations represented by our forward looking statements are reasonable, yet there can be no assurance that such expectations will prove to be correct. Furthermore, unless otherwise stated, the forward looking statements contained herein are made as of the date of the presentation, and we do not undertake any obligation to update publicly or to revise any of the included forward-looking statements, whether as a result of new information, future events or otherwise unless required by applicable law. The forward-looking statements contained herein are expressly qualified by this cautionary statement. Readers are cautioned that these forward-looking statements involve certain risks and uncertainties, including those described in our filings with the Securities and Exchange Commission (the SEC ). This presentation references financial measures that are not in accordance with U.S. generally accepted accounting principles ("GAAP"), that our management uses in order to assist analysts and investors in evaluating our financial results. These financial measures not in accordance with GAAP ("Non-GAAP Financial Measures") are defined in the Appendix. In each case, the most directly comparable GAAP financial measure, if available, is presented, and a reconciliation of the Non-GAAP Financial Measure and GAAP financial measure is provided.
 Broad and expanding geographic presence with 95 branch")


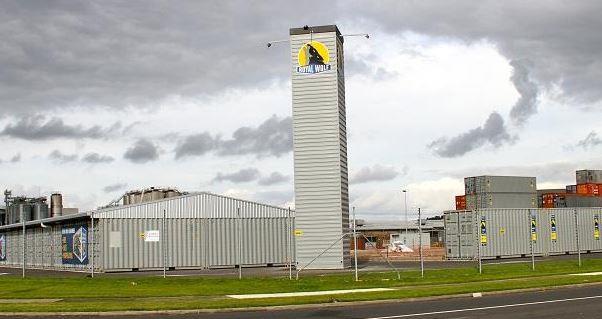
3 3 General Finance at a Glance Leading provider of specialty rental solutions in the portable (or mobile) storage, liquid containment and modular space industries (portable services) Broad and expanding geographic presence with 95 branch locations across North America and Asia-Pacific with approximately 85,800 fleet units Pac-Van and Lone Star Tank Rental in North America Royal Wolf in the Asia-Pacific region Southern Frac, a domestic manufacturer of portable liquid storage tanks and other steel-related products FY 2018 consolidated revenues of $347.3 million; consolidated adjusted EBITDA of $87.7 million* *Adjusted EBITDA is a Non-GAAP financial measure. Please see reconciliation of adjusted EBITDA in the Appendix.


: 7,501")
:")
: 12,014 Fleet Units")
4 4 Our Specialty Rental Services Fleet Categories Portable Storage Fleet Units Liquid Containment Fleet Units Storage Containers Freight Containers Liquid Containment Tanks Fleet Units (6/30/18): 56,524 Office Containers Fleet Units (6/30/18): 7,501 Modular Space Fleet Units Mobile Offices Fleet Units (6/30/18): 4,147 Modular Buildings Fleet Units (6/30/18): 12,014 Fleet Units (6/30/18): 4,447 Fleet Units (6/30/18): 1,179


5 5 Investment Highlights Human Capital Senior management drives disciplined growth strategies, operational guidance and capital markets support Most experienced and industry leading acquisitions team Expansion Platform Attractive Asset Class Top five market leader in North America with ample geographic development and expansion potential Market leader in Australia and New Zealand with focus to increase rental penetration Diversified customer base Long lived assets, rapid payback and low maintenance capex Differentiation and diversification of lease fleet Financial Performance Strong discretionary free cash flow Greater focus on leasing positively impacts EBITDA margins
6 xperienced Senior and Field Level anagement Team 6 Dedicated senior executive management team with an average of over 20 years of industry experience Regional management personnel have specific product expertise and an average of over 15 years of industry experience Name Title Prior Experience Jody Miller Charles Barrantes Christopher Wilson President, CEO EVP, CFO General Counsel, VP & Secretary - EVP and COO, Mobile Mini - SVP, Mobile Services Group - SVP, RSC Equipment Rental - VP and CFO, Royce Medical Company - CFO, Earl Scheib, Inc. - Arthur Andersen & Co. - General Counsel and Assistant Secretary, Mobile Services Group, Inc. - Associate, Paul Hastings LLP Jeffrey Kluckman Neil Littlewood Theodore Mourouzis EVP, Business Development CEO of Royal Wolf CEO, President of Pac-Van - Head of Mergers and Acquisitions, Mobile Mini, Mobile Services Group and RSC Equipment Rental -COO, Royal Wolf -Executive General Manager, Royal Wolf -EVP, Coates Hire - Controller for a 3M joint venture - Management consultant, Deloitte & Touche - President of a picture framing distributor and CFO of its holding company
7 7 Leadership Position in North America with Extensive Branch Network Top 5 recognized provider on national, regional and local level 57 primary branches in the United States - presence in 49 of top 100 MSAs FY 2018 Net Promoter Score ( NPS ) of 85 for Pac-Van 3 primary branches in Western Canada Total lease fleet of 43,507 units FY 2018 revenue of $206.3 million FY 2018 adjusted EBITDA of $61.2 million* Calgary, AB, CA Vancouver, BC, CA Seattle Yakima Portland Elko Edmonton, AB, CA Salt Lake City Bakersfield Las Vegas LA-Chino Phoenix North American Branch Network Denver Kermit Watford City Kansas City Indianapolis St. Louis Wichita Springfield Nashville Little Rock Memphis Dallas Houston Austin Madison Green Bay Milwaukee Quad Cities Detroit Des Moines Elkhart Boston Chicago Pittsburgh Trenton Philadelphia Charleston Atlanta Lafayette Albany San Antonio Houma Kenedy Corpus Christi South Royalton Raleigh Charlotte Greenville Jacksonville Orlando Miami KENTUCKY Lexington Louisville Paducah OHIO Cincinnati Cleveland Columbus Toledo Note: Branch figures as of June 30, *Adjusted EBITDA is a Non-GAAP financial measure. Please see reconciliation of adjusted EBITDA in the Appendix.
 in Australia and New Zealand Asia-Pacific Branch Network Only container leasing and sales company with a")
8 Note: Branch figures as of June 30, (1) Management estimate. (2) Adjusted EBITDA is a Non-GAAP financial measure. Please see reconciliation of adjusted EBITDA in the Appendix. 8 #1 Market Share Leader in Asia-Pacific Leadership position with 40% market share (1) in Australia and New Zealand Asia-Pacific Branch Network Only container leasing and sales company with a nationally integrated infrastructure and workforce Darwin Cairns Townsville Largest branch network of any storage container company in Australia and New Zealand 23 primary branches in Australia 12 primary branches in New Zealand Represents all major metropolitan areas Total lease fleet of 42,305 units FY 2018 revenue of $131.1 million FY 2018 adjusted EBITDA of $31.9 million (2) Geraldton Kalgoorlie Perth-Bassendean Rockhampton Brisbane - Banyo Toowoomba Toowoomba South Brisbane Gold Coast Newcastle Central Coast Moorebank Adelaide Whangarei Wollongong Albury Canberra Auckland Silverdale Melbourne -Sunshine Tauranga Hamilton Geelong Napier Melbourne - Clayton Palmerston North Nelson Wellington Launceston Hobart Christchurch Dunedin Invercargill

9 9 Diversified Customer Base Combined Leasing Operations FY 2018 North America Leasing Operations FY 2018 Asia-Pacific Leasing Operations FY 2018 Over 47,000 customers in over 20 industries Largest customer in each geographic venue accounted for less than 10% of venue s respective FY2018 revenue Note: FY 2018 revenue breakdown for North America, Asia-Pacific and Combined Leasing Operations.


10 10 Compelling Unit Economics Best Rental Asset Minimal Maintenance Expense Typical Cost: $2,500 - $3,000 Long Economic Life Typical Rent: ~$100/Month Attractive Tax Attributes Typical Utilization Rate: 80% High Incremental EBITDA Margin
11 100 % 90% 80% 70% 60% 50% 40% 30% 20% 10% 0% 11 Historical Financial Summary Revenue Leasing Revenue $420 $350 $280 $210 $140 ($ in millions) $156 $182 $212 $246 $287 $304 $286 $277 $347 $300 $250 $200 $150 $100 ($ in millions) $77 $90 $104 $123 $151 $200 $168 $176 $215 $70 $50 $0 FY2010 FY2011 FY2012 FY2013 FY2014 FY2015 FY2016 FY2017 FY2018 $0 FY2010 FY2011 FY2012 FY2013 FY2014 FY2015 FY2016 FY2017 FY2018 Adjusted EBITDA (1) Free Cash Flow Before Net Fleet Activity and Acquisitions (1) $120 $100 $80 $60 $40 $20 $0 ($ in millions) $84 $88 $69 $61 $61 $53 $46 $38 $31 20% 21% 22% 22% 24% 28% 21% 22% 25% FY2010 FY2011 FY2012 FY2013 FY2014 FY2015 FY2016 FY2017 FY2018 $60 $50 $40 $30 $20 $10 $0 ($ in millions) $50 $42 $32 $33 $27 $22 $23 $13 $10 FY2010 FY2011 FY2012 FY2013 FY2014 FY2015 FY2016 FY2017 FY2018 (1) Adjusted EBITDA and Free Cash Flow are Non-GAAP financial measures. Please see reconciliations in the Appendix.
12 (in thousands) Disciplined Balance Sheet Management and Capital Allocation 12 Proven track record of organic and acquisition growth Fleet capital investment is discretionary and has been a significant component of our total investment spending Minimal maintenance capital expenditure requirements creates ability to generate free cash flow during a potential economic downturn Net Fleet Capital Expenditures, Acquisitions and Fleet Count Leverage (2) and Net Debt $116.0 $91.0 $66.0 $41.0 $16.0 $ ($ in millions) $ $ $54.6 $45.4 $47.6 $37.7 $22.6 $18.0 $20.8 $21.8 $21.1 $16.1 $4.6 $5.4 $1.0 (1) ($ in millions) $167.0 $130.0 $ x 3.6x 3.0x $ x $350.2 $342.9 $ x 5.7x 4.2x $ x ($9.0) FY2011 FY2012 FY2013 FY2014 FY2015 FY2016 FY2017 FY (3) FY2011 FY2012 FY2013 FY2014 FY2015 FY2016 FY2017 FY2018 Net Fleet CapEx Acquisitions Total Fleet Leverage Net Debt (1) Includes $70.4 total purchase consideration paid for noncontrolling interest in Royal Wolf. (2) Represents total debt, less cash, divided by TTM Adjusted EBITDA. (3) Includes Lone Star Tank Rental, acquired in April 2014, for the full fiscal year.
13 13 Capital Structure as of 6/30/18 Corporate Asia-Pacific Leasing Operations North America Leasing and Manufacturing Operations Consolidated cash $21.6 million Debt $75.8 million 8.125% Senior Notes 1 $79.7 million outstanding on $99.3 million (A$134.0 million) Senior Credit Facility 2,3 $81.1 million Bison Capital Notes 4 $183.9 million outstanding on $237.0 million Senior Credit Facility $6.7 million other Common equity 27.0 million shares outstanding 100% of shares owned by General Finance Cumulative preferred stock $40.1 million North America leasing and manufacturing operations, 100% owned by General Finance 1 Net of $1.6 million deferred financing costs for the Senior Notes. 2 Asia-Pacific Leasing Operations amounts are translated into U.S. Dollars based on $ AUD/USD as of 6/30/18. 3 Net of $2.0 million deferred financing costs for the Asia-Pacific Senior Credit Facility. 4 Net of $1.0 million deferred financing costs for Bison Capital Notes.

14 Appendix
15 A-1 General Finance Organizational Structure (1) (2) General Finance Corporation North America Operations 62.2% of Consolidated Revenue Asia-Pacific Operations 37.8% of Consolidated Revenue Leasing Operations 59.4% of Consolidated Revenue Manufacturing 2.8% of Consolidated Revenue Leasing Operations 37.8% of Consolidated Revenue Pac-Van, Inc. Lone Star Tank Rental Inc. Southern Frac, LLC Royal Wolf Holdings Limited (1) Summary organization chart is illustrative and does not reflect the legal operating structure of General Finance. (2) Reflects consolidated revenues for FY 2018.
16 A-2 Reconciliation of non-gaap Measures Adjusted EBITDA is a non-u.s. GAAP measure. We calculate adjusted EBITDA to eliminate the impact of certain items we do not consider to be indicative of the performance of our ongoing operations. In addition, in evaluating adjusted EBITDA, you should be aware that in the future, we may incur expenses similar to the adjustments in the presentation of adjusted EBITDA. Our presentation of adjusted EBITDA should not be construed as an inference that our future results will be unaffected by unusual or non-recurring items. We present adjusted EBITDA because we consider it to be an important supplemental measure of our performance and because we believe it is frequently used by securities analysts, investors and other interested parties in the evaluation of companies in our industry, many of which present EBITDA and a form of adjusted EBITDA when reporting their results. Adjusted EBITDA has limitations as an analytical tool, and should not be considered in isolation, or as a substitute for analysis of our results as reported under U.S. GAAP. We compensate for these limitations by relying primarily on our U.S. GAAP results and using adjusted EBITDA only supplementally. The following tables show our adjusted EBITDA and the reconciliation from net income (loss) on a consolidated basis and from operating income (loss) for our operating units and the reconciliation of free cash flow on a consolidated basis from our statement of cash flows.
17 A-3 Reconciliation of Consolidated Adjusted EBITDA (in thousands) Year Ended June 30, * Net income (loss) ($8,956) ($8,858) $8,742 $11,413 $15,149 $13,045 ($3,286) ($847) ($9,107) Add (Deduct) -- Provision (benefit) for income taxes (1,261) 2,958 5,360 8,195 11,620 8,697 (2,191) (25) (679) Foreign currency exchange and other (1,948) (4,125) (443) (1,028) 1, ,606 Interest expense 15,974 20,293 12,743 10,969 11,952 21,096 19,648 19,653 33,991 Interest income (234) (487) (157) (58) (52) (68) (97) (66) (112) Depreciation and amortization 19,619 19,165 18,924 22,241 27,127 38,571 38,634 40,092 40,335 Impairment goodwill/ trade name 7,633 5, , Share-based compensation expense ,316 1,938 2,174 2,388 1,374 3,658 Shares of RWH capital stock issued at IPO to Royal Wolf board of directors and executive management Provision for shares of RWH capital stock purchased and awarded to Royal Wolf senior management team Loyalty, past performance and successful IPO bonus to Royal Wolf executive and senior management team , Expenses of postponed public equity offering Inventory write-downs and related , Non-recurring severance costs and CEO retirement compensation at Royal Wolf Refinancing costs not capitalized Adjusted EBITDA $31,456 $37,979 $46,070 $53,048 $69,106 $84,153 $60,830 $60,969 $87,692 * FY 2014 includes approximately $7.0 million of adjusted EBITDA from Lone Star Tank Rental Inc., which was acquired on April 7,2014.
18 A-4 Reconciliation of Operating Unit Adjusted EBITDA Pac-Van (in thousands) Year Ended June 30, Operating income $8,403 $13,323 $18,425 $17,984 $19,551 $28,689 Add -- Depreciation and amortization 6,154 7,928 11,306 13,154 13,663 14,233 Share-based compensation expense Inventory write-downs Refinancing Costs Not Capitalized Adjusted EBITDA $14,816 $21,563 $30,034 $31,635 $33,984 $43,231
19 A-5 Reconciliation of Operating Unit Adjusted EBITDA Lone Star Tank Rental (in thousands) Year Ended Year Ended December 31, June 30, Operating income (loss) $15,033 $16,372 $8,233 ($1,541) ($3,916) $8,798 Add -- Depreciation and amortization 5,356 8,013 11,345 10,529 9,666 9,161 Share-based compensation Adjusted EBITDA $20,389 $24,386 $19,589 $9,010 $5,791 $18,000
20 A-6 Reconciliation of Operating Unit Adjusted EBITDA Royal Wolf (in thousands) Year Ended June 30, Year Ended June 30, Operating income A$26,397 A$29,977 A$25,672 A$17,637 A$14,340 A$17,207 US$13,272 Add (Deduct) -- Depreciation and Amortization 14,997 17,190 18,604 19,685 22,145 22,052 17,098 Share-based compensation expense Non-recurring severance costs and CEO retirement compensation ,037 1,315 (83) 1,914 1, Adjusted EBITDA A$41,961 A$48,099 $A45,313 A$39,612 A$36,402 A$41,173 US$31,883
21 A-7 Reconciliation of Consolidated Free Cash Flow ($ in millions) FY 10 FY 11 FY 12 FY 13 FY 14 FY15 FY16 FY17 FY18 Cash From Operations $16.7 $18.5 $15.2 $34.9 $51.5 $38.2 $48.8 $35.3 $58.8 Add-back Changes in Fleet Inventory (4.4) (1.6) 10.4 (4.8) (12.4) 3.2 (3.0) (4.0) (3.6) Adjusted Cash From Operations $12.3 $16.9 $25.6 $30.1 $39.1 $41.4 $45.8 $31.3 $55.2 Cash From (Used In) Investing $0.7 ($20.7) ($53.2) ($69.7) ($163.6) ($107.4) ($35.4) ($30.7) ($114.5) Add-back Business and Real Estate Transactions Add-back Net Fleet Purchases (2.9) Adjusted Cash Used In Investing ($2.2) ($3.7) ($3.2) ($7.5) ($7.2) ($8.4) ($4.2) ($3.9) ($5.1) Free Cash Flow Prior to Net Fleet Activity and Acquisitions (1) $10.1 $13.2 $22.4 $22.6 $31.9 $33.0 $41.6 $27.4 $50.1 (1) Prior to dividends paid on preferred stock.
22 N A S D A Q : G F N D A Q : G F N
31, 2017 N A S D A Q : G F N
 NASDAQ: GFN Investor Presentation Through Second Quarter Ended December 31, 2017 2 Safe Harbor Statement Statements in this presentation that are not historical facts are forward-looking statements within
Pending Acquisition of Sleep Train. September 4, 2014
 Pending Acquisition of Sleep Train September 4, 2014 Forward Looking Statements and Non-GAAP Information This presentation contains forward-looking statements within the meaning of federal securities laws,
Investor Booklet. August 2017
 Investor Booklet August 2017 Legal Disclaimer This presentation includes forward-looking statements within the meaning of Section 27A of the Securities Act of 1933 and Section 21E of the Securities and
Safe Harbor Caution Concerning Forward-Looking Statements Non-GAAP Financial Measures Important Information For Investors And Shareholders
 February 13, 2014 Safe Harbor Caution Concerning Forward-Looking Statements Certain statements in this communication regarding the proposed acquisition of Time Warner Cable Inc. ( Time Warner Cable ) by
Investor Booklet. March 2018
 Investor Booklet March 2018 Legal Disclaimer This presentation includes forward-looking statements within the meaning of Section 27A of the Securities Act of 1933 and Section 21E of the Securities and
2017 Jefferies Consumer Conference
 207 Jefferies Consumer Conference June 20, 207 Tom Taylor Chief Executive Officer Forward-Looking Statements This presentation and the associated webcast contain forward-looking statements, including with
2017 SUBSCRIBER STUDY
 2017 SUBSCRIBER STUDY business is our middle name business is our middle name BUSINESS IS OUR MIDDLE NAME Atl anta Business Chronicle TODAY signature events print digital BUSINESS IS OUR MIDDLE NAME In
2014 U.S. Census (2015) Median African-American Household Income Rank, Memphis Included. Household Median Income Ranking, African American Population
 Median African-American Household Income Rank, Memphis Included. Household Median Income Ranking, African American Population") 2015 2015 Rankings Report Prepared by Elena Delavega, PhD, MSW Department of Social Work Benjamin L. Hooks Institute for Social Change University of Memphis 2014 U.S. Census (2015) - Rank, Memphis Included
2015 2015 Rankings Report Prepared by Elena Delavega, PhD, MSW Department of Social Work Benjamin L. Hooks Institute for Social Change University of Memphis 2014 U.S. Census (2015) - Rank, Memphis Included
MetroMonitor Tracking Economic Recession and Recovery in America s 100 Largest Metropolitan Areas
 MetroMonitor Tracking Economic Recession and Recovery in America s 100 Largest Metropolitan Areas Howard Wial and Richard Shearer June 2011 (Updated on June 24, 2011) With job growth slowing and housing
Baird 2016 Global Healthcare Conference
 Baird 2016 Global Healthcare Conference September 8, 2016 Bill Rutherford Vic Campbell Mark Kimbrough Chief Financial Officer & Executive Vice President Senior Vice President Vice President, Investor Relations
Investor Presentation
 Feb Investor Presentation 2018 Lee D. Rudow President and CEO Michael J. Tschiderer Chief Financial Officer NASDAQ: TRNS 1 Safe Harbor Statement This presentation contains forward looking statements within
Company Presentation. April Internap Corporation (INAP)
") Company Presentation April 2018 FORWARD-LOOKING STATEMENTS This presentation contains forward-looking statements. These forward-looking statements include statements related to sales, improved profitability,
Company Presentation April 2018 FORWARD-LOOKING STATEMENTS This presentation contains forward-looking statements. These forward-looking statements include statements related to sales, improved profitability,
Singular Best of the Uncovered 12 th Annual Conference 2017
 Dec 4, 2017 Singular Best of the Uncovered 12 th Annual Conference 2017 Michael J. Tschiderer Chief Financial Officer NASDAQ: TRNS 1 Safe Harbor Statement This presentation contains forward-looking statements
Media Kit. Products and demographics
 2012 Media Kit Products and demographics The whole family... Washington Business Journal The weekly newspaper is the source for local business news, in-depth industry coverage, insights and information.
Mattress Firm s Pending Acquisition of Sleepy s November 30, 2015
 Mattress Firm s Pending Acquisition of Sleepy s November 0, 2015 Forward Looking Statements and Non-GAAP Information This presentation contains forward-looking statements within the meaning of federal
Investor Update Year End
 Investor Update 2017 Year End Forward Looking Statements and Non-GAAP Financial Measures This presentation may contain certain forward-looking statements provided by Company management. These statements
Office. Office. IRR Viewpoint 2015
 IRR Viewpoint 05 Above: Designed in 95 in the Art Deco style by architect Timothy Pflueger as the Pacific Telephone and Telegraph Building, 40 New Montgomery Street, San Francisco, CA has been the subject
FOR IMMEDIATE RELEASE Contact: Ann Marie Gorden/Robert Nihen
 cutting through complexity News FOR IMMEDIATE RELEASE Contact: Ann Marie Gorden/Robert Nihen June 24, 2014 KPMG LLP 201-505-6288/201-307-8296 agorden@kpmg.com / rnihen@kpmg.com CINCINNATI, CLEVELAND, ATLANTA
Baird 2018 Global Healthcare Conference
 Baird 2018 Global Healthcare Conference Forward Looking Statements and Non-GAAP Financial Measures This presentation may contain certain forward-looking statements provided by Company management. These
State of the U.S. Multifamily Market. Q Review and Forecast
 State of the U.S. Multifamily Market Q1 2015 Review and Forecast Agenda Economy Leasing Fundamentals Rent and NOI Trends Single-Family Market Capital Markets Economy page 3 GDP Growth Contributions To
Buckeye GP Holdings L.P. (NYSE: BGH) Buckeye Partners, L.P. (NYSE: BPL) Kelso & Company Annual LP Conference April 21, 2010
 Buckeye Partners, L.P. (NYSE: BPL) Kelso & Company Annual LP Conference April 21, 2010") Buckeye GP Holdings L.P. (NYSE: BGH) Buckeye Partners, L.P. (NYSE: BPL) Kelso & Company Annual LP Conference April 21, 2010 Forward Looking Statement Certain statements contained in this presentation or
Buckeye GP Holdings L.P. (NYSE: BGH) Buckeye Partners, L.P. (NYSE: BPL) Kelso & Company Annual LP Conference April 21, 2010 Forward Looking Statement Certain statements contained in this presentation or
Jefferies Consumer Conference June 2016
 Jefferies Consumer Conference SAFE HARBOR STATEMENT Safe Harbor Statement under the Private Securities Litigation Reform Act of 1995: Statements in this presentation regarding the business of The Chefs
Q and FY 2015 Investor Presentation
 Q4 2015 and FY 2015 Investor Presentation Legal Disclaimer This presentation contains "forward-looking statements" within the meaning of the Private Securities Litigation Reform Act of 1995. All statements
CALL REPORT MEMBER BANK BOARD OF GOVERNORS OF THE FEDERAL RESERVE SYSTEM WASHINGTON
 MEMBER BANK CALL REPORT BOARD OF GOVERNORS OF THE FEDERAL RESERVE SYSTEM WASHINGTON Assets and Liabilities: TABLE OF CONTENTS Of All Member Banks June 0, 98, April iz, 98, and June 0, 97 Of All Member
Business Combination of Skyline Corporation and Champion Homes Creating the Nation s Largest Publicly Traded Factory-Built Housing Company
 Business Combination of Skyline Corporation and Champion Homes Creating the Nation s Largest Publicly Traded Factory-Built Housing Company January 25, 2018 Disclaimer Forward-Looking Statements Statements
ERRATA. To: Recipients of MG-388-RC, Estimating Terrorism Risk, RAND Corporation Publications Department. Date: December 2005
 ERRATA To: Recipients of MG-388-RC, Estimating Terrorism Risk, 25 From: RAND Corporation Publications Department Date: December 25 Re: Corrected pages (pp. 23 24, Table 4.1,, Density, Density- Weighted,
Quarterly Investor Presentation. First Quarter 2017
 Quarterly Investor Presentation First Quarter 2017 Forward Looking Statements This presentation contains statements about future events and expectations that constitute forward looking statements. These
Investor Update as of 2016 Year End
 Investor Update as of 2016 Year End Forward Looking Statements and Non-GAAP Financial Measures This presentation may contain certain forward-looking statements provided by Company management. These statements
Emerging Trends in Real Estate Sustaining Momentum but Taking Nothing for Granted
 Emerging Trends in Real Estate 2015 Sustaining Momentum but Taking Nothing for Granted DALLAS November 6, 2014 36th annual outlook 1,400+ interviews and surveys of industry leaders Rewind: 2014 Emerging
FOURTH QUARTER Quarterly Financial Data
 2018 FOURTH QUARTER Quarterly Financial Data Finance Department Three Commercial Place Norfolk, Virginia 23510.2191 NORFOLK SOUTHERN RAILWAY SYSTEM Rouses Point Albany Ayer Buffalo Binghamton Des Moines
Investor Update Post 2Q 2017
 Investor Update Post 2Q 2017 Forward Looking Statements and Non-GAAP Financial Measures This presentation may contain certain forward-looking statements provided by Company management. These statements
HIGH AND WIDE: INCOME INEQUALITY GAP IN THE DISTRICT ONE OF BIGGEST IN THE U.S. By Wes Rivers
 An Affiliate of the Center on Budget and Policy Priorities 820 First Street NE, Suite 510 Washington, DC 20002 (202) 408-1080 Fax (202) 325-8839 www.dcfpi.org March 13, 2014 HIGH AND WIDE: INCOME INEQUALITY
Company Presentation. September Internap Corporation (INAP)
") Company Presentation September 2018 FORWARD-LOOKING STATEMENTS This presentation contains forward-looking statements. These forward-looking statements include statements related to sales, backlog, profitability,
Company Presentation September 2018 FORWARD-LOOKING STATEMENTS This presentation contains forward-looking statements. These forward-looking statements include statements related to sales, backlog, profitability,
RELIABILITY. RELATIONSHIPS. RESULTS.
 RELIABILITY. RELATIONSHIPS. RESULTS. DONE DEALS 2013 BEYOND NUMBERS. BEYOND BORDERS. BEYOND EXPECTATIONS. At PNC Business Credit, we have a longterm track record of reliability, with more than 600 done
Oppenheimer Healthcare Conference December 10, 2014, New York, NY
 Oppenheimer Healthcare Conference December 10, 2014, New York, NY Vic Campbell Senior Vice President Mark Kimbrough Vice President Investor Relations FORWARD-LOOKING STATEMENTS AND NON-GAAP FINANCIAL MEASURES
AEI Center on Housing Markets and Finance Announces Ten Best and Worst Metro Areas to Be a First Time Homebuyer
 AEI Center on Housing Markets and Finance Announces Ten Best and Worst Metro Areas to Be a First Time Homebuyer Edward Pinto and Tobias Peter November 28th, 2018 New AEI study ranks 50 metros by home price
Investor Update 2Q 2018
 Investor Update 2Q 2018 Forward Looking Statements and Non-GAAP Financial Measures This presentation may contain certain forward-looking statements provided by Company management. These statements are
Economic Risks and Their Meaning for the Southwest STEVE COCHRANE, MANAGING DIRECTOR
 Economic Risks and Their Meaning for the Southwest STEVE COCHRANE, MANAGING DIRECTOR The Europeans Are All-in Composition of the European Central Bank s balance sheet, bil 5,000 Other assets Emergency
Schneider National, Inc. Reports First Quarter 2017 Results
 Schneider National, Inc. Reports First Quarter 2017 Results Operating Revenues of $1.0 billion, an increase of 8.4% compared to first quarter 2016 Net Income of $22.6 million, a decrease of 19.8% compared
Telsey Advisory Group Fall 2011 Consumer Conference September 2011
 Telsey Advisory Group Fall 2011 Consumer Conference September 2011 Safe Harbor/Non-GAAP Financial Disclosures All statements included in this presentation, other than historical information or statements
Capital Market Update. February 10, 2011 Marc Louargand, Ph.D., CRE, FRICS Principal SALTASH PARTNERS LLC investing in American ingenuity
 Capital Market Update February 10, 2011 Marc Louargand, Ph.D., CRE, FRICS Principal SALTASH PARTNERS LLC investing in American ingenuity A Brief Tour of the Capital Market What s happened in the past year?
Q Earnings Report. Sabre Corporation August 4, 2015
 Q2 2015 Earnings Report Sabre Corporation August 4, 2015 1 Forward-looking Statements Forward Looking Statements Certain statements herein are forward-looking statements about trends, future events, uncertainties
William Blair & Company 36th Annual Growth Stock Conference
 1 William Blair & Company - 36th Annual Growth Stock Conference William Blair & Company 36th Annual Growth Stock Conference June 15, 2016 Jim Braun Executive Vice President & CFO Monica Broughton Executive
Employee Benefits Alert
 Legal & Research Group Benefits Alert Issue No. 24 October 2004 Benefits Brokerage & Consulting Services Rx Purchasing Coalition HR Consulting Data Analysis Benefits Administration Retirement Services
J.P. Morgan Energy Distribution Day
 1 J.P. Morgan Energy Distribution Day J.P. Morgan Energy Distribution Day September 29, 2016 Andrew R. Lane President & CEO Jim Braun Executive Vice President & CFO 2 J.P. Morgan Energy Distribution Day
CBRE CAP RATE SURVEY. A CBRE Publication. First Half Click to Enter
 CBRE CAP RATE SURVEY A CBRE Publication In This Issue: pg 2 pg 8 pg 17 pg 26 pg 36 pg 41 pg 44 Click to Enter United States The 10-year Treasury (UST) was measurably lower than 2% from April 2012 through
Q Investor Presentation
 Q3 2016 Investor Presentation Legal Disclaimer This presentation contains "forward-looking statements" within the meaning of the Private Securities Litigation Reform Act of 1995. All statements contained
The following table sets forth, for the periods indicated, the Company s results of operations:
 Schneider National, Inc. Reports Fourth Quarter 2017 Results Broad portfolio of services delivers revenue growth and earnings Operating Revenues of $1.2 billion, an increase of 11% compared to fourth quarter
Q Investor Presentation
 Q1 2016 Investor Presentation Legal Disclaimer This presentation contains "forward-looking statements" within the meaning of the Private Securities Litigation Reform Act of 1995. All statements contained
Cycle Monitor Real Estate Market Cycles First Quarter 2018 Analysis
 Black Creek Research Cycle Monitor Real Estate Market Cycles First Quarter 20 Analysis Real estate physical market cycle analysis of five property types in Metropolitan Statistical Areas (MSAs). Equilibrium
EX d618998dex991.htm EX-99.1 Exhibit 99.1
 EX-99.1 2 d618998dex991.htm EX-99.1 Exhibit 99.1 October 29, 2013 Board of Directors MTR Gaming Group, Inc. State Route 2 South Chester, West Virginia 26034 Dear Sirs: I am surprised that my October 2,
Employee Benefits Alert
 Employee Benefits Alert September 2005 Issue No. 48 Health Saving Accounts: Comparability Rules The IRS and Treasury recently published proposed regulations concerning the comparability rules for employer
HCA Investor Presentation
 HCA Investor Presentation Forward Looking Statements and Non GAAP Financial Measures This presentation may contain certain forward looking statements provided by Company management. These statements are
Daseke, Inc. Consolidating the Flatbed & Specialized Logistics Market Acquisition Conference Call December 6 th, 2017
 Daseke, Inc. Consolidating the Flatbed & Specialized Logistics Market Acquisition Conference Call December 6 th, 2017 Important Disclaimers Forward-Looking Statements This presentation includes forward-looking
Investor Presentation January 2016
 Investor Presentation January 2016 Forward Looking Statements and Non-GAAP Information This presentation contains forward-looking statements within the meaning of federal securities laws, that are subject
2017 Supplemental Earnings Slides. February 15, 2018
 2017 Supplemental Earnings Slides February 15, 2018 1 Cautionary Note on Forward-Looking Statements This presentation contains forward-looking statements, within the meaning of the Private Securities Litigation
Employee Benefits Alert
 Employee Benefits Alert Issue 110 June 2007 The Massachusetts Health Care Reform Act: What s an Employer to Do? The Massachusetts Health Care Reform Act became law in April 2006; the July 1, 2007 effective
N o t i c e . - October 8, Cancel Date: into the CCDM. Subject: Small Business/Self-Employed
 Department Internal Office of of the Revenue Chief Counsel Treasury Service N o t i c e +, N(30)000-349. - October 8, 2000 Division Counsel, Subject: Small Business/Self-Employed Upon Incorporation Cancel
COMMERCIAL AUTO INSURANCE NON-FLEET
 COMMERCIAL AUTO INSURANCE NON-FLEET GENERAL INFORMATION Individual Partnership LLC Corporation S-Corporation Other (explain) Name: Federal ID or SSN: U.S. DOT #: Mailing address: City: State: Zip: Phone:
Q Investor Presentation
 Q2 2015 Investor Presentation Legal Disclaimer This presentation contains "forward-looking statements" within the meaning of the Private Securities Litigation Reform Act of 1995. All statements contained
Data Brief. Trends in Employer-Sponsored Health Insurance Premiums and Employee Contributions in Major Metropolitan Areas,
 December 2012 Data Brief Trends in Employer-Sponsored Health Insurance Premiums and Employee Contributions in Major Metropolitan Areas, 2003 2011 The mission of The Commonwealth Fund is to promote a high
We believe in in the power of a vision. Investor Presentation
 We believe in in the power of a vision. Q1-2008 Investor Presentation Forward-Looking Statements Certain matters discussed in this presentation may be forward-looking statements within the meaning of the
GWIPP WORKING PAPER SERIES. Have central cities come back? Kimberly Furdell Edward W. (Ned) Hill Harold Wolman
 Hill Harold Wolman") GWIPP WORKING PAPER SERIES Have central cities come back? Kimberly Furdell Edward W. (Ned) Hill Harold Wolman Working Paper Number 5 http://www.gwu.edu/~gwipp/papers/wp005 March 2004 George Washington
GWIPP WORKING PAPER SERIES Have central cities come back? Kimberly Furdell Edward W. (Ned) Hill Harold Wolman Working Paper Number 5 http://www.gwu.edu/~gwipp/papers/wp005 March 2004 George Washington
The ONE Group Announces Fourth Quarter and Fiscal Year 2014 Results Ticker Symbol: U:STKS
 The ONE Group Announces Fourth Quarter and Fiscal Year 2014 Results Ticker Symbol: U:STKS http://finance.yahoo.com/news/one-group-announces-fourth-quarter-202000251.html NEW YORK -- (Business Wire) March
Struggling to Escape the Fallout of the Great Recession MARISA Di NATALE, MANAGING DIRECTOR
 Struggling to Escape the Fallout of the Great Recession MARISA Di NATALE, MANAGING DIRECTOR FROM MOODY S ECONOMY.COM Broad-Based Slowing Across the Nation Total employment excluding federal government,
Cautionary Information
 May 17, 2016 Bank of America Merrill Lynch 2016 Transportation Conference Rob Knight CFO 1 Cautionary Information This presentation and related materials contain statements about the Company s future that
Public Transit: The Funding Crisis and A Need for Action
 Attachment 1 Public Transit: The Funding Crisis and A Need for Action #141603 November 25, 2008 1 Southeastern Wisconsin Needs a Good Public Transit System To meet the travel needs work, education, healthcare,
Quarterly Financial Data
 2016 FOURTH QUARTER Quarterly Financial Data Finance Department Three Commercial Place Norfolk, Virginia 23510.2191 Norfolk Southern Railway System Rouses Point Ayer Albany Buffalo Binghamton Detroit Chicago
FINANCIAL STATE OF THE CITIES
 FINANCIAL STATE OF THE CITIES An Annual Report by Truth in Accounting www.statedatalab.org January 2019 1 Table of Contents Executive Summary 4 Introduction and Background 5 Summary of Findings 6 Sunshine
Conference Call Presentation
 Conference Call Presentation First Quarter Ended September 24, 207 (Unaudited Results) Cautionary Statement on Forward-Looking Statements Certain statements included herein contain forward-looking statements
OPPENHEIMER HOLDINGS INC. SEPTEMBER 2015
 OPPENHEIMER HOLDINGS INC. SEPTEMBER 2015 Presented by: Robert Lowenthal Senior Managing Director, Chairman of Management Committee Jeffrey Alfano Executive Vice President & Chief Financial Officer SAFE
SCHNEIDER NATIONAL, INC. (Exact Name of Registrant as Specified in Charter)
") UNITED STATES SECURITIES AND EXCHANGE COMMISSION WASHINGTON, DC 20549 FORM 8-K CURRENT REPORT PURSUANT TO SECTION 13 OR 15(D) OF THE SECURITIES EXCHANGE ACT OF 1934 Date of report (Date of earliest event
UNITED STATES SECURITIES AND EXCHANGE COMMISSION WASHINGTON, DC 20549 FORM 8-K CURRENT REPORT PURSUANT TO SECTION 13 OR 15(D) OF THE SECURITIES EXCHANGE ACT OF 1934 Date of report (Date of earliest event
Employee Benefits Alert
 Legal & Research Group Employee Benefits Alert Issue No. 40 June 2005 Legislative & Compliance Benefits Brokerage & HR Consulting Services Rx Purchasing Coalition Data Analysis Benefits Administration
State Of The U.S. Industrial Market: 2017 Q2
 State Of The U.S. Industrial Market: 2017 Q2 Copyright 2017 CoStar Realty Information, Inc. No reproduction or distribution without permission. The following information includes projections and analyses
Quarterly Financial Review
 Quarterly Financial Review Second Quarter 2007 Norfolk Southern Corporation Finance Department Three Commercial Place Norfolk, Virginia 23510.2191 rs Norfolk Southern Railway System Montréal Waterville
Relationships. Results. COMPANY OVERVIEW COMMERCIAL REAL ESTATE DEBT, EQUITY & SERVICING
 Relationships. COMPANY OVERVIEW Results. COMMERCIAL REAL ESTATE DEBT, EQUITY & SERVICING COMMERCIAL REAL ESTATE DEBT, EQUITY & SERVICING Relationships. Results. For more than 50 years, NorthMarq Capital
SCHNEIDER NATIONAL, INC. (Exact Name of Registrant as Specified in Charter)
") UNITED STATES SECURITIES AND EXCHANGE COMMISSION WASHINGTON, DC 20549 FORM 8-K CURRENT REPORT PURSUANT TO SECTION 13 OR 15(D) OF THE SECURITIES EXCHANGE ACT OF 1934 Date of report (Date of earliest event
UNITED STATES SECURITIES AND EXCHANGE COMMISSION WASHINGTON, DC 20549 FORM 8-K CURRENT REPORT PURSUANT TO SECTION 13 OR 15(D) OF THE SECURITIES EXCHANGE ACT OF 1934 Date of report (Date of earliest event
Investor Contact: Charlotte McLaughlin HD Supply Investor Relations
 Investor Contact: Charlotte McLaughlin HD Supply Investor Relations 770-852-9100 InvestorRelations@hdsupply.com Media Contact: Quiana Pinckney, APR HD Supply Public Relations 770-852-9057 Quiana.Pinckney@hdsupply.com
Quarterly Financial Review
 Quarterly Financial Review Third Quarter 2007 Norfolk Southern Corporation Finance Department Three Commercial Place Norfolk, Virginia 23510.2191 rs Norfolk Southern Railway System Montréal Waterville
Forward-Looking Statements
 JPM-0807 1 Forward-Looking Statements Certain statements contained in this presentation are forward-looking statements within the meaning of the Private Securities Litigation Reform Act of 1995. These
Kraton Performance Polymers, Inc.
 Kraton Performance Polymers, Inc. Third Quarter 2015 Earnings Conference Call October 29, 2015 Forward Looking Statement Disclaimer This presentation includes forward looking statements that reflect our
Kirby Corporation Acquisition of Stewart & Stevenson
 June 13, 2017 Kirby Corporation Acquisition of Stewart & Stevenson Conference Call Reference Materials Forward-Looking Statements Statements contained in this document with respect to the future are forward-looking
RW Baird 2011 Business Solutions Conference
 HUDSON HIGHLAND GROUP RW Baird 2011 Business Solutions Conference February 24, 2011 Forward Looking Statement Please be advised that except for historical information, the comments made during this presentation
USACE Navigation Program
 USACE Navigation Program AAPA Harbors and Navigation Meeting Oxnard, CA Jeff McKee Navigation Branch HQUSACE January 15, 2013 US Army Corps of Engineers Corps Navigation Mission Provide safe, reliable,
Highlands Spin-Off & Student Housing Transaction Webcast. January 18, 2016
 Highlands Spin-Off & Student Housing Transaction Webcast January 18, 2016 Disclaimer Forward-Looking Statements in this presentation, which are not historical facts, are forward-looking statements within
First Quarter 2018 Investor Conference Call in Euros
 The first quarter 2018 financial results conference call was held on June 5, 2018, and at that time, all figures were presented and discussed in USD. Given that for the second quarter of 2018, we will
Southwest IDEAS Conference
 HUDSON HIGHLAND GROUP Southwest IDEAS Conference November 2010 Forward Looking Statement Please be advised that except for historical information, the comments made during this presentation and in these
WE MOVE INDUSTRIES. Investor Presentation April 2019
 WE MOVE INDUSTRIES Investor Presentation April 2019 1 IMPORTANT DISCLAIMERS Forward-Looking Statements This presentation includes forward-looking statements within the meaning of the safe harbor provisions
CYCLE FORECAST Real Estate Market Cycles First Quarter 2018 Estimates May 2017
 CYCLE FORECAST Real Estate Market Cycles First Quarter 20 Estimates May 20 So far, 20 continues along at a slow Gross Domestic Product (GDP) growth rate near 2% and employment continues to hover above
multifamily market overview presented by: Kurt Shoemaker First Vice President
 multifamily market overview 2019 presented by: Kurt Shoemaker First Vice President g r e a t e r d a y t o n a p a r t m e n t a s s o c i a t i o n agenda 01 02 03 04 05 06 macro-level economic indicators
May 24, 2018 MLP & Energy Conference
 May 24, 2018 MLP & Energy Conference Carlin Conner, CEO Non-GAAP Financial Measures SemGroup s non-gaap measures, Adjusted EBITDA and Total Segment Profit, are not GAAP measures and are not intended to
FOR IMMEDIATE DISTRIBUTION June 27, 2017
 BADGER DAYLIGHTING LTD. UPDATES INVESTOR PRESENTATION PROVEN BUSINESS MODEL AND STRONG COMPETITIVE POSITION OFFERS A UNIQUE SERVICE TO ATTRACTIVE MARKETS EXECUTING ON A FOCUSED STRATEGY PRESS RELEASE TSX-BAD
American Jobs Act - Preventing Teacher Layoffs Estimated Jobs Impact by State
 American Jobs Act - Preventing Teacher Layoffs Estimated Jobs Impact by Funds Allocated Estimate of Jobs Supported for 1 School Year Alabama $ 451,477,775 7,000 Alaska $ 70,483,533 900 Arizona $ 625,502,087
INDUSTRIAL REPORT VIEWPOINT 2017 / COMMERCIAL REAL ESTATE TRENDS. By: Hugh F. Kelly, PhD, CRE. irr.com. An Integra Realty Resources Publication
 INDUSTRIAL REPORT VIEWPOINT 2017 / COMMERCIAL REAL ESTATE TRENDS By: Hugh F. Kelly, PhD, CRE Growing Consumption Fuels the Industrial Sector IRR research indicates that more than half of U.S. industrial
Page 2 PERFORMANCE... 3
 TABLE OF CONTENTS PERFORMANCE... 3 NET ASSET VALUE... 4 FINANCIAL HIGHLIGHTS... 6 PORTFOLIO PROFILE... 7 BALANCE SHEETS... 8 STATEMENTS OF OPERATIONS... 9 FUNDS FROM OPERATIONS... 10 RESULTS OF OPERATIONS...
Quality People. Building Solutions. As of March 7, 2012
 Quality People. Building Solutions. As of March 7, 2012 Safe Harbor Statement Certain statements and information in this presentation may constitute forward-looking statements within the meaning of the
Fiscal Fact. Sales Tax Rates in Major U.S. Cities. By Scott Drenkard, Alex Raut, and Kevin Duncan. Executive Summary
 April 11 th, 2012 No. 296 Fiscal Fact Sales Tax Rates in Major U.S. Cities By Scott Drenkard, Alex Raut, and Kevin Duncan Executive Summary Sales taxes in the United States are levied not only by state
Cycle Monitor Real Estate Market Cycles Fourth Quarter 2017 Analysis
 Black Creek Research Cycle Monitor Real Estate Market Cycles Fourth Quarter 0 Analysis Real Estate Physical Market Cycle Analysis of Property Types in Metropolitan Statistical Areas (MSAs). Many economists
WE MOVE INDUSTRIES. Stifel Conference February 2019
 WE MOVE INDUSTRIES Stifel Conference February 2019 1 IMPORTANT DISCLAIMERS Forward-Looking Statements This presentation includes forward-looking statements within the meaning of the safe harbor provisions
CLEAR CHANNEL OUTDOOR HOLDINGS, INC. REPORTS RESULTS FOR 2016 FIRST QUARTER
 CLEAR CHANNEL OUTDOOR HOLDINGS, INC. REPORTS RESULTS FOR 2016 FIRST QUARTER Revenues Down 4.0%; OIBDAN Down 3.8% Revenues Up 1.8%; OIBDAN Up 4.8% Excluding FX and Non-Strategic Asset Sales ----------------