One of the most significant producers of non-alcoholic beverages in CEE and SEE Revenues 12M17: 264M EBITDA 12M17: 36M. 8 production plants
|
|
|
- George Hubert Carson
- 5 years ago
- Views:
Transcription


1


2 One of the most significant producers of non-alcoholic beverages in CEE and SEE Revenues 12M17: 264M EBITDA 12M17: 36M 8 production plants 2,182 employees EUR/CZK ex. rate:


3 Current ownership structure Free float 6.04% OWN shares 5.00% CED Group S.a.r.l % AETOS a.s % 3


4 4


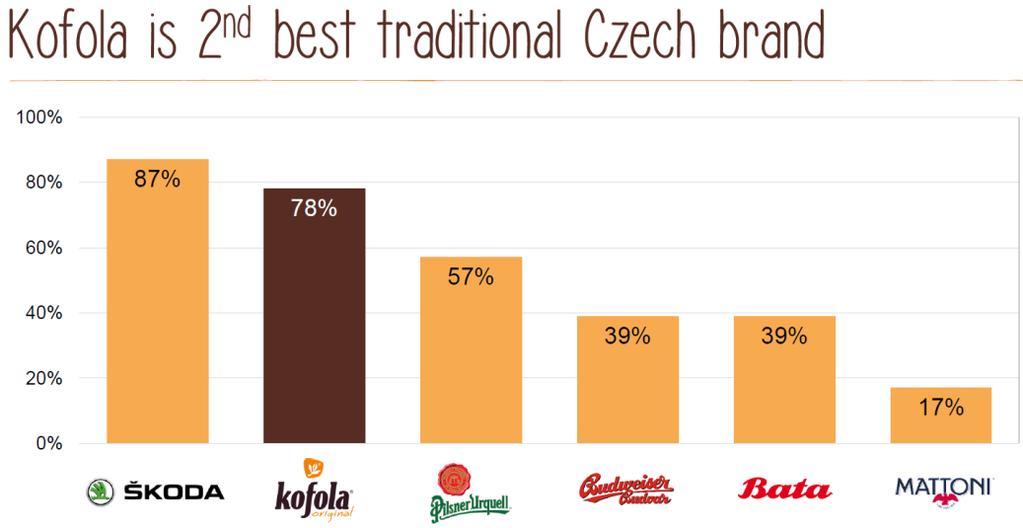
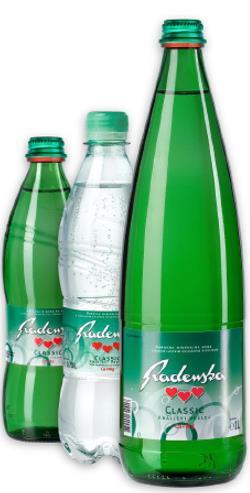
5 No. 2 player in the soft drinks market 3 rd most admired company UGO leader in healthy live style refreshment No. 1 player in the soft drinks market in Slovenia No. 1 water brand in both Retail & HoReCa No. 1 Player in the soft drinks market both in Retail & HoReCa 36% HoReCa market share HoReCa means hotel, restaurant, café No. 2 water brand No. 2 syrup brand No. 2 syrup brand No. 3 cola brand Private label soft drinks producer Source: AC Nielsen / Ogilvy & Mather research (value)- for market shares, Awards: Czech TOP 100, Najdoveryhodnejšia značka 5


 and focus on innovations especially in fresh")


6 Exposure to consumers in the CEE markets with booming retail consumptions, falling unemployment and growing salaries Focus on the smaller markets, difficult for global players to enter, and offering higher profitability Strong brands, unique positioning (HoReCa) and focus on innovations especially in fresh and healthy lifestyle products Benefit from very strong cash flow allowing for both growth and dividend payout Developments aimed at increase of freefloat and liquidity Lower sugar prices with end of EU sugar import quotas from October 2017


 2004 2008 Rajec brand created")
 2015 Expansion into the")


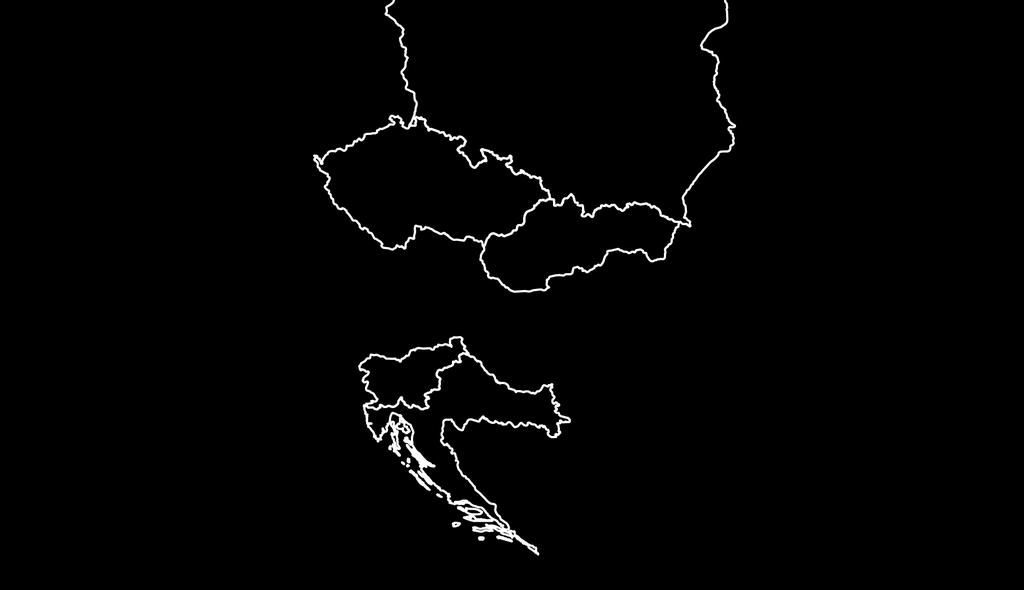
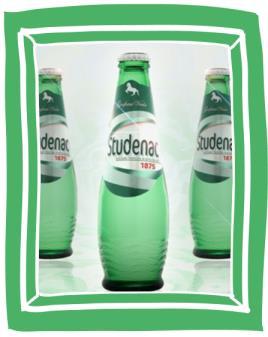
7 Establishment of the Kofola brand HoReCa started in Czechia & Slovakia 2003 Acquisition of the Kofola brand and original recipe by predecessor of Kofola CZ Acquisition of Vinea brand in Slovakia (most popular CSD in Slovakia) Rajec brand created internally by Kofola 2012 Acquisition of Ugo group (fresh juices) 2015 Expansion into the Adriatic region Acquisition of Radenska, No. 1 water producer in Slovenia Acquisition of Studenac no. 2 mineral water brand in Croatia 2017 Expansion into a new segment of healthy products Acquisition of Premium Rosa Acquisition of LEROS 7


8 Distributed & Licensed 8

9 Kofola Retail market share (VALUE) 25% 20% Kofola gain vs. Competitor %p. 25% 20% Kofola gain vs. Competitor %p. 15% 10% 13% 15% 15% 10% 17% 19% 5% % Kofola Competitor 1 Competitor 2 Competitor 3 Based on AC Nielsen and Data Servis, Kofola incl. exclusively distributed brands, Kofola gain vs. Competitor 1 calculated between 2017 and
10 Kofola HoReCa market share (VOLUME) 50% 40% 30% 20% 20% Kofola gain vs. Competitor %p. 24% 50% 40% 30% 20% 31% Kofola gain vs. Competitor %p. 35% 10% 10% 0% % Kofola Competitor 1 Competitor 2 Competitor 3 Based on AC Nielsen and Data Servis, Kofola incl. exclusively distributed brands, Kofola gain vs. Competitor 1 calculated between 2017 and


11 High market entry barriers leading to limited competition usually only 2 global players + 1 local like Kofola Higher margins comparing to retail channel Loyalty low fluctuation of clients Additional marketing tool supporting brand awareness Successful direct distribution model 11


12


13 2017 STUDENAC Acquisition Rising revenues in Croatia also thanks Radenska and Pepsi. Croatian market oportunity due to bankruptcy of Agrokor. We see potential upside to increase our market share 13


.")

14 In March 2018 acquired LEROS leading producer of high quality products from medicinal plants and quality natural teas. 40-year tradition, leading share in pharmacy channel Another segment for Kofola - based on herbs and authentic healthy raw materials. Revenues in 2017 over 5,2 MEUR Important part of the healthy lifestyle strategy of Kofola (July 2017). Start up that records double-digit sales growth. Kofola will expand its portfolio of healthy food products: syrups, juices, jams, products made from medicinal plants from certified farms. Purchase price: 2,5 MEUR Group revenue 2017: 2,4 MEUR (6 months). 14
15


16 Ugo bars sales (CZK m) Own Franchises 12 Substantial increase in number of bars
17
18 [CZKm] [CZKm] Brand revenues Total revenues CS Adriatic PL UGO 5,703 5,934 6, ,545 4, Private label Branded Constant growth in revenue of branded products 3Y CAGR of 4.2% and 5Y CAGR of 8.1% 2017 revenue decrease attributable to Poland, partly offset by growth of sales in other regions driven by growth in Adriatic and UGO Source: Company data 18
19 Guidance for ,000 MCZK EBITDA growth in resulting from business improvement on all Kofola markets and channels CZ + SK + Adriatic markets showed stable growth in EBITDA Net decrease in total EBITDA in 2016 and 2017 was due to worse performance in Poland,, which was partially compensated by improvement in Slovenia Adriatic market saw power of local brands investment and business model proper implementation CZ + SK experienced increased costs of sugar, increased logistic costs (Slovakia) and increased selling and marketing expenses (Ugo) Poland saw decreased sales mainly of private labels CZ+SK SEE Poland 1,103 1, (CZK m) Total CAGR 4% CZ+SK CAGR 4% * See page 34 for discussion on adjustments for 2017 EBITDA 19
20 Results comparison 3M18 3M17 Change Change CZK mil. CZK mil. CZK mil. % Revenue % Cost of sales (894.3) (873.3) (21.0) 2.4% Gross profit % Selling, marketing and distribution costs (479.6) (440.8) (38.7) 8.8% Administrative costs (99.8) (88.2) (11.6) 13.1% Other operating income, net % Operating result (37.3) (57.7) 20.4 (35.5%) EBITDA % Finance costs, net (27.5) (12.8) (14.6) 113.9% Income tax (3.4) 2.1 (5.4) (263.2%) Profit for the period (68.1) (68.4) 0.4 (0.6%) - attributable to shareholders of the parent (66.8) (67.5) 0.6 (0.9%) The Group s revenue without Poland increased by CZK 116 mil. (10.9%). Revenue grew in all segments except Poland. Main increase in Czechia, thanks to Kofola, Rauch, Vinea and increased sales in Ugo. Sales in the Adriatic region increased by 17.2 %. Increased selling costs in CzechoSlovakia (mainly marketing), Ugo (selling O/H including personnel costs), partly compensated by lower costs in Poland. Increased admin costs mainly in Ugo. Increased finance costs due to higher FX losses. * adjusted for one-offs 20


21 * adjusted for one-offs 21

 (m EUR) 180% 160% 140% 120% 100% 80% 60% 40% 20% 0% 16 17 18 20% 14% 19% 24% 26% 25% 56% 60% 56% 2015 2016 2017 180%")
22 Sugar price increase 17/16: +10,5%. Direct impact on EBITDA: - 3M OCT 2017: the end of EU sugar import quotas Positive sugar price development in 2018 Stabilization on world sugar price in next years % 24% 23% 37% 39% 40% 41% 37% 37% (m EUR) (m EUR) 180% 160% 140% 120% 100% 80% 60% 40% 20% 0% % 14% 19% 24% 26% 25% 56% 60% 56% % 160% 140% 120% 100% 80% 60% 40% 20% 0% Packaging% Sweeteners% Other% Total Packaging% Sweeteners% Other% Total 22


23 *dividend suggested by majority shareholder * Aim of dividend distribution to shareholders of Kofola of at least 60% of its consolidated net profit achieved in each financial year from 2017 until 2020, subject to sufficient distributable profits. Operating Cash Flow / EBITDA 2017: 76% Net debt / EBITDA 2017: 2.5x (including 5% own shares buy back in 2017) CAPEX in 2017: 19M (similar level for next 3 years) 23


24 Experienced management with commercial background and focus on results improvement. Production efficiency optimization with focus on own brands, supported by private labels. Lower sales but standard profitability (target 10%). Concentration of production in one plant (Kutno), the most modern plant in the group. Distribution of Nestea from Share in group s EBITDA 2017 is 2% (2016: 13%) 24
25 A contingency plan assumes divestment of the HOOP business in 2018 Our successful acquisition Premium Rosa will be integrated with LEROS a new healthy segment HOOP exit impact to Kofola Group: Group Results 12M* - without HOOP 12M17 12M16 Change Change CZK mil. CZK mil. CZK mil. % Revenue % EBITDA % 17% decrease of Kofola Group sales No real impact to EBITDA performance Dividend distribution availability risk Group Results 12M* - with HOOP 12M17 12M16 Change Change CZK mil. CZK mil. CZK mil. % Revenue (35.7) (0.5%) EBITDA (114.2) (10.7%) * adjusted for one-offs 25


26 This presentation ( the Presentation ) has been prepared by Kofola ČeskoSlovensko a.s. ( the Company ). The Company has prepared the Presentation with due care, however certain inconsistencies or omissions might have appeared in it. Therefore it is recommended that any person who intends to undertake any investment decision regarding any security issued by the Company or its subsidiaries shall only rely on information released as an official communication by the Company in accordance with the legal and regulatory provisions that are binding for the Company. It should be also noted that forward-looking statements, including statements relating to expectations regarding the future financial results give no guarantee or assurance that such results will be achieved. The Board of Directors s expectations are based on present knowledge, awareness and/or views of the Company s Board of Directors s members and are dependent on a number of factors, which may cause that the actual results that will be achieved by the Company may differ materially from those discussed in the document. Many such factors are beyond the present knowledge, awareness and/or control of the Company, or cannot be predicted by it. No warranties or representations can be made as to the comprehensiveness or reliability of the information contained in this Presentation. Neither the Company nor its directors, managers, advisers or representatives of such persons shall bear any liability that might arise in connection with any use of this Presentation. Furthermore, no information contained herein constitutes an obligation or representation of the Company, its managers or directors, its shareholders, subsidiary undertakings, advisers or representatives of such persons. This Presentation was prepared for information purposes only and is neither a purchase or sale offer, nor a solicitation of an offer to purchase or sell any securities or financial instruments or an invitation to participate in any commercial venture. This Presentation is neither an offer nor an invitation to purchase or subscribe for any securities in any jurisdiction and no statements contained herein may serve as a basis for any agreement, commitment or investment decision, or may be relied upon in connection with any agreement, commitment or investment decision. 26


27
28 Adjusted consolidated financial results 3M18 3M * 2016* 2015* 2014* 2013* CZK 000 CZK 000 CZK 000 CZK 000 CZK 000 CZK 000 CZK 000 Revenue 1,433,952 1,343,528 6,963,278 6,998,960 7,190,838 6, ,287,894 Cost of sales (894,272) (873,303) (4,134,081) (4,211,593) (4,352,102) (3, ) (4,300,767) Gross profit 539, ,225 2,829,197 2,787,367 2,838,736 2, ,987,127 Selling, marketing and distribution costs (479,559) (440,839) (2,092,992) (1,876,854) (1,884,399) (1, ) (1,388,750) Administrative costs (99,781) (88,190) (373,702) (403,059) (385,491) (317,937) (273,591) Other operating income, net 2,418 1,105 22,444 33,903 20,567 (25,564) 42,939 Operating result (37,242) (57,699) 384, , , , ,725 EBITDA 97,272 78, ,175 1,064,360 1,102, , ,398 * Audited In 2013, EBITDA was adjusted by one-off items: on the one hand impairment of goodwill, brands and fixed assets relating to Polish operations in a total amount of CZK 879 million and on the other hand profit from the significant disposal of fixed assets in the amount of CZK 19 million. In 2014, EBITDA was adjusted by one-off item relating to impairment of investment in associate in the amount of CZK 44 million. In 2015, EBITDA was adjusted by one-off items: qualitative product complaints in Hoop Poland connected with a poor quality of packaging material, the net impact on operating result is of CZK 103 million, CZK 70 million related to advisory costs related to acquisitions and restructuring project and positive effect of CZK 18 million related to court litigation against a competitor of the Group for protection against unfair competition and infringement of Kofola trademarks. In 2016, EBITDA was adjusted by one-off items: closure of Bielsk and reorganization costs (CZK 3 mil.), merger, acquisition and due diligence costs (CZK 47 mil.), income of CZK 29 mil. from insurance income connected with qualitative product complaints and release of provision for legal case, costs of WSE delisting (CZK 3 mil.), impairment costs in Polish operation CZK 70 mil. and CZK 126 mil. In Russian associate, assets impairments CZK 24 mil. In 2017, EBITDA was adjusted by one-off items: net operating income from the sale of warehouse (CZK 2.9 mil.), costs connected with SAP implementation (CZK 6.3 mil.), costs connected with the liquidation of an inactive subsidiary in Sicheldorfer (CZK 1.8 mil.), revenue from the sale of building (CZK 11.6 mil.), net operating income from the sale of production lines in Poland (CZK 37.8 mil.),costs connected with maintenance of Bielsk Podlaski plant and release of provision (CZK 3.9 mil.), costs connected with the closure of Grodzisk (CZK 43.8 mil.), net operating income from compensation and release of provision connected with prior years qualitative product complaints (CZK 41.6 mil.), impairment costs (CZK mil.), acquisition costs Czech operation incurred costs of CZK 14.5 mil. and costs of CZK 4.4 mil. connected with closing Na grilu operation in Ugo. 28
29 Consolidated statement of financial position ** CZK 000 CZK 000 CZK 000 CZK 000 CZK 000 CZK 000 CZK 000 Non-current assets 4,843,700 4,930,977 4,786,195 4,915,863 5,095,724 4,171,985 6,287,894 Current assets 1,935,599 2,922,661 1,792,673 3,104,020 3,395,290 1,787,877 1,734,245 Total assets 6,779,299 7,853,638 6,578,868 8,019,883 8,491,014 5,959,862 5,867,100 Equity attributable to owners of Kofola ČeskoSlovensko a.s. 1,890,386 2,722,714 1,977,670 2,736,572 2,810,188 2,569,449 2,515,253 Equity attributable to non-controlling interests (4,895) 1,864 (3,684) 2,896 49,233 7,380 4,971 Total equity 1,885,491 2,724,578 1,973,986 2,739,468 2,859,421 2,576,829 2,520,224 Non-current liabilities 2,358,667 1,546,481 1,855,652 1,580,357 1,750,669 1,029, ,258 Current liabilities 2,535,141 3,582,579 2,749,230 3,700,058 3,880,924 2,353,499 2,360,618 Total liabilities 4,893,808 5,129,060 4,604,882 5,280,415 5,631,593 3,383,033 3,346,876 Total liabilities and equity 6,779,299 7,853,638 6,578,868 8,019,883 8,491,014 5,959,862 5,867,100 Consolidated statement of cash flows 3M18 3M ** CZK 000 CZK 000 CZK 000 CZK 000 CZK 000 CZK 000 CZK 000 Net cash flow from operating activities (79,477) (185,789) 719, , , , ,880 Net cash flow from investing activities (178,611) (86,305) (468,963) (748,667) (1,136,775) (241,703) (194,908) Net cash flow from financing activities 181,894 25,957 (1,352,846) (420,418) 1,546,637 (352,204) (508,828) Cash and cash equivalents at the beginning of the period 289,594 1,421,014 1,421,014 1,940, , , ,192* Cash and cash equivalents at the end of the period 212,197 1,177, ,594 1,421,014 1,940, , ,669 * Including cash flow from deconsolidated companies as at 1 January 2013 (Megapack group), ** Restated. All periods audited 29
30 Reconciliation of reported and adjusted results Reported One-offs Adjusted CZK mil. CZK mil. CZK mil. Revenue Cost of sales (894.3) - (894.3) Gross profit Selling, marketing and distribution costs (479.6) - (479.6) Administrative costs (104.0) 4.3 (99.8) Other operating income/(expense), net Operating result (42.9) 5.7 (37.3) EBITDA Finance costs, net (27.5) - (27.5) Income tax (3.4) - (3.4) Profit for the period (73.7) 5.7 (68.1) - attributable to shareholders of the parent (72.5) 5.6 (66.8) One-offs: Net other operating income from the sale of production lines in Poland of CZK 4.6 mil. Costs connected with maintenance of closed plant Bielsk Podlaski plant of CZK 2.1 mil. (in Polish segment). Costs connected with maintenance of closed plant Grodzisk Wielkopolski plant and other restructuring costs of CZK 3.9 mil. (in Polish segment). Acquisition costs Czech operation incurred costs of CZK 4.3 mil. 30
31 Results comparison 4Q17 4Q16 +1Q18 +1Q17 Change Change CZK mil. CZK mil. CZK mil. % Revenue % Cost of sales ( ) ( ) (25.1) 1.4% Gross profit % Selling, marketing and distribution costs (959.0) (874.4) (84.6) 9.7% Administrative costs (187.9) (177.1) (10.8) 6.1% Other operating income, net % Operating result % EBITDA % Finance costs, net (42.9) (36.1) (6.8) 19.0% Income tax (52.7) (41.3) (11.4) 27.5% Profit for the period (52.6) (55.8) 3.2 (5.7%) - attributable to shareholders of the parent (48.9) (53.5) 4.6 (8.6%) Key products price increased Successful innovations launch (Royal Crown) Raw material (sugar) price positive development * adjusted for one-offs 31
32 Reconciliation of reported and adjusted results Reported One-offs Adjusted CZK mil. CZK mil. CZK mil. Revenue Cost of sales ( ) - ( ) Gross profit Selling, marketing and distribution costs ( ) 1.7 ( ) Administrative costs (395.8) 22.1 (373.7) Other operating income/(expense), net (47.0) Operating result EBITDA Finance costs, net (24.8) - (24.8) Income tax (114.7) (14.1) (128.8) Profit for the period attributable to shareholders of the parent One-offs: Net operating income from the sale of warehouse of CZK 2.9 mil. (in Slovenian segment). Costs connected with SAP implementation of CZK 6.3 mil. (in Slovenian segment). Costs connected with the liquidation of an inactive subsidiary in Sicheldorfer of CZK 1.8 mil. Revenue from the sale of building of CZK 11.6 mil. (in Slovenian segment). Net operating income from the sale of production lines in Poland of CZK 37.8 mil. Costs of CZK 3.9 mil. connected with maintenance of Bielsk Podlaski plant and release of provision (in Polish segment). Costs of CZK 43.8 mil. connected with the closure of Grodzisk (in Polish segment). Net operating income of CZK 41.6 mil. from compensation and release of provision connected with prior years qualitative product complaints (in Polish segment). Impairment costs of CZK mil. (in Polish segment). Acquisition costs Czech operation incurred costs of CZK 14.5 mil. Costs of CZK 4.4 mil. connected with closing Na grilu operation in Ugo. 32
33 Results comparison 12M17 12M16 Change Change CZK mil. CZK mil. CZK mil. % Revenue (35.7) (0.5%) Cost of sales ( ) ( ) 77.5 (1.8%) Gross profit % Selling, marketing and distribution costs ( ) ( ) (216.1) 11.5% Administrative costs (373.7) (403.1) 29.4 (7.3%) Other operating income, net (11.5) (33.8%) Operating result (156.4) (28.9%) EBITDA (114.2) (10.7%) Finance costs, net (24.8) (93.5) 68.7 (73.4%) Income tax (128.8) (105.8) (23.0) 21.8% Profit for the period (110.7) (32.4%) - attributable to shareholders of the parent (107.2) (31.1%) The Group s revenue without Poland increased by CZK 452 mil. (8.6%). * adjusted for one-offs Revenue decrease caused by lower sales in Poland that were partially offset by the increase in CzechoSlovakia from Rajec, Rauch, Semtex and mainly Vinea, increased sales in Ugo and increased sales in Slovenia and Croatia. Increase of gross profit net effect of increase in Adriatic, Ugo, Czechia and decrease in Poland and Slovakia. Gross profit margin increased by 0.8 p.p. from 39.83% in 2016 to 40.63% achieved in Selling costs increasing, influenced by increased costs of cca CZK 74 mil. in UGO (further expansion increased number of larger bars, increased marketing costs first TV campaign, increased salaries due to increased number of bars), also due to acquired Studenac and Premium Rosa subsidiaries effect of CZK 109 mil., by increased costs in CzechoSlovakia (increased logistic and marketing costs) which were partly compensated by lower costs in Poland. Decreased admin costs, driven by decreased admin costs in CzechoSlovakia (lower salaries due to unpaid bonuses a post-merger savings ). Increased financial result influenced by increased foreign exchange gains of cca CZK 39 mil., positive effect of revaluation derivatives of cca CZK 22 mil. and lower interest from loans. 33
34 (CZK m) Czech Republic Revenues increased by 3.3%, due to increased sales of Rauch, Rajec, Vinea and Semtex. UGO increased revenue by 39.2% Slovakia Revenues growing by 3.0%, keeping leading position in both Retail and HoReCa segment in terms of market share. Sales in our most profitable HoReCa and Impulse channels grew, Impulse by double digits. Increased sales of both Rauch and Kofola brands Poland Revenue decreased by 28.1%, mainly due to lower sales of private labels and brands in traditional channel. Adriatic region Adriatic segment shown increased revenue by 29.8%, also thanks to acquisition of Studenac growing sales of brand Radenska in Croatia (post-acquisition synergies). 34
35 Real GDP growth of between % is expected this year in CEE and Austria. Real GDP growth to be driven by solid domestic demand, as wage growth and declining unemployment support economic activity in CEE. Solid public finances across CEE. These are risks to the upside to our current GDP forecast as EU fund inflow is still relatively moderate and could surprise on the positive side. 4,5 Slovenia 5, Slovakia Romania Poland Hungary Czech Republic Croatia Austria 2,8 2,8 2,8 2,9 3,9 3,4 3,4 3,7 4,0 4,7 4,2 4,6 4,6 6, ,4 Slovenia 3, Slovakia Romania Poland Eurozone 2017: 2.0% 3,3 3,7 4,5 4,8 5,8 10, ,4-0,7 0,8 0,0 Maastricht criteria: -3.0% ,6 0,3 Austria Croatia Czech Republic ,0-0,3-1,0-1,0-1,7-2,1-2,5-2,5-3,0-3,4 Hungary Poland Romania Slovakia Slovenia Maastricht criteria: 60% Hungary Czech Republic Croatia 2,7 3,5 4,1 4 3,6 4, Austria 1,6 1,3 Source: Erste Group Research Austria Croatia Czech Republic Hungary Poland Romania Slovakia Slovenia 35
36 Source: Erste Group Research Real GDP growth (%) f 2018f 2019f Croatia Czech Republic Hungary Poland Romania Serbia Slovakia Slovenia CEE8 average Unemployment (%) f 2018f 2019f Croatia Czech Republic Hungary Poland Romania Serbia Slovakia Slovenia CEE8 average Private consumption (%) f 2018f 2019f Croatia Czech Republic Hungary Poland Romania Serbia Slovakia Slovenia CEE8 average Average inflation (%) f 2018f 2019f Croatia Czech Republic Hungary Poland Romania Serbia Slovakia Slovenia CEE8 average Public debt (%GDP) f 2018f 2019f Croatia Czech Republic Hungary Poland Romania Serbia Slovakia Slovenia CEE8 average Budget Balance (%GDP) f 2018f 2019f Croatia Czech Republic Hungary Poland Romania Serbia Slovakia Slovenia CEE8 average
One of the most significant producers of non-alcoholic beverages in CEE and SEE Revenues 6M18: 134.8M EBITDA 6M18: 17.2M. 8 production plants
 One of the most significant producers of non-alcoholic beverages in CEE and SEE Revenues 6M18: 134.8M EBITDA 6M18: 17.2M 8 production plants 2,184 employees countries for expansion EUR/CZK ex. rate: 25.500
One of the most significant producers of non-alcoholic beverages in CEE and SEE Revenues 3M18: 56.5M EBITDA 3M18: 3.8M. 8 production plants
 One of the most significant producers of non-alcoholic beverages in CEE and SEE Revenues 3M18: 56.5M EBITDA 3M18: 3.8M 8 production plants 2,182* employees countries for expansion EUR/CZK ex. rate: 25.402
One of the most significant producers of non-alcoholic beverages in Central and Eastern Europe. Revenues 12M17: 264M EBITDA 12M17: 36M
 One of the most significant producers of non-alcoholic beverages in Central and Eastern Europe Revenues 12M17: 264M EBITDA 12M17: 36M 7 production plants 2,182 employees end of production at the end of
One of the most significant producers of branded non-alcoholic beverages in Central and Eastern Europe. Revenues 9M17: 202M EBITDA 9M17: 27M
 One of the most significant producers of branded non-alcoholic beverages in Central and Eastern Europe Revenues 9M17: 202M EBITDA 9M17: 27M 7 production plants 2,150 employees end of production at the
Earnings per share... B-18 Property, plant and equipment... B-18 Intangible assets... B-18 Investment in associate... B-19 Dividends...
 A-0 A. BOARD OF DIRECTORS REPORT... A-0 1. 2. KOFOLA AT A GLANCE... A-3 KOFOLA GROUP... A-6 2.1. 2.2. Kofola ČeskoSlovensko... A-6 Kofola Group... A-6 2.3. 2.4. Group structure... A-7 Successes and Awards
LISTED ON PRAGUE STOCK EXCHANGE CZK 5.5 BN 9M18 REVENUES. a leading producer of branded non-alcoholic beverages in Central and Eastern Europe
 A-0 A. BOARD OF DIRECTORS REPORT... A-0 1. KOFOLA AT A GLANCE... A-3 2. KOFOLA GROUP... A-6 2.1. Kofola ČeskoSlovensko... A-6 2.2. Kofola Group... A-6 2.3. Group structure... A-7 3. BUSINESS OVERVIEW...
A-1. Consolidated annual report 2017 Table of contents
 A-0 A. BOARD OF DIRECTORS REPORT... A-0 1. 2. KOFOLA AT A GLANCE... A-4 CHAIRMAN S STATEMENT... A-7 3. KOFOLA GROUP... A-9 3.1. Kofola ČeskoSlovensko... A-9 3.2. 3.3. Kofola Group... A-9 Group structure...
LISTED ON PRAGUE STOCK EXCHANGE CZK 1.4 BN 3M18 REVENUES. a leading producer of branded non-alcoholic beverages in Central and Eastern Europe
 A-0 A. BOARD OF DIRECTORS REPORT... A-0 1. KOFOLA AT A GLANCE... A-3 2. KOFOLA GROUP... A-6 2.1. Kofola ČeskoSlovensko... A-6 2.2. Kofola Group... A-6 2.3. Group structure... A-7 2.4. Successes and Awards
A-1. Interim report for 9M 2016 Table of contents
 A-0 A. BOARD OF DIRECTORS REPORT... A-0 1. 2. KOFOLA AT A GLANCE... A-3 KOFOLA GROUP... A-5 2.1. 2.2. Kofola ČeskoSlovensko... A-5 Kofola Group... A-5 2.3. 2.4. Group structure... A-6 Successes and Awards
Kofola československo a.s. OF DIRECTORS REPORT A-0
 A. BOARD Kofola československo a.s. Interim report 3m 2017 OF DIRECTORS REPORT A-0 Table of contents A. BOARD OF DIRECTORS REPORT... A-0 KOFOLA AT A GLANCE... A-3 KOFOLA GROUP... A-5 2.1. Kofola ČeskoSlovensko...
A-1. Interim report for 1H 2016 Table of contents
 A-0 A. BOARD OF DIRECTORS REPORT... A-0 1. 2. KOFOLA AT A GLANCE... A-3 KOFOLA GROUP... A-5 2.1. 2.2. Kofola ČeskoSlovensko... A-5 Kofola Group... A-5 2.3. 2.4. Group structure... A-6 Successes and Awards
A-1. Interim report for 1Q 2016 Table of contents
 A-0 A. BOARD OF DIRECTORS REPORT... A-0 1. 2. KOFOLA AT A GLANCE... A-3 KOFOLA GROUP... A-5 2.1. 2.2. Kofola ČeskoSlovensko... A-5 Kofola Group... A-5 2.3. 2.4. Group structure... A-6 Successes and Awards
KOFOLA GROUP RESULTS IN 9M2014 Investor s Presentation 10 November 2014
 10 November 2014 INDEX Kofola Group in 9M2014 Summary of results and market conditions in 9M2014 Summary of results and market conditions in 3Q 2014 Markets, trends and strategy Profile and history of
prospectus 22,020,000 shares of Kofola ČeskoSlovensko a.s.
 prospectus 22,020,000 shares of Kofola ČeskoSlovensko a.s. a joint stock company (in Czech: akciová společnost) established and existing under the laws of the Czech Republic, having its registered office
THIS DOCUMENT IS A TRANSLATION. THE POLISH ORIGINAL SHOULD BE REFERRED TO IN MATTERS OF INTERPRETATION.
 THIS DOCUMENT IS A TRANSLATION. THE POLISH ORIGINAL SHOULD BE REFERRED TO IN MATTERS OF INTERPRETATION. half-year report kofola s.a. group I half-year 2011 kofo la s.a. Half-year report KOFOLA S.A. Group
KOFOLA GROUP RESULTS IN 9M 2013
 12 November 2013 INDEX KOFOLA Group in 9M 2013 Summary of results and market conditions in 9M 2013 Summary of results and market conditions in 3Q 2013 Markets, trends and strategy Profile and history of
Full-year results for the year ended 31 December Dimitris Lois CEO Michalis Imellos - CFO
 Full-year results for the year ended 31 December 2012 Dimitris Lois CEO Michalis Imellos - CFO Disclaimer The information contained herein includes forward-looking statements which are based on current
THIS DOCUMENT IS A TRANSLATION. THE POLISH ORIGINAL SHOULD BE REFERRED TO IN MATTERS OF INTERPRETATION.
 THIS DOCUMENT IS A TRANSLATION. THE POLISH ORIGINAL SHOULD BE REFERRED TO IN MATTERS OF INTERPRETATION. QUARTERLY REPORT of the Kofola S.A. group for the III rd quarter 2012 TABLE OF CONTENTS 2 1. THE
IFRS Results for the three months ended 2 April Results Presentation 29 April 2010
 IFRS Results for the three months ended 2 April 2010 Results Presentation 29 April 2010 1 Disclaimer The information contained herein includes forward-looking statements which are based on current expectations
Coca-Cola HBC at a glance
 Disclaimer 2 Unless otherwise indicated, the condensed consolidated financial statements and the financial and operating data or other information included herein relate to Coca-Cola HBC AG and its subsidiaries
> Central and Eastern Europe A journey through Erste Bank s home market
 > Central and Eastern Europe > 4 th Capital Markets Day > Bucharest, > Reinhard Ortner, CFO, Erste Bank > Disclaimer Cautionary note regarding forward-looking statements THE INFORMATION CONTAINED IN THIS
IFRS Results for the year ended 31 December Results Presentation 9 February 2011
 IFRS Results for the year ended 31 December 2010 Results Presentation 9 February 2011 1 Disclaimer The information contained herein includes forward-looking statements which are based on current expectations
B U I L D I N G P A R T N E R S H I P S F O R E N E R G Y S E C U R I T Y
 "INOGATE Technical Secretariat & Integrated Programme in support of the Baku Initiative and the Eastern Partnership energy objectives" Project B U I L D I N G P A R T N E R S H I P S F O R E N E R G Y
1. OPENING STATEMENT OF FINANCIAL POSITION... A-2
 A-0 A. OPENING STATEMENT OF FINANCIAL POSITION... A-0 1. OPENING STATEMENT OF FINANCIAL POSITION... A-2 1.1. Opening statement of financial position... A-2 2. BASIS OF PREPARATION... A-3 2.1. Merger description...
PODRAVKA GROUP BUSINESS RESULTS FOR THE PERIOD JANUARY SEPTEMBER 2009
 PODRAVKA GROUP BUSINESS RESULTS FOR THE PERIOD JANUARY SEPTEMBER 2009 Main business characteristics 1. The total sales of the Podravka Group in the first nine months of 2009 totalled HRK 2,663.5 million
Podravka Group business results. for period
 Podravka Group business results for 1-12 2014 period 1 12 2014 Significant events SBA Food and Drinks SBA Pharmaceuticals Financial statements Share Significant events in 2014 Decision of Croatian Health
Erste Bank Investor Conference June 2008, Cavtat
 Erste Bank Investor Conference 19-20, Cavtat Content Overview Sales Business results Share performances Strategy 2008-2011 Overview SAD One of the largest branded food companies in the region - large brand
June 3 rd 2015, Koprivnica, Croatia. Podravka Inc. General Assembly
 June 3 rd 2015, Koprivnica, Croatia Podravka Inc. General Assembly Key highlights of 2014 SBA Food and Drinks in 2014 SBA Pharmaceuticals in 2014 Financial reports in 2014 Short overview of 1-3 2015 Significant
Doros Constantinou Chief Executive Officer. 12th Annual Capital Link Forum 2 December 2010, New York
 Doros Constantinou Chief Executive Officer 12th Annual Capital Link Forum 2 December 2010, New York Disclaimer The information contained herein includes forward-looking statements which are based on current
> Erste Bank - A Financial Franchise in Central Europe
 > Erste Bank - A Financial Franchise in Central Europe > > > Andreas Treichl, CEO > Presentation topics 1. Erste Bank Where we are now 2. Why did we move eastwards? 3. Outlook and targets 4. Appendix 2
B U I L D I N G P A R T N E R S H I P S F O R E N E R G Y S E C U R I T Y
 "INOGATE Technical Secretariat & Integrated Programme in support of the Baku Initiative and the Eastern Partnership energy objectives" Project B U I L D I N G P A R T N E R S H I P S F O R E N E R G Y
Retail Banking - Building a Growth Machine. By Aris Bogdaneris Board Member RI Group. The Current Environment. Slide 1. Slide 2
 Retail Banking Building a Growth Machine By Aris Bogdaneris Board Member RI Group Slide 1 Capital Markets Day, September 2008 The Current Environment Slide 2 Capital Markets Day, September 2008 Investor
MINUTES OF THE ORDINARY GENERAL MEETING HELD ON 18/05/2018, IN THE REGISTERED OFFICE OF THE COMPANY AT THE ADDRESS OF NAD PORUBKOU
 Kofola ČeskoSlovensko a.s. Identification number: 242 61 980 Registered office: Nad Porubkou 2278/31a, Poruba, 708 00 Ostrava Registered in Commercial Register maintained by the Regional Court in Ostrava,
Strong momentum continues
 Armenia, Austria, Belarus, Bosnia & Herzegovina, Bulgaria, Croatia, Czech Republic, Estonia FYROM, Greece, Hungary, Ireland, Italy, Latvia, Lithuania, Moldova, Nigeria, Northern Ireland, Poland, Romania,
> Erste Bank strategies implemented. > Q Results Roadshow November 2003
 > Erste Bank strategies implemented > > Q3 2003 Financial highlights ErsteBank Group - Key ratios» ROE 13.4% up from 12.7% at YE 2002 (13.1% in H1 03)» Based on a 57.8% increase in net profit to EUR 255.1m»
Vienna Insurance Group Investor Presentation
 Vienna Insurance Group Investor Presentation Zürs, 29 March 2017 Agenda 2020 12M 2016 Preliminary results Please note: All information for the financial year 2016 is based on preliminary unaudited data.
WHAT UNITES US? CONFIDENCE IN THE FUTURE
 WHAT UNITES US? CONFIDENCE IN THE FUTURE Press Conference Vienna Insurance Group Annual result 2013 Vienna, 10 th April 2014 With Moldova last country to be covered in CEE Acquisition of Donaris completed
Vienna Insurance Group Focused on Growth in CEE and Austria. CA-IB Emerging Europe Conference, 19/20 March, 2007
 Vienna Insurance Group Focused on Growth in CEE and Austria CA-IB Emerging Europe Conference, 19/20 March, 2007 Vienna Insurance Group Focused on Growth in CEE and Austria 2 Leading Austrian insurance
> Erste Bank Integrating new markets
 > Erste Bank Integrating new markets > > Teleconference Vienna, > Andreas Treichl, CEO Reinhard Ortner, CFO > Disclaimer Cautionary note regarding forward-looking statements THE INFORMATION CONTAINED IN
BEING THERE QUARTERLY REPORT FEBRUARY TO OCTOBER 2018
 BEING THERE QUARTERLY REPORT FEBRUARY TO OCTOBER 2018 WE DELIVER HEALTH. EACH AND EVERY DAY. ACROSS EUROPE. The PHOENIX group is a leading pharmaceutical trader in Europe, reliably supplying people with
Harmonised Index of Consumer Prices (HICP) August 2015
 August 2015") Aug-14 Sep-14 Oct-14 Nov-14 Dec-14 Jan-15 Feb-15 Mar-15 Apr-15 May-15 Jun-15 MONTENEGRO STATISTICAL OFFICE R E L E A S E Broj: 201 Podgorica, 18 September 2015 When using the data please name the source
Aug-14 Sep-14 Oct-14 Nov-14 Dec-14 Jan-15 Feb-15 Mar-15 Apr-15 May-15 Jun-15 MONTENEGRO STATISTICAL OFFICE R E L E A S E Broj: 201 Podgorica, 18 September 2015 When using the data please name the source
Fortuna Entertainment Group NV
 Fortuna Entertainment Group NV H1 2012 Financial Results August 29, 2012 Agenda Introduction Radim Haluza, CEO H1 2012 Financial Results Michal Vepřek, CFO Q&A Wilf Walsh, Chairman of the Management Board
Six months Financial Report of the Coca-Cola Hellenic Bottling Company S.A.
 Six months Financial Report of the Coca-Cola Hellenic Bottling Company S.A. 27 June 2008 Index 1. Statement pursuant to article 5 of Law 3556/2007 2. Board of Directors Report for the period ended 27 June
BANKING IN CEE: adequate risk appetite crucial to win the upside
 BANKING IN CEE: adequate risk appetite crucial to win the upside UniCredit Group CEE Strategic Analysis Vienna, November 9, 2009 Executive Summary 1 World economic growth is recovering and this boosts
H Financial Results
 H1 217 Financial Results Analyst Conference Call 31 st August 217 fortunagroup.eu FORTUNA ENTERTAINMENT GROUP N.V. Agenda 1 Introduction 4 217 Outlook & Guidance Update 2 H1 217 Key Highlights 3 H1 217
CONTENT. 01 Highlights. 02 Portfolio Performance. 03 Optimisation of Financing Structure. 04 FY 2017 Results. 05 Outlook FY
 CONTENT 01 Highlights 02 Portfolio Performance 03 Optimisation of Financing Structure 04 FY 2017 Results 05 Outlook FY 2017 2 IMMOFINANZ RESTRUCTURING 5/2015 12/2017 Sale of logistics asset class - focus
VIENNA INSURANCE GROUP
 Investor Presentation Results for the first quarter 2018 THE LEADING INSURANCE GROUP IN AUSTRIA & CEE Close to 200 years of experience Around 50 Group companies Represented in 25 markets More than 50%
RESULTS FOR THE NINE MONTHS ENDED 26 SEPTEMBER 2008 (IFRS)
") RESULTS FOR THE NINE MONTHS ENDED 26 SEPTEMBER 2008 (IFRS) HIGHLIGHTS FOR THE NINE MONTHS Volume of 1,623 million unit cases, 4% above 2007. Net sales revenue rose to 5,389 million, 8% above 2007. Operating
RESULTS FOR THE NINE MONTHS ENDED 26 SEPTEMBER 2008 (IFRS) HIGHLIGHTS FOR THE NINE MONTHS Volume of 1,623 million unit cases, 4% above 2007. Net sales revenue rose to 5,389 million, 8% above 2007. Operating
Erste Group results presentation 30 October 2008 ERSTE GROUP
 Erste Group 1-9 08 results presentation 30 October 2008 1-9 08 financial highlights Operating profit 1 continued to show healthy growth - up 23.2% in 1-9 08 Based on a solid performance of the regional
Podravka Group business results. for period
 Podravka Group business results for -9 206 period Key highlights of -9 206 Food Solution new business segment: Food Solution implies a completely new gastro segment in which, in addition to products, customers
Vienna Insurance Group right on track in the first half of 2018 Clear improvement in all key figures
 Vienna Insurance Group right on track in the first half of 2018 Clear improvement in all key figures No. 24/2018 28 August 2018 Premiums rise by +3.6 percent to around EUR 5.2 billion Result (before taxes)
December 13, 2011 slide 1
 AGRANA Beteiligungs-AG g Austria Day in Frankfurt HSBC Vienna Stock Exchange December 13, 2011 (Presenter: CFO Walter Grausam) December 13, 2011 slide 1 Content Introduction & business overview Key financials
3M 2014 Results Presentation
 3M 2014 Results Presentation Conference call for the results of the first quarter 2014 Vienna, 27 May 2014 Presenting team and topics Presenting team Martin Simhandl, CFO Peter Höfinger, Member of the
Raiffeisen Bank International Investor Presentation
 Raiffeisen Bank International Investor Presentation Disclaimer Certain statements contained herein may be statements of future expectations and other forward-looking statements about Raiffeisen Bank International
Nilfisk Q3 Interim Report 2018 Webcast presentation November 14, 2018
 Nilfisk Q3 Interim Report 2018 Webcast presentation November 14, 2018 Agenda 1 2 3 4 5 Highlights Business unit update Simplifications initiatives Financials Outlook 2018 6 Q&A 2 Q3 2018 results Financial
Erste Group Bank AG Annual results 2012
 Erste Group Bank AG Annual results 2012 Andreas Treichl, Chief Executive Officer Manfred Wimmer, Chief Financial Officer Gernot Mittendorfer, Chief Risk Officer Presentation topics Erste Group s development
Strategy and Positioning in Emerging Europe Gerhard Randa Member of the Board of Managing Directors. Berlin, September 16, 2003
 Strategy and Positioning in Emerging Europe Gerhard Randa Member of the Board of Managing Directors Berlin, September 16, 2003 Sustained financial turnaround and consistent execution of 2003 transformation
UniCredit International Investors Conference January 2008, Kitzbühel
 UniCredit International Investors Conference 20-22 January 2008, Kitzbühel Operating in a challenging environment Gabriele Werzer, Head of IR, Erste Group Disclaimer Cautionary note regarding forward-looking
Second Quarter 2018 Results. August 8, 2018
 August 8, 2018 Q2 Highlights Frans Muller President and CEO Highlights Second quarter 2018 A solid quarter with sales growth and higher margins, impacted by Easter Strong growth of earnings and free cash
RESULTS FOR THE SIX MONTHS ENDED 27 JUNE 2008 (IFRS)
") RESULTS FOR THE SIX MONTHS ENDED 27 JUNE 2008 (IFRS) HALF YEAR HIGHLIGHTS Volume of 1,014 million unit cases, 5% above 2007. Net revenue rose to 3,314 million, 7% above 2007. Operating profit (EBIT) of
RESULTS FOR THE SIX MONTHS ENDED 27 JUNE 2008 (IFRS) HALF YEAR HIGHLIGHTS Volume of 1,014 million unit cases, 5% above 2007. Net revenue rose to 3,314 million, 7% above 2007. Operating profit (EBIT) of
1H 2018 Results Presentation
 1H 2018 Results Presentation Agenda of the presentation 1. Executive Summary 2. Summary of Eurocash parts (segments) 3. Market overview 4. Eurocash Financials 2 1. Executive summary WHOLESALE - STRONG
London Roadshow February Doros Constantinou,, CEO Nik Jhangiani, CFO
 London Roadshow 26-27 February 2008 Doros Constantinou,, CEO Nik Jhangiani, CFO Disclaimer The information contained herein includes forward-looking statements which are based on current expectations and
VIENNA INSURANCE GROUP
 Investor Presentation Full-year results 2017 THE LEADING INSURANCE GROUP IN AUSTRIA & CEE Close to 200 years of experience Around 50 Group companies Represented in 25 markets More than 55% of premiums
METRO QUARTERLY STATEMENT 9M/Q3 2017/18
 CONTENT 2 Overview 4 Sales, earnings and financial position 5 Earnings position of the sales lines 5 8 Real 9 Others 10 Outlook 11 Store network 12 Income statement 13 Balance sheet 15 Cash flow statement
Results presentation Full-year 2017
 Results presentation Full-year 2017 14 February 2018 UNDERSTAND EVOLVE ENERGISE Forward-looking statements Unless otherwise indicated, the condensed consolidated interim financial statements and the financial
First Quarter 2018 Results. May 9, 2018
 May 9, 2018 Q1 Highlights Dick Boer President and CEO Highlights Q1 2018 Another strong quarter with operating income up 10.5%* Net sales of 14.9 billion, up 2.5% at constant exchange rates Net consumer
Preliminary Financial Results 2016
 Preliminary Financial Results 2016 Analyst Conference call 9th March 2017 FORTUNA ENTERTAINMENT GROUP N.V. Agenda 1 Introduction 4 Acquisition of Hattrick 2 3 2016 Key Highlights 2016 Financial Results
Fortuna Entertainment Group NV. 9M Interim Results Announcement Analyst presentation November 10, 2010
 Fortuna Entertainment Group NV 9M Interim Results Announcement Analyst presentation November 10, 2010 Disclaimer. This document has been prepared by Fortuna Entertainment Group N.V:. (the Company ) solely
Erste Group Bank AG H results presentation 30 July 2010, Vienna
 Erste Group Bank AG H1 2010 results presentation, Vienna Andreas Treichl, Chief Executive Officer Manfred Wimmer, Chief Financial Officer Bernhard Spalt, Chief Risk Officer Erste Group business snapshot
SABMiller plc. Full year results Twelve months ended 31 March Graham Mackay, Chief Executive Jamie Wilson, Chief Financial Officer.
 SABMiller plc Full year results Twelve months ended 31 March 2012 Graham Mackay, Chief Executive Jamie Wilson, Chief Financial Officer 24 May 2012 Forward looking statements This presentation includes
Slovakia: Eurozone country with high growth potential
 Erste Group 8 th Capital Markets Day, Jozef Síkela, CEO, Slovenská sporiteľňa Disclaimer Cautionary note regarding forward-looking statements THE INFORMATION CONTAINED IN THIS DOCUMENT HAS NOT BEEN INDEPENDENTLY
CCH 2017 Half-year results Conference call script 10 August 2017
 C O R P O R A T E P A R T I C I P A N T S Dimitris Lois - Coca-Cola HBC AG CEO Michalis Imellos - Coca-Cola HBC AG CFO Basak Kotler - Coca-Cola HBC AG - IR Director Operator Thank you for standing by ladies
Results presentation Half-year August 2017
 Results presentation Half-year 2017 10 August 2017 Forward-looking statements Unless otherwise indicated, the condensed consolidated interim financial statements and the financial and operating data or
BANKING IN CEE. Carlo Vivaldi CFO UniCredit Bank Austria
 BANKING IN CEE Carlo Vivaldi CFO UniCredit Bank Austria Brussels, November 10, 2009 EU Parliament Committee on the Financial, Economic and Social Crisis Executive Summary Macroeconomic and Global Banking
BEING THERE HALF-YEAR REPORT FEBRUARY TO JULY 2018
 BEING THERE HALF-YEAR REPORT FEBRUARY TO JULY 2018 WE DELIVER HEALTH. EACH AND EVERY DAY. ACROSS EUROPE. The PHOENIX group is a leading pharmaceutical trader in Europe, reliably supplying people with drugs
6 th Capital Markets Day 12 December 2008, Vienna
 , Vienna An in-depth look at assets and asset quality Bernhard Spalt, Chief Risk Officer Presentation topics Analysing customer loans Overview CEE loan book in detail Real estate loans in detail Non-performing
General Assembly June 15 th, 2016
 General Assembly June 15 th, 2016 1 Content Macroeconomic environment Adris transformation Business segments Tourism Healthy food Insurance Shareholders view 2 Croatia is the biggest loser of current recession.
Fact Sheet Fourth Quarter 2016
 Profile Banca Comerciala Romana (BCR) was established in 1990 taking over the commercial banking operations of the National Bank of Romania. Today, BCR is the most important financial group in Romania,
CCH 2016 Full-year results Conference call script 16 February 2017
 C O R P O R A T E P A R T I C I P A N T S Dimitris Lois - Coca-Cola HBC AG CEO Michalis Imellos - Coca-Cola HBC AG CFO Basak Kotler - Coca-Cola HBC AG - IR Director Operator Thank you for standing by ladies
Press talk. Development Vienna Insurance Group FY Wien, 29. März 2012
 1 Press talk Development Vienna Insurance Group FY 2011 Wien, 29. März 2012 Development FY2011 Excellent development in difficult economic environment Best result in company history 8.9 bn. Euro premium
UNIQA Group Austria Highlights First Nine Months 2006
 UNIQA Group Austria Highlights First Nine Months 2006 Hannes Bogner, CFO Roadshow Geneva, Frankfurt December 5 & 6, 2006 p. 2 Shareholder Structure UNIQA Versicherungen AG Raiffeisen Banking Group 38,91%
> Erste Bank. on course for full year targets. > Q Results Roadshow. > November 2004
 > Erste Bank on course for full year targets > > > Table of Contents Hosts Presentation Appendix Andreas Treichl, CEO Reinhard Ortner, CFO Jack Stack, CEO of Ceska sporitelna Gabriele Werzer, Head of IR
Banking Market Overview
 Banking Market Overview CEE and Romania 1. 1.1. Executive Summary Central and Eastern Europe (CEE)1 banking market overview Similar to 2009, in 2010 as well, the total CEE banking assets had a general
Podravka Group. European Midcap Event. 3 4 March 2008, Frankfurt. Podravka Group. Investor Relations
 European Midcap Event 3 4, Frankfurt Content Overview Sales Business results Costs/ Expenses Information for shareholders Restructuring strategy 2008-2011 Overview , the overview One of the largest branded
Alma Media Q4 and FY2014. Kai Telanne, President and CEO Juha Nuutinen, CFO 13 February 2015
 Alma Media Q4 and FY2014 Kai Telanne, President and CEO Juha Nuutinen, CFO 13 February 2015 Agenda Highlights Market development Financial development Dividend proposal Strategy and outlook Q & A 2 Q4/2014
 Deutsche Telekom: Deutsche Telekom brings the 2010 financial year to a successful c... Page 1 of 11 Media > Press releases > Company Print with big images Print Deutsche Telekom brings the 2010 financial
Erste Group posts net profit of EUR million in H1 17. Press conference 4 August Page 1
 Erste Group posts net profit of EUR 624.7 million in H1 17 Press conference 4 August 2017 Page 1 Business environment Central and Eastern Europe is the fastest growing EU region 2017 2018 Real GDP growth
INVESTOR INFORMATION. Erste Bank increases earnings by 30% to EUR 932 million in Vienna, 28 February 2007 FINANCIAL HIGHLIGHTS 1 :
 INVESTOR INFORMATION Vienna, 28 February 2007 Erste Bank increases earnings by 30% to EUR 932 million in 2006 FINANCIAL HIGHLIGHTS 1 : Net interest income* rose by 14.1% from EUR 2,794.2 million to EUR
Results for the First Quarter Vienna, 10 May 2012
 Results for the First Quarter 2012 Vienna, 10 May 2012 1 Cautionary Statement This presentation contains certain forward-looking statements. Actual results may differ materially from those projected or
Expanding our presence in Central Europe. Jorge da Motta Regional President, Central Europe
 Expanding our presence in Central Europe Jorge da Motta Regional President, Central Europe Caution on Forward-Looking Statements Today s presentations contain forward-looking statements. These statements
UK- US Roadshow Presentation. February 2013
 UK- US Roadshow Presentation February 2013 1 Disclaimer Disclaimer This document is an advertisement and not a prospectus and investors should not subscribe for or purchase any transferable securities
General Assembly
 General Assembly 14.06.2017 Contents Macroeconomic environment Operation by segments Company s strategic restructuring Tourism Health Food Insurance Adris grupa 1 The second straight year with a growth
Fifth consecutive year of strong growth
 Armenia, Austria, Belarus, Bosnia & Herzegovina, Bulgaria, Croatia, Czech Republic, Estonia FYROM, Greece, Hungary, Ireland, Italy, Latvia, Lithuania, Moldova, Nigeria, Northern Ireland, Poland, Romania,
25 th Annual General Meeting Erste Group Bank AG
 25 th Annual General Meeting Erste Group Bank AG 24 May 2018 Wiener Stadthalle Friedrich Rödler Chairman of the supervisory board First item on the agenda Report on the financial year 2017 3 Report on
CCH 2018 Half-year financial results Conference call script 9 August 2018
 C O R P O R A T E P A R T I C I P A N T S Zoran Bogdanovic Coca-Cola HBC AG - CEO Michalis Imellos - Coca-Cola HBC AG CFO Basak Kotler - Coca-Cola HBC AG - IR Director Operator Thank you for standing by
Results for the Six Months Ended July 1, 2005 (US GAAP)
") Armenia, Austria, Belarus, Bosnia & Herzegovina, Bulgaria, Croatia, Czech Republic, Estonia FYROM, Greece, Hungary, Ireland, Italy, Latvia, Lithuania, Moldova, Nigeria, Northern Ireland, Poland, Romania,
Armenia, Austria, Belarus, Bosnia & Herzegovina, Bulgaria, Croatia, Czech Republic, Estonia FYROM, Greece, Hungary, Ireland, Italy, Latvia, Lithuania, Moldova, Nigeria, Northern Ireland, Poland, Romania,
Dr Pepper Snapple Group Overview
 Dr Pepper Snapple Group Overview Contact Information: Investor Relations Heather Catelotti (972) 673-5869 heather.catelotti@dpsg.com Media Relations Chris Barnes (972) 673-5539 chris.barnes@dpsg.com Important
Presentation of the Gorenje Group.
 Presentation of the Gorenje Group 1 One of Leading European Manufacturers of Products for Home 2 CORE BUSINESS Products and services for home (MDA, SDA) NUMBER OF EMPLOYEES 11,000 CONSOLIDATED REVENUE
Avery Dennison Jefferies Industrials Conference
 Avery Dennison Jefferies Industrials Conference August 9, 2016 Anne Bramman SVP and Chief Financial Officer 1 Avery Dennison Investor Presentation Forward-Looking Statements Certain statements contained
General Assembly June 27 th, 2018
 General Assembly June 27 th, 2018 Contents Macroeconomic Environment Business Units Tourism Health Food Insurance Adris grupa 1 Inefficiency of the labor market and of the institutions as well as low innovation