An Egyptian Exporter. 2Q 2011 Results Presentation September 2011
|
|
|
- Abel Short
- 5 years ago
- Views:
Transcription

1 An Egyptian Exporter 2Q 2011 Results Presentation September 2011

2 Corporate Summary
3 Introduction: An Egyptian exporter Lecico Egypt S.A.E. is one of the world s largest sanitary ware producers and a large tiles producer Lecico was founded in 1959 and has been majority owned by the Gargour family since 1969 The company has a global competitive advantage making European quality sanitary ware at Egyptian costs The company is a significant exporter with c45% of Lecico s sanitary ware sales volume going into Europe Lecico finished major capacity expansions in tile and sanitary ware in 2007 which boosted capacity to 21.4m sqm of tiles and 6.7m pieces of sanitary ware and fire clay In Summer 2010, Lecico began brassware production with a 300,000 piece per annum capacity factory In Summer 2011, Lecico began production in its new tile factory in Borg El Arab. The factory is expected to reach 17m sqm capacity over the coming 4 years Split of domestic and export 1 Egypt (41%) Lebanon (11%) Export (48%) Split of sanitary ware and tiles 1 Sanitary ware (56%) Tiles (44%) Brassware (0%) Vitry Le Francois Established 1894 Fire Clay Sanitary capacity: 90,000 pcs 2006 Borg El-Arab Established 1997 Sanitary ware capacity 2.0 million pcs million pcs end 2007 Tiles capacity 8.5 million m 2 mid 2011 (est) 14.9 million m 2 mid 2013 (est) 17.0 million m 2 mid 2015 (est) Brassware capacity 0.3 million pcs mid 2010 Kfarchima * All production facilities are owned and controlled by Lecico Established 1959 Sanitary ware capacity: 350,000 pcs 2007 Tiles capacity 1.1 million m Borg El-Arab Khorshid Alexandria Khorshid Cairo Kfarchima Beirut Established 1975 Sanitary ware capacity 2.5 million pcs million pcs (inc FC) end 2008 Tiles capacity 17.0 million m million m 2 mid Note: (1) FY

4 Corporate Profile
 10%+ UK, France & Ireland mkt share USD 13.")
5 Investment case Experience Regional leadership Growing exports Significant cost advantage Brand with over 50 years of history Multi-national management Decades of OEM exports to Europe Sanitary ware market leader in Egypt and Lebanon Largest producer in the Middle East c 58% of sanitary ware is exported SW exports 9% CAGR ( ) 10%+ UK, France & Ireland mkt share USD 13.80/piece cost (40% of peers) c USD 1.50/piece shipping to Europe European quality product Aggressive expansion program Tile capacity more than doubled and sanitary ware capacity grew 49% since 2000 Substantial further tile capacity expansion underway Strong historic growth record Supplier for key European brands 18% Revenue CAGR ( ) 20% Net Profit CAGR Export-led growth 5
6 Domestic market leadership Market leadership in Egypt Sanitary ware market (5.8 million pieces) 1 Tile market (80 million m 2 ) 2 5% 6% 7% 16% 9% 14% 8% 34% Lecico Aracemco Cleopatra Gravena Pharaos Ideal Stnd Duravit Other Leading sanitary ware market share 2.0m piece Lecico capacity expansion ongoing 6% 23% 25% Cleopatra 10% 17% 19% Pharaos Lecico Al Amir Gemma Others Competitive pricing to support distributors sanitary ware sales 4.4 m sqm Lecico capacity expansion ongoing Note: (1) Management estimates for 2009 Note: (2) Management estimates for 2005 Market leadership in Lebanon Sanitary ware market (0.58 million pcs) 3 Tile market (8.5 million m 2 ) 3 36% Lecico Imports Leading sanitary ware market share Branded as European quality 24% Lecico Imports Number two market share in tile sales Presence maintained to complement sanitary ware sales 64% 76% Note: (3) Management estimates for
7 Growing exports Growth in group s exports Lecico s total export volumes (sanitary ware) Pieces (000) Exports/total 4,000 80% 3,000 51% 56% 59% 62% 65% 58% 60% 58% 50% 46% 42% 60% 2,000 40% 1,000 20% 1,229 1,240 1,431 1,982 2,389 2,267 2,884 3,638 3,063 3,364 2, % Sanitary ware export volumes Percent of total volume Sanitary ware export volumes grew at 9% CAGR ( ) Egypt s leading sanitary ware exporter Lecico exports c60% of its sales vs. 20% for local peers Lecico sells to over 50 countries (including OEM sales) Approximately 30% of exports (17% of sanitary ware sales) are for other brands Lecico represents over 50% of Egypt s sanitary ware exports with the balance split among 9 manufacturers 2010 Volumes fell due to warehouse fire, UK slowdown and repositioning France Export focus on Europe Europe as percentages of total exports Growth of Lecico brand sanitary ware market share in UK Pieces (000) Europe/exports 3,000 81% 79% 82% 84% 80% 81% 76% 81% 81% 100% 76% 80% 2,000 60% 1,000 40% 1,009 1,133 1,622 1,998 1,819 2,336 2,782 2,481 2, % 0 0% European sales volumes Europe/total exports (%) % 5.4% 6.1% 6.7% 6.6% 6.6% 7.4% 8.0% 8.5% 11.3% 10.9% Number of pieces sold (000 pcs) UK market share (%) 12.0% 10.0% 8.0% 6.0% 4.0% 2.0% 0.0% Average of over 80% of exports are to Western Europe 2011 should see improvement on new markets and OEM 7 UK estimated c11% market share in Lecico-branded sales A further c14% market share in OEM sales to the UK
8 Significant cost advantage International cost advantage Lecico produces sanitary ware at an all-in average cost of US$14.90/piece In Egypt, ceramic manufacturing cost averages US$13.80/piece of sanitary ware The difference reflects higher packing costs for EU-destined exports and significantly higher industrial cost in Lebanon Our information suggests other low cost producers manufacturing cost averages US$15-30 / piece While European producers average US$35+ / piece depending on their market Why is Lecico able to produce so cheaply? Egypt: Low energy costs, low labour cost, low investment costs, low effective taxes Size: Economies of scale, standard global plant size: 1m pieces Experience: Over 45 years as a company and almost 40 years as a sanitary ware producer Utilization: 85-90% capacity utilization rate versus 70% industry average in Egypt Efficiency: Production per employee is over twice that of our local competitors Investment, distribution and overheads benefit from regional economies of scale Sanitary ware investment cost approx US$20-30 / piece vs. US$25-40 / piece global standard Low shipping cost to Europe: US$1.50 per sanitary ware piece vs. approx US$6+ for Asian manufactures 8

9 Growth strategy


10 Long-term commercial strategy Expand regional and international exports Aim to increase market growth UK, Ireland, France Potential future markets Germany, Italy, Algeria, Saudi Arabia, Iraq, Syria, Poland New and expanded OEM contracts Sanitec, Heritage, SFA and others Build multi-brand and service options solutions for customers Local service options in key markets (stock, delivery, tailor-made NPD) International manufacturing options: direct container delivery at competitive pricing Dual brand + strategy: European brands (Sarreguemines), Commercial brand (Lecico) and OEM Commercial strategy: Offer more for less Strategy based on giving all the benefits of European supplier at best prices Consistent and dependable world-class quality, service, manufacturing and design Advantages over European peers: Greater flexibility as a partner at better prices 10

11 Financial overview


12 Profit and loss Net sales Cost of sales breakdown (1H 11) EBIT Net Profit 12


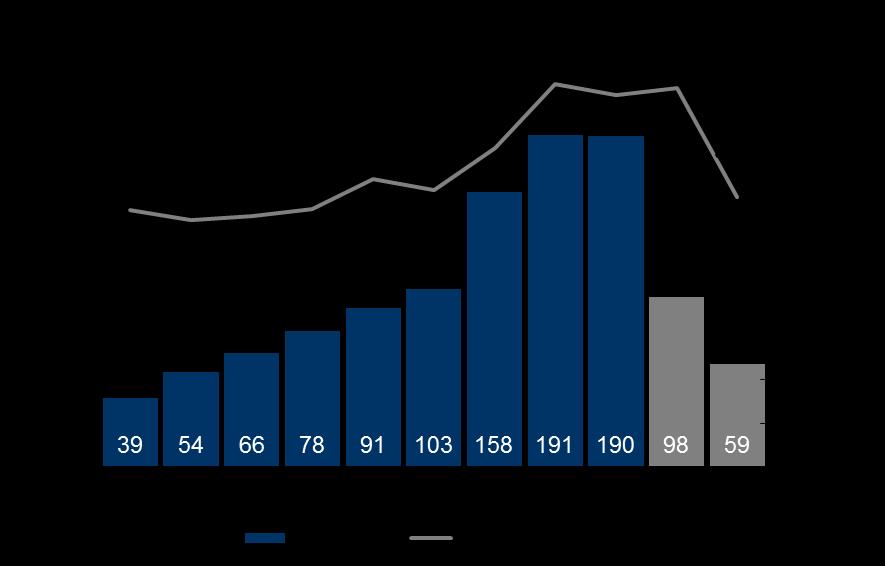
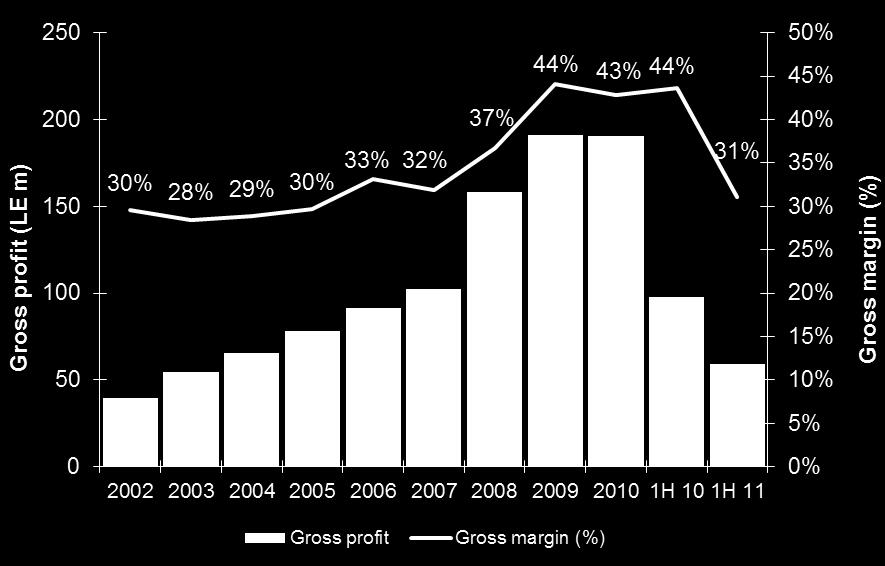
13 Quarterly P&L Trends Net sales Gross profit EBIT Net Profit 13


14 Segmental analysis Sanitary ware sales volumes and revenue Sanitary ware selling price and cost per piece Sanitary ware gross profit and margin Tiles sales volumes and revenues Tiles selling price and cost per sqm Tiles gross profit and margin 14


15 Quarterly Segmental trends Sanitary ware average price, cost and profit per piece Sanitary ware sales volume Tile Average Price, Cost and Profit per sqm Tile sales volume 15
 2011e Maintenance work")

16 Balance sheet and cash flow Working capital Returns and leverage Capital expenditures 2011e Project Investment cost (LE m) 2011e Maintenance work 30.0 Gres Porcellanato Tile plant phase Casting shop expansions 30.0 Frit and Brassware 2.0 Total planned specific project capex
17 P&L summary 2Q 2011 Income statement 2Q % 1H % (LE m) / /10 Net sales % % Cost of sales (176.7) (164.6) 107% (321.9) (340.6) 95% Gross profit % % Gross margin (%) 29.2% 35.6% (6.4%) 30.8% 35.1% (4.3%) Distribution and administrative expenses (42.6) (41.3) 103% (81.7) (85.8) 95% Net other operating income (1.2) (2.7) (0.7) - Operating profit (EBIT) % % Operating (EBIT) margin (%) 11.7% 19.8% (8.1%) 12.6% 18.7% (6.1%) Investment revenues Finance income % % Finance expense (16.7) (17.3) 97% (28.2) (29.9) 94% Profits before tax and minority (PBTM) % % PBTM margin (%) 6.7% 13.7% (7.0%) 7.8% 13.6% (5.8%) Income tax (3.4) (7.7) 44% (8.6) (16.1) 53% Deferred tax (5.1) (4.0) Net Profit after tax (NPAT) % % NPAT margin (%) 3.3% 10.9% (7.6%) 5.1% 10.8% (5.7%) Employee profit participation (3.1) (3.0) 103% (6.3) (5.9) 107% Net profit before minority interest % % Minority interest (0.1) 0.9 (11%) Net Profit % % Net profit margin (%) 2.0% 10.1% (8.1%) 3.8% 10.0% (6.2%) 17
18 Segmental Analysis 2Q 2011 Sanitary ware segmental analysis 2Q % 1H % / /10 Sanitary ware volumes (000 pcs) Egypt (000 pcs) % % Lebanon (000 pcs) % % Export (000 pcs) % % Total sanitary ware volumes (000 pcs) 1,082 1,306 83% 2,108 2,705 78% Exports/total sales volume (%) 49.3% 55.2% (5.9%) 56.9% 57.8% (0.9%) Sanitary ware revenue (LE m) % % Average selling price (LE/pc) % % Average cost per piece (LE/pc) % % Sanitary ware cost of sales (102.0) (100.9) 101% (188.9) (214.5) 88% Sanitary ware gross profit % % Sanitary ware gross profit margin (%) 29.5% 27.9% 1.7% 30.1% 28.9% 1.3% Tile segmental analysis 2Q % 1H % / /10 Tile volumes (000 sqm) Egypt (000 sqm) 4,548 3, % 8,076 8,132 99% Lebanon (000 sqm) % 981 1,239 79% Export (000 sqm) 650 1,438 45% 1,529 2,780 55% Total tile volumes (000 sqm) 5,683 6,119 93% 10,586 12,151 87% Exports/total sales volume (%) 11.4% 23.5% (12.1%) 14.4% 22.9% (8.4%) Tile revenue (LE m) % % Average selling price (LE/sqm) % % Average cost per sqm (LE/sqm) % % Tile cost of sales (73.4) (63.6) 115% (131.1) (126.1) 104% Tile gross profit % % Tile gross profit margin (%) 28.2% 45.1% (16.8%) 31.1% 43.6% (12.5%) Brassware segmental analysis 2Q % 1H % / /10 Brassware volumes (000 pcs) Egypt (000 pcs) 8, % 14, % Lebanon (000 pcs) 0 0 0% 0 0 0% Export (000 pcs) 0 0 0% 0 0 0% Total brassware volumes (000 pcs) 8, % 14, % Exports/total sales volume (%) 0.0% 0.0% 0.0% 0.0% 0.0% 0.0% Brassware revenue (LE m) % % Average selling price (LE/pc) % % Average cost per piece (LE/pc) % % Brassware cost of sales (1.2) - 0% (1.9) - 0% Brassware ware gross profit % % Brassware gross profit margin (%) 52.9% 0.0% 52.9% 58.5% 0.0% 58.5% 18
19 Balance Sheet Summary 2Q 2011 Balance Sheet (LE m) 30-Jun Dec-10 1H11/FY10 (%) Cash and short-term investments % Inventory % Receivables % Related parties -debit balances % Total current assets 1, % Net fixed assets % Intangible assets % Projects in progress % Other non-current assets % Total non-current assets % Total assets 1, , % Banks overdraft % Current portion of long-term liabilities % Trade and notes payable % Other current payable % Total current liabilities 1, % Long-term loans Other long-term liabilities % Total non-current liabilities % Total liabilities 1, % Minority interest % Issued capital % Reserves % Retained earnings % Net profit for the year % Total equity % Total equity, minorities and liabilities 1, , % 19

20 Share performance and data


 Trading frequency has gone to 98% of market days")

 Share liquidity")
21 Shareholding structure and performance Liquidity has moved to local share and improved Lecico share price Lecico valued at a market cap of US$ 106 million with a 51% free float All activity has moved from GDR to local share As part of its annual profit distribution, Lecico increased number of shares from 60m to 80m on 7 July 2010 Local share trades US$ 76,000 per day and on 98% of trading days (12m thru 25 Aug 2011) Trading frequency has gone to 98% of market days from c 40% of market days in Lecico trades at a trailing PER multiple of 6.7x 2010 earnings EV/EBITDA of 4.7x. Price to book value of 0.7x Dividend Yield of 12.6% Shareholding structure Share liquidity overview (GDR) Share liquidity overview (Local) Concord PE 10% Local float 37% Intage / Gargour 39% GDR float 14% 21

22 Thank you For additional information, please contact: Taher G. Gargour Telephone: Fax: Visit our website at: Forward-looking statements: This presentation may contain certain forward-looking statements, relating to Lecico Egypt S.A.E. business, which can be identified by the use of forward-looking terminology such as will, planned, expectations, forecast or similar expressions, or by discussions of strategy, plans or intentions. Such statements may include descriptions of investments planned or currently under development by Lecico Egypt S.A.E. and the anticipated impact of these investments. Such statements reflect the current views of Lecico Egypt S.A.E. with respect to future events and are subject to certain risks, uncertainties and assumptions. Many factors could cause the actual results, performance or achievements of Lecico Egypt S.A.E. to be materially different from any future results that may be expressed or implied by such forward-looking statements. 22
Introduction: An Egyptian exporter
 Corporate Summary Introduction: An Egyptian exporter Lecico Egypt S.A.E. was founded in 1959 and has been majority owned by the Gargour family since 1969 The company has a global competitive advantage
An Egyptian Exporter. First Half 2005 results road show September 2005
 An Egyptian Exporter Taher G. Gargour Business Development Walid A. Rateb Investor Relations First Half 25 results road show September 25 Corporate Summary Introduction: An Egyptian exporter Lecico Egypt
Taher G. Gargour Business Development FY 2005 results presentation March 2006
 An Egyptian Exporter Taher G. Gargour Business Development FY 25 results presentation March 26 Corporate Summary Introduction: An Egyptian exporter Lecico Egypt S.A.E. is a leading sanitary ware producer
Full Year 2017 Results
 Full Year 2017 Results Alexandria, 6 th March 2018 Lecico Egypt (Stock symbols: LCSW.CA; LECI EY) announces its consolidated results for 2017. Highlights 4Q 2017 Lecico revenue up 30% to LE 641.1 million
OPERATIONAL REVIEW 10 Sanitary ware 14 Tiles 18 Brassware 22 Financial review 26 Corporate social responsibility 30 Board of directors
 Lecico Egypt S.A.E. ANNUAL REPORT 2017 Lecico is one of the world s largest sanitary ware producer and a significant tile producer in Egypt and Lebanon. With over 50 years of operation, Lecico has developed
Current trends in generic medicines in the Middle East: challenges and opportunities. Mazen Darwazah Vice Chairman, Hikma Pharmaceuticals PLC
 Current trends in generic medicines in the Middle East: challenges and opportunities Mazen Darwazah Vice Chairman, Hikma Pharmaceuticals PLC Middle East and North African pharmaceutical markets Middle
Earnings Release: El Sewedy Electric Reports Consolidated Results for FY2011, ended December 31 st, 2011.
 Earnings Release: El Sewedy Electric Reports Consolidated Results for FY2011, ended December 31 st, 2011. April 2 nd, 2012 Cairo- Egypt. El Sewedy Electric posts an 18% increase in Revenues, flat EBITDA
Edita Food Industries Reports 3Q2018 Earnings
 Edita Food Industries Reports 3Q2018 Earnings Edita delivers strong results for the quarter with 22.2% year-on-year revenue growth to EGP 1.0 billion driven by higher volumes and indirect price increases;
Edita Food Industries Reports 1Q2018 Earnings
 Edita Food Industries Reports 1Q2018 Earnings Revenues record a strong 37.9% y-o-y increase to EGP 886 million driven by volume recovery across all segments and reflecting Edita s success in building an
HIKMA PHARMACEUTICALS PLC UBS GLOBAL GENERIC & SPECIALITY PHARMACEUTICALS CONFERENCE NEW YORK 8-9 MAY 2007
 HIKMA PHARMACEUTICALS PLC UBS GLOBAL GENERIC & SPECIALITY PHARMACEUTICALS CONFERENCE NEW YORK 8-9 MAY 2007 About Hikma Founded in Jordan in 1978 Multinational business developing, manufacturing and marketing
Edita Food Industries Reports FY2018 Earnings
 Edita Food Industries Reports FY2018 Earnings Edita delivers a strong 24.1% increase in FY2018 revenues to EGP 3.8 billion as volumes continue to grow along with improved profitability. EBITDA margin in
Cairo, March 15, TMG Holding reports EGP 6.2 BN consolidated revenue, EGP 762 MN consolidated net profit
 Full Year and Fourth Quarter ending December 31, Earning Release Cairo, March 15, 2016 -TMG Holding reports EGP 6.2 BN consolidated revenue, EGP 762 MN consolidated net profit after minority and EGP 6.3
Star Conference LONDON. 2015, October 5 th - October 6 th
 Star Conference LONDON 2015, October 5 th - October 6 th BOLZONI AT A GLANCE 2 Our market and our customers Dealers of Lift Trucks & Material Handling Lift Truck Manufacturers - OEM Logistics 30% Material
Revenues Gross Profit EBITDA Net Profit after Minority
 ELSEWEDY ELECTRIC Reports solid H1 2017 performance with a two-fold increase in revenues to EGP 20.7 billion and double-digit growth of net profit to EGP 3.0 billion; proposed dividend of EGP 8 per share
Juhayna Releases Second Quarter 2014 Earnings
 Juhayna Releases Second Quarter 2014 Earnings Financial Results SECOND QUARTER 2014 REVENUE EGP 950 mn 6% GROSS PROFIT EGP 257 mn 7% EBIT EGP 71 mn 49% NET INCOME EGP 40 mn 67% Sales Results DAIRY EGP
The Economic Letter December 2010
 ASSOCIATION OF BANKS IN LEBANON Research & Statistics Department The Economic Letter December 2010 Summary: Despite the deceleration in the activities of a number of economic sectors in the fourth quarter,
Full year 2017 key highlights. Ahmed El Beheiry, Group Chief Executive, commented:
 Full Year 2017 Earnings Release 5 March 2018 Telecom Egypt (Ticker: ETEL.CA; TEEG.LN), today announced its results for the year ending 31 December 2017. Full year 2017 key highlights Consolidated revenue
Earnings Release: ELSEWEDY ELECTRIC Reports Consolidated Results for Full Year 2015 ended December 31 st, 2015.
 Earnings Release: ELSEWEDY ELECTRIC Reports Consolidated Results for Full Year 2015 ended December 31 st, 2015. March 15 th, 2016 Cairo- Egypt. ELSEWEDY ELECTRIC announces a record year for FY 2015 with
FY 2017 EARNINGS RELEASE Cairo 28 February Q Consolidated Financial Highlights. FY 2017 Consolidated Financial Highlights
 ELSEWEDY ELECTRIC Records revenue growth of 74.1% Y-o-Y to EGP 42.9 billion driven by strong results from all business segments; net profit reached record high of EGP 6.4 billion; proposed 2H 2017 DPS
Summary. Solid underlying growth of the business. Investments in sustainable long-term growth. On track to achieve our financial targets
 HY 2002 RESULTS Summary Solid underlying growth of the business Investments in sustainable long-term growth On track to achieve our financial targets 1 Key Highlights HY 2002 (IAS) (1)(2) Post- Restructuring
DISTRESS DEBT: INVESTING AND MANAGING IN THE ZONE OF INSOLVENCY. Causes of the crisis, management and turnaround case study Lesson 4
 DISTRESS DEBT: INVESTING AND MANAGING IN THE ZONE OF INSOLVENCY Causes of the crisis, management and turnaround case study Lesson 4 Contents 1 2 3 4 Background The plan The reality The situation group
I. FINANCIAL HIGHLIGHTS
 3Q 2013 EARNINGS RELEASE JUHAYNA RELEASES: Third Quarter 2013 Earnings 4 November 2013 I. FINANCIAL HIGHLIGHTS Third Quarter 2013 Revenue of EGP 876 million 4% increase over 3Q12 Gross profit was EGP 266
VITRO Conglomerates. Company Note March 1, VITRO completes acquisition of the OEM Business from PGW
 Company Note VITRO Market Outperformer 2017 Price Target P$88.5 Price 70.1 12M Price Range 36.3/ 66.7 Shares Outstanding (Mill) 483.1 Market Cap (Mill) 1,703 Float 20% Net Debt ( Mill) 273 EV Adj. (Mill)
Investor Presentation QI 2017
 Investor Presentation QI 2017 1. Overview 2. Financial Information 3. Business Information 4. Share Information Overview QI 2017 Major Highlights Consistent Annual Income Growth ($M) One of the oldest
El Sewedy Electric Company
 بلوم مصر لتداول األوراق المالية BLOMINVEST BLOM EGYPT SECURITIES BANK UPDATE FOR FY 2013 Sector: Electric Equipment Country: Egypt Date: May 07, 2014 Share Price (EGP): Target Price (EGP): Upside: Recommendation:
2016 INVESTOR MEETINGS FIRST QUARTER 2016 WHIRLPOOL CORPORATION
 2016 INVESTOR MEETINGS FIRST QUARTER 0 FIRST-QUARTER INVESTOR MEETINGS WHIRLPOOL CORPORATION ADDITIONAL INFORMATION This Presentation contains forward-looking statements about Whirlpool Corporation and
Consolidated net revenues from sales totalled Euro million (Euro million as at 30 September 2017)
") PRESS RELEASE PANARIAGROUP Industrie Ceramiche S.p.A.: The Board of Directors approves the Consolidated Financial Report as of 30 th September 2018. The trend in EUR/USD exchange rate, the international
PRESS RELEASE PANARIAGROUP Industrie Ceramiche S.p.A.: The Board of Directors approves the Consolidated Financial Report as of 30 th September 2018. The trend in EUR/USD exchange rate, the international
GB Auto & Auto Related. GB Capital. GB Auto (AUTO.CA) Earnings Release: 1Q18. AUTO.CA on the Egyptian Exchange
 Earnings Release: 1Q18. AUTO.CA on the Egyptian Exchange") AUTO.CA on the Egyptian Exchange Revenue Progression (all figures in LE million) GB Auto & Auto Related 3,592.6 4,427.3 4,708.9 4,012.2 GB Auto Reports 1Q18 Results Automotive leader achieves strong increase
AUTO.CA on the Egyptian Exchange Revenue Progression (all figures in LE million) GB Auto & Auto Related 3,592.6 4,427.3 4,708.9 4,012.2 GB Auto Reports 1Q18 Results Automotive leader achieves strong increase
KORADO INDUSTRY: ELECTRICAL EQUIPMENT RESULTS ANALYSIS HOLD BOTTOM LINE OUTPACES EXPECTATIONS EQUITY RESEARCH BULGARIA DATE: FEBRUARY 7 TH 2018
 EQUITY RESEARCH BULGARIA KORADO INDUSTRY: ELECTRICAL EQUIPMENT BOTTOM LINE OUTPACES EXPECTATIONS KORADO S FY 217 FUNDAMENTALS MATCH TOP LINE EXPECTATIONS BUT OUTPACE BOTTOM LINE FORECASTS ON WELL MANAGED
Ideal Standard International S.A. Interim Financial Information for the three month period ended 31 March 2017
 Ideal Standard International S.A. Interim Financial Information for the three month period ended 31 March 2017 Ideal Standard International S.A. Financial Information 31 March 2017 Table of Contents Forward-Looking
25 th Annual General Meeting
 25 th Annual General Meeting 27 th October 2017 Page 1 Managing Director s Address Page 2 Workplace Health and Safety Total Injury Frequency Rate (TIFR) Continued focus on providing safe workplace for
STAR Conference. 6 th October 2016, London
 STAR Conference 6 th October 2016, London Elica Corporation N#1 PLAYER WORLDWIDE IN HOODS 13% MARKET SHARE 2015 TURNOVER 421.6 M 8 INDUSTRIAL PLANTS WORLDWIDE 2 19 Mln Hoods + Motors Cooking Net Sales:
Investor Presentation QI 2016
 Investor Presentation QI 2016 1. Overview 2. Financial Information 3. Business Information 4. Share Information Overview QI 2016 Major Highlights Consistent Annual Income Growth ($M) One of the oldest
Introduction to KUWAIT
 Introduction to KUWAIT Kuwait is the world s 10th largest producer of oil. Total oil production, which is equivalent to half the country s GDP, was estimated at 2.9 million barrels per day in 2016. Oil
Outlook (About DICE Sport and Casual Wear S.A.E).
.") Summary Income Statement Results in Nutshell Overview of al Performance Export Retail Dyeing Printing Other Local Sales Outlook (About DICE Sport and Casual Wear S.A.E). Consolidated Income Sheet Statement
Summary Income Statement Results in Nutshell Overview of al Performance Export Retail Dyeing Printing Other Local Sales Outlook (About DICE Sport and Casual Wear S.A.E). Consolidated Income Sheet Statement
Beltone Financial Leading transformation
 Beltone Financial Leading transformation CREDENTIALS December 2012 BELTONE FINANCIAL HOLDING Beltone Investment Banking HQ Cairo Beltone Asset Management HQ Cairo Beltone Fixed Income HQ Cairo Beltone
Edita Food Industries Reports 2Q2018 Earnings
 Edita Food Industries Reports 2Q2018 Earnings Continued growth in volumes drives Edita s revenues up 29.0% y-o-y to EGP 789.2 million; improved operating leverage sees EBITDA surge more than twofold with
The Economic Letter July 2018
 ASSOCIATION OF BANKS IN LEBANON Research & Statistics Department The Economic Letter July 2018 Summary: In July 2018, real sector indicators progressed in relation to the preceding month. Both imports
Chief Executive Officer
 Said Darwazah Chief Executive Officer 211 highlights Strong Group performance in a challenging year 95 9 MSI PROMOPHARM $11.2 m $918.m 85 8 75 BRANDED + 9.6% $37.9 m INJECTABLES + 23.3% $36.7 m GENERICS
The Economic Letter November 2018
 ASSOCIATION OF BANKS IN LEBANON Research & Statistics Department The Summary: In November 2018, the majority of real sector indicators regressed in relation to the previous month. Imports and exports of
LU-VE incontra la comunità finanziaria. 24 ottobre 2016
 LU-VE incontra la comunità finanziaria 24 ottobre 2016 Disclaimer This presentation has been prepared by LU-VE S.p.A. for information purposes only and for use in presentations of the Group s results and
The Economic Letter September 2018
 ASSOCIATION OF BANKS IN LEBANON Research & Statistics Department The Economic Letter September 2018 Summary: In the first three quarters of 2018, most real sector indicators retreated in relation to the
IPO NOTE AL MAHA CERAMICS SAOG (under transformation)
") INVESTMENT RESEARCH IPO NOTE AL MAHA CERAMICS SAOG (under transformation) Offer Closes: October 15, 2014 Offer Price: Bzs 397 per share Fair Value: Bzs 576 per share AL MAHA CERAMICS SAOG (under transformation)
INVESTMENT RESEARCH IPO NOTE AL MAHA CERAMICS SAOG (under transformation) Offer Closes: October 15, 2014 Offer Price: Bzs 397 per share Fair Value: Bzs 576 per share AL MAHA CERAMICS SAOG (under transformation)
The Economic Letter May 2018
 ASSOCIATION OF BANKS IN LEBANON Research & Statistics Department The Economic Letter May 2018 Summary: In May 2018, real sector indicators were mixed with reference to the preceding month. Imports of goods
Introduction to MOROCCO
 Introduction to MOROCCO With a GDP of USD 101bn in 2015, Morocco is a medium-sized economy. Sound macroeconomic fundamentals, a resilient and sophisticated banking sector and the implementation of structural
The Economic Letter March 2018
 ASSOCIATION OF BANKS IN LEBANON Research & Statistics Department The Economic Letter March 2018 Summary: In the first quarter 2018, most real sector indicators retreated with regard to the corresponding
Appendix 1: Results by business sector and geographic area - Full Year
 Appendix 1: Results by business sector and geographic area - Full Year I. SALES Innovative Materials 1 9,703 9,857 +1.6% +1.4% +4.5% Flat Glass 5,217 5,364 +2.8% +2.7% +6.5% High-Performance Materials
The Economic Letter January 2018
 ASSOCIATION OF BANKS IN LEBANON Research & Statistics Department The Economic Letter January 2018 Summary: In the first month of 2018, most real sector indicators retreated in relation to the preceding
Cover-More Group. UBS Australasia Conference. November 2015
 Cover-More Group UBS Australasia Conference November 2015 Executive summary: FY15 overview Cover-More delivered another year of double digit earnings growth, with offshore business growing substantially.
Philips Lighting reports 0.5% full year comparable sales growth, 10% operational profitability and EUR 403 million free cash flow
 Philips Lighting reports 0.5% full year comparable sales growth, 10% operational profitability and EUR 403 million free cash flow Q4 & Full Year 2017 presentation February 2, 2018 Important information
Henkel AG & Co. KGaA. Klaus Keutmann Frankfurt,
 Henkel AG & Co. KGaA Klaus Keutmann Frankfurt, 21.01.2015 Disclaimer This information contains forward-looking statements which are based on current estimates and assumptions made by the corporate management
Introduction to TUNISIA
 Introduction to TUNISIA Tunisia is small open economy with strong ties to Europe. The country has been cited as a success story for a number of years, following decades of robust growth and impressive
PRESS RELEASE Modena, 24 June Ceramic machinery industry reports record turnover
 PRESS RELEASE Modena, 24 June 2016 Ceramic machinery industry reports record turnover The 24th National Statistical Survey conducted by Acimac reveals the highest turnover in the industry s history at
Al Anwar Ceramics Tiles Co. SAOG
 Al Anwar Ceramics Tiles Co. SAOG 18 December 2013 Purpose of Report Initiation Recommendation Accumulate Code (AACT) Last Closing Price RO 0.570/share Fair Value RO 0.637/share 12-Month Low-High RO 0.385
Forward-Looking Statements
 William Blair & Company 27 th Annual Growth Stock Conference June 20, 2007 0 Forward-Looking Statements This presentation contains forward-looking statements that are subject to a number of risks and uncertainties,
2007 Interim Results 1 August 2007
 2 2007 Interim Results 1 August 2007 This material may be deemed to include forward-looking statements within the meaning of Section 27A of the US Securities Act of 1933 and Section 21E of the US Securities
Oriental Weavers Reports Strong Sales and Income Performance, Margin Growth in 9M2013
 Oriental Weavers Carpets Third Quarter 2013 Results Oriental Weavers Reports Strong Sales and Income Performance, Margin Growth in 9M2013 CAIRO, November 14, 2013 Oriental Weavers Carpets Company, Inc.
Ezz Steel Company (An Egyptian Joint Stock Company)
") (An Egyptian Joint Stock Company) Consolidated Financial Statements For the Financial Year Ended December 31, 2011 & Auditor s Report AUDITOR'S REPORT To the Shareholders of Ezz Steel Company Report on
(An Egyptian Joint Stock Company) Consolidated Financial Statements For the Financial Year Ended December 31, 2011 & Auditor s Report AUDITOR'S REPORT To the Shareholders of Ezz Steel Company Report on
Investor Presentation March 2018
 Investor Presentation March 2018 INTRODUCTION TO ADES ADES at a Glance Who We Are Leading MENAbased O&G Service Provider A leading oil & gas drilling and production services provider in the Middle East
Financial Information
 Financial Information H1 revenues reached 12.8bn up 9.8%, flat org. in Q2 Adj. EBITA reached 1.6bn, up 6.4%, Adj. EBITA margin flat excl. Invensys in a challenging environment 2015 targets: Around flat
RESULT JANUARY-JUNE 2006, August 8th. Mr. Kim Gran, President and CEO
 RESULT JANUARY-JUNE 2006, August 8th Mr. Kim Gran, President and CEO 1 CONTENTS Result H1 2006 Page Key figures 3 Operating profit per quarter 4 Market situation 5 Nokian Tyres H1 2006 6 Net sales by product
Dr. Raja M. Almarzoqi Albqami Institute of Diplomatic Studies
 Dr. Raja M. Almarzoqi Albqami Institute of Diplomatic Studies Rmarzoqi@gmail.com 3 nd Meeting of OECD-MENA Senior Budget Officials Network Dubai, United Arab Emirates, 31 October-1 November 2010 Oil Exporters
Al Anwar Ceramic Tiles (AACT)
") Feb-10 Aug-10 Feb-11 Aug-11 Feb-12 Aug-12 Feb-13 Al Anwar Ceramic Tiles (AACT) Building Materials Ceramic Tiles 25 February 2013 On Growth Trajectory Al Anwar Ceramic Tiles (AACT) is Oman s largest ceramic
Feb-10 Aug-10 Feb-11 Aug-11 Feb-12 Aug-12 Feb-13 Al Anwar Ceramic Tiles (AACT) Building Materials Ceramic Tiles 25 February 2013 On Growth Trajectory Al Anwar Ceramic Tiles (AACT) is Oman s largest ceramic
FY MARCH 2011 TELECONFERENCE PRESENTATION
 FY 2010 TELECONFERENCE PRESENTATION 15 MARCH 2011 1 4 APRIL 2011 DISCLAIMER This presentation contains forward-looking statements that reflect PANDORA s expectations with respect to certain future events
Juhayna Releases Third Quarter 2014 Earnings
 Juhayna Releases Third Quarter 2014 Earnings Financial Results THIRD QUARTER 2014 REVENUE EGP 1,008 mn 15% GROSS PROFIT EGP 259 mn 2% EBIT EGP 112 mn 18% NET INCOME EGP 54 mn 42% Sales Results DAIRY EGP
Juhayna Releases First Quarter 2014 Earnings
 Juhayna Releases First Quarter 2014 Earnings Financial Results FIRST QUARTER 2014 REVENUE EGP 812 mn 13% GROSS PROFIT EGP 218 mn 4% EBIT EGP 78 mn 25% NET INCOME EGP 43 mn 55% Sales Results DAIRY EGP 428
Makes it easier to be professional
 Makes it easier to be professional Handelsbanken Nordic Mid/small Cap Seminar June 8, 2017 President and CEO Johan Nilsson 2 2 Introduction One-Stop-Shop multi channel offering for professionals Branches
Financial Statements Release January December 2018
 Financial Statements Release January December 2018 Disclaimer In this presentation, all forward-looking statements in relation to the company or its business are based on the management judgment, and macroeconomic
The Economic Letter December 2016
 ASSOCIATION OF BANKS IN LEBANON Research & Statistics Department The Economic Letter December 2016 Summary: In 2016, real sector indicators were mixed and their varied performance pointed to another year
On track. Investor and Analyst Presentation On the Occasion of the Release of the Preliminary Figures for Q Hanover, 19 April 2011
 On track. Investor and Analyst Presentation On the Occasion of the Release of the Preliminary Figures for Q1 2011 Agenda Delticom at a Glance Business Model Profit & Loss Balance Sheet Outlook 2 Agenda
Agenda. Financial Review. Review of Operations. Future Plans and Strategies. Open Forum
 22 October 2009 1 Disclaimer The information contained in this presentation is intended solely for your personal reference. Such information is subject to change without notice, its accuracy is not guaranteed
Awraq Investments Tel: Fax: Toll Free: P.O. Box Amman Jordan
 Q3 Update Recommendation: Maintain Hold December 30, Figure 1: Shareholder Structure Dar Al Dawa Development and Investment Company Third Quarter and Nine Months Results 6% 5% 3% 3% 80% Ticker: DADI 3%
Paul Maguire Philip Bennett Paul Witheridge Managing Director Chief Financial Officer Chief Financial Officer
 McPherson s Limited Results for the year to 30 June 2011 Paul Maguire Philip Bennett Paul Witheridge Managing Director Chief Financial Officer Chief Financial Officer McPherson s Limited McPherson s Limited
Schaffer Corporation Limited. Bell Potter Small Cap Conference (29-Nov-06)
") Schaffer Corporation Limited Bell Potter Small Cap Conference (29-Nov-06) 1 SFC Corporate Directory Summary Free Float 64% SFC Board 36% 5 member Board (2 exec/3non exec) J Schaffer: 19%; D Blain: 11%;
Schaffer Corporation Limited Bell Potter Small Cap Conference (29-Nov-06) 1 SFC Corporate Directory Summary Free Float 64% SFC Board 36% 5 member Board (2 exec/3non exec) J Schaffer: 19%; D Blain: 11%;
PEER GROUPS CMP MARKET CAP EPS P/E (X) P/BV(X) DIVIDEND Company Name (Rs.) Rs. in mn. (Rs.) Ratio Ratio (%)
 P/BV(X) DIVIDEND Company Name (Rs.) Rs. in mn. (Rs.) Ratio Ratio (%)") BUY CMP 55.30 Target Price 65.00 UMANG DAIRIES LTD Result Update (PARENT BASIS): Q4 FY15 JUNE 17 th 2015 ISIN: INE864B01027 Index Details Stock Data Sector Packaged Foods BSE Code 500231 Face Value 5.00
BUY CMP 55.30 Target Price 65.00 UMANG DAIRIES LTD Result Update (PARENT BASIS): Q4 FY15 JUNE 17 th 2015 ISIN: INE864B01027 Index Details Stock Data Sector Packaged Foods BSE Code 500231 Face Value 5.00
ezzsteel REPORTS CONSOLIDATED FULL YEAR 2011 RESULTS
 ezzsteel REPORTS CONSOLIDATED FULL YEAR 2011 RESULTS Cairo, 10 April 2012 ezzsteel (EGX: ESRS; London Stock Exchange: AEZD), the largest independent producer of steel in the MENA region and market leader
Oriental Weavers Reports Revenue and Net Profit Growth, Strong Margins in Q1 2013
 Oriental Weavers Carpets First Quarter 2013 Results 88 Oriental Weavers Reports Revenue and Net Profit Growth, Strong Margins in Q1 2013 CAIRO, May 15, 2013 Oriental Weavers Carpets Company, Inc. (RIC:
Indygotech Minerals S.A.
 Indygotech Minerals S.A. Fair Value: n.a. Update Rating: n.a Indygotech Minerals (IDG) share price has recently taken a hit. The reason was a delay of completion of the production facilities for ceramic
Palestine Securities Exchange PSE
 Palestine Securities Exchange PSE Contents Palestine Economy Foreign investment in Palestine Market Highlights Company Highlights Why Invest in Palestine Contacts 3 4 5-8 9-14 15-21 22 2 Palestine Economy
Investor Relations Presentation December 2012
 Investor Relations Presentation December 2012 Contents 1. QNB at a Glance 2. QNB Comparative Positioning Qatar and MENA 3. Financial Highlights December 2012 4. Economic Overview 2 QNB at a Glance QNB
Paddy Power Betfair plc Prelim Results
 Paddy Power Betfair plc 2016 Prelim Results Financial & Operating Review [find new imagery for cover] Financial highlights 3 m, Proforma 1 2016 2015 YOY % YOY % CC 2 Revenue 1,551 1,318 +18% +11% Cost
Arabian Cement Company. FY 2017 Investors Presentation
 Arabian Cement Company FY 2017 Investors Presentation Highlights USD Debt reduced from 43 mm USD to 31 mm USD in 2017 02 EGP 507 MM EBITDA 03 4,11 MM tons Sales 01 06 82% Clinker Utilization 056.9% Market
LEBANON WEEKLY REPORT
 Beirut recorded the 2 nd lowest occupancy rate among Arab markets. The average room rate in Beirut hotels dropped to USD 167 in January 2014, compared to USD 173 in January 2013. Occupancy rate at Beirut
Public Policy on Modern Governance And Transparency To Improve Investment Environment In Egypt
 Public Policy on Modern Governance And Transparency To Improve Investment Environment In Egypt Presented By Eng. Ahmed El-Sayed GAFI ; Consultant & Head of promotion Affairs OECD Global Forum On International
Domty Reports a 24% Y-o-Y Growth in Revenues to EGP 1,400.1 million; Bottom-Line Surges 355% in FY2015
 Domty Reports a 24% Y-o-Y Growth in Revenues to EGP 1,400.1 million; Bottom-Line Surges 355% in FY2015 Highlights of FY2015 Revenues EGP 1,400.1 mn, up 24% y-o-y Gross Profit EGP 366.4 mn, up 52% y-o-y
THE WEEKLY ISSUE 19 7 TH MAY 2018 INCLUSIVE GROWTH AND JOB CREATION CONFERENCE IN THIS ISSUE
 INCLUSIVE GROWTH AND JOB CREATION CONFERENCE The Central Egypt (CBE), Egypt s Finance Ministry and the International Monetary Fund (IMF) organized the Inclusive Growth and Job Creation Conference in Cairo
Interim Report as of September 30, 2011
 Interim Report as of September 30, 2011 Webcast and Conference Call November 10, 2011 Silicon & Wafer Solar Cell & Module Thin Film Module Semiconductor Disclaimer We have exercised utmost care in the
Investor Presentation
 Investor Presentation 2018 1. Introduction 2. Financial Overview 3. Business Overview 4. BLOM s Shares 5. Appendix BLOM Bank at a glance 2018 Overview of BLOM Bank BLOM Bank Shareholders BLOM is the most
Preliminary Results 2013 Imperial Tobacco Group PLC
 Preliminary Results 2013 Imperial Tobacco Group PLC 5 November 2013 1 Disclaimer Certain statements in this document constitute or may constitute forward-looking statements. Any statement in this document
2014 Half-Year Results. July 31, 2014
 2014 Half-Year Results July 31, 2014 AGENDA 1 2 3 4 HIGHLIGHTS ROBUST H1 2014 ACHIEVEMENTS 2014 TARGETS CONFIRMED 2 1 HIGHLIGHTS 3 1 HIGHLIGHTS HIGHLIGHTS Change in net sales Acquisition-driven growth:
TABLE OF CONTENTS. Worldwide overview. European Union overview. Italian industry overview. Company overview. Financials. Outlook
 April 2004 TABLE OF CONTENTS Worldwide overview European Union overview Italian industry overview Company overview Financials Outlook 2 Worldwide overview Turkey and Italy are the 7th and 8th world wide
Investor presentation
 Investor presentation Important information Forward-Looking Statements and Risks & Uncertainties This document and the related oral presentation contain, and responses to questions following the presentation
Agenda. 1. Highlights FY 2012 Results. 2. Operational Performance Priorities for Financials. 5. Conclusion
 1MARCH 2013 Legal Disclaimer Information in this presentation may involve guidance, expectations, beliefs, plans, intentions or strategies regarding the future. These forward-looking statements involve
Electrocomponents plc ANNOUNCEMENT OF INTERIM RESULTS
 Electrocomponents plc ANNOUNCEMENT OF INTERIM RESULTS HALF YEAR ENDED 30 SEPTEMBER 2010 12 NOVEMBER 2010 DELIVERING FOR OUR CUSTOMERS Agenda Overview and current trading Ian Mason Financial performance
Sales and EBITDA growth of 16% and 6%. Net Debt to Ebitda 1.8x. Capex $193 million Pesos.
 Stock price as of July 27th, 2015: $31.5 Total shares: 378.3 millions Sales and EBITDA growth of 16% and 6%. Net Debt to Ebitda 1.8x. Capex $193 million. Figures in millions of nominal Mexican. Figures
Foreign investment in Casablanca stock exchange The second half of 2014
 Foreign investment in Casablanca stock exchange The second half of 2014 April 2015 898 SYNTHESIS The value of shares listed on the Casablanca stock exchange owned by foreign investors has increased by
Al Arafa for Investments and Consultancies. Earnings Release H Results
 Al Arafa for Investments and Consultancies Earnings Release H1 2015 Results 13 th September, 2015 Al Arafa for Investments & Consultancies ("Arafa Holding or AIVC" or the Company ) released its financial
London October 2 nd 2012
 London October 2 nd 2012 1 Towards a stronger internationalization Sabaf enjoys a strong leadership position in Italy and Europe (market share above 40%) Demographic and macroeconomic trends do not leave
For personal use only. JB Hi-Fi Limited. HY18 Results Presentation
 JB Hi-Fi Limited HY8 Results Presentation 5 FEBRUARY AUGUST 06 08 PAGE Agenda. Group Performance Overview. JB HI-FI 3. The Good Guys 4. Group Balance Sheet and Cash Flow 5. Outlook Richard Murray Group
Palestine Securities Exchange PSE
 Palestine Securities Exchange PSE Contents Palestine Economy Foreign investment in Palestine Market Highlights Company Highlights Why Invest in Palestine Contacts 3 4 5-8 9-14 15-21 22 2 Millions (US$)