Pinnacle Foods AMPLIFY THE PLAYBOOK
|
|
|
- Rudolf Fox
- 5 years ago
- Views:
Transcription

1 Pinnacle Foods AMPLIFY THE PLAYBOOK Barclay s Global Consumer Staples Conference September 6, 2016
2 Forward-Looking Statements & Non-GAAP Financial Measures This presentation contains forward-looking statements within the meaning of U.S. federal securities laws. Forward-looking statements are not historical facts, and are based upon management s current expectations, beliefs, projections and targets, many of which, by their nature, are inherently uncertain. Such expectations, beliefs, projections and targets are expressed in good faith. However, there can be no assurance that management s expectations, beliefs, projections and targets will be achieved and actual results may differ materially from what is expressed in or indicated by the forward- looking statements. Forward-looking statements are subject to significant business, economic, regulatory and competitive risks and uncertainties that could cause actual performance or results to differ materially from those expressed in the forward-looking statements, including risks detailed in Pinnacle Foods Inc. s ( Pinnacle Foods, Pinnacle or the Company ) filings with the U.S. Securities and Exchange Commission (the SEC ). Nothing in this presentation should be regarded as a representation by any person that these forward-looking statements will be achieved. Forward-looking statements speak only as of the date the statements are made. The Company assumes no obligation to update forward-looking statements to reflect actual results, subsequent events or circumstances or other changes affecting forward-looking information except to the extent required by applicable securities laws. This presentation includes certain non-gaap financial measures, which differ from results using U.S. Generally Accepted Accounting Principles (GAAP). These non-gaap financial measures should be considered as supplements to the GAAP reported measures, should not be considered replacements for, or superior to, the GAAP measures and may not be comparable to similarly named measures used by other companies. Non-GAAP financial measures typically exclude certain charges, which are not expected to occur routinely in future periods. The Company uses non-gaap financial measures internally to focus management on performance excluding these special charges to gauge our business operating performance. Management believes this information is helpful to investors because it increases transparency, and assists investors in understanding the underlying performance of the Company and in the analysis of ongoing operating trends. Additionally, management believes that non-gaap financial measures are frequently used by analysts and investors in their evaluation of companies, and its continued inclusion provides consistency in financial reporting and enables analysts and investors to perform meaningful comparisons of past, present and future operating results. The most directly comparable GAAP financial measures and reconciliations to non-gaap financial measures are set forth in the appendix to this presentation and included in the Company s filings with the SEC.
3 Pinnacle Management Mark Clouse Chief Executive Officer Craig Steeneck EVP & CFO Maria Sceppaguercio SVP Investor Relations Tyson Seely Manager Investor Relations


4 4 Agenda Who We Are Overview Pinnacle Playbook Financial Performance Where We re Going Amplify the Playbook


5 Diversified Portfolio Duncan Hines Grocery 34% Boulder Brands 16% 2015 Net Sales $3.2 billion Specialty 11% Birds Eye Frozen 39% 5 Note: Pro forma for Boulder Brands acquired on January 15, 2016.
6 6 Broad Scale and Capabilities 16 Manufacturing Facilities Retail Distribution Channels Grocery / Mass Natural & Organic Club / Dollar e-commerce Temperature Classes Frozen Dry Grocery Refrigerated 5,141 Employees
7 7 Agenda Who We Are Overview Pinnacle Playbook Financial Performance Where We re Going Amplify the Playbook
8 8 The Pinnacle Playbook Strong Cost Cash Cost & Cash Management Management Smart Marketing & Innovation Lean & Experienced Capable Organization Acquisition & Integration Expertise
9 Strong Cost Management Tracking up >400 bps since IPO Playbook Strong productivity Favorable mix Adj. Gross Profit % of Net Sales (bps vs. PY) Price management Efficient trade spending H1 9 Note: Adj. Gross Profit presented above is on a Non-GAAP basis. See reconciliation to GAAP financial measures in Appendix.


 less Capital")
10 Strong Cash Management 2016 Tracking to +$1bn FCF since IPO Playbook Free Cash Flow Cash as a priority Working capital improvement $178 $298* ($m) $265 Debt/interest management $76 $ H H1 Operating Cash Flow CAPEX 10 *Excludes the benefit of $150 million Hillshire net termination fee. Note: Free Cash Flow reflects Net Cash Provided by Operating Activities (Operating Cash Flow) less Capital Expenditures (CAPEX).
11 11 The Pinnacle Playbook Strong Cost & Cash Management Smart Marketing & Innovation Lean & Experienced Organization Acquisition & Integration Expertise
 +0.5 pts +0.8 pts Speed to market Consumer-driven, margin accretive innovation +0.3 pts +0.")
12 12 Smart Marketing and Innovation Share tracking +1.8 pts since IPO Playbook Portfolio management Focus on shelf, distribution and price TDPs +41% since IPO Composite $ Market Share (Change vs. PY) +0.5 pts +0.8 pts Speed to market Consumer-driven, margin accretive innovation +0.3 pts +0.2 pts YTD Source: IRI US Multi-Outlet data, based on IRI s Pinnacle custom definitions. Total Distribution Points (TDPs) exclude discontinued businesses.


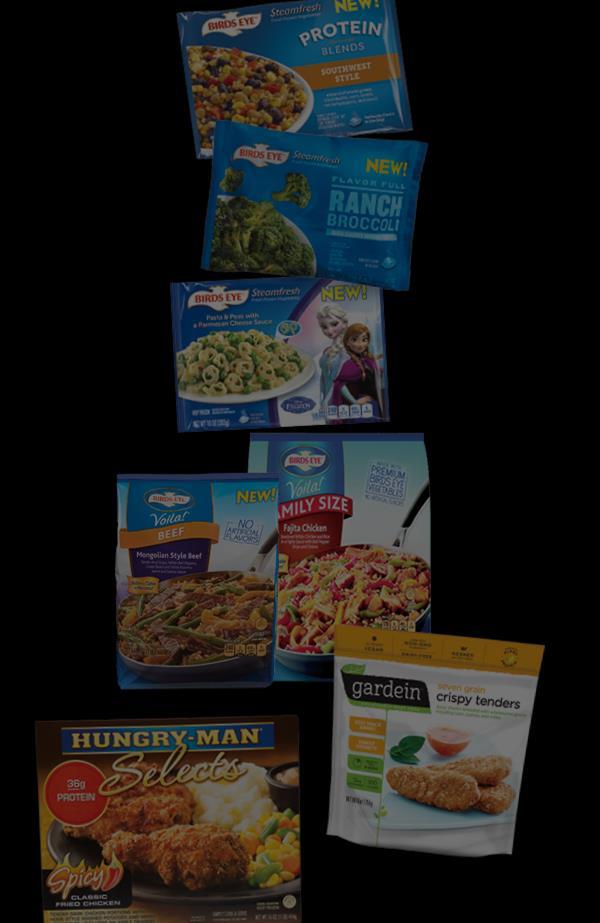
13 Birds Eye Vegetables Birds Eye TDPs +12% Protein Blends Birds Eye $ Share +4.3 pts Flavor Full Disney-Themed Marketing Multi-media campaign focused on vegetable usage and meal solutions Increased investment across franchise Innovation Introduced 3 new platforms in 2015 Expanded these platforms in 2016 Source: IRI US Multi-Outlet data, based on IRI s Pinnacle custom definitions; share and TDP growth since YE


14 Birds Eye Multi-Serve Meals Voila! Premium-Tier Voila! $ Share pts Voila! Consumption +27% Voila! Family Size Marketing Launched dedicated Voila! advertising Increase investment in 2016 Drive broader HH penetration Innovation Launched beef, pork, shrimp offerings Expanding distribution of Premium-tier Expanding occasions with Family Size 14 Source: IRI US Multi-Outlet data, based on IRI s Pinnacle custom definitions; share and consumption growth since YE 2013.


15 Duncan Hines Premium $ Share +2.8 pts Innovation Award Marketing Leverage highly-engaged consumer via digital marketing and social media Build robust consumer interaction Focus events on key baking holidays Innovation Focused on premium end of category Perfect Size addresses 1-2 person HH New decadent gluten-free line Perfect Size 45% Incremental to Category 15 Source: IRI US Multi-Outlet data, based on IRI s Pinnacle custom definitions; share growth since YE 2013.


16 16 Wish-Bone E.V.O.O. 5 of the Top 10 New Items in Category Wish-Bone Growing Share in Latest 2 Periods Ristorante Italiano ~75% ACV Better for You Oils Highest EVOO level in mainstream dressing Breakthrough bottle design and premium price point Restaurant Experience An artisan, restaurant-style experience Strengthening margins within category Source: IRI US Multi-Outlet data, based on IRI s Pinnacle custom definitions; share growth in 5 week period ended 7/31/16 and 4 week period ended 6/26/16.
17 17 The Pinnacle Playbook Strong Cost & Cash Management Smart Marketing & Innovation Lean & Experienced Organization Acquisition & Integration Expertise

18 Lean and Experienced Organization Playbook Focused on what matters SG&A Overhead (% of Net Sales) ~12% Sales per Employee >20% above Peer Average Speed as a core value 9% Mission-critical capabilities Cost conscience mindset Peer Avg. Pinnacle Note: SG&A Overhead defined as selling, general and administrative expenses excluding marketing, intangible amortization and one-time items; reflects fiscal 2015 FY data. Peer Average comprised of: BGS, CAG, CPB, GIS, KHC, MKC, SJM. 18 Source: Pinnacle analysis.
19 19 The Pinnacle Playbook Strong Cost & Cash Management Smart Marketing & Innovation Lean & Experienced Organization Acquisition & Integration Expertise


20 20 Acquisition & Integration Expertise Playbook North America focus Added >$750m Sales since IPO Existing / adjacent categories Oct Nov Jan Market leadership or line of sight to leadership Synergy-rich transaction Speed of integration


21 Gardein 2015 Innovation 2016 Innovation 8.9% $ Market Share 15.0% Expanded capacity in 11.7% YTD Growing Consumption 35%+ since Acquisition Vancouver site in 2015 Acquired Hagerstown, MD facility to further expand capacity beyond Source: IRI US Multi-Outlet data, based on IRI s Pinnacle custom definitions; share of frozen meat substitutes category.
22 Attractive Value Creation Since IPO LT Organic Growth Target Adjusted Basis 2013 TSR +175% since IPO Net Sales In Line with Categories Outpaced Categories Outpaced Categories Outpaced Categories Operating Income 4-5% 10% 13% 5% EPS 7-8% 39% 14% 10% Dividend Yield 3-4% 3% 3% ~2-3% 10-12% 42% 17% 13% 22 Accretive Acquisitions Accelerate Growth Beyond Algorithm Note: Operating Income and EPS presented above are on a Non-GAAP basis. See reconciliation to GAAP financial measures in Appendix. Total Shareholder Return (TSR) reflects stock price as of 8/30/16 versus IPO price of $20.
23 23 Agenda Who We Are Overview Pinnacle Playbook Financial Performance Where We re Going Amplify the Playbook

24 24 Strong First Half 2016 Results $m, except EPS Strong H1 for Base PF Adjusted Basis 2016 Vs. PY Net Sales $1, % Gross Margin 28.1% +180 bps Boulder ahead of expectations Operating Income $ % Diluted EPS $ % Note: Gross Margin, Operating Income and Diluted EPS presented above are on a Non-GAAP basis. See reconciliation to GAAP financial measures in Appendix.
25 Led to Improved 2016 Outlook Full Year Net Sales Growth in line with categories Unchanged Productivity Inflation 3.5% to 4.0% of COGS 2.0% to 2.5% of COGS Unchanged Reduced from 2.0% - 3.0% Adj. Diluted EPS $2.10 to $2.15 Boulder $0.07 to $0.08 Increased from $ $2.13 Increased from ~$0.05 Note: Adj. Diluted EPS presented above is on a Non-GAAP basis. See reconciliation to GAAP financial measures in Appendix. 25


26 Strong Second Half Programming Marketing and Innovation Robust Birds Eye program Increased marketing Innovation Perfect Size pie offerings Significant Hungry-Man distribution expansion Veggie Made Rice Perfect Size Flavor Full Potatoes Hungry-Man 26


27 27 Sustained Productivity Outpacing Inflation % of Cost of Goods Sold 4.1% 2.3% 3.7% 3.8% 2.7% 3.2% 3.4% 3.5%- 4.0% 2.0%- 2.5% 1.6% H1 2016E Productivity Inflation Note: 2016 includes Boulder Brands.


28 Diversified Input Basket Acts as a Commodity Hedge All Other Logistics 2016 Outlook Grains & Oils Proteins 2015 Cost of Goods Sold $2.3 billion Conversion More Inflationary Sweeteners Sugar Deflationary Grains & Oils Proteins Egg Whites Vegetables & Fruit Packaging 28 Note: Pro forma for Boulder Brands acquired on 1/15/16.

29 29 Strength of Boulder Brands Integration Highly-experienced Boulder President announced One order, one invoice completed Evol Range St. facility closure announced Business Integration SKU rationalization well underway All systems integrated by 12/31 $30m Synergy Target SG&A Logistics Procurement Manufacturing Total Synergies $14m $16m +++ On track Building visibility to synergies beyond Sales Outlook: $460m - $480m 2016 EPS Contribution: $ $0.08 Outlook for Adj EBITDA Growth Significantly Improved

30 30 Continued Strong Free Cash Flow Generation Unleveraged FCF FCF Yield $325m $452m $382m ~4% ~6% $136m $184m H H1 Peer Average Pinnacle Note: Unleveraged Free Cash Flow is a non-gaap measure. See reconciliation to GAAP financial measures in Appendix. FCF Yield based on industry analysts valuation analyses using prices as of 8/15/16 and Pinnacle analysis.


31 31 Disciplined Capital Expenditures $84m $103m $108m $115 $125m E % of Net Sales 3.4% 4.0% 4.1% ~4.0% Base Acquisition-related Note: 2016 base CAPEX includes Boulder.

32 32 History of Deleveraging Post Acquisition Leverage Ratio 7.6X 6.2X IPO proceeds used to reduce debt Approximate 2-year path to 3.8X Target deleveraging post acquisition 4.5X 4.9X 3.8X 4.8X 3.8X Apr 07 Blackstone LBO Dec 09 Birds Eye Acquisition Mar 13 IPO Oct 13 Wish-Bone Acquisition Dec 15 Dec 15 Pro Forma for BDBD Acquisition Dec 17 Estimate Note: Leverage ratio defined as Total Net Debt / Covenant Compliance EBITDA, as per PF debt agreements and public filings.
33 33 Agenda Who We Are Overview Pinnacle Playbook Financial Performance Where We re Going Amplify the Playbook

34 34 Amplify the Playbook Expand Margins & Cash Flow Strong Cost & Cash Management Smart Marketing & Innovation Lean & Experienced Organization Acquisition & Integration Expertise


35 Margin & Cash 46.0% Expand Margins Peer Company Comparison Adj. Gross Profit % of Net Sales Significantly Reduce Gap to Peer Average by 2019 Margin Amplifiers Broader MVP scope Peer Average = 36.0% Harmonization 28.2% 26.5% Trade optimization Boulder PF 35 Note:. Adj. Gross Profit % of Net Sales is a Non-GAAP measure and represents latest fiscal year. See reconciliation to GAAP financial measures in Appendix for PF. MVP is Pinnacle s Maximizing Value through Productivity program. Source: Peer Company reporting; Pinnacle analysis.


36 36 Margin & Cash Expand Cash Flow Cash Priorities Strengthen Value Creation Optionality Cash Amplifiers After paying interest, taxes and dividends: #1 Priority Debt Reduction & Acquisitions Cash Conversion Cycle Inventories Payables CAPEX rationalization #2 Priority Business Reinvestment Interest expense reduction #3 Priority Share Repurchase
37 37 Amplify the Playbook Expand Margins & Cash Flow Smart Marketing & Innovation Accelerate Profitable Top-Line Growth Lean & Experienced Organization Acquisition & Integration Expertise

38 Growth Accelerate Profitable Top-Line Growth Strong Performance vs. Categories 3-Year Growth Through % Avg. Annual PF Cat y Composite +1.1 pts Cumulative PF $ Share Growth Amplifiers Health & Wellness portfolio Strengthened fundamentals Continue to drive top-line at or above categories Strengthened PF H&W Portfolio % of Net Sales 55% Channel coverage 14% Pro forma for Boulder Brands acquisition. Source: IRI US Multi-Outlet data, based on IRI s Pinnacle custom definitions.

39 Health & Wellness is the Biggest Growth Trend in Food Lifestyle Choices 30% Vegetable Demand Actively seeking to increase consumption: Clean Ingredients 43% participated in some kind of specialized approach to eating in the past 12 months. Vegetables Fruit 64.9% 62.6% planning on eating less processed foods this year Top 3 Approaches Whole Grains 48.9% Plant Based/ Vegetarian Fiber 47.9% Lactose-Free Protein 43.6% Gluten-Free Sources: FMI, US Grocery Shopping Trends, 2015; Mintel Oxygen American Lifestyles 2014: Looking Forward; NPD Eating Trends


40 Grow in H&W with Consumer-Driven Strategies Lifestyle Leadership Vegetable Ubiquity Better Center of Store Lead key H&W lifestyle movements Plant Based Gluten Free Clean Convenience Increase support levels Expand availability and affordability Add new occasions and formats Expand permissibility by increasing positives and reducing negatives Add portion control choices 40
41 41 Amplify the Playbook Expand Margins & Cash Flow Accelerate Profitable Top-Line Growth Lean & Capable Organization Strengthen Capabilities; Maintain Costs Acquisition & Integration Expertise

42 Capabilities Strengthen Capabilities; Maintain Costs Capability Amplifiers Strengthened capabilities In-store execution Pricing analytics and trade optimization End-to-end planning Productivity and cash conversion Best in class marketing mix management SG&A Overhead at 9% Boulder H&W culture and expertise 42
43 43 Amplify the Playbook Expand Margins & Cash Flow Accelerate Profitable Top-Line Growth Strengthen Capabilities; Maintain Costs Acquisition & Integration Expertise Increase M&A Potential
44 44 M&A Increase M&A Potential M&A Amplifiers Acquisitions Accelerate Margins and Growth H&W platform broadens options Decision criteria remains disciplined North America / existing or adjacent categories Leading brands or line of sight to leadership Synergy-rich and speed-of-integration Proven integration model Dedicated VP Corporate Development resource being hired
45 45 Amplify the Playbook Cost Expand & Cash Management Margins & Cash Flow Smart Marketing Accelerate & Profitable Innovation Top-Line Growth Lean Strengthen & Capable Capabilities; Organization Maintain Costs Acquisition & Integration Increase Expertise M&A Potential
46 46 Amplifying the Playbook: What s Next? We expect to deliver another great year in 2016 Going forward, amplifying the playbook can create further meaningful value Gross margin opportunity is significant H&W platform supports faster growth Strengthened capabilities deliver full potential Increased M&A potential expands optionality Investor meeting in December to share more details
47 Pinnacle Foods AMPLIFY THE PLAYBOOK Appendix
48 48 Reconciliation from GAAP to Adjusted Financial Measures Year (52 Weeks) Ended December 27, 2015 Operating Diluted In millions, except per share Gross Profit Income Diluted Earnings Net Sales $ % Margin (EBIT) Net Earnings Shares Per Share Reported $2,656 $ % $425 $ $1.81 Acquisition, merger and other restructuring charges (1) % Other non-cash items (2) (1) 0.0% Adjusted 2, % $1.92 Year (52 Weeks) Ended December 28, 2014 Operating Diluted In millions, except per share Gross Profit Income Diluted Earnings Net Sales $ % Margin (EBIT) Net Earnings Shares Per Share Reported $2,591 $ % $512 $ $2.13 Acquisition, merger and other restructuring charges (3) % (130) (79) (0.68) Other non-cash items (4) % Adjusted 2, % $1.74 Year (52 Weeks) Ended December 29, 2013 Operating Diluted In millions, except per share Gross Profit Income Diluted Earnings Net Sales $ % Margin (EBIT) Net Earnings Shares Per Share Reported $2,464 $ % $293 $ $0.82 Acquisition, merger and other restructuring charges (5) 4 0.2% Other non-cash items (4) 6 0.3% Other adjustments (6) Adjusted 2, % $1.49 IPO and Refinancing (7) Pro Forma $2,464 $ % $374 $ $1.52 Stock-based Compensation Pro Forma Excluding Stock-based Compensation $665 $665 $382 $ $1.57 (1) Primarily includes: Plant integration and restructuring charges and expenses related to the Boulder acquisition. (2) Primarily includes: Foreign exchange losses resulting from intra-entity loans, equity-based compensation exp. related to the Hillshire agreement termination and mark-to-market losses. (3) Primarily includes: Hillshire agreement termination fee (net of costs), restructuring charges including integration costs, employee severance and non-recurring merger costs. (4) Primarily includes: Equity-based compensation expense resulting from liquidity event, fair value write-up of acquired inventories and mark-to-market gains/losses. (5) Primarily includes: Restructuring charges from plant consolidations, integration costs, non-recurring merger costs and employee severance. (6) Primarily includes: Bond redemption costs and management fee paid to sponsor. (7) Pro forma data reflects Adjusted Statement of Operations amounts assuming IPO and 2013 Refinancing occurred on the first day of Fiscal 2013.
49 49 Reconciliation from GAAP to Adjusted Financial Measures Year (53 Weeks) Ended December 30, 2012 Operating Diluted In millions, except per share Gross Profit Income Diluted Earnings Net Sales $ % Margin (EBIT) Net Earnings Shares Per Share Reported $2,479 $ % $284 $ $0.61 Acquisition, merger and other restructuring charges (1) % Other non-cash items (2) (1) 0.0% Other adjustments (3) 1 0.0% Adjusted 2, % $1.20 IPO (4) (0.08) Public company costs (4) (3) (2) Pro Forma $2,479 $ % $347 $ $1.12 (1) Primarily includes: Accelerated depreciation from plant consolidations, restructuring charges including integration costs and employee severance. (2) Primarily mark to market gains. (3) Primarily includes: Bond redemption costs. (4) Pro forma data reflects Adjusted Statement of Operations amounts assuming IPO occurred on the first day of Fiscal 2012.
50 50 Reconciliation from GAAP to Adjusted Financial Measures First Half (26 Weeks) Ended June 26, 2016 Operating Diluted In millions, except per share Gross Profit Income Diluted Earnings Net Sales $ % Margin (EBIT) Net Earnings Shares Per Share Reported $1,511 $ % $188 $ $0.60 Acquisition, merger and other restructuring charges (1) 1 0.1% Other non-cash items (2) 3 0.2% Adjusted $1,511 $ % $222 $ $0.83 First Half (26 Weeks) Ended June 28, 2015 Operating Diluted In millions, except per share Gross Profit Income Diluted Earnings Net Sales $ % Margin (EBIT) Net Earnings Shares Per Share Reported $1,297 $ % $178 $ $0.73 Acquisition, merger and other restructuring charges (1) 4 0.3% Other non-cash items (3) (4) -0.3% 0.0% (2) (1) (0.01) Adjusted $1,297 $ % $182 $ $0.75 (1) Primarily includes: Restructuring charges, acquisition integration costs and acquisition-related expenses. (2) Represents expenses related to the write-up to fair value of inventories acquired as a result of the Boulder acquisition, mark-to-market gains, and unrealized foreign exchange losses resulting from intra-entity loans. (3) Represents mark-to-market gains, unrealized foreign exchange losses resulting from intra-entity loans and employee stock compensation expense related to the terminated Hillshire merger agreement.
51 51 Reconciliation from GAAP to Adjusted Financial Measures Reconciliation of Unleveraged Free Cash Flow to Reported Cash Flows from Operating Activities - $m 2013 FY 2014 FY 2015 FY 2015 H H1 Reported Cash Flows from Operating Activities $262 $551 $373 $124 $165 Capital expenditures (84) (103) (108) (48) (60) Free Cash Flow Hillshire termination fee (net of costs and cash taxes) (150) Free Cash Flow ex. Hillshire Acquisition, merger and other restructuring charges (1) Cash interest expense Unleveraged Free Cash Flow $325 $452 $382 $136 $184 (1) Primarily includes: Restructuring charges from integration costs, non-recurring merger costs and employee severance.
Pinnacle Foods Inc. (Exact name of registrant as specified in its charter)
") UNITED STATES SECURITIES AND EXCHANGE COMMISSION Washington, D.C. 20549 FORM 8-K ý CURRENT REPORT PURSUANT TO SECTION 13 OR 15(d) OF THE SECURITIES EXCHANGE ACT OF 1934 Date of Report (Date of earliest
UNITED STATES SECURITIES AND EXCHANGE COMMISSION Washington, D.C. 20549 FORM 8-K ý CURRENT REPORT PURSUANT TO SECTION 13 OR 15(d) OF THE SECURITIES EXCHANGE ACT OF 1934 Date of Report (Date of earliest
PINNACLE FOODS INC. (Exact Name of Registrant as Specified in its Charter)
") UNITED STATES SECURITIES AND EXCHANGE COMMISSION WASHINGTON, D.C. 20549 FORM 8-K CURRENT REPORT Pursuant to Section 13 or 15(d) of the Securities Exchange Act of 1934 Date of Report (Date of Earliest Event
UNITED STATES SECURITIES AND EXCHANGE COMMISSION WASHINGTON, D.C. 20549 FORM 8-K CURRENT REPORT Pursuant to Section 13 or 15(d) of the Securities Exchange Act of 1934 Date of Report (Date of Earliest Event
BARCLAY S GLOBAL CONSUMER STAPLES CONFERENCE
 BARCLAY S GLOBAL CONSUMER STAPLES CONFERENCE SEPTEMBER 6, 2017 Pinnacle Management Mark Clouse Chief Executive Officer Mark Schiller EVP & Chief Commercial Officer Craig Steeneck EVP & CFO Maria Sceppaguercio
Forward-Looking Statements & Non-GAAP Financial Measures
 Pinnacle Foods Presentation to CAGNY March 24, 2016 Forward-Looking Statements & Non-GAAP Financial Measures This presentation contains forward-looking statements within the meaning of U.S. federal securities
PINNACLE FOODS INC. (Exact Name of Registrant as Specified in its Charter)
") UNITED STATES SECURITIES AND EXCHANGE COMMISSION WASHINGTON, D.C. 20549 FORM 8-K CURRENT REPORT Pursuant to Section 13 or 15(d) of the Securities Exchange Act of 1934 Date of Report (Date of Earliest Event
UNITED STATES SECURITIES AND EXCHANGE COMMISSION WASHINGTON, D.C. 20549 FORM 8-K CURRENT REPORT Pursuant to Section 13 or 15(d) of the Securities Exchange Act of 1934 Date of Report (Date of Earliest Event
Pinnacle Foods Reports Second Quarter Fiscal 2017 Results Company Maintains Full Year Guidance at Low End of Range
 Pinnacle Foods Reports Second Quarter Fiscal 2017 Results Company Maintains Full Year Guidance at Low End of Range Parsippany, NJ, July 27, 2017 - Pinnacle Foods Inc. (NYSE: PF) today reported its financial
Pinnacle Foods Reports Strong 1st Quarter Fiscal 2017 Results Company Reaffirms Guidance for the Year
 Pinnacle Foods Reports Strong 1st Quarter Fiscal Results Company Reaffirms Guidance for the Year Parsippany, NJ, April 27, - Pinnacle Foods Inc. (NYSE: PF) today reported strong results for the first quarter
ending 10/1/17. 1 Adjusted financial metrics used throughout this release exclude items affecting comparability and are non-gaap
 Pinnacle Foods Reports Third Quarter Fiscal Results Company Reiterates Full-Year Guidance Parsippany, NJ, October 26, - Pinnacle Foods Inc. (NYSE: PF) today reported its financial results for the third
Pinnacle Foods Inc. (Exact name of registrant as specified in its charter)
") UNITED STATES SECURITIES AND EXCHANGE COMMISSION Washington, D.C. 20549 FORM 8-K ý CURRENT REPORT PURSUANT TO SECTION 13 OR 15(d) OF THE SECURITIES EXCHANGE ACT OF 1934 Date of Report (Date of earliest
UNITED STATES SECURITIES AND EXCHANGE COMMISSION Washington, D.C. 20549 FORM 8-K ý CURRENT REPORT PURSUANT TO SECTION 13 OR 15(d) OF THE SECURITIES EXCHANGE ACT OF 1934 Date of Report (Date of earliest
Pinnacle Foods Inc. Reports 3rd Quarter Fiscal 2015 Results
 News Release Pinnacle Foods Inc. Reports 3rd Quarter Fiscal 2015 Results 10/29/2015 Company Reaffirms Guidance for Full-Year EPS Growth in the Range of 9-10% PARSIPPANY, N.J., Oct. 29, 2015 /PRNewswire/
Pinnacle Foods Inc. Reports Q4 and Full Year 2015 Results Company Provides Guidance for Another Strong Year in 2016
 Pinnacle Foods Inc. Reports Q4 and Full Year 2015 Results Company Provides Guidance for Another Strong Year in 2016 Parsippany, NJ, February 25, 2016 - Pinnacle Foods Inc. (NYSE: PF) today reported its
Pinnacle Foods Inc. Reports 1st Quarter Fiscal 2016 Results
 News Release Pinnacle Foods Inc. Reports 1st Quarter Fiscal 2016 Results 4/28/2016 Company Reaffirms Guidance for Full-Year EPS in the Range of $2.08 to $2.13 PARSIPPANY, N.J., April 28, 2016 /PRNewswire/
Pinnacle Foods Inc. (Exact name of registrant as specified in its charter)
") UNITED STATES SECURITIES AND EXCHANGE COMMISSION Washington, D.C. 20549 FORM 8-K ý CURRENT REPORT PURSUANT TO SECTION 13 OR 15(d) OF THE SECURITIES EXCHANGE ACT OF 1934 Date of Report (Date of earliest
UNITED STATES SECURITIES AND EXCHANGE COMMISSION Washington, D.C. 20549 FORM 8-K ý CURRENT REPORT PURSUANT TO SECTION 13 OR 15(d) OF THE SECURITIES EXCHANGE ACT OF 1934 Date of Report (Date of earliest
Pinnacle Foods Inc. (Exact name of registrant as specified in its charter)
") UNITED STATES SECURITIES AND EXCHANGE COMMISSION Washington, D.C. 20549 FORM 8-K x CURRENT REPORT PURSUANT TO SECTION 13 OR 15(d) OF THE SECURITIES EXCHANGE ACT OF 1934 Date of Report (Date of earliest
UNITED STATES SECURITIES AND EXCHANGE COMMISSION Washington, D.C. 20549 FORM 8-K x CURRENT REPORT PURSUANT TO SECTION 13 OR 15(d) OF THE SECURITIES EXCHANGE ACT OF 1934 Date of Report (Date of earliest
FOR IMMEDIATE RELEASE
 FOR IMMEDIATE RELEASE Pinnacle Foods Inc. Reports Q4 and Full-Year 2013 Results at the Top of its Guidance Range Company Expects Another Year of Double-Digit EPS Growth in 2014 Parsippany, NJ, March 6,
Pinnacle Foods Inc. Reports Fiscal Q2 Results
 FOR IMMEDIATE RELEASE Pinnacle Foods Inc. Reports Fiscal Q2 Results Company Reaffirms its Outlook for Double-Digit EPS Growth for the Year Parsippany, NJ, August 13, 2014 Pinnacle Foods Inc. (NYSE: PF)
Barclay s High Yield Bond and Syndicated Loan Conference. March 27, 2012
 Barclay s High Yield Bond and Syndicated Loan Conference March 27, 2012 1 Forward-Looking Statements and GAAP Reconciliation Forward-looking statements should not be read as a guarantee of future performance
Pinnacle Foods Inc. Reports Q4 and Full Year 2014 Results. Company Provides EPS Guidance for Fiscal 2015 Representing 7-10% Growth
 Pinnacle Foods Inc. Reports Q4 and Full Year 2014 Results Company Provides EPS Guidance for Fiscal 2015 Representing 7-10% Growth Parsippany, NJ, February 24, 2015 Pinnacle Foods Inc. (NYSE: PF) today
Pinnacle Foods Inc. Reports Strong Fiscal Q3 Results. Company Now Expects EPS at the High End of its Previous Guidance Range for the Year
 FOR IMMEDIATE RELEASE Pinnacle Foods Inc. Reports Strong Fiscal Q3 Results Company Now Expects EPS at the High End of its Previous Guidance Range for the Year Parsippany, NJ, November 13, 2013 - Pinnacle
Pinnacle Foods Wells Fargo 2010 Consumer Conference. September 30, 2010
 Pinnacle Foods Wells Fargo 2010 Consumer Conference September 30, 2010 Forward Looking Statements and GAAP Reconciliation Forward looking statements should not be read as a guarantee of future performance
Pinnacle Foods Inc. Announces New Segment Reporting Structure
 Announces New Segment Reporting Structure PARSIPPANY, N.J., February 10, 2017 - Pinnacle Foods Inc. (NYSE: PF) announced today that, in the fourth quarter of fiscal during which the integration of the
FINANCIAL OVERVIEW AL MISTYSYN SENIOR VICE PRESIDENT, FINANCE & CHIEF FINANCIAL OFFICER FINANCIAL COMMUNITY PRESENTATION OCTOBER 3, 2017
 FINANCIAL OVERVIEW AL MISTYSYN SENIOR VICE PRESIDENT, FINANCE & CHIEF FINANCIAL OFFICER FINANCIAL COMMUNITY PRESENTATION OCTOBER 3, 2017 Forward Looking Statement The presentations today will contain certain
Pinnacle Foods Corp Moderator: Robert Gamgort 3/6/ :00 AM ET Confirmation # Page 1
 Page 1 Pinnacle Foods Corp March 6, 2013 10:00 AM ET Operator: Good afternoon ladies and gentlemen and thank you for standing by. Welcome to the Pinnacle Foods Finance LLC earnings call for the 4 th quarter
September 11, Corporate Update. Rich Tobin, President & Chief Executive Officer
 September 11, 2018 Corporate Update Rich Tobin, President & Chief Executive Officer Forward-Looking Statements and Non-GAAP Measures Our comments may contain forward-looking statements that are inherently
DAVE MARBERGER CHIEF FINANCIAL OFFICER
 1 DAVE MARBERGER CHIEF FINANCIAL OFFICER 2 DAVE MARBERGER CHIEF FINANCIAL OFFICER With Conagra since 2016 Previous Experience Prestige Brands: 1 year Godiva Chocolatier: 7 years Tasty Baking Company: 5
Our Transformation Continues Sidoti NDR May 29-30, 2018
 Our Transformation Continues Sidoti NDR May 29-30, 2018 Disclosure Regarding Forward-Looking Statements Forward-Looking Statements and Factors That May Affect Future Results: Throughout this presentation,
NLSN 4Q and FY 2011 Investor Presentation
 NLSN 4Q and FY 2011 Investor Presentation Forward Looking Statements The following discussion contains forward-looking statements, including those about Nielsen s outlook and prospects, in the meaning
Bank of America Merrill Lynch Global Industrials Conference 2018 March 2018
 Bank of America Merrill Lynch Global Industrials Conference 2018 March 2018 Safe Harbor This presentation includes forward-looking statements which are statements that are not historical facts, including
This presentation contains certain forward-looking statements within the meaning of the Private Securities Litigation Reform Act of 1995, such as stat
 This presentation contains certain forward-looking statements within the meaning of the Private Securities Litigation Reform Act of 1995, such as statements regarding the Company s expected financial performance,
First Quarter 2015 Earnings. May 11, 2015
 First Quarter 2015 Earnings May 11, 2015 1 Forward-Looking Statements Some of the statements made in this presentation are forward-looking and are made pursuant to the safe harbor provision of the Private
The J. M. Smucker Company
 The J. M. Smucker Company Fourth Quarter Fiscal 2018 Earnings SUPPLEMENTARY INFORMATION June 7, 2018 Consolidated Results ($ in millions, except per share data) FY18 Q4 FY17 Q4 YoY Change Net Sales $1,781
Our Transformation Continues. March 21, 2018
 Our Transformation Continues March 21, 2018 Disclosure Regarding Forward-Looking Statements Forward-Looking Statements and Factors That May Affect Future Results: Throughout this presentation, we make
FOURTH QUARTER 2018 REVIEW FEBRUARY 7, 2019
 FOURTH QUARTER 2018 REVIEW FEBRUARY 7, 2019 REGARDING FORWARD LOOKING STATEMENTS Statements contained in this press release that are not historical facts are forward looking statements. Forward looking
Investor Presentation. April 2018
 Investor Presentation April 2018 Disclaimer This presentation has been prepared and issued by Nomad Foods Limited (the "Company"). This Presentation has been provided solely for information and background.
Investor presentation
 Investor presentation Important information Forward-Looking Statements and Risks & Uncertainties This document and the related oral presentation contain, and responses to questions following the presentation
Fourth Quarter & Full-Year Fiscal 2018 Results. Strategy & Portfolio Review
 Fourth Quarter & Full-Year Fiscal 2018 Results Strategy & Portfolio Review 1 Forward-Looking Statements The factors that could cause actual results to vary materially from those anticipated or expressed
The J.M. Smucker Company
 The J.M. Smucker Company CONSUMER ANALYST GROUP OF NEW YORK CONFERENCE February 21, 2018 Strategy and Business Update Mark Smucker President and Chief Executive Officer Financial Update Mark Belgya Vice
Energizer Investor Call. November 15, 2018
 Energizer Investor Call November 15, 2018 Cautionary Note Regarding Forward- Looking Statements This press release contains forward-looking statements within the meaning of the Private Securities Litigation
THIRD QUARTER 2018 REVIEW & INVESTOR OVERVIEW NOVEMBER 8, 2018
 THIRD QUARTER 2018 REVIEW & INVESTOR OVERVIEW NOVEMBER 8, 2018 REGARDING FORWARD-LOOKING STATEMENTS Statements contained in this press release that are not historical facts are forward-looking statements.
Investor Presentation. Second Quarter 2018 NASDAQ: BECN BECN
 Investor Presentation Second Quarter 2018 BECN 1 Disclosures Forward Looking Statements and Non-GAAP Measures This presentation contains forward-looking statements within the meaning of the Private Securities
Credit Suisse 6 th Annual Industrials Conference November 2018
 Credit Suisse 6 th Annual Industrials Conference November 2018 Safe Harbor This presentation includes forward-looking statements which are statements that are not historical facts, including statements
Investor Deck December 2018
 Investor Deck December 2018 Safe Harbor This presentation includes forward-looking statements which are statements that are not historical facts, including statements that relate to the mix of and demand
Philips Lighting reports 0.5% full year comparable sales growth, 10% operational profitability and EUR 403 million free cash flow
 Philips Lighting reports 0.5% full year comparable sales growth, 10% operational profitability and EUR 403 million free cash flow Q4 & Full Year 2017 presentation February 2, 2018 Important information
Altice USA Q4 and Full-Year 2018 Results. February 21, 2019
 Altice USA Q4 and Full-Year 2018 Results February 21, 2019 Disclaimer FORWARD-LOOKING STATEMENTS Certain statements in this presentation constitute forward-looking statements within the meaning of the
Gardner Denver Q Earnings Presentation. April 27, 2018
 Gardner Denver Q1 2018 Earnings Presentation April 27, 2018 Replay Information Dial toll-free: +1.877.344.7529 International: +1.412.317.0088 Conference ID: #10119481 Log on to: http://investors.gardnerdenver.com
First Quarter 2018 Results & Outlook. May 3, 2018
 First Quarter 2018 Results & Outlook May 3, 2018 Forward-Looking Statements This presentation contains forward-looking statements within the meaning of the Private Securities Litigation Reform Act of 1995.
COMPANY OVERVIEW MARCH 2018
 COMPANY OVERVIEW MARCH 2018 REGARDING FORWARD-LOOKING STATEMENTS Statements contained in this press release that are not historical facts are forward-looking statements. Forward-looking statements relate
Chairman & CEO SVP & CFO
 Chairman & CEO SVP & CFO 1 Included in this presentation are forward-looking management comments and other statements that reflect management s current outlook for future periods. As always, these expectations
2017 Investor Presentation
 2017 Investor Presentation Growth Outpacing a Growing Industry Food Away From Home PFG Net Sales $B $B $331 5.2% $741 $10.1 $10.6 8.2% $11.5 $12.8 $13.7 $15.3 $16.1 '99 '00 '01 '02 '03 '04 '05 '06 '07
Acquisition of Dealer Inspire and Launch Digital Marketing
 Acquisition of Dealer Inspire and Launch Digital Marketing Investor Presentation February 14, 2018 Forward Looking Statements This presentation contains forward looking statements within the meaning of
2018 FOURTH QUARTER EARNINGS CALL
 NORTH AMERICA S LEADING BUILDING MATERIALS DISTRIBUTOR RESIDENTIAL COMMERCIAL INTERIOR SOLAR 2018 FOURTH QUARTER EARNINGS CALL Forward Looking Statements / Non-GAAP Measures This presentation contains
COMPANY OVERVIEW NOVEMBER 2017
 COMPANY OVERVIEW NOVEMBER 2017 REGARDING FORWARD-LOOKING STATEMENTS Statements contained in this press release that are not historical facts are forward-looking statements. Forward-looking statements relate
CAGNY Conference. February 22, 2018
 CAGNY Conference February 22, 2018 Disclaimer This presentation has been prepared and issued by Nomad Foods Limited (the "Company"). This Presentation has been provided solely for information and background.
GENERAL MILLS FISCAL 2019 THIRD-QUARTER EARNINGS MARCH 20, 2019
 GENERAL MILLS FISCAL 2019 THIRD-QUARTER EARNINGS MARCH 20, 2019 1 A Reminder on Forward-looking Statements This presentation contains forward-looking statements within the meaning of the Private Securities
/// The New Wabtec. February 25, 2019
 The New Wabtec February 25, 2019 DISCLAIMER / FORWARD-LOOKING STATEMENTS Caution Concerning Forward-Looking Statements This presentation contains forward-looking statements as that term is defined in Section
HOSTESS BRANDS INVESTOR PRESENTATION
 HOSTESS BRANDS INVESTOR PRESENTATION November 2016 0 DISCLAIMER Forward Looking Statements This investor presentation contains statements reflecting our views about our future performance that constitute
Second Quarter 2017 Reconciliation of Non-GAAP Financial Measures
 Second Quarter 2017 Reconciliation of Non-GAAP Financial Measures Adjusted Operating Income Reconciliation Adjusted operating income is not a measure of financial performance under generally accepted accounting
H1 16 interim results. 22 September 2015
 H1 16 interim results 22 September 2015 Important notice 2 This presentation may include certain forward-looking statements, beliefs or opinions, including statements with respect to the Company s business,
Earnings Conference Call Third Quarter 2016 October 28, :00 am ET
 Earnings Conference Call Third Quarter 2016 October 28, 2016 9:00 am ET Today s Presenters Kim Ann Mink, Ph.D. Chief Executive Officer and President Han Kieftenbeld SVP and Chief Financial Officer 2 Safe
GENERAL MILLS. Fiscal 2018 Third Quarter Results. March 21, 2018
 GENERAL MILLS Fiscal 2018 Third Quarter Results March 21, 2018 A Reminder on Forward-looking Statements This presentation contains forward-looking statements within the meaning of the Private Securities
General Mills. Fiscal 2016 First Quarter Results
 General Mills Fiscal 2016 First Quarter Results A Reminder on Forward-looking Statements This presentation contains forward-looking statements within the meaning of the Private Securities Litigation Reform
FOURTH QUARTER 2017 EARNINGS PRESENTATION FEBRUARY 8, 2018
 FOURTH QUARTER 2017 EARNINGS PRESENTATION FEBRUARY 8, 2018 REGARDING FORWARD-LOOKING STATEMENTS Statements contained in this press release that are not historical facts are forward-looking statements.
Adjusted EBITDA decreased 1.9 percent to $17.7 million as compared to $18.0 million 1 in the comparable period in fiscal 2017;
 BOB EVANS REPORTS SECOND QUARTER FY 2018 RESULTS Net sales increase 22.3 percent to $117.6 million compared to $96.2 million 1 in the comparable period in fiscal 2017; net sales increased 6.2 percent excluding
McCormick & Company, Inc. 3rd Quarter 2017 Financial Results and Outlook September 28, 2017
 McCormick & Company, Inc. 3rd Quarter 2017 Financial Results and Outlook September 28, 2017 1 The following slides accompany a September 28, 2017 earnings release conference call. This information should
Forward-Looking Statements
 William Blair & Company 27 th Annual Growth Stock Conference June 20, 2007 0 Forward-Looking Statements This presentation contains forward-looking statements that are subject to a number of risks and uncertainties,
Jarden Investor Presentation. October 14, 2015
 Jarden Investor Presentation October 14, 2015 Cautionary Statement Please note that in this presentation, we may discuss events or results that have not yet occurred or been realized, commonly referred
American Italian Pasta Company
 American Italian Pasta Company 2 nd Quarter Fiscal 2010 Results May 6, 2010 Forward Looking Statements This presentation contains statements concerning potential future events. These forward-looking statements
The Clorox Company. Benno Dorer. Back to School Conference September Chief Operating Officer
 The Clorox Company Back to School Conference September 2014 Benno Dorer Chief Operating Officer 1 Safe Harbor Except for historical information, matters discussed in this presentation, including statements
First Quarter 2016 Earnings
 First Quarter 2016 Earnings Disclaimer Forward-Looking Statements This presentation contains forward-looking statements within the meaning of the Federal Private Securities Litigation Reform Act of 1995.
BlueLinx Third Quarter 2018 Earnings Webcast
 BlueLinx Third Quarter 2018 Earnings Webcast Notes To Investors Forward-Looking Statements. This presentation includes forward-looking statements within the meaning of the Private Securities Litigation
FY18 Q3 Earnings Presentation
 FY18 Q3 Earnings Presentation March 22, 2018 Today s Presenters Brian Kearney Investor Relations Sean Connolly President and Chief Executive Officer Dave Marberger Chief Financial Officer 2 Forward-Looking
Sysco Earnings Results 2Q19
 Sysco Earnings Results 2Q19 FORWARD LOOKING STATEMENTS Statements made in this presentation or in our earnings call for the second quarter of fiscal 2019 that look forward in time or that express management
Acquisition of Signode: Global Leader In Transit Packaging. December 19, 2017
 Acquisition of Signode: Global Leader In Transit Packaging December 19, 2017 Forward Looking Statement Except for historical information, all other information in this presentation consists of forward-looking
4th Quarter 2018 Earnings. Investor Presentation February 27, 2019
 4th Quarter 2018 Earnings Investor Presentation February 27, 2019 DISCLAIMER Forward Looking Statements This investor presentation contains statements reflecting our views about the future performance
INVESTOR PRESENTATION. May 2018
 INVESTOR PRESENTATION May 2018 FORWARD-LOOKING STATEMENTS Some of the statements in this presentation constitute forward-looking statements about Sunoco LP ( SUN, we, our, and us ) that involve risks,
H1019-JPMorgan-2/09 1
 H1019-JPMorgan-2/09 1 1 Forward-Looking Statements Certain statements contained in this presentation are forward-looking statements within the meaning of the Private Securities Litigation Reform Act of
dbaccess Global Consumer Conference June 12, 2018
 dbaccess Global Consumer Conference June 12, 2018 Disclaimer This Presentation has been prepared and issued by Nomad Foods Limited (the "Company"). This Presentation has been provided solely for information
Investor Presentation
 Investor Presentation Cautionary Note Regarding Forward-Looking Statements This presentation contains forward-looking information, including the Company s statements regarding its future outlook. In addition,
FIRST-HALF 2017 RESULTS. 27 July 2017
 FIRST-HALF 2017 RESULTS 27 July 2017 Disclaimer FORWARD LOOKING STATEMENTS This presentation contains certain statements that constitute "forward-looking statements", including but not limited to statements
FINANCIAL OVERVIEW AL M I S T Y S Y N
 FINANCIAL OVERVIEW AL MISTYSYN SENIOR VICE PRESIDENT, FINANCE & CHIEF FINANCIAL OFFICER Forward-Looking Statement The presentations today will contain certain forward-looking statements," within the meaning
McCormick to Acquire Reckitt Benckiser s Food Division. Investor Presentation / July 19, 2017
 McCormick to Acquire Reckitt Benckiser s Food Division Investor Presentation / July 19, 2017 Forward-looking information Certain information contained in this presentation and our remarks that are not
Baird Global Healthcare Conference
 Baird Global Healthcare Conference Jason Meggs Chief Financial Officer September 6, 2018 Forward-Looking Statements, Non-GAAP Financial Measures, and Basis of Financial Presentation Forward-Looking Statements
First Quarter 2017 Results & Outlook for May 2, 2017
 First Quarter 2017 Results & Outlook for 2017 May 2, 2017 Forward-Looking Statements and Risk Factors This presentation contains statements which constitute forward-looking statements, within the meaning
Fourth Quarter and FY 2017 Earnings. February 26, 2018
 Fourth Quarter and FY 2017 Earnings February 26, 2018 Forward Looking Statements Some of the statements made in this presentation are forward-looking and are made pursuant to the safe harbor provision
Investor Presentation
 Investor Presentation Cautionary Note Regarding Forward-Looking Statements This presentation contains forward-looking information, including the Company s statements regarding its future outlook. In addition,
2018 EPG Conference. May 22, 2018
 2018 EPG Conference May 22, 2018 Safe Harbor This presentation includes forward-looking statements which are statements that are not historical facts, including statements that relate to the mix of and
2015 Fourth-Quarter and Fiscal Year Performance
 205 Fourth-Quarter and Fiscal Year Performance Financial Results and Company Highlights March 5, 206 Disclaimers Forward-Looking Statements This presentation includes forward-looking statements within
Conagra Brands Acquisition of Pinnacle Foods and FY18 Q4 Earnings Presentation
 Conagra Brands Acquisition of Pinnacle Foods and FY18 Q4 Earnings Presentation June 27, 2018 Today s Presenters Brian Kearney Investor Relations Sean Connolly President and Chief Executive Officer Dave
Investors: Michael D. Neese VP, Investor Relations (804)
") NEWS RELEASE For Immediate Release August 17, 2016 Investors: Michael D. Neese VP, Investor Relations (804) 287-8126 michael.neese@pfgc.com Media: Joe Vagi Manager, Corporate Communications (804) 484-7737
NEWS RELEASE For Immediate Release August 17, 2016 Investors: Michael D. Neese VP, Investor Relations (804) 287-8126 michael.neese@pfgc.com Media: Joe Vagi Manager, Corporate Communications (804) 484-7737
Citi Credit Conference. Bill Bradley, Treasurer November 15, 2012
 NLSN @ Citi Credit Conference Bill Bradley, Treasurer November 15, 2012 Forward Looking Statements The following discussion may contain forward-looking statements, including those about Nielsen s outlook
Fourth-Quarter 2018 Results. January 30, 2019
 Fourth-Quarter 2018 Results January 30, 2019 Safe Harbor This presentation includes forward-looking statements which are statements that are not historical facts, including statements that relate to the
Xylem Agrees to Acquire Sensus to Broaden Portfolio and Enhance Growth Platform AUGUST 15, 2016
 1 Xylem Agrees to Acquire Sensus to Broaden Portfolio and Enhance Growth Platform AUGUST 15, 2016 Forward-Looking Statements This presentation contains information that may constitute forward-looking statements.
INVESTOR PRESENTATION
 INVESTOR PRESENTATION August 2018 1 DISCLOSURE Forward-Looking Statements This presentation includes "forward-looking statements" within the meaning of the "Safe-Harbor" provisions of the Private Securities
INVESTOR PRESENTATION
 Always Advancing To Protect What s Important INVESTOR PRESENTATION Jefferies Industrial Conference August 2018 NYSE: BERY Who is Berry? Leading Global Supplier Of Value-Added Protective Solutions $8B Annual
Kellogg Company February 21, Boca Raton February 21, 2018
 Boca Raton February 21, 2018 Deploy For Growth Forward-Looking Statements This presentation contains, or incorporates by reference, forward-looking statements with projections concerning, among other things,
2018 Second Quarter Earnings Call. May 8, 2018
 2018 Second Quarter Earnings Call May 8, 2018 Forward Looking Statements / Non-GAAP Measures This presentation contains information about management's view of the Company's future expectations, plans and
INVESTOR PRESENTATION
 INVESTOR PRESENTATION March 2019 1 DISCLOSURE Forward-Looking Statements Certain statements in this presentation, and at times made by our officers and representatives, constitute forward-looking statements
THE J. M. SMUCKER COMPANY
 Richard Smucker Chief Executive Officer THE J. M. SMUCKER TEAM RICHARD SMUCKER Chief Executive Officer MARK SMUCKER President, U.S. Retail Coffee PAUL SMUCKER WAGSTAFF President, U.S. Retail Consumer Foods
Dean Foods First Quarter 2014 Earnings Report. May 8, 2014
 Dean Foods First Quarter 2014 Earnings Report May 8, 2014 1 The following statements made in this presentation are forward-looking and are made pursuant to the safe harbor provision of the Private Securities
BANK OF AMERICA MERRILL LYNCH 2017 LEVERAGED FINANCE CONFERENCE
 THE NEW NAVISTAR November 29, 2017 BANK OF AMERICA MERRILL LYNCH 2017 LEVERAGED FINANCE CONFERENCE International is a registered trademark of, Inc. NYSE: NAV1 Safe Harbor Statement and Other Cautionary