Study on Demand of Insurance for Natural Catastrophes
|
|
|
- Cory Charles
- 5 years ago
- Views:
Transcription


1 Study on Demand of Insurance for Natural Catastrophes Study Report March 2010 Philippines Microinsurance Innovations Program for Social Security (MIPSS)
2 Responsible Antonis Malagardis Program Manager GTZ MIPSS Author Christian Proebsting Editor Dante Portula Senior Finance Adviser GTZ MIPSS Publisher Microinsurance Innovations Programs for Social Security (MIPSS) microinsurance.ph GTZ MIPSS Head Office Insurance Commission Complex 1071 UN Avenue, Ermita, Manila PHILIPPINES Antonis Malagardis PhD Program Manager March 2010 GTZ Microinsurance Innovations Program for Social Security (MIPSS), Philippines 2
3 Study on Demand of Insurance for Natural Catastrophes Study Report March 2010 Philippines GTZ Microinsurance Innovations Program for Social Security (MIPSS), Philippines 3
4 Contents Tables 5 Figures 5 Acronyms 6 Executive Summary 7 I Background 14 II Objectives of the Study 15 III Methodologies 15 IV Analytical Framework and Structure of Report Presentation 16 V Part 1 Profile of Pre-selected Provinces Availability of geo/weather-data Presence of potential distribution channels Exposure to and relevance of natural catastrophe risk 19 VI Part 2 Findings and Analysis: Household Interviews and FGDs Natcat Risk Exposure and General Vulnerability Risks and Specific Vulnerability Risk Preparedness and Coping Mechanism Financial Literacy & Insurance Design 46 VII Recommendations and Next Steps Recommendations Next steps 56 References 58 GTZ Microinsurance Innovations Program for Social Security (MIPSS), Philippines 4
5 Tables 1 Profile of Respondents 15 2 Weather Stations in pre-selected provinces 19 3 Vulnerability to Environmental Disasters 20 4 Social Indicators (NSCB, 2006) 20 5 Rice and Corn Production Value 21 6 Rice and Corn Yield and Income Per Hectare 22 7 Relative Vulnerability 23 8 Rice and Corn Damage (BAS 2008 Damage Report) 24 9 Damage to Rice and Corn Per Hectare (BAS, 2008) Asset Values Family Income and Expenditure per Province (Monthly) RURAL Household Income and Expenditures URBAN Household Income and Expenditures Household Income Patterns, ILOILO Frequent Hazards and Cost Frequency of Natcat Occurrence Risk Proneness for Farming and Non-farming Households Natcat Costs to Households Demand for Insurance by Understanding and by Membership 49 Figures 1 Analytical Framework 17 2 Financial Pressures of Households 36 3 Perception on Natcat Impact to Households Pre selected provinces 39 4 Perception on natcat impact to households - ILOILO Province 40 5 Perception on natcat impact to households - CAGAYAN 41 6 Perception on natcat impact to households - LEYTE province 42 7 Perception on natcat impact to households - AGUSAN del Sur Province 43 8 Natcat Coping Mechanisms 45 9 Reasons to buy insurance Perceived benefits from natcat insurance Monthly insurance premium affordability Challenges to PCIC crop insurance 52 GTZ Microinsurance Innovations Program for Social Security (MIPSS), Philippines 5
6 Acronyms BAS BMZ FGD GTZ HH MBA MFI MIPSS Natcat NGO NSCB PAGASA PCIC PPP Bureau of Agricultural Statistics German Ministry for Economic Cooperation Focus Group Discussion German Technical Cooperation Households Mutual Benefit Association Microfinance Institutions Microinsurance Innovations Program for Social Security Natural Catastrophes Non Government Organizations National Statistics and Coordination Board Philippine Atmospheric, Geophysical and Astronomical Services Administration Philippine Crop Insurance Corporation Public Private Partnership GTZ Microinsurance Innovations Program for Social Security (MIPSS), Philippines 6
7 Executive Summary Within the frame of MIPSS, the BMZ (German Ministry for Economic Cooperation) has approved in mid the commission of 3-year public private partnership (PPP) between the German Technical Cooperation (GTZ) and Munich Re to develop natural catastrophes (natcat) insurance products targeted at the poor by using a parametric trigger. Based on the criteria of data availability, risk exposure, distribution channels and socio-economic profile, four provinces (i.e. Iloilo and Leyte in Visayas, Cagayan in Luzon and Agusan del Sur in Mindanao) have been pre-selected as pilot areas of the natcat micro insurance products. Profiling of the four provinces based on intensive review of secondary data had been conducted following the selection criteria. Then household interviews and focus group discussions were conducted in 14 sampled municipalities in the four provinces to generate more detailed information and analysis of demand for micro insurance products against natural catastrophes. The target populations were members of cooperatives, farmers, micro-entrepreneurs and other residents in the areas visited belonging to the low-income sector (class C, D and E) and are prone to the effects of natural calamities. The presentation of the study findings comes in two parts. First part describes the profile of the preselected provinces. The second part presents the results of the household interviews and FGDs which supplements the information and analysis provided in provincial profiles. Recommendations are in the last section of the report. Profile of Pre-selected provinces 1. Availability of geo/weather data. Iloilo, Cagayan and Leyte display a relative dense system of weather stations. In contrast, Agusan del Sur is not equipped at all. Recent efforts have modernized the equipment of weather stations. In 2009, the Korean International Cooperation Agency (KOICA) installed a modern set of rainfall and water level stations in Iloilo after the last flood in order to improve the early warning system. A similar project covered the Magat River in Isabela province, one of the main confluents of Cagayan River. According to PAGASA, plans to extend the early flood warning system to Cagayan are currently developed. In Leyte, GTZ has equipped several municipalities with digital rainfall stations within a project on disaster risk management. 2. Presence of potential insurance distribution channels. The Microinsurance Regulatory Framework now allows MFIs to become channels of microinsurance. There are more than 2,000 MFIs in the country with combined outreach of about 7 million people. Large MFIs (NGOs and banks) that cover the whole country also operate in the 4 pre-selected provinces. Many cooperatives are also operating in these provinces. 3. Socio-economic situation. There are around 2 million people (roughly households) in the four provinces that live under the poverty threshold and therefore, represent potential buyers for an insurance product. They can essentially be found in Iloilo and Leyte. The incidence of poverty and the incidence of food are strongly increasing from Cagayan to Iloilo to Leyte and to Agusan del Sur. 4. Exposure to and relevance of natural catastrophe risk. The provinces display a very diverse hazard profile. GTZ Microinsurance Innovations Program for Social Security (MIPSS), Philippines 7
8 a. Cagayan is extremely hazard-prone to droughts and floods / typhoons. Agusan del Sur and Iloilo are more prone to dry spells, but also to floods. Leyte is less prone to natural disasters. b. In terms of asset exposure, Cagayan and Iloilo have a high production value in rice and corn, but the greatest fraction of farming households can be found in Agusan del Sur. Exposure per hectare can rise up to P to P60 000, depending on the crop. c. Stronger natcat impacts in recent years, high exposure and missing capacities make the rice and corn sector highly vulnerable in Cagayan. Iloilo s rice farmers suffer big damages stemming from drought, whereas in Agusan del Sur and Leyte the most important damages arose in the rice production due to floods. Demand for insurance should arise according to these lines. d. Affected farmers incur losses from P2 000 to P per hectare, depending on the natcat, the crop and the province. This should determine the expected payout of an insurance scheme. Results of Household interviews and FGDs 1. Natcats are a #1 risk for poor households. They are very frequent events and entail large costs, especially for the agricultural sector. Many of households declare that they suffer at least once a year from a specific natcat. This is especially true for marginalized and very poor households living in areas where appropriate risk preparedness measures by government units are inexistent. More severe events happen every ten to 15 years. 2. The major hazards are typhoons, floods and drought with droughts generally causing the highest damage. For all these three hazards, farmers feel more at risk and incur generally three times higher losses than non-farming households. In particular, non-farming households feel barely risk-prone to droughts. This differentiation is explained by the fact that direct damage to households is very rare, but that farmers may lose large parts of their crops. Non-farming households suffer more from secondary effects through higher food prices and lower demand for their products (if they are not employed and receive a fixed salary). a. Iloilo is prone to typhoons, floods and drought, but the impact is more moderate than in other provinces. Drought plays an important role for farmers and fisher folks, whereas the residents in Iloilo City suffer from annual floods. A flood control project, however, shall solve this problem for the provincial capital this year. b. In Cagayan, especially typhoons, but also floods and drought affect large part of the population, with damages higher than in other provinces. The yield of farmers first harvest is generally threatened by long dry spell, whereas typhoons destroy big amounts of the second harvest. At the same time, the province is also focus point of risk mitigation and relief measures of the government and donor organizations. c. Leyte is prone to floods caused by continuous rainfall and/or typhoons, as well as landslides. People feel extremely at risk of these hazards, comparable to the situation in Cagayan. GTZ Microinsurance Innovations Program for Social Security (MIPSS), Philippines 8
9 d. In Agusan del Sur, low-lying areas near the Agusan River are frequently flooded, damaging especially farmers crops. These floods are triggered by moderate, but steady rainfall. 3. Natcat expose the households to risk in terms of assets and income. The typical respondent has a permanent asset exposure of about P175,000, where 75% accounts for the house and other assets are generally business assets (such as vehicles and livestock). Compared to richer people, however, the respondents have somewhat higher exposure in income than in (household) assets This might be deducted from the fact that the respondents possess less valuables (except for TVs) and investments are done either in business assets or in non-permanent goods (such as food, transportation and tuition fees). a. Farming households have a high reinvestment rate and have a relatively longer income turn over period. Therefore, there are high exposures after seeding up to harvest season. The income of one harvest is supposed to bring the family through the next cropping season. Therefore, a loss in crops might lead to extreme consequences for farming households. b. Non-farming households engaged in microenteprises and vending activities have a more stable income, a higher turnover and shorter income turn over periods, reducing thereby their exposure to possible impacts of natural catastrophes. 4. Risk preparedness is insufficient in most areas. As a result of the lack of appropriate infrastructure or risk mitigation plans offered by local government units, natcats affect families and their communities very frequently. State players have barely developed any capacities to mitigate risks in the provinces in such a way that people feel unprepared and abandoned. Whereas, seasonal climate forecasts and irrigation system help some people to a certain extent to cope with droughts. Floods and typhoons hit most communities with little warning and preparation. 5. Risk coping mechanisms. Most people manage the impact of natcats by borrowing money from friends, relatives or neighbours and to a lesser extent via savings. Formalized systems, such as insurance schemes or organized relief programs are rarely in place and are mostly considered as less effective. At the same time, the impact of natcats exceeds the capacities of these informal risksharing mechanisms, leaving people with major problems in repaying their loans. 6. High demand for natcat insurance. The interest in natcat insurance is high in all four provinces with Cagayan and Agusan del Sur displaying particularly high figures. In general, there is barely any difference in interest between farming and non-farming households, but the former are more likely to be interested in a multi-peril insurance and have higher demand in typhoon and drought insurance products. a. In Cagayan, 80% of all households would be interested in an insurance product for typhoons. Typhoons were also the primary concern during FGDs. However, one fifth of the farmers being interested in an insurance product would also like to have a protection against drought. b. In Iloilo, the picture looks less clear, as both typhoon and flood protection are nearly equally high in demand. At the same time less people than in other provinces would be interested in a natcat insurance product there and when offering a specific product (e.g. for the GTZ Microinsurance Innovations Program for Social Security (MIPSS), Philippines 9
10 protection against floods) only at most one half of the survey sample would show any interest. The FGDs revealed a somewhat different picture. Nearly all people were interested in a drought-insurance, especially farmers and fishermen. c. In Leyte, people had an interest in typhoon-related insurance products, but even protection schemes against flooding would be appealing to nearly one half of the respondents. d. Agusan del Sur displays a clear preference for flood-insurance products, especially among farmers. e. People having an idea of what insurance is and those who avail of insurance products have a bigger demand for a natcat insurance product. But even among those who are not aware of what insurance is there are still more than 80% interest in such a product. Taking the whole sample, 86% of the HH respondents are interested in buying an insurance product to protect them from the impact of natcats and 66% would like to insure their loans. f. Quiet surprisingly, even households reporting that they are not risk of a certain calamity are preponderantly interested in buying a natcat insurance product. About 70% of those saying not to be at risk of typhoons are interested in such a product. This finding supports the hypothesis that secondary impact effects play an important role in determining the demand. 7. Product preference. Pricing is the most important issues for most of the groups interviewed. Most are interested to have a natcat insurance product and that holds true across all four provinces, even though corresponding to their specific risk profile. The affordability, however, is the most important single factor that will determine whether a family will decide to purchase natcat insurance. Low premiums payable in accordance with the household s income schedule and high-frequent payouts make the product appealing to most of the households. a. In general, the premium amount should be between P80 and P500 per month with slightly higher willingness to pay in the province of Leyte (probably due to higher income in this subsample). Surprisingly, farming households would not be ready to pay significantly higher premiums, though being more affected by natcats. Those not interested in natcat products often argued that they were not able to pay the premiums, therefore emphasizing the relevance of low premiums for this market. b. Benefits are also a primary consideration. Participants in the FGD equate that the amount contributed should more or less be proportionate to the amount of benefit that they will receive. About 57% of the HH respondents prefer to receive payouts for calamities that occur frequently to payouts for severe calamities that seldom occur. Frequent as understood by most FGD participants means more or less every year. Farmers would like to have benefits around P20 000; others would expect an amount of about P When confronted with the challenge of setting up a financially sustainable product, people usually lowered the amount of benefits instead of increasing the premiums. c. System of distribution should not only be easily accessible with putting the client in the focus, but the insurance provider shall be trustworthy. It is important to note that NGOs, MFIs and cooperatives are not per se perceived as trustworthy entities. Respondents of the HH survey endow them with more trust than private companies, such as banks, private GTZ Microinsurance Innovations Program for Social Security (MIPSS), Philippines 10
11 insurers, and PCIC, but have more faith in barangay related institutions. The Philippine meteorological agency PAGASA is also considered as a relatively trustworthy organization. d. Information is also critical in successfully distributing natcat insurance. Most of the participants do have some basic understanding about the concept of insurance. But what seems to prevent them from availing insurance products (other than the price factor) is information where to get it and information on how it actually works. Only one quarter of the people interviewed availed of insurance products, especially for health and funeral preneed plans. This subsample tends more than others to be interested by natcat insurance products. e. Modality of transactions shall be easy. Having an agent collecting the money was the most preferred option among HH respondents, but others were also ready to go to the nearest insurance office if there is one near the market place. The results suggest that known concerns of trust, but also other obstacles, especially ignorance of how it works shall be addressed first before introducing such an insurance scheme. 8. Financial Literacy. Insurance protection is commonly understood by the FGD groups as a means of security against unforeseen events. Policyholders are receiving some form of benefit that will help their family to recover from incurred losses. Especially those being MFI clients or cooperative members were familiar with the basic concept. In the HH sample around 60% declared understanding the concept of insurance. Still, when probing deeper and asking about possible reasons why people buy insurance or how the payout process works answers were quite varied. Recommendations Designing a flexible, scalable, well timed, linked and simple product that is accompanied by inclusive education programs shall help to reduce the premium benefit gap. On the one hand, successful products from private insurance companies, such as St. Peter s Life plan, show that the poor are interested in well-designed products. On the other hand, even highly subsidized crop insurance products do not sell because they fail the poor s needs. On Product Design: 1. Products should be scalable. People look first on the premium before considering benefits. Premiums are affordable if they match other non-basic expenses and the survey shows that even those living under the food-threshold are willing to pay for insurance under certain conditions. 2. Payment schedules should be flexible. Target customers are more likely to purchase natcat insurance if premium payments are well within their natural or usual cash flow cycles. 3. Products shall have a good timing. Hazards have different probabilities to occur across the year. Exposures are unequally distributed in time as well. People are more attracted to products that cover high-exposure- and high-probability-of-hazards-periods. Marketing shall consider this timing as well. For instance, typhoon protection plans shall be marketed not earlier as shortly before the beginning of the typhoon season. GTZ Microinsurance Innovations Program for Social Security (MIPSS), Philippines 11
12 4. Payouts should be frequent. Target customers are interested in knowing whether the product works or not. Therefore, frequent payouts that is to say, at least every three harvest seasons, but at best in the first harvest season shall help to build up credibility and to attract customers. People have a high discount rate and expect fast returns. It is more important for them to have more, but small than little, but high payouts. 5. Products should be linked, for example to production loans, to group structures like coops/mfis and to savings products (bundle). 6. Consider smart subsidies. People expect returns when investing money. Even though insurance is considered as a tool to reduce risk, for most people it is also an investment that should guarantee good benefits. Subsidized products in the market (such as PhilHealth) have increased such expectations. The gap between the willingness to pay and the expected payout might be bridged via smart subsidies. In some sense, these subsidies are expected from the target population and might well be justified. It is important to clarify and make transparent the costs and benefits of subsidies before introducing them. A smart way of dealing with subsidies is by using risk-layering systems: the state might cover a certain risk-layer such as low-frequent and high-impact events, thereby reducing the risk for the insurer and ultimately the premium for the end client. 7. Lessen requirements. Natcat insurance should be available for everybody, but especially promoted for the poor by using corresponding distribution channels. Documentary requirements, if any, should be made simple and easy to understand and easy to accomplish and should be designed to match the literacy level of the poorest farmers. 8. Promote financial literacy first. Low-income groups need to be further educated on insurance and its importance. There should be a general insurance education program aimed at both the end client and the distribution channel. 9. Target the right pool of clients. Microinsurance products are not right for everyone, at least not at every time. When people fail to meet their basic needs because they lack sufficient infrastructure or when no risk mitigation projects have been developed to protect their community from frequent natcats, micro insurance might not be an appropriate solution. As a matter of fact, targeting communities with strong and active Disaster Coordinating Council or Planning and Development Officer might be a way of making sure that the insurance initiative is flanked by similar projects helping to protect the community. For instance, developing early warning system facilities and designing index-based insurance products might go hand in hand. On Product Distribution: Microinsurance is commonly provided by MFIs/cooperatives as a means of mitigating risks in case the borrower is unable to pay the loans because of unforeseen events. Accidents, illness in the family, death of family members or loss of livelihood due to fire or natural catastrophes often causes burdens on the family s finances. Credit life insurance products and/or micro-insurance are offered to provide the client a means for recovery in times of such unforeseen events. Insurance products have also become a source of competitive advantage for MFIs. Clients now choose their MFIs based on the services and benefits they provide and the insurance products offered by an MFI. MFIs have been known to compete on this basis. GTZ Microinsurance Innovations Program for Social Security (MIPSS), Philippines 12
13 1. The natcat insurance itself should be attractive, not only to the target clients but also for the insurance distribution channel. MFIs will most likely adopt or distribute such insurance product if there are also clear benefits that will be received at the level of the MFI. Offering such products will also entail costs in its distribution and therefore such distribution costs should be recoverable from the sale of the insurance product. 2. A certain degree of flexibility should be allowed at the MFI level to customize the delivery of the insurance product. At the distribution level MFIs are in the better position to determine the most appropriate timing or mode of payment to be made for the insurance premiums. 3. MFI networks may also play a role in the distribution for micro insurance products to achieve economies of scale. The MFI network can provide marketing and promotion support to its member institutions with regards to micro insurance. The MFI network can also provide meso level monitoring of product performance and provide the sector with research and information support not normally available at the MFI level. Capacity development support can also be another role MFI networks can play. GTZ Microinsurance Innovations Program for Social Security (MIPSS), Philippines 13
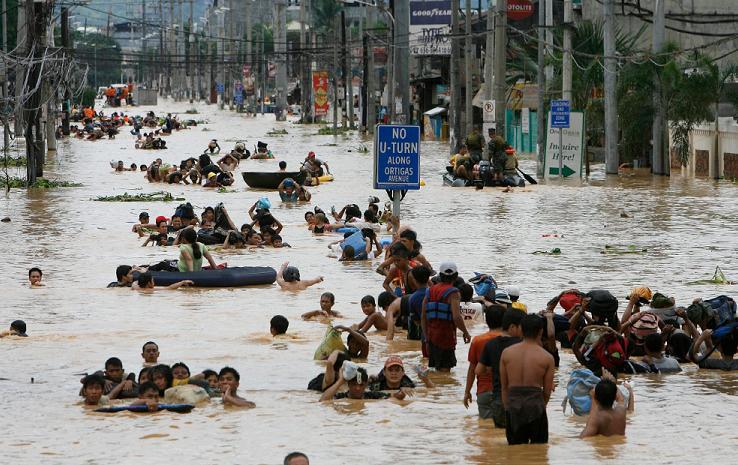
14 I. Background Due to its location along the western rim of the Pacific Ring of Fire and the Pacific typhoon belt, the Philippines is one of the world s most natural disaster-prone countries. In particular, it is vulnerable to typhoons, floods, landslides, droughts, volcanoes and earthquakes. When the tropical storms Ondoy and Pepeng struck in October 2009, the Office of Civil Defence estimated the damage to agriculture and infrastructure at close to P30 billion, that is roughly 0.25% of annual GNP (2008: P billion, IMF). Besides, there is an average of 25 typhoons hitting the Philippines every year. Finally, climate change is likely to increase the country s vulnerability to natural hazards because extreme weather conditions are predicted to hit formerly unaffected areas. The poor do not have access to natural catastrophes (natcat) insurance. In 2006, there were around 28 million poor people in the Philippines including 13 million women, 2 million farmers and some 0.5 million fisherfolks 1. There is no data on how many of the poor are covered by insurance schemes. However, it is known that roughly 5% of the Philippine adults (2.5 million) avail of micro insurance products, but these are generally confined to life, credit life and health insurance 2. Pure natural catastrophe insurance schemes are non-existent for the poor. Primary insurers are reluctant to go into the natcat business. The Philippines can count a few years of experience in providing micro insurance through mutual benefit associations (MBAs) and a number of cooperative insurers, as well as commercial insurance companies. Microfinance institutions (MFIs), rural banks and farmers organizations complement the range of common distribution channels. Financial institutions for the poor do not have sufficient access to portfolio insurance. The poor are very vulnerable to the impact of natcats and might unable to fulfill their obligations to their lending institution in case of an extreme event that affects their livelihood. This puts the MFIs and cooperatives loan portfolio at risk, especially if the natural catastrophe hits a large part of their clients. Credit defaults and withdrawing of saving deposits might undermine their financial performance. Stakeholders have joined hands to lay the groundwork for micro insurance. In response to these deficits on the supply side, stakeholders in the government and the financial sectors took up their work in early 2009 to lay the groundwork for a more comprehensive micro insurance provision. On January 29 this year, the government launched the National Strategy for Micro Insurance that defines the objective, the roles of the various stakeholders and the key strategies to be pursued in enhancing access to insurance by the poor. Concretely, it allows registered cooperatives and MBAs in addition to commercial insurers to engage into the provision of non-life insurance schemes, including products for the protection against natcats. The GTZ project Micro Insurance Innovations Programme for Social Security (MIPSS) has contributed to the groundwork development for Microinsurance. MIPSS is a 4- year BMZ funded with project components i. frame conditions for micro insurance; ii. micro insurance innovations; and iii. social protection in case of illness. Against this background, and within the frame of MIPSS, the BMZ (German Ministry for Economic Cooperation) has approved in mid-2009 the commission of 3-year public private partnership (PPP) between the German Technical Cooperation (GTZ) and Munich Re to develop natcat insurance products 1 National Statistical Coordination Board, Philippine Poverty Statistics, 2006 estimates 2 Department of Finance, Philippines GTZ Microinsurance Innovations Program for Social Security (MIPSS), Philippines 14
15 targeted at the poor. By using a parametric trigger these products should overcome obstacles of traditional insurance schemes. Based on the criteria of data availability, risk exposure, distribution channels and socio-economic profile four provinces have been pre-selected to pilot the micro insurance products. The presentation of the findings comes in two parts. First is a description profile of the pre-selected provinces following analysis of secondary data. The second part presents the results of the household interviews and FGDs. The second part supplements the information and analysis provided provincial profiles. II. Objectives of the Study First, it shall complement the pre-selection process. Second, it shall generate information and analysis of demand for micro insurance products against natural catastrophes in the pre-selected provinces that will serve as an input to the detailed in-depth assessment. III. Methodologies of the Study The Study employed the methodologies of household (HH) surveys with structured questionnaires and focus group discussions (FGDs) with potential microinsurance clients. Intensive reviews of secondary data that are describing the 4 pre-selected provinces were conducted prior to the field work. The survey was conducted in three to four municipalities in the pre-selected provinces of Agusan del Sur (Mindanao), Cagayan (Luzon), Iloilo and Leyte (Visayas). The target populations were members of cooperatives, farmers, micro-entrepreneurs and other residents in the areas visited belonging to the low-income sector (class C, D and E) and are prone to the effects of natural calamities. The HH questionnaire is structured into four main parts about i. HH information and economic activities, ii. access to credits, iii. risks, iv. access and interest in insurance. The first parts aim at obtaining data on the HH s exposure in terms of assets and income, and her vulnerability. The second part is dedicated to the HH s (obstacles to) access to credits. How different hazards affect the HH s budget and how HHs cope with these risks shall be clarified in the third part. Finally, questions of familiarity with insurance, interest in natcat insurance products and issues of product design are addressed in the last part. Table 1 provides the profile of survey respondents. Table 1 Profile of Respondents Province/# Municipalities # of HH Respondents # of FGDs (Ave Pax per FGD = 10) Sector of Participants Leyte / 4 Municipalities 94 7 Clients of banks, coops; students Iloilo / Clients of NGO-MFI; local residents Cagayan / Clients of banks and coops Agusan del Sur / Local residents, farmers Total = 4 Provinces = 14 Municipalities GTZ Microinsurance Innovations Program for Social Security (MIPSS), Philippines 15
16 IV. Analytical Framework The UNDP report on reducing disaster risk constitutes the main reference of this report, as it cuts down the notion of risk into the concepts of hazards, exposure and vulnerability. This objective framework is adapted to allow for integrating the subjective perception of risk. Risk perception constitutes the driving force for demand, but several constraints might shape this demand as well, such as financial literacy and product design. Risk = Hazard x Exposure x Vulnerability. UNDP s report A Global Report Reducing Disaster Risk: A Challenge for Development, published in 2004, presents a conceptual model to grasp the notion of risk. Accordingly, disaster risk is not caused by hazardous events per se, but rather is historically constructed through human activities and processes. For an extreme physical event to be hazardous, by definition there has to be a subject to experience the hazard. But pure physical exposure is insufficient to explain different risk patterns across countries. For a given exposure the impact of a hazard can vary and depends largely on the underlying vulnerability. Some individuals and/or assets are more vulnerable than others and may therefore be more or less at risk. As a matter of fact, coping capacities and adaptive capacities, which shape vulnerability, are unequally distributed across societies and individuals and may explain large parts of differences in death tolls and damage reports resulting from disasters. In mathematical terms, the concept can be stated as follows: Risk = Hazard x Exposure x Vulnerability Different indicators are used to measure the three factors. Theoretically, the proposed formula can be used for different contexts, such as risks stemming from illness and man-made catastrophes. For our purpose, we define hazards as natural disasters, such as earthquakes, typhoons/tropical storms, droughts, volcanic eruptions, landslides and floods. The distinction between typhoons and floods is difficult in the Philippine context, as most floods are caused by continuous rainfall that usually goes together with strong wind. The physical exposure is generally measured by calculating the population living in a given exposed area. This notion is helpful when focusing on the risk of death, but it neglects the social and economic impacts of natural hazards, such as injuries and damage to assets (infrastructure, crops). In this report, we refer to the notion of exposure as expressed in terms of assets and number of the poor. The concept of vulnerability is more difficult to grasp. Quantitatively, the relative vulnerability can be calculated by dividing the damage/people killed by the value/number exposed. More interesting, however, might be to identify (absolute) vulnerability indicators. Vulnerability depends on the sociopolitical-economic context of the exposed population as well as on the hazard in question. For instance, national indicators can include GDP, the Human Poverty Index, the Human Development Index, literacy rate and the relative number of radios (to assess early warning capacity). In our study, we try to approach the notion of vulnerability by the income per household, occupation, access to financial services and the efficiency of coping mechanisms. Exposure to and relevance of risk are related, but two different concepts. While the concept of exposure to risk per se is a more objective notion that can partly be captured by quantitative methods, the relevance of risks is a more subjective idea and relies on the perception of the individual. Some risks may have a large impact in terms of socio-economic losses, but may not be perceived as relevant. The GTZ Microinsurance Innovations Program for Social Security (MIPSS), Philippines 16
17 perception is influenced by the individual s environment and cognitive capacities. The former is crucial in evaluating the disaster s impact and the latter shape to what extent people are able to recall memories of disasters. In the end, demand for micro insurance products depends largely on the relevance of risks and only directly on the exposure to risks. For instance, demand for insurance products is supposed to be higher immediately after the impact of catastrophes when memories are still fresh, even though the exposure to risk might have not increased. It should be noted that this concept correlates with the exposure to risk as it is about the people s experience on the nature, extent, frequency and impact of unpredictable risks. And it also takes into account the existence of coping and adaptation strategies, but the concept adds a further layer in form of subjective perception. While some statistics will be presented on the exposure to risk, this survey focuses on the question of risk perception, therefore adapting the UNDP approach. Several constraints might shape the demand for natcat micro insurance, such as financial literacy and product design. Risk perception constitutes the driving force for demand. Still, whether people will eventually be interested in purchasing a product depends on several side-constraints. Having access to information and understanding these products is an essential aspect. Even though credit and saving services are popular among the poor in certain areas especially where MFIs have a high penetration rate insurance products are still terra incognito for most low-income households. And finally, the product design itself should match the needs and expectations and correspond to the payment capacities of the potential buyers and thereby stimulate their demand. This study tries to acknowledge these two conditions by analyzing them in a separate chapter. Figure 1 Analytical Framework Demand for Insurance Financial Literacy Perception of Risk Product Design Exposure to Risk GTZ Microinsurance Innovations Program for Social Security (MIPSS), Philippines 17
18 V. Part 1 Profile of the pre-selected provinces The provinces of Cagayan, Iloilo, Leyte and Agusan del Sur were pre-selected on the following criteria: 1. Availability of geo/weather-data 2. Presence of potential distribution channels 3. Exposure to and relevance of natural catastrophe risk Intensive review of secondary data might draw the following general observations: There are around 2 million people (roughly households) in the four provinces that live under the poverty threshold and therefore, represent potential buyers for an insurance product. They can essentially be found in Iloilo and Leyte. The incidence of poverty and the incidence of food are strongly increasing from Cagayan to Iloilo to Leyte and to Agusan del Sur. Cagayan is extremely hazard-prone to both droughts and floods / typhoons. Agusan del Sur and Iloilo are more prone to dry spells, but also to floods. Leyte is less prone to natural disasters. In terms of asset exposure, Cagayan and Iloilo have a high production value in rice and corn, but the greatest fraction of farming households can be found in Agusan del Sur. Exposure per hectare can rise up to P to P60 000, depending on the crop. Stronger natcat impacts in recent years, high exposure and missing capacities make the rice and corn sector highly vulnerable in Cagayan. Iloilo s rice farmers suffer big damages stemming from drought, whereas in Agusan del Sur and Leyte the most important damages arose in the rice production due to floods. Demand for insurance should arise according to these lines. Affected farmers incur losses from P2 000 to P per hectare, depending on the natcat, the crop and the province. This should determine the expected payout of an insurance scheme. 5.1 Availability of geo/weather-data Since the project s idea is to design an index-based insurance scheme sufficient data on climate phenomena was a pre-condition in selecting the provinces. This data is used to design an index that captures very well the correlation between the calamity and the damage caused to the insured population. With such a parametric insurance product claims are settled based on the index and not on individual damage assessments. For instance, information on rainfall and wind speed might help in assessing the strength and impact of typhoons. Despite new technologies and remote sensing via satellites, ground-based device is still indispensable to obtain reliable data. In the Philippines, the main reference for weather stations is PAGASA, the Philippine Atmospheric, Geophysical and Astronomical Services Administration. The following table displays the number of weather stations in the pre-selected provinces. GTZ Microinsurance Innovations Program for Social Security (MIPSS), Philippines 18
19 Table 2 Weather Stations in pre-selected provinces Weather stations Synoptic station/agromet station/automatic station* Rainfall Water level Radar Iloilo Province Cagayan Province Leyte Province Agusan del Sur Iloilo, Cagayan and Leyte display a relative dense system of weather stations. In contrast, Agusan del Sur is not equipped at all. Recent efforts have modernized the equipment of weather stations. In 2009, the Korean International Cooperation Agency (KOICA) installed a modern set of rainfall and water level stations in Iloilo after the last flood in order to improve the early warning system. A similar project covered the Magat River in Isabel province, one of the main confluents of Cagayan River. According to PAGASA plans to extend the early flood warning system to Cagayan itself are currently developed. In Leyte, GTZ has equipped several municipalities with digital rainfall stations within a project on disaster risk management. 5.2 Presence of potential distribution channels According to the new regulatory framework on micro insurance, institutions engaged in microfinance activities, primary cooperatives and rural / thrift / cooperative banks can be licensed to sell micro insurance products. Even though they might not act as risk carrier, they can market products to their clients. MFIs have a strong penetration rate in some municipalities. One should consider the fact that most MFIs only serve one, at most two individuals per household. In the Philippines, a typical household comprises approximately 5 individuals. Therefore, one might multiply the number of clients by 5 to obtain the number of households reached by MFIs. Finally, the PCFC database only includes lending institutions that borrow capital from PCFC. Even though this is mostly the case for bigger MFIs, some locally operating MFIs are not listed and the actual number of covered households is probably higher. 5.3 Exposure to and relevance of natural catastrophe risk HAZARD This study focuses on the impact of natural hazards, in particular typhoons/floods and drought. In a first step, these hazards should be identified in their sole dimension of climate and geological events; that means without considering their impact. The following table displays information published in the 2005 study Mapping Philippine Vulnerability to Environmental Disasters by Manila Observatory. GTZ Microinsurance Innovations Program for Social Security (MIPSS), Philippines 19
20 Table 3 Vulnerability to Environmental Disasters Hazards Cagayan Iloilo Leyte Agusan del Sur Typhoon Incidence Very high Low Medium Very low Historical Rainfall Increase mm 0 mm 0 mm 0 mm Historical Temperature Increase > 0.5 C > 0.2 C 0.2 C < 0.5 C > 0.2 C Decrease in Rainfall Due to El Very low Low to Medium High Niño Medium Earthquake: Magnitude Very low Low Low High Earthquake: Hits Very low Very low Very low Medium The provinces display a very diverse hazard profile. Cagayan s fate combines several hazards: It is frequently hit by typhoons and in recent years an increase in rainfall and temperature suggests that it faces periods of severe flooding and long dry spells. Agusan del Sur, on the other hand, is not hazard-prone to typhoons, but more to water shortage due to decreases in rainfall. In addition, strong earthquakes frequently hit the province. Iloilo and Leyte, finally, display a more moderate picture, with low and medium, respectively, incidence of typhoons and decreases in rainfall. As a consequence, the areas are supposed to suffer less from natural hazards than the other two provinces. According to the report, climate change in the Philippines is supposed to have two strong effects: First, the path of typhoons shall move more to Northern provinces, that is away from the Visayas and more to Luzon. Second, Mindanao is going to experience more dry years. Unfortunately, the study does not contain any information on the strength of the typhoons. Another pitfall of the analysis is that it does not capture local disasters, such as flash floods, that only occur in river-near areas. EXPOSURE The exposure to natural disasters can be measured in different ways, depending on the subject of interest. In general, one might distinguish between the number of people and the assets in a specific area. The following table presents information on social indicators. Table 4 Social Indicators (NSCB, 2006) Pre-selected Provinces Poverty Threshold Poverty Incidence Magnitude of Poor Population Food threshold Subsistence Incidence Magnitude of Subsistence Poor Magnitude of poor that are not subsistent poor Overall population Iloilo 14,810 30% 641,619 9, % 249, ,569 2,110,588 Cagayan 12,928 23% 247,764 9, % 89, ,741 1,072,571 Leyte 13,919 47% 814,523 9, % 394, ,177 1,722,036 Agusan del Sur 14,544 56% 342,509 10, % 206, , ,447 GTZ Microinsurance Innovations Program for Social Security (MIPSS), Philippines 20
21 Since the project focuses on the poor population the number of people living under the poverty threshold 3 is the critical figure. The four provinces display a very diverse picture. From North to South the incidence of poverty increases, reaching more than half of the population in Agusan del Sur. In addition, the fraction of poor people living under the food threshold 4 is also twice as high in Agusan del Sur as in Cagayan and Iloilo. Around 2 million people in the visited four provinces live under the poverty threshold. On the other hand, nearly 1 million poor have less income than necessary to meet the basic food requirements. Whether these people have enough income to buy insurance products for the protection against natural catastrophes is questionable, but this survey is going to shed some light on this question. It is supposed that rural areas have a higher poverty incidence than in urban municipalities. Even though the data is suggestive in this respect, it must be noted that the poverty threshold used in this table is a provincial indicator, that is potential heterogeneity in expenditure requirements across municipalities is not considered. Therefore, it probably underestimates (overestimates) the poverty magnitude in urban (rural) areas. There are several indicators to determine the exposure of assets to natural catastrophes. There is no reliable statistical information on the value of infrastructure in the Philippines (the second part of the survey tries to estimate some of these numbers). However, one might try to approximate the value in different ways. Catastrophes can hit private assets, such as homes, but also assets for business purpose, such as stores, tricycles and crops. The authors were unable to obtain data on costs for business assets in urban areas. For rural areas there exist some estimates that are presented in the succeeding tables. Most households in rural areas depend at least partly on farming. In Agusan del Sur, nearly three out of four households engage in agricultural activities. And a similar pattern can be observed in Cagayan, even though relatively more households receive income from fishing and the fraction of non-farming households is greater. Even though agricultural activities constitute generally only one source of income among others, it is often the most important one. In the Philippines, there are nearly 5 million farms 5. The number of subsistence farmers is not known, but most of them plant rice (palay) and in some provinces corn. For this reason, the statistics concentrate on these commodities. The value of annual production and damage of these two crops might approximate the exposure per province. Table 5 Rice and Corn Production Value Production value in Million Pesos (BAS, 2008) Cagayan Iloilo Leyte Agusan del Sur Rice 10,330 17,250 7,779 2,230 Corn 4,588 3, Cagayan and Iloilo are one of the major rice baskets in the Philippines. As a matter of fact, Iloilo s current production capacity in rice and corn is more than P20 billion per year (that is around P per capita). The production of rice and especially corn plays a minor role in Leyte and Agusan del Sur. 3 The poverty threshold is defined as the minimum income/expenditure required for a family/individual to meet the basic food AND non-food requirements. National Statistical Coordination Board (2003) 4 The food threshold is defined as the minimum income/expenditure required for a family/individual to meet the basic food requirements. 5 Agricultural and Fishery census 2000 GTZ Microinsurance Innovations Program for Social Security (MIPSS), Philippines 21
22 Breaking down the data to individuals is helpful in identifying the exposure per capita. In the end, it is individuals who are hit by catastrophes and therefore understanding their exposure is an important step. In the Philippines, smallholder farmers are typically defined as those having less than seven hectares. Most poor farmers have even less, typically around one and two hectares. Generally, there are two harvests per year. Given this, one can calculate the gross income per hectare for the four provinces: Table 6 Rice and Corn Yield and Income Per Hectare Yield per hectare (2008, metric ton per hectare) Cagayan Iloilo Leyte Agusan del Sur Rice Corn Income per hectare (pesos, 2008 prices) Rice 45,987 59,360 56,877 38,389 Corn 39,998 41,248 17,180 23,914 This rough average shows that income per hectare varies strongly between provinces. In Agusan del Sur, low prices lead to incomes of less than P40 000/ha for rice and roughly P24 000/ha for corn, whereas high prices and good yields lead to nearly P60 000/ha and P41 000/ha, respectively, in Iloilo. In general, rice farmers have a higher gross income than corn farmers for a given size. These numbers show what is at stake when there are natural catastrophes like typhoons or droughts destroying part of sometimes even the whole crop 6. As mentioned above, there are no numbers to assess the exposure in urban areas. The household survey was conducted in both urban and rural areas to address this shortcoming. VULNERABILITY: The concept of vulnerability tries to explain differences in death tolls and damage across regions, even when taking into account variations in exposure and hazard. Since we have poor data on the strength of the hazards, we have to restrict ourselves to the concept of relative vulnerability, which is the damage divided by the exposure. When we see differences in relative vulnerability this can be due to either different strengths of hazards or different capacities in coping with the hazards. It is beyond the scope of this study to distinguish between these two effects. Nevertheless, the relative vulnerability might act as a proxy indication to how vulnerable the different provinces are with respect to various hazards. Besides, it relates the damage to the production potential and therefore describes the financial impact in relative terms. Once more, we refer to the vulnerability of the agricultural sector due to data constraints. 6 The amount of the disaster-induced loss depends strongly on the growth stage. GTZ Microinsurance Innovations Program for Social Security (MIPSS), Philippines 22
23 Table 7 Relative Vulnerability Relative Vulnerability (average, ) Cagayan Iloilo Leyte Agusan del Sur Corn Overall 22.65% 0.00% 0.19% 5.15% Flash floods & Typhoons 13.29% 0.00% 0.15% 4.43% Drought 9.33% 0.00% 0.03% 0.64% Rice Overall 9.60% 1.87% 0.36% 3.21% Flash floods & Typhoons 7.21% 0.56% 0.31% 1.50% Drought 2.21% 1.28% 0.00% 0.67% The provinces of Cagayan, Leyte and Agusan del Sur are generally more vulnerable to flash floods and typhoons than to droughts. Iloilo, on the other hand, looses a higher percentage of its rice production to drought than to typhoons. Even though Iloilo is a big corn producer, its cornfields are barely vulnerable to the impact of neither typhoons nor droughts. This is in contrast with the situation in Cagayan, where annually more than one fifth of the potential corn production is completely lost. And even for rice this number is relative high. Given this extreme vulnerability the question whether corn (and rice) production is still a financially sustainable activity arises. Leyte is clearly less vulnerable than the other provinces and losses typically accrue to less than 1% of annual production. In Agusan del Sur, corn is more vulnerable than rice, but it must be noted that the corn production is very low. All in all, the four selected provinces display a very diverse picture in terms of vulnerability. RISKS: The realization of risks can be measured in death tolls and damage. Missing comprehensive and reliable data on death tolls and damage to non-agricultural assets, we only refer to the crop damage reports released by the Bureau of Agricultural Statistics (BAS). They show clearly that droughts and flash floods/typhoons are the most devastating hazards for farming. By restricting ourselves to the rural sector we neglect risks in urban areas, such as landslides and earthquakes. The household survey in the second part of this study shall try to shed some light on this issue. The following table displays the loss for the total of rice and corn production from 1991 to 2008 organized by province and natcat category. GTZ Microinsurance Innovations Program for Social Security (MIPSS), Philippines 23
24 Table 8 Rice and Corn Damage (BAS 2008 Damage Report) Damage in Million Pesos (Rice & Corn, 2008 Prices) Flash floods Typhoons Cagayan Iloilo Leyte Agusan del Sur Year , , , , , , , , Damage in Million Pesos (Rice & Corn, 2008 Prices) Drought Cagayan Iloilo Leyte Agusan del Sur Year , , , Damage in Million Pesos (Rice & Corn, 2008 Prices) All Causes Cagayan Iloilo Leyte Agusan del Sur Year , , , , , , , , , , Cagayan Province suffers big losses every year especially due to typhoons and drought. Noteworthy is the trend in recent years that losses usually exceed P1.7 billion. Droughts and typhoons play both a role in this increase. Even though data for 2009 is not yet available, one can suppose that damages have reached another record because three big typhoons ( Pepeng, Ondoy and Ramil ) hit Northern Luzon last year. Typhoons hit Cagayan on an annual basis, but droughts are somewhat less frequent. Severe years are typically El Niño years (1998 and 2005). For the considered period the average amount per year rises up to P1.3 billion (or more or less $25 million). To sum up, Cagayan is hit by strong and very frequent disasters and they cause a high amount of damage. Somewhat surprisingly, the province failed in a certain sense to adapt to these extreme events. The high vulnerability patterns show clearly that the agricultural sector has not developed sufficient capacities to cope with natcats. On the other hand, the fact that Cagayan is one of the richest provinces in the Philippines might show that farming generates sufficient benefits in spite of high natcat damages. GTZ Microinsurance Innovations Program for Social Security (MIPSS), Philippines 24
25 In comparison with Cagayan, other provinces are relatively less affected by typhoons and droughts. Leyte is safe from droughts and Agusan del Sur suffered only twice losses due to long dry spells. This is remarkable given the fact that droughts are supposed to be very severe in Mindanao. Iloilo, on the other hand, is heavier affected by droughts than by typhoons. In dry years, damages typically rise above P150 million, whereas typhoons cause usually not that much damage. One exception is typhoon Frank in Floods (and typhoons) hit Agusan del Sur and Leyte especially in the 90s, but also in recent years. However, the damage was clearly smaller than what could be observed in other provinces. A final table might illustrate the damage on an individual basis, at least for rice and corn farmers. It is not possible to obtain damage data at farm level, but the crop damage reports include information on area affected. Conditioned on being an affected area, the following numbers reveal information on the average damage per hectare. Table 9 Damage to Rice and Corn Per Hectare (BAS, 2008) Damage per hectare (in Pesos, conditioned on being affected) Corn Rice Cagayan Iloilo Leyte Agusan del Sur Overall 10,367 2,827 2,475 6,084 Flash floods & Typhoons 9,614 3,182 2,475 7,282 Drought 13,261 1,939-3,181 Overall 11,205 6,810 6,955 7,572 Flash floods & Typhoons 10,736 4,145 7,721 7,206 Drought 15,148 11,160-8,375 The average damage is generally 10% to 25% of the overall production, depending on the province and the crop. It is interesting to see that drought has generally a more severe impact than floods and typhoons. These statistics shall help to clarify the expectations of a possible insurance coverage. For instance, a rice farmer cultivating two hectares in Cagayan and who are affected by drought might ask for a payout of about P to cover his losses. VI. Part 2 Findings and Analysis of Household Interviews and FGDs 6.1 Natcat Risk Exposure and General Vulnerability The household respondents and FGD participants have an important natcat risk exposure in terms of assets and income. The typical respondent has a permanent asset exposure of about P , where 75% accounts for the house and other assets are generally business assets (such as vehicles and livestock). Compared to richer people, however, the respondents have somewhat higher exposure in income than in (household) assets This might be deducted from the fact that the respondents possess less valuables (except for TVs) and investments are done either in business assets or in non-permanent goods (such as food, transportation and tuition fees). Farming households have a high reinvestment rate and have a relatively longer income turn over period. Therefore, there are high exposures after seeding up to harvest season. The income of one harvest is GTZ Microinsurance Innovations Program for Social Security (MIPSS), Philippines 25
26 supposed to bring the family through the next cropping season. Therefore, a loss in crops might lead to extreme consequences for farming households. Non-farming households engaged in microenteprises and vending activities have a more stable income, a higher turnover and shorter income turn over periods, reducing thereby their exposure to possible impacts of natural catastrophes. For natural catastrophes to have impact on people s livelihood, there must be physical exposure, either in terms of people (usually measured in number of people living in a certain area) or in terms of economic losses (usually measured in money value). Since the insurance product shall not be a life insurance, our approach focuses on the second concept of exposure in terms of economic losses. To be more precise, we concentrate on natcat exposures to: Household assets (for instance, damage to houses) Business assets (for instance, crop losses) Business income (for instance, losses brought about by lack of demand from the people/public affected by natcat who are short of money to spend). Theoretically, two different proxies could be used to measure the three exposures. The value of household assets shall determine the first exposure. The value of (business) assets and income (not added up, but in comparison) shall help to shed light on the size of direct business losses. And finally, the value of income might approximate the extent of possible losses through lack of demand. The challenge of attaching a value to these different proxies might be solved in the following way. First, the emphasis is given to the estimate of the household itself because we are interested in their own perception and how they evaluate their own assets. Second, we refer to more objective numbers based on market values to correct for possible strong biases in the household s estimates. The value of assets and especially income are not static, but undergo strong fluctuations throughout the year. This concern shall be addressed by analyzing low- and high-income months, as well as highexpenditure months. Changing exposures (for the same household, but also across households) have a direct effect on the risk of natural catastrophes. In months with low exposure, natcats shall have a lower impact than in high-exposure months. Based on this analysis, we refer directly to the question of general vulnerability. The extent of vulnerability, defined as the inverse of coping capacity, might be determined by the household s endowment, but also on how she cope up with seasonal income fluctuations. Natcats are supposed to result in strong volatilities in income and expenses. Therefore, understanding how households deal with normal fluctuations and whether these mechanisms are sustainable or fragile shall help to identify the impact of natcats. GTZ Microinsurance Innovations Program for Social Security (MIPSS), Philippines 26
27 Risk Exposure to Household Assets The first table displays the distribution of assets and the typical median value. Table 10 Asset Values Asset Values % Average Value Median Value Mean Asset Value per HH House 93% 553, , ,178 Heavy Livestock 25% 21,140 16,000 3,862 Small Livestock 58% 4,353 1, Farm machineries 7% 64,224 40,000 2,759 Vehicle 23% 63,479 45,000 9,949 Other 2% 13,486 14, Fridge 37% 9,771 8,000 2,888 Bathroom 83% 3,403 2,500 1,998 TV 73% 6,986 5,000 3,529 Radio 38% 2,792 1, Phone 7% 1, Cell 78% 3,753 2,000 1,513 PC 5% 24,765 25,000 1,166 A majority of the respondents own their house or occupy a free house without paying any rent. Typical household assets include TVs and cell phones, less common are fridges or radios. The high numbers on heavy and small livestock suggest that many respondents depend on agricultural activities and some possess even farm machines (tractors, fishing boats). A little bit more than 20% own vehicles, especially bicycles, tricycles and motorcycles. The median value of the different assets gives some hints about the exposure. For the respondents, the house itself was clearly the most valuable asset, even though the amount of P (ca. $3000) might be somewhat too high. The two most common and valuable household assets are TVs and cell phones that cost around P Risk Exposure to Livelihood or Business Assets For farm activities, livestock (and to a lesser extent farm machineries) are important assets. Heavy livestock (carabaos and horses) is especially used for plowing the field, whereas small livestock is mostly possessed on a more temporary basis to generate income through selling. The cost of inputs for cropping is also a crucial asset that is not reflected in this table. Rice farmers participating in the FGDs confirm that seeds and fertilizer might cost between P and P per hectare, depending on the variety (footnote: In a recent crop damage report the Bureau of Agricultural Statistics estimates the value of seedlings to P per hectare). A typical field size for farmers we talked with ranged between one and two/three hectares. Therefore, the cost of inputs represents a big investment for farmers. GTZ Microinsurance Innovations Program for Social Security (MIPSS), Philippines 27
28 Especially in urban areas business assets include vehicles to take passengers from A to B. Tricycles (motorcycles) are very common in the Philippines and many people earn their living as tricycle driver. Such a motorcycle with a sidecar might cost between P and P However, it must be noted that not all tricycle drivers own their bike. A cheaper version is pedicabs (pedal cabs) that cost up to P Women are generally involved in trading activities, either of agricultural products on markets, or in sarisari stores (variety stores). Such sari-sari stores are very common in the Philippines and are either built within the house or as a small pavilion. Such stores can cost around P and merchandise capital might go up to P When compared to discussions with market vendors these numbers display the upper bound. For instance, traders in Abuyog, Leyte, confirmed that they only possess a little pushcart and buy fruits and vegetables with daily loans, therefore reducing the exposure. Besides the large part being involved in the agricultural sector (especially rice farming), many male respondents earn their livelihood as labourer (e.g. construction worker) or do other work (e.g. tricycle driver). As described above, women generally stay at home or run small shops. Other activities women practice includes clothes washing, small manufacturing and housekeeping. Splitting down the sample into the four provinces reveals that especially farming households were interviewed in Leyte, whereas Iloilo has the highest fraction of non-farming households 7. This is because one of the three covered areas was the capital, Iloilo City (fn: Cagayan s capital Tuguegarao was also included in the sample, but it is a smaller town and does also give home to many farmers.). All in all, the number of farming households is too low and does only correspond in Cagayan to the actual percentage. Risk Exposure to Household Income Table 11 Family Income and Expenditure per Province (Monthly) Monthly Income & Expenditure per province (Peso) Income Expenses Iloilo 6,457 5,417 Cagayan 14,544 7,477 Leyte 19,477 15,944 Agusan del Sur 8,631 6,504 Income and expenditure patterns in our sample vary across provinces, but this might be more due to the selection of households than to the provinces itself. Especially the figures for Leyte appear quite high. 7 Farming households are defined as households where at least one member declares being involved in an agricultural activity or where at least one income source is from agricultural production/livestock breeding. Households that are not farming households are non-farming households. GTZ Microinsurance Innovations Program for Social Security (MIPSS), Philippines 28
29 Table 12 RURAL Household Income and Expenditures Household Income Rural Household Expenditure Rural Sources # Median Mean HH/Mo. Sources # Median Mean HH/month Permanent Job 56 6,000 1,349 Education 196 1,500 1,148 Temporal Job 86 4,500 1,554 Business 149 5,000 2,910 Trade Activities 59 6,000 1,422 House rental Service Provision 16 2, Medical Production Activities 20 5, Food 246 3,000 2,883 Agriculture Production ,000 6,466 Utilities Livestock Breeding 83 5,000 1,667 Transport Pension 6 5, Leisure Social Benefits 24 1, Loan 132 1, Money from abroad 30 5, Miscellaneous Money from PH 33 3, Others Table 13 URBAN Household Income and Expenditures Household Income URBAN Household Expenditure URBAN Sources # Median Mean HH/Mo Sources # Median Mean HH/Mo. Permanent Job 68 7,000 2,300 Education 188 1, Temporal Job 93 4,000 1,797 Business 124 2,500 1,348 Trade Activities 34 4, House rental Service Provision 26 4, Medical Production Activities 10 7, Food 224 2,350 2,289 Agriculture Production Utilities Livestock Breeding Transport Pension 11 4, Leisure Social Benefits 15 1, Loan 114 1, Money from abroad 27 5, Miscellaneous Money from PH 29 2, Others 1 2, More revealing for understanding the different exposures is to distinguish between (typical) farming and (typical) non-farming households. Overall, the former display a higher income and higher expenditures than the latter. When comparing the different categories it becomes clear that the main part of income is generated through farming, that is around P per month, or P per main harvest. The numbers from the survey are in line with those reported during the FGDs and in the database of the BAS. At the same time, farmers have higher business expenditures because they have to invest several thousand pesos twice a year to buy inputs. In general, farming households have more family members, which justify higher expenses for food, education, utilities and transport. Throughout the provinces, the data for farming households displays a stable gap between monthly income and monthly expenditures. GTZ Microinsurance Innovations Program for Social Security (MIPSS), Philippines 29
30 Given the fact that leftovers at the end of the month were smaller than the gap (below P1 000) and similar for farmers and non-farmers, we could think of two alternative explanations: First, income for farmers varies significantly throughout the year and this makes it difficult for the respondent to report an average value per month; second, respondents tend to report normal, or expected incomes. In reality, however, harvest income might be lower due to the impact of natural catastrophes. Looking at the distribution of income throughout the year, one realizes that the interactions between different income groups are more complex. The communities / areas visited are largely agriculture based communities and the local economy is greatly dependent on the agriculture sector s performance. Good harvest results to more economic activities in the area benefiting not only the farmers and traders, but also local entrepreneurs and residents who profit from the increased spending and consumption of various goods and services. Cash flow is high during and in the month following harvest season and low during the planting season. Planting seasons vary slightly from each province visited depending on the weather patterns. Farmers do land preparation and planting during the rainy season, commonly during the months of December, January to February and June to August. Cash flow patterns of farming communities are the same across all the provinces visited. There is increased spending during harvest months when cash flow is high and lesser spending as farmers wait for harvest season. During harvest season, farmers are able to spend more for basic goods such as food. For example, the type of dietary intake is different as they tend to spend more for meat products during high-income months compared with low-income periods. Micro-entrepreneurs in town centers or market areas had more stable income during the year. These types of participants had high incomes during non-harvest season as farmers buy items to trade in their community such as vegetables, basic goods, and even rice. But income is higher when farming communities start to spend for more non-essential goods during harvest season. GTZ Microinsurance Innovations Program for Social Security (MIPSS), Philippines 30
31 These general findings might be illustrated by income patterns of the province of Iloilo. Table 14 Household Income Patterns, ILOILO Household Income Patters ILOILO Province Farming Households (including Livestock) Non-Farming Households Livestock Most Less Highest Most Less Highest Most Less Highest income Income Expenditure income Income Expenditure income Income Expenditure Jan 10% 5% 5% 8% 4% 7% 4% 6% 5% Feb 3% 6% 4% 5% 3% 3% 6% 2% 9% March 5% 13% 6% 5% 5% 6% 2% 2% 5% April 1% 10% 7% 8% 8% 2% 4% 12% 2% May 2% 9% 7% 5% 6% 11% 18% 10% 9% June 3% 10% 14% 3% 12% 19% 2% 18% 20% July 4% 10% 8% 2% 16% 9% 0% 16% 16% Aug 3% 25% 6% 3% 27% 4% 2% 20% 9% Sept 15% 6% 4% 5% 9% 1% 14% 6% 0% Oct 13% 1% 4% 10% 3% 3% 6% 2% 0% Nov 12% 1% 3% 10% 0% 5% 10% 0% 2% Dec 24% 0% 29% 31% 2% 28% 24% 0% 20% None 5% 5% 4% 6% 4% 4% 6% 6% 2% Iloilo displays two pronounced climate seasons, reflected in the income patterns. During the wet season from September to January/February farmers can plant and harvest simultaneously with potentially up to three harvests. The rest of the year, the weather is very dry and only a few vegetables can be cultivated. The income of farmers is correspondingly distributed with high incomes during harvest season and low incomes during hot season. Non-farming households, however, display a more stable income pattern. Only three months are clearly identified as high-income months from October to December. These households generate income through second-round effects via higher demand from farming households. This might explain the time lag of one month with respect to farming households. In addition, the month of December is quoted by one third of the non-farming population as a high income-month. Discussions revealed that this is partly due to higher demand during Christmas season and partly cause by end of the year bonuses for employees. Vulnerability to natcat People in rural areas undergo strong seasonal income fluctuations. This asks for smoothening measures. Most of them were only able to cope with seasonal fluctuations by relying on external financing. Informal moneylenders are still a very popular income source and their tight payment schedules make their clients very vulnerable to unforeseen events. Their money is particularly used for consumption smoothening and businesses with daily turnovers. Those having access to formal sources felt somewhat less vulnerable to seasonal income fluctuations because of longer repayment schedules. GTZ Microinsurance Innovations Program for Social Security (MIPSS), Philippines 31
32 Farmers belong clearly to the most vulnerable group, as they need high amounts of capital to invest in their business and they are expose very volatile income patterns. This makes them less attractive clients for MFIs and they have troubles to access formal loans. It is usual for them to approach their traders for input loans. During the FGDs, most farmers affirmed that they have entered a debt cycle, where they use the harvest returns to pay for the inputs of the same or earlier harvests. Therefore, they are highly vulnerable to failed harvests. People with income sources that are not directly linked to agricultural production experience a more stable income throughout the year (e.g. traders, vendors, and fisher folks in some areas). They manage to smooth out their remaining fluctuations stemming from secondary market effects on a more sustainable way by using savings, especially those with access to saving accounts. To measure the vulnerability of the respondents, one might refer first to their endowments. The tables above show that the food expenditures are around P2 800 per month per household. Given an average household size of slightly less than 4 members, this number corresponds approximately to the food threshold in the Philippines (between P9 000 and P per capita per year). Similarly, the amount of expenditures (excluding business investments) is about P per capita per year. These numbers are more or less the same across all four provincial subsamples, even though in Leyte the number reaches P As a result, one can conclude that most of the interviewed households and the participants of the FGDs belong to the low-income sector (class C, D and E). Their lack of financial means might result in a lack of flexibility (e.g. above one third of the people s gross income is spent on food and is therefore not available for other expenses) and capacities to deal with strong impacts on their lives. Some of the visited communities were clearly marginalized being deprived of stable electricity and water supply. Our dynamic exposure analysis revealed that households face important fluctuations in their income throughout the year. At the same time, nearly all households report variations in their expenditures as well. These are more or less the same across different household types and provinces. The new school year starting around June results in high expenses for tuition fees, new uniforms and schoolbooks. Christmas entails high costs as well. The vulnerability of the households towards these events can be determined from possible mismatches of high-income and high-expenditure months. In Iloilo, the start of the new school year falls in the middle of the low-income season, therefore having a big impact on the household s financial stability. The question arises how the households are able to cope with these seasonal fluctuations and whether these mechanisms are sustainable or fragile. Risks Coping Mechanisms Coping mechanisms among the FGD participants are the same across all provinces, but were somewhat dependent on whether a household member was an active member/client of MFIs/cooperatives. In all visited areas it is common practice to seek for alternative income sources or livelihood. Women usually engage in small variety Risks coping mechanisms include: Borrowings from MFIs, loan sharks and relatives/friends; Reduce spending including on food and education; and Engage in alternative source of livelihood and temporary jobs. stores, in trading activities or food peddling. Men look for employments as construction worker, GTZ Microinsurance Innovations Program for Social Security (MIPSS), Philippines 32
33 carpenter or tricycle/pedicab driver. Other coping mechanisms noted were to plant vegetables and root crops with faster gestation periods and to sell these crops to the market or to other locals in the area. Finally, some migrate to Manila during low-income months to work there and send money back home. These affirmations correspond to the figures from the household survey, saying that roughly one quarter of overall income is generated through temporary jobs. Most of the discussants reported that they finance these alternative income sources through borrowing money; only few could rely on savings. Those having no access to formal sources approach loan sharks to finance their business. For instance, vendors in Abuyog, Leyte, reported that they took small loans to buy vegetables early in the morning, sell these throughout the day and pay back their loan in the evening. They have troubles to fulfil the requirements of MFIs and cooperatives and declare that informal moneylenders are the best source to get quick money. On the other hand, those being members of cooperatives or clients of MFIs usually prefer this formal source because loan sharks usually ask for daily payments. The members affirm that their business investments take time to generate benefits and therefore, such repayment schedules appear impossible for them. Farmers have generally more troubles to obtain loans from formal sources. For them, an alternative credit source is the rice trader who extends loans to the farmers through farm inputs and that are to be paid back during the harvest season in the form of farm outputs. All participants reported to take loans from neighbours or friends in order to finance their alternative income sources. This constitutes a very important source for them. Credits are not only taken for business investments, but also for direct consumption. However, most MFIs do not offer consumption loans. These loans for consumption smoothing are generally taken from informal money sources. Another way to cope with income volatilities is by reducing expenditures. This includes lowering food spending by lessen food intake or changing the dietary quality during seasons of low income. For instance, during hot seasons, the people reduce their consumption of rice and eat other vegetables instead. This behaviour could be observed in nearly all groups, independent of their income class. Savings is seldom mentioned in the groups as a means to cope with the decrease in income. When asked why they do not include savings as a means to prepare for low-income periods, a common answer from all groups interviewed was that money is not enough even for food. Those who manage to save will also use up cash immediately either to pay debt amortizations or to be used to purchase basic necessities. Cooperative leaders reported that they had difficulties to enforce mandatory savings because members always sought for ways to get access to their money. This has also a significant impact on the cooperative s capital. At least leaders of two of the visited cooperatives declared having troubles to accumulate enough capital during low-income months in order to issue loans. Those who have access to formal sources and do not undergo big income fluctuations use more frequently savings and refrain from taking pure consumption loans. GTZ Microinsurance Innovations Program for Social Security (MIPSS), Philippines 33
34 Savings practices come in other forms for those living in rural areas. Excess income is invested in livestock (hog, poultry, and goat) which the people sell usually during the start of the school year or when money is needed. This can also be observed in our income table for Iloilo (and other provinces as well). Households that engage in livestock breeding manage to have their animals ready for selling before / during high-expenditure months. 6.2 Risks and Specific Vulnerability The exposure estimates help us to understand what is at stake if a natcat occurs. The general vulnerability assessment gives us an idea on how good different groups presumably are in absorbing shocks. Now, we address the question of hazards and their impact structure through the following analytical process: 1. We compare the impact of natural hazards to life-cycle events and average income to understand the relative importance of the former. For instance, even though the reported damage might be low it gains in importance when expressing it in number of income months. 2. We analyze the three major natural hazards typhoons, floods and drought across the two major different economic sectors and across the four provinces. This helps us to understand whether some jobs are more vulnerable to specific risks than others. We try to figure out whether the expectations from our prior data analysis, that hazards are unequally distributed across the Philippines, match with the household s perception. 3. We address the topic of risk management systems that people developed (or not) to protect themselves against the impact of specific natural calamities. Natcats are a #1 risk for poor households. They are very frequent events and entail large costs, especially for the agricultural sector. Comparable to illness in affecting a large part of the population, they are generally considered as having a bigger impact on the household s budget. Many of those being affect declare that they suffer at least once a year from a specific natcat. This is especially true for marginalized and very poor households living in areas where appropriate risk preparedness measures by government units are inexistent. More severe events happen every ten to 15 years. The major hazards are typhoons, floods and drought with droughts generally causing the highest damage. For all these three hazards, farmers feel more at risk and incur generally three times higher losses than non-farming households. In particular, non-farming households feel barely risk-prone to droughts. This differentiation is explained by the fact that direct damage to households is very rare, but that farmers may lose large parts of their crops. Non-farming households suffer more from secondary effects through higher food prices and lower demand for their products (if they are not employed and receive a fixed salary). Iloilo is prone to typhoons, floods and drought, but the impact is more moderate than in other provinces. Drought plays an important role for farmers and fisher folks, whereas the residents in Iloilo City suffer from annual floods. A flood control project, however, shall solve this problem for the provincial capital this year. GTZ Microinsurance Innovations Program for Social Security (MIPSS), Philippines 34
35 In Cagayan, especially typhoons, but also floods and drought affect large part of the population, with damages higher than in other provinces. The yield of farmers first harvest is generally threatened by long dry spell, whereas typhoons destroy big amounts of the second harvest. At the same time, the province is also focus point of risk mitigation and relief measures of the government and donor organizations. Leyte is prone to floods caused by continuous rainfall and/or typhoons, as well as landslides. People feel extremely at risk of these hazards, comparable to the situation in Cagayan. In Agusan del Sur, low-lying areas near the Agusan River are frequently flooded, damaging especially farmers crops. These floods are triggered by moderate, but steady rainfall. State players have barely developed any capacities to mitigate risks in the provinces in such a way that people feel unprepared and abandoned. Whereas, seasonal climate forecasts and irrigation system help some people to a certain extent to cope with droughts. Floods and typhoons hit most communities with little warning and preparation. Most people manage the impact of natcats by borrowing money from friends, relatives or neighbours and to a lesser extent via savings. Formalized systems, such as insurance schemes or organized relief programs are rarely in place and are mostly considered as less effective. At the same time, the impact of natcats exceeds the capacities of these informal risk-sharing mechanisms, leaving people with major problems in repaying their loans. Table 15 Frequent Hazards and Cost Frequent Hazards and Corresponding Cost What are the events that affect your household in the last 3 years? Type of Hazards % Average Occurrence Average Cost Median Cost Per Year Childbirth 33% 1.3 5,618 2,000 Baptism 25% 1.2 3,546 2,000 Schooling 52% 3 RD ,074 2,500 Wedding 12% ,726 2 ND 10,000 Fiesta 51% 2.6 6,197 3,000 Illness 40% 2 ND 2.9 9,629 3,000 Accident 7% ,931 5,000 Funeral 7% ,253 1 ST 15,000 Typhoon 59% 1 ST ,496 5,000 Floods 49% ,566 5,000 Drought 20% ,891 2 ND 10,000 The HH survey shows that natural catastrophes are part of the respondents life. Typhoons are the most frequent event for the four provinces taken together. They affected 60% of the households in the last three years and happen on average once a year. Floods (except typhoons) are also a very common disaster affecting half of the sample. There are only two life-cycle events affecting more or less the same number of households: More than 50% of the households report fiestas and schooling as events that have affected their households recently. Illnesses and childbirth are a little bit less common. Droughts only affected 20% of the sample. GTZ Microinsurance Innovations Program for Social Security (MIPSS), Philippines 35
36 The data on the strength of the impact, expressed in Pesos, shows that funerals, weddings and drought entail the largest costs, but they are also clearly less frequent than other events. Schooling and especially fiestas have a more moderate impact on the people s budget than typhoons, floods or drought. The typical respondent household looses P5 000 every year either to the impact of floods or typhoons. Given that the average costs are clearly above the median one can conclude that the cost distribution is highly skewed with some experiencing losses plainly above P These numbers compare to typically one to two income months, showing the strength of the impact. Figure 2 Financial Pressures of Households Financial Pressures of Households Baptism Wedding Fiesta Childbirth Schooling Accident Illness Typhoon Drought Floods Funeral Scale 1-very small, 2-small, 3-neither, 4-big, 5-very big When asked for the financial pressure on the household, one obtains some deviations from the impact expressed in Pesos. Events associated with life or happiness (such as childbirth, wedding, fiesta) have a lower impact than sad calamities (especially funerals, but also illness and all natural calamities). These figures correspond to the answers during the FGDs, even though participants did not mention happy events as big risks. Illness in the family, natural disasters, education spending, and accidents are the common events or occasions that affect family income across all the groups interviewed. Family cash flow is heavily affected whenever these events happen. Poor and marginalized communities identified as their major concern the supply of water and food during wet season when storms and floods make it difficult to reach them. When asked for the frequency and impact structure one could notice a slight distinct picture. Illness and education were mentioned as having the most frequent and for some even biggest impact on the people s livelihood. Other agriculture-related events were also mentioned, such as pest and death of livestock. In many discussions, natcats were declared as having the biggest impact. GTZ Microinsurance Innovations Program for Social Security (MIPSS), Philippines 36
37 Table 16 Frequency of Natcat Occurrence Frequency of Natcat (Number of responses) Frequency of Occurrence never lifetime ten yrs 2-5 yrs annually several times Typhoon Floods Drought The frequency patterns of the three major natcats - typhoons, floods and droughts - reveal that the typical recurrence period is one year. Those affected by natcats experience them typically very often and only a few respondents declared being affected regularly, but less than once a year. According to 10% of the respondents especially typhoons might even affect their household several times a year. These high frequency numbers might be at odds with the general perception of natural calamities as being a somewhat unexpected event that is not part of the regular, seasonal weather fluctuations. For instance, the distinction between normal dry season and droughts was not that clear to some of the FGD participants. In Zarraga, Iloilo, the respondents affirmed that droughts affect them every year, and the impact has increased in recent years. When asked about natural calamities that have had high impact on the family over the past ten years, most groups could only remember the most recent calamities. However, when asked about when such event with a similar or higher magnitude of destruction occurred, they could recall events dating way back over twenty years or so. As emphasized above, farming and non-farming households have different exposures and different general vulnerability towards exogenous events. This was justified by the fact that farmers need high investments and have long income turn over periods thereby creating strong fluctuations that might easily be exacerbated by the impact of natcats. The next table helps in figuring out whether farmers also have different risk perception regarding different natcats. Table 17 Risk Proneness for Farming and Non-farming Households Farming HH not little more or less Strongly extremely Typhoon 23% 13% 20% 24% 16% Floods 34% 12% 14% 25% 10% Drought 48% 15% 11% 13% 3% Non-farming HH not little more or less strongly Extremely Typhoon 40% 16% 19% 15% 9% Floods 43% 17% 14% 16% 7% Drought 72% 7% 3% 2% 1% The table reveals two important findings: First, farmers are more affected by natural catastrophes than non-farming households. Second, non-farming households feel barely risk-prone to droughts. This GTZ Microinsurance Innovations Program for Social Security (MIPSS), Philippines 37
38 pattern holds across all provinces. In other word, typhoons and floods affect everybody, but particularly farmers; droughts affect essentially only farming households. For each of the three hazards, the gap in risk perception between farming and non-farming households is around 15 percentage points, when considering those reporting to be strongly or extremely at risk. This first result is in line with our former findings, emphasizing the high exposure and high general vulnerability of farmers. They have simply more at stake and in addition, crops are especially vulnerable to extreme weather events, particularly during the reproductive stage. Floods and typhoons affect farmers in two ways. Besides the destruction of their harvest, they suffer considerable losses from floods because the remaining crop is of lower quality and they obtain lower price when selling it. Another common concern for farmers among all provinces includes pest & infestation. At the same time, around 25% of the non-farming households feel at high risk of typhoons or floods. This number is in line with observations gathered during FGD. Depending on the income source and the location of the homes the discussants claimed to be more or less affected by these hazards. When asked for the impact of typhoons and floods FGD participants living in risk-prone areas (near the riverside) generally answer that everything is submerged and flooded for several days. But few report substantial damages to their houses, such as roofs blown away. Natural calamities that would affect their homes directly are not very frequent. Except for floods, the participants have rarely experienced extreme natural calamities that have destroyed completely their homes or have resulted to losses of life in the family. The impact of typhoons, floods and particularly drought is more indirect. Those running stores or engage in trading suffer more from less demand for their products and higher expenditures for food as prices increase. But those with fix salaries (e.g. Barangay officials) experience only the latter effect. This difference in risk perception is also represented in the median cost that people attach to the three calamities: Table 18 Natcat Costs to Households Cost of Major Natcat Events Farming HHs Average Median # Typhoon 24,055 8, Flood 15,647 5, Drought 20,789 10, Non-farming HHs Average Median # Typhoon 7,998 2, Flood 5,954 2, Drought 4,125 3'500 8 In case of natural disasters farmers incur three times higher losses than non-farming households. Droughts are very severe and costly events for farmers. These numbers are in line with those gathered during the FGD. When asked how much loss do farmers incur in the event of flooding, the common estimate provided is around P per hectare of land. However, severe droughts can destroy up to 70%-80% of the crop that is around P per hectare. Consequently, the whole community suffers from losses. Household asset damage estimate their losses up to P for fixing damaged roofs, for instance. GTZ Microinsurance Innovations Program for Social Security (MIPSS), Philippines 38
39 Drought is of less importance for the visited areas. Even in El Niño years there is still rainfall that can be observed in selected areas of the province. Two thirds of those feeling at risk of droughts state that this is because of the strong impact and not because of the short recurrence period. Even though respondents in all provinces shared the common concern that natcats have a big and frequent impact on their family s lives, comparable or even greater than those caused by lifecycleevents, the four areas display different risk maps. Figure 3 Perception on Natcat Impact to Households Pre selected provinces Perception on Natcat Impact to Households - 'High/Extreme' category 3 Drought Flood 2 Typhoon 1 Agusan DS Leyte Cagayan Iloilo 0% 10% 20% 30% 40% 50% 60% 70% Question 5.1.7: How risk-prone is your household to the following natural calamities? Categories of responses: 1 at no risk at all; 2 at little risk; 3 at medium risk; 4 at high risk; 5 at extremely high risk. The perception of the respondents to the impact of the 3 major natcat events was measured in a scale of 1 to 5. 1 as no risk, 2 little risk, 3 medium, 4 high and 5 as extreme risk. Figure 2 capture the responses in the medium-high-extreme risks of the scale. Leyte and Cagayan are more risk-prone to typhoons and floods. Agusan del Sur and Iloilo are affected mostly by flood. Drought has the least impact across all areas because its occurrence is less frequent than the other natcat. Drought however provides the biggest cost to farming HHs in a single event. Iloilo: According to the crop damage report from BAS, Iloilo is more frequently and severely affected by droughts and typhoons. However, most of the survey respondents declare that their household is more affected by typhoons and floods than by drought. This can partly be explained by the fact that the number of non-farming households is disproportionally high in this subsample. But even among the farming households barely 10% feel at risk of droughts. GTZ Microinsurance Innovations Program for Social Security (MIPSS), Philippines 39
40 This number challenges both the statistics from BAS and the results from the FGDs. Four discussions were conducted in Dumangas and one in Zarraga, a neighboring community on the way to Iloilo City. Most participants relied, at least partly, on farming activities, but had generally a second activity, such as microenterprises or barangay official. When asked for the risks with the strongest impact the common answer was drought as this affects the entire community and makes other income earning opportunities scarce as well. Typhoon Frank hit Iloilo in 2008, causing a lot of damage and even casualties. Therefore, the question how the group was affected by this big event rose quickly. Most discussants could remember the big impact of this typhoon, but did not forget to mention the drought in the consecutive year as being at least similarly severe. Figure 4 Perception on natcat impact to households - ILOILO Province Perception on Natcat Impact to HH - ILOILO Province high/extreme medium no/little risk Drought Floods Typhoon 0% 20% 40% 60% 80% 100% The survey results indicate that about every fifth respondent feels highly or extremely at risk of typhoons and floods. Compared to other provinces the impact is more moderate and damage estimates are lower. In addition, 75% of all respondents declare that they are hit less than once in a lifetime. People living in Iloilo City usually say that they encounter flooding and typhoons more frequently, but the impact is also lower than in the more rural municipalities of Dumangas and Zarraga. As a matter of fact, Iloilo City (and its outlying areas), is vulnerable to large-scale flooding disasters frequently during the rainy season. According to the survey respondents these calamities take place nearly every year. Discussions with the municipal planning officer revealed that reasons for this are the city s location at the mouth of several rivers and the fact that unfavourable city planning structures, such as illegal settlement, construction and encroachments, reinforce the devastating effects of the natural hazards. Cagayan: According to our first data screening at the beginning of this study Cagayan is one of the most risk-prone areas in the Philippines and clearly more at risk than the other three provinces. These results are confirmed by the household survey and the FGDs. GTZ Microinsurance Innovations Program for Social Security (MIPSS), Philippines 40
41 Figure 5 Perception on natcat impact to households - CAGAYAN Perception on Natcat Impact to HH - CAGAYAN Province high/extreme medium Drought Floods Typhoon no/little risk 0% 10% 20% 30% 40% 50% 60% 70% Especially typhoons are identified as very risky, affecting nearly the whole sample (more than 95%). More than 60% of our sample feels at high or extremely risk of typhoons, whereas this number is around 25% for floods and drought. Compared to other provinces the cost estimates are also slightly higher, especially for typhoons and drought, and even for non-farming households being around a median value of P3 000 to P In line with BAS statistics the survey respondents confirm that typhoons and drought affect them annually. Typhoons (droughts) hit nearly 90% (50%) of the sample at least once a year. An FGD participant sketched a typical Cagayan (agro-)year as follows: The first (dry season) harvest in February to April has low yields due to droughts and the second (wet season) harvest in September to October is even worse due to several typhoons devastating the crop. Some of the farmers in the community of Solana, one of the municipalities with the highest crop yields in Cagayan, even report that the second harvest months are low-income months because part of their harvests are destroyed by typhoons. The four visited municipalities have slightly different hazard profiles. The Cagayan River is the largest and longest river in the Philippines and is subjective to extensive flooding during the wet season from May to October. This is caused by rainfall in the southern mountains where the river s headwaters lie (mainly in the province of Isabela). As a consequence, cities located at the riverbanks of the Cagayan River, such as all visited areas (Tuguegarao, Solana, Alcala and Aparri), are highly susceptible to flooding. For instance, the urban part of the municipality of Tuguegarao is surrounded big farming areas that are highly susceptible to flooding, as is a small fraction in the south of the city itself as well. All four municipalities are also prone to typhoons. FGD participants could all remember the devastating effects of typhoons Pepeng, Ondoy and Ramil that hit the province in When asked as to when a similar event occurred, the group in Solana mentioned that something similar happened in the 1970s. Over the past ten years, it was in 2005 and 2006 that th experienced a very strong typhoon, but it was not as destructive as that of The municipality of Aparri, lying at the mouth of Cagayan River, is divided in two, with this broad river in-between. Whereas the town center on the eastern shore is well developed, the western part is mostly populated by fisherfolk, roads are inexistent and electricity supply is only temporary. When asked these fishermen how natural hazards affect them they answered that GTZ Microinsurance Innovations Program for Social Security (MIPSS), Philippines 41
42 strong winds make it impossible for them to go out fishing and during typhoon seasons they are completely cut from the town center, resulting in interruptions of food and water supply. In addition, their wood huts are easily blown away. Leyte: The province of Leyte is threatened by yearly occurring floods following heavy rains, often associated with typhoons. The main period for typhoons and floods is September to January, that is before, during and after harvest time. Droughts rarely occur and are seldom recognized as risky events. Figure 6 Perception on natcat impact to households - LEYTE province Perception on Natcat Impact to HH - LEYTE Province high/extreme medium no/little risk Drought Floods Typhoon 0% 20% 40% 60% 80% 100% People in Leyte perceive risks as being stronger than as the crop damage report data suggests. Impact scores are comparable to those of Cagayan and they are even higher for floods. This holds true even when considering the high fraction of farmers in the subsample. In addition, nearly 20% of the respondents feel at high risk of landslides, making this hazard more risky than droughts in this province. One third of the respondents declare to be affected at least every year by a typhoon. At the same time, most of the FGD discussants stated that typhoons are probably going more north due to climate change, thereby letting Leyte unaffected in coming years. Strong floods occur less frequently than typhoons and are smaller in its spatial outreach. In accordance with the higher income rates and more valuable assets that the respondents in Leyte reported the usual damage of the natural calamities is also higher than in other provinces. Extreme events that make losses even to those that are not directly dependent on the agricultural production are quite rare in Leyte. The vendors in Ormoc City remembered well the flash flood of 1991, which left nearly everybody affected, and a smaller one in Those living in protected homes on the hills suffered from damages to their businesses because they are generally located in the center of Ormoc City, near the water. Another major event hitting the province was a seven months drought in the 1980s. Leyte is also known for being prone to landslides, happening especially in the southern part of the island. Floods occur annually in Leyte, but they do not affect everybody and are not always associated with typhoons. When visiting a marginalized barangay of Baybay, located more to the hinterlands, the FGD participants emphasized that they suffer harvest losses every year because of heavy rainfall in the GTZ Microinsurance Innovations Program for Social Security (MIPSS), Philippines 42
43 mountains. Even though it barely rains in the barangay itself the water coming from the mountain is so strong that it destroys part of the harvest. This type of floods is not expected to change in the coming years Agusan del Sur: In accordance with our prior data analysis, Agusan del Sur is generally less risk-prone than other areas. The most critical hazard is flooding with about 25% of the respondents being at high or extremely high risk. Droughts are also a concern for only about 30% of the farmers in the sample, but even though these say that they are of less importance to them than floods, the estimated damage for droughts is nearly twice as high as that for floods. Typhoons do practically not occur. Even though many people expressed the concern of floods, those having no farms had difficulties to design a value to their incurred losses because those are more of an indirect character. In the visited municipalities of Bayugan, Trento and San Francisco damage to houses is very rare because they are located in higher areas, whereas the farms are built up near the riverbanks. Figure 7 Perception of natcat impact to households - AGUSAN del Sur Province Perception of Natcat Impact to HH - AGUSAN DS Province high/extreme medium Drought Floods Typhoon no/little risk 0% 20% 40% 60% 80% 100% Floods are usually caused by moderate, but continuous rainfall, leading to overflowing of the province s main river, the Agusan River. Even though these floods happen every year they differ in intensity. People usually refer to the years 1984, 2006 and recently January 2010 when asked about severe floods in the area. But the worst was in 1984 where houses and farms were destroyed, livestock were lost, and several people died. 6.3 Risk Preparedness Risk preparedness is insufficient in most areas. As a result of the lack of appropriate infrastructure or risk mitigation plans offered by local government units natcats affect families and their communities very frequently. Natural hazards are unequally distributed across the four visited provinces with people in Cagayan and Leyte feeling more at risk than in Agusan del Sur and Iloilo. Besides, natcats occur very often, most of GTZ Microinsurance Innovations Program for Social Security (MIPSS), Philippines 43
44 them annually. When asked whether they know of any action taken by the government or institutions to protect them from the impact of natcats, the general answer across all four provinces is a little. Most of the people feel vulnerable, as they have not developed sufficient capacities to adapt disasters. In Cagayan, the FGD participants mentioned that they felt better prepared for droughts than for typhoons. When PAGASA forecasts a long dry spell, the government and private operators try to store water in their water reservoirs. Especially those areas where irrigation systems are in place farmers feel less prone to drought. However, most of the places that have been visited lack accessible water sources in a sense that those provided by the National Irrigation Association (NIA) are often not affordable for all farmers. Only some communities have developed local irrigation systems that are shared among community members. In other areas individual efforts prevail, that is to say farmers make use of water pumps and deep wheels to get water from the ground. Anticipating a lack of water, farmers change their cropping. They cultivate vegetables that are more drought resistant. That helps them to dampen the impact of severe droughts. However, not all groups were aware of seasonal weather forecasts and had troubles to prepare in time. Given their sudden character typhoons and floods are perceived as events that let the people unprepared. Especially the marginalized and poor people feel not at all prepared and left abandoned by the government. Preparation is rarely organized and is more of an individual, spontaneous character. Typhoon warnings reach those people who have a TV generally one week before the impact and barangay officials try to disseminate the warnings via mouth-to-mouth propaganda. Preparation of floods usually begins when steady rainfall is observed. On the one hand this gives the inhabitants enough time to prepare their houses, store some food and evacuate livestock. People in Cagayan even declared that local governments typically organize surveys in this week to check whether households engage in necessary preparation measures. On the other hand, crops, that is to say the most valuable assets for farmers, cannot be saved. The groups affected by floods and typhoons were asked if they knew of any actions being taken to help reduce the risk, but the common response to this query is that they are unaware of any actions being undertaken by both the local community leaders and the local government units. The group in Baybay, Leyte for example, explained that a simple dike could already help reduce the flooding in their area, but they sadly noted that their local government has taken no action over these years. On the other hand, some major cities have developed projects to dampen the impact of floods. For instance, Ormoc City has developed a disaster plan for flood-prone areas after the flashflood in 1991, including risk mitigation mechanisms. The construction of dikes and the widening of the river basin shall help to make the city less vulnerable to floods. Similarly, in Iloilo City the Flood Control Project shall offer a long-term solution to the perennial flooding in the city and outlying areas. The project, that includes construction of flood ways and bridges, as well as education campaigns and resettlement of affected areas, shall be completed in GTZ Microinsurance Innovations Program for Social Security (MIPSS), Philippines 44
45 Risk Coping Mechanisms March 31, 2010 Figure 8 Natcat Coping Mechanisms Household Risk Coping Mechanisms Goverment Claims Sold Assets Reduce Coonsumption Lender/MFI Savings Friend Natcats Foreseeable risk events Unforeseeabl e risk events 0% 5% 10% 15% 20% 25% 30% 35% 40% 45% 50% 55% Natcat risk events include: typhoons, floods and drought. Foreseeable risk events include: childbirth, baptism, schooling, wedding, fiesta. Unforeseeable risk events include: illness, accident, funeral. Coping mechanisms after the impact of a hazard are essentially the same as those used to smoothen seasonal fluctuations. Borrowing money especially from friends and relatives is the most prominent coping mechanism as indicated by over 60% of the responses around 13% of which gets credit from lenders/mfis. Savings is the 2 nd coping mechanism (25%) followed by reducing consumption (5%) and selling household assets (2%). Four (4) of the 264 responses said insurance claim is one of his typhoon coping mechanism. The same picture of coping mechanisms is also true for other risk events like accident, illness and funeral. Even though most of the respondents have access to formal finance sources, borrowing from friends and relatives is still more prominent. This can be explained by the fact that many MFIs are reluctant to disburse emergency loans because they are usually not invested in businesses. Alternatively, friends and relatives ask generally for lower interest rates (these zero-interest loans go along with the expectation that credits with similar conditions are given to the lender when she is in need). The FGD participants declared that most of them have relatives working at least temporarily in Manila. Still, it should be mentioned that FGDs with members of cooperatives or clients of MFIs revealed that the institutions usually disburse credits, but that they are sometimes not sufficient in serving the costs. Saving is more commonly used for foreseeable events (fiesta, wedding, baptism and childbirth), but not so much for unforeseeable events (illness, typhoons, floods and drought; exception: schooling). In addition, people rely generally more on savings for those events that induce lower costs. This corresponds to FGD results. The discussants emphasized that they try to save for emergencies and that some are successful in accumulating a small amount, but in most cases the hazard-induced costs exceed this sum. In a way that respondents evaluate saving as a less important mechanism, borrowing from informal moneylenders increases in importance. GTZ Microinsurance Innovations Program for Social Security (MIPSS), Philippines 45
46 Some people also tend more to reduce expenditures on consumption, motivated by the increase in prices that people usually face after natcats. Besides, in case of natcats some FGD discussants remember the distribution of money and food via the LGU calamity fund. The national food authority sells rice at lower prices and in some places, especially in Cagayan, the farmers benefit directly from government aid in form of free seed distribution. This takes place in proportion to the damage that each household reports to the DA during the survey taking place one to two weeks after the impact. Some also mentioned the good job of donor organizations that were very effective in distributing money, food, clothes and other assets on time. All this shows that the government and donor agencies have taken measures to help those affected by calamities, but only a small fraction of the affected is reached and measures seem to be more sporadic than on a regular basis. When asking how they evaluate the different coping mechanisms the survey respondents stress that only a few mechanisms are really effective, emphasizing their vulnerability and helplessness. The mechanisms obtaining the best scores tend to be those that are easily accessible. For instance, across all provinces these are Borrowing from a friend, a neighbour or a relative and Savings. Most people evaluate claims from insurance membership as a very ineffective way to cope with calamities. Government and donor aid obtain very good results in Cagayan. This might show that measures from these institutions have so far concentrated inter alia on this province due to its hazard-proneness. In general, people judge the help from MFIs and cooperatives as a rather effective way in overcoming natcat shocks, especially in Leyte. Having troubles to repay loans after the impact of a hazard indicates how well people are able to overcome the shock. As mentioned above, a case of illness in the family is a major hazard affecting the household s budget. Still, whereas such a shock leads for most people to some problems in repaying their loans, the impact of typhoons and floods is clearly more severe and people have more problems to manage this impact. This result for around 40% of those affected to major problems in repaying the loan, and for 30% to have some problems. The respondents have fewer problems, however, in coping with the consequences of droughts. When dividing the pool of respondents in different subsamples one can observe that especially farmers and those living in Cagayan and Leyte encounter problems in repaying their loans. 6.4 Financial Literacy & Insurance Design Pricing is the most important issues for most of the groups interviewed. Most are interested to have a natcat insurance product and that holds true across all four provinces, even though corresponding to their specific risk profile. The affordability, however, is the most important single factor that will determine whether a family will decide to purchase natcat insurance. Low premiums payable in accordance with the household s income schedule and high-frequent payouts make the product appealing to most of the households. Since there are no other offers of such kind except for crop insurance offered by PCIC, participants of the FGDs are not very particular about the quality and features of the product. For as long as individuals perceive the product to be affordable and that benefit is commensurate to the amount paid in premiums, then the insurance product would be an attractive investment for them. GTZ Microinsurance Innovations Program for Social Security (MIPSS), Philippines 46
 is information where to get it and information on how it actually works.")
47 Information is also critical in successfully distributing natcat insurance. Most of the participants do have some basic understanding about the concept of insurance. But what seems to prevent them from availing insurance products (other than the price factor) is information where to get it and information on how it actually works. Only one quarter of the people interviewed availed of insurance products, especially for health and funeral pre-need plans. This subsample tends more than others to be interested by natcat insurance products. When not being active members of any cooperative or client of any MFI, most are indifferent concerning distribution channels as long as those are easily accessible and somewhat part of the people s life. Strong outreach and a high number of clients make it attractive for others to buy the product as well. Insurance protection is commonly understood by the FGD groups as a means of security against unforeseen events. Policyholders are receiving some form of benefit that will help their family to recover from incurred losses. Especially those being MFI clients or cooperative members were familiar with the basic concept. In the HH sample around 60% declared understanding the concept of insurance. Still, when probing deeper and asking about possible reasons why people buy insurance or how the payout process works answers were quite varied. Figure 9 Reasons to buy insurance GTZ Microinsurance Innovations Program for Social Security (MIPSS), Philippines 47
 When contract ends, I will get my contributions 19% 53% 28% c) In case of calamity, I will get money from insurance company + when contract ends, I will get my contributions & interest b) When")

48 Figure 10 Perceived benefits from natcat insurance What benefits from natcat insurance? a) When contract ends, I will get my contributions 19% 53% 28% c) In case of calamity, I will get money from insurance company + when contract ends, I will get my contributions & interest b) When contract ends I will get nothing. But in case of calamity, I will get money from insurance company. Only roughly 28% of the survey respondents hold that the reason to buy insurance is to protect the policyholder from catastrophic losses, whereas 8% more believe that it is for the protection of recently incurred losses. Similarly, when asked for the benefits of an insurance coverage the same number of people chose the right answer, that is to say that policyholders only receive any payouts in case of a qualifying event. More than half of the respondents believed in a combination of saving and insurance product; in other words, payouts are expected for the event of a natcat and after the end of the contract period in form of a contribution payback plus interests. This corresponds to incidences in FGD where people frequently asked whether they got any payout if there was no qualifying event. Surprisingly, neither those saying that they understand the concept of insurance, nor those actually availing of insurance display a higher probability in giving the right answer to the two questions. Although it seems that the groups interviewed understood the concept of insurance, some still consider insurance as an additional expenditure for the family and premium payments are a form of expense, which is not necessary or not a priority, especially in times when incomes are low. As a matter of fact, insurance is seldom mentioned as a means of protection against unforeseen events. Individuals will not subscribe to insurance unless it is part of the loan availed by the individual or if someone has been able to explain to them the benefits it would provide them. Some avail of PhilHealth cards distributed through local government units while there are a few who avail of burial plans offered by private preneed companies, such as St. Peters. In the HH survey sample only one out of four avails of insurance (25%), mostly health (PhilHealth) and life (St. Peter s Life Plan). Some of these products offer very rewarding leverages. For instance, some availing of Philihealth insurance mentioned that they paid an annual contribution of P180 and benefits include free consultation and hospitalization. The Red Cross accident insurance is also popular and is GTZ Microinsurance Innovations Program for Social Security (MIPSS), Philippines 48
RTD on Climate Change Policy Reforms May 14, 2014
 RTD on Climate Change Policy Reforms May 14, 2014 William H. Martirez, Country Manager What is MicroEnsure? Micro Ensure is a global insurance intermediary dedicated to serving poor households and the
Francesco Rispoli, IFAD, Italy
 Scaling up insurance as a disaster resilience strategy for smallholder farmers in Latin America 11 th Consultative Forum on microinsurance regulation for insurance supervisory authorities, insurance practitioners
Disaster Management The
 Disaster Management The UKRAINIAN Agricultural AGRICULTURAL Dimension WEATHER Global Facility for RISK Disaster MANAGEMENT Recovery and Reduction Seminar Series February 20, 2007 WORLD BANK COMMODITY RISK
DISASTER RISK FINANCING ADB Operational Innovations in South Asia
 DISASTER RISK FINANCING ADB Operational Innovations in South Asia Erik Kjaergaard, Disaster Risk Management Specialist South Asia Department with input from Mayumi Ozaki, Senior Portfolio Management Specialist
PCDIP. Philippine City Disaster Insurance Pool
 PCDIP Philippine City Disaster Insurance Pool Disaster Risk The Philippines is located in one of the world s most disaster-prone regions. Positioned on the Pacific Ring of Fire and within the Western North
SECTOR ASSESSMENT (SUMMARY): FINANCE (DISASTER RISK MANAGEMENT) 1. Sector Performance, Problems, and Opportunities
: FINANCE (DISASTER RISK MANAGEMENT) 1. Sector Performance, Problems, and Opportunities") National Disaster Risk Management Fund (RRP PAK 50316) SECTOR ASSESSMENT (SUMMARY): FINANCE (DISASTER RISK MANAGEMENT) A. Sector Road Map 1. Sector Performance, Problems, and Opportunities a. Performance
National Disaster Risk Management Fund (RRP PAK 50316) SECTOR ASSESSMENT (SUMMARY): FINANCE (DISASTER RISK MANAGEMENT) A. Sector Road Map 1. Sector Performance, Problems, and Opportunities a. Performance
TERMINOLOGY. What is Climate risk insurance? What is Disaster risk insurance?
 TERMINOLOGY What is Climate risk insurance? Climate risk insurance describes a suite of instruments for financial risk transfer that provides protection against risks arising from extreme weather events
Satellite-powered Agriculture Insurance: Opportunities and Regulatory Requirements
 Satellite-powered Agriculture Insurance: Opportunities and Regulatory Requirements Jimmy Loro Senior Adviser Lead Expert GIZ RIICE Remote Sensing-based Information and Insurance for Crops in Emerging Economies
icmif KEY FINDINGS From the ICMIF country diagnostic study on mutual and cooperative microinsurance in the Philippines May 2018
 icmif International Cooperative and Mutual Insurance Federation KEY FINDINGS From the ICMIF country diagnostic study on mutual and cooperative microinsurance in the Philippines May 2018 The International
Rationalle for the Sendai Framework for DRR Evidence from the 2009, 2011 and 2013 Global Assessment Report on DRR
 Rationalle for the Sendai Framework for DRR Evidence from the 2009, 2011 and 2013 Global Assessment Report on DRR Good progress in Hyogo Framework for Action (HFA) implementation has been made, but more
Weathering the Risks: Scalable Weather Index Insurance in East Africa
 Weathering the Risks: Scalable Weather Index Insurance in East Africa Having enough food in East Africa depends largely on the productivity of smallholder farms, which in turn depends on farmers ability
Policy Implementation for Enhancing Community. Resilience in Malawi
 Volume 10 Issue 1 May 2014 Status of Policy Implementation for Enhancing Community Resilience in Malawi Policy Brief ECRP and DISCOVER Disclaimer This policy brief has been financed by United Kingdom (UK)
Southeast Asia Disaster Risk Insurance Facility
 Southeast Asia Disaster Risk Insurance Facility PROTECT THE GREATEST HOME OF ALL: OUR COUNTRIES SEADRIF is a regional platform to provide ASEAN countries with financial solutions and technical advice to
Developing a Disaster Insurance Framework for Pakistan
 Developing a Disaster Insurance Framework for Pakistan Fund Design Options RECURRING NATURAL HAZARDS ERODE RESILIENCE A NATIONAL DISASTER INSURANCE FUND TO SUPPORT VULNERABLE LOW-INCOME PEOPLE The people
INSURANCE For development, resilience and recovery
 INSURANCE For development, resilience and recovery Stewart McCulloch VisionFund November 2016 our value proposition for children and families Progress out of Poverty Index + World Vision: Focus on graduation
Regulatory Impact Assessment (RIA) on Microinsurance Nepal. -- Stakeholders Dialogue -- Findings, Conclusions and Strategic Recommendations
 on Microinsurance Nepal. -- Stakeholders Dialogue -- Findings, Conclusions and Strategic Recommendations") Regulatory Impact Assessment (RIA) on Microinsurance Nepal -- Stakeholders Dialogue -- Findings, Conclusions and Strategic Recommendations 6 September 2017 / Kathmandu, Nepal Dante Portula / Raquel Capio
Regulatory Impact Assessment (RIA) on Microinsurance Nepal -- Stakeholders Dialogue -- Findings, Conclusions and Strategic Recommendations 6 September 2017 / Kathmandu, Nepal Dante Portula / Raquel Capio
INDEX BASED RISK TRANSFER AND INSURANCE MECHANISMS FOR ADAPTATION. Abedalrazq Khalil, PhD Water Resources Specialist, World Bank
 INDEX BASED RISK TRANSFER AND INSURANCE MECHANISMS FOR ADAPTATION Abedalrazq Khalil, PhD Water Resources Specialist, World Bank Outline Introduction: Climate Change and Extremes Index Based Risk Transfer:
SCALING UP INSURANCE
 SCALING UP INSURANCE SVRK Prabhakar Today s Thought Plan Agricultural production risks are growing and buffering of resultant financial shocks is important Risk insurance can be promising but is facing
Ex Ante Financing for Disaster Risk Management and Adaptation
 Ex Ante Financing for Disaster Risk Management and Adaptation A Public Policy Perspective Dr. Jerry Skees H.B. Price Professor, University of Kentucky, and President, GlobalAgRisk, Inc. Piura, Peru November
International Economic Development Spring 2017 Midterm Examination
 Please complete the following questions in the space provided. Each question has equal value. Please be concise, but do write in complete sentences. Question 1 In thinking about economic growth among poor
International Agricultural and Natural Catastrophe Insurance Forum. Experience by GIZ Matthias Range
 International Agricultural and Natural Catastrophe Insurance Forum Experience by GIZ Rüschlikon, Switzerland, October 2016 Seite 1 Agenda GIZ GIZ and Financial Systems Development GIZ and Agricultural
Disaster risk management for climate change adaptation: Experiences from German development cooperation
 Disaster risk management for climate change adaptation: Experiences from German development cooperation Britta Heine 1, Jens Etter 2 1 Deutsche Gesellschaft für Technische Zusammenarbeit (GTZ) GmbH, Postfach
REPUBLIC OF BULGARIA
 REPUBLIC OF BULGARIA DISASTER RISK REDUCTION STRATEGY INTRUDUCTION Republic of Bulgaria often has been affected by natural or man-made disasters, whose social and economic consequences cause significant
Climate-related disasters & climate variability represent a major source of risks for the POOR in particular, the FARMERS who are dependent on good
 The Climate Change Adaptation Project on Building Climate Resilient Farming Communities in Agusan del Norte through Innovative Risk Transfer Mechanisms A demonstration Project under the United Nations
Overview of PADR process
 SECTION 3 Overview of PADR process PADR is a methodology for use at community level. It involves active engagement, with the community, in a process to explore the risks they face and the factors contributing
Weathering Climate Change through Climate Risk Transfer Solutions
 The G20's role on climate risk insurance & pooling: Weathering Climate Change through Climate Risk Transfer Solutions With this document, the Munich Climate Insurance Initiative (MCII) provides suggestions
Climate Risk Insurance Models from India
 Climate Risk Insurance Models from India Regional Dialogue on Climate Resilient Growth & Development Dhyanesh Bhatt 21 st Feb 2018 Agenda Crop insurance in India Guwahati city & Risk financing A case study
DISASTER RISK FINANCING AND INSURANCE PROGRAM
 DISASTER RISK FINANCING AND INSURANCE PROGRAM Strengthening Financial Resilience to Disasters What We Do DRFIP helps developing countries manage the cost of disaster and climate shocks. The initiative
OVERVIEW. Linking disaster risk reduction and climate change adaptation. Disaster reduction - trends Trends in economic impact of disasters
 Linking disaster risk reduction and climate change adaptation Inter-Agency Secretariat for the International Strategy for Disaster Reduction (UNISDR) A. Trends OVERVIEW B. Disaster reduction a tool for
Climate Insurance Fund (CIF) Luxembourg, June 2017
 Luxembourg, June 2017") Climate Insurance Fund (CIF) Luxembourg, June 2017 KfW Development Bank s Role in Insurance Our Mandate As the German development bank, our objectives is help our partners to fight poverty, maintain peace,
Climate Insurance Fund (CIF) Luxembourg, June 2017 KfW Development Bank s Role in Insurance Our Mandate As the German development bank, our objectives is help our partners to fight poverty, maintain peace,
Climate Risk Adaptation and Insurance in the Caribbean
 Climate Risk Adaptation and Insurance in the Caribbean Making Weather-Index Microinsurance Work for Vulnerable Individuals Sobiah Becker Background Munich Climate Insurance Initiative Initiated in 2005
TRAINING CATALOGUE ON IMPACT INSURANCE Building practitioner skills in providing valuable and viable insurance products
 TRAINING CATALOGUE ON IMPACT INSURANCE Building practitioner skills in providing valuable and viable insurance products 2017 Contents of the training catalogue The ILO s Impact Insurance Facility... 3
MEETING OF THE SOUTHERN AFRICA REGION FLASH FLOOD GUIDANCE SYSTEM (SARFFGS) Country Presentation for Malawi 28TH OCTOBER, 2015.
 Country Presentation for Malawi 28TH OCTOBER, 2015.") MEETING OF THE SOUTHERN AFRICA REGION FLASH FLOOD GUIDANCE SYSTEM (SARFFGS) Country Presentation for Malawi 28TH OCTOBER, 2015. Outline Introduction 2 DRM Institutional Structure Disasters and development
MEETING OF THE SOUTHERN AFRICA REGION FLASH FLOOD GUIDANCE SYSTEM (SARFFGS) Country Presentation for Malawi 28TH OCTOBER, 2015. Outline Introduction 2 DRM Institutional Structure Disasters and development
Chapter 2: Natural Disasters and Sustainable Development
 Chapter 2: Natural Disasters and Sustainable Development This chapter addresses the importance of the link between disaster reduction frameworks and development initiatives, based on the disaster trends
Planning, Budgeting and Financing
 English Version Planning, Budgeting and Financing Post-Disaster Recovery and Reconstruction Activities in Khammouane Province, Lao PDR Developed under the Khammouane Development Project (KDP), Implemented
TOPICS FOR DEBATE. By Haresh Bhojwani, Molly Hellmuth, Daniel Osgood, Anne Moorehead, James Hansen
 TOPICS FOR DEBATE By Haresh Bhojwani, Molly Hellmuth, Daniel Osgood, Anne Moorehead, James Hansen This paper is a policy distillation adapted from IRI Technical Report 07-03 Working Paper - Poverty Traps
Lessons from Piloting Weather Index Insurance
 Lessons from Piloting Weather Index Insurance MENA Climate Change Seminar Series May 5, 2009 Alexander Lotsch* World Development Report 2010 (DECWD) Development in a Changing Climate * Prepared with inputs
INNOVATIONS AND TRENDS IN FINANCIAL INCLUSION
 INNOVATIONS AND TRENDS IN FINANCIAL INCLUSION Microfinance and Disaster Management Surviving Disasters and Supporting Recovery Framework Assessment of Risks Client Preparedness Disaster Response Institutional
Introduction to risk sharing and risk transfer with examples from Mongolia and Peru
 Introduction to risk sharing and risk transfer with examples from Mongolia and Peru Dr. Jerry Skees H.B. Price Professor, University of Kentucky, and President, GlobalAgRisk, Inc. UNFCCC Workshop Lima,
How insurance can support climate resilience
 Accepted manuscript - 1 Embargoed till 24 March at 9am GMT (10:00 CET) How insurance can support climate resilience Swenja Surminski (Grantham Research Institute on Climate Change and the Environment at
ENSO Impact regions 10/21/12. ENSO Prediction and Policy. Index Insurance for Drought in Africa. Making the world a better place with science
 ENSO Prediction and Policy Making the world a better place with science Index Insurance for Drought in Africa Science in service of humanity Dan Osgoode & Eric Holthaus International Research Institute
Using Index-based Risk Transfer Products to Facilitate Rural Lending in Mongolia, Peru, Vietnam
 Using Index-based Risk Transfer Products to Facilitate Rural Lending in Mongolia, Peru, Vietnam Dr. Jerry Skees President, GlobalAgRisk, and H.B. Price Professor, University of Kentucky October 18, 2007
Assets Channel: Adaptive Social Protection Work in Africa
 Assets Channel: Adaptive Social Protection Work in Africa Carlo del Ninno Climate Change and Poverty Conference, World Bank February 10, 2015 Chronic Poverty and Vulnerability in Africa Despite Growth,
CHAPTER 1 AGRICULTURAL RISKS AND RISK MANAGEMENT 1
 CHAPTER 1 AGRICULTURAL RISKS AND RISK MANAGEMENT 1 Chapter 1: AGRICULTURAL RISKS AND RISK MANAGEMENT Risk and uncertainty are ubiquitous and varied within agriculture and agricultural supply chains. This
OUTLINE. I. Introduction II. Data and Methodology III. Preliminary Results a. Shocks. c. Recovery IV. Summary and Conclusion
 9 th PEP Network General Meeting Monitoring Household Coping Strategies During Complex Crises and dr Recoveries The Case of the Philippines Celia Reyes, Alellie Sobreviñas and Jeremy de Jesus PEP-CBMS
THE CLIMATE RISK INSURANCE INITIATIVE
 THE CLIMATE RISK INSURANCE INITIATIVE InsuResilience at a glance The InsuResilience Climate Risk Insurance Initiative was adopted by the G7 partner countries Germany, France, Italy, Japan, Canada, the
MICROINSURANCE SCHEMES FOR PROPERTY: EXAMPLES FROM LATIN AMERICA
 MICROINSURANCE SCHEMES FOR PROPERTY: EXAMPLES FROM LATIN AMERICA A. Smolka 1, A. Moser 2, A. Allmann 3, D. Hollnack 3, and M. Spranger 4 1 Head, Risk Evaluation Natural Perils, GeoRisks Research, Munich
RAB comments to the Green paper on disaster insurance. Our reference: RAB Date: 15 July 2013
 Position Paper RAB comments to the Green paper on disaster insurance Our reference: RAB-13-016 Date: 15 July 2013 Referring to: Related documents: Contact person: François Vilnet E-mail: francois.vilnet@partnerre.com
An overview of the recommendations regarding Catastrophe Risk and Solvency II
 An overview of the recommendations regarding Catastrophe Risk and Solvency II Designing and implementing a regulatory framework in the complex field of CAT Risk that lies outside the traditional actuarial
Making Index Insurance Work for the Poor
 Making Index Insurance Work for the Poor Xavier Giné, DECFP April 7, 2015 It is odd that there appear to have been no practical proposals for establishing a set of markets to hedge the biggest risks to
Managing Risk for Development
 WDR 2014 Managing Risk for Development Norman Loayza Berlin Workshop December 2012 Context and Objective 2 The topic is timely! Why a WDR on Risk? Ongoing global food / fuel crisis Global financial crisis
Chapter 2: Natural Disasters and Sustainable Development
 Chapter 2: Natural Disasters and Sustainable Development This chapter addresses the importance of the link between disaster reduction frameworks and development initiatives, based on the disaster trends
Regional Conference on Risk Transfer and Micro-Insurance for Resilience Building in the IGAD region
 Background Concept Note Regional Conference on Risk Transfer and Micro-Insurance for Resilience Building in the IGAD region Kampala, Uganda September 2-3, 2016 With the increasing number of disasters over
Kyrgyz Republic: Borrowing by Individuals
 Kyrgyz Republic: Borrowing by Individuals A Review of the Attitudes and Capacity for Indebtedness Summary Issues and Observations In partnership with: 1 INTRODUCTION A survey was undertaken in September
CARIBBEAN DEVELOPMENT BANK SUPPORT FOR HAITI TO MEET COMMITMENT TO CARIBBEAN CATASTROPHE RISK INSURANCE FACILITY FOR THE HURRICANE SEASON
 PUBLIC DISCLOSURE AUTHORISED CARIBBEAN DEVELOPMENT BANK SUPPORT FOR HAITI TO MEET COMMITMENT TO CARIBBEAN CATASTROPHE RISK INSURANCE FACILITY FOR THE 2017-2018 HURRICANE SEASON This Document is being made
Impacts of severe flood events in Central Viet Nam: Toward integrated flood risk management
 Impacts of severe flood events in Central Viet Nam: Toward integrated flood risk management Bui Duc Tinh, Tran Huu Tuan, Phong Tran College of Economics, Hue University Viet Nam 1. Research problem 2.
An Operational Framework for Disaster Risk Financing and Insurance
 Financial Protection Against Natural Disasters An Operational Framework for Disaster Risk Financing and Insurance This part seeks to tie together the experience and collected knowledge from partners in
PROGRAM INFORMATION DOCUMENT (PID) CONCEPT STAGE Report No.: Second Disaster Risk Management Development Policy Loan with a CAT-DDO Region
 CONCEPT STAGE Report No.: Second Disaster Risk Management Development Policy Loan with a CAT-DDO Region") Public Disclosure Authorized Public Disclosure Authorized Public Disclosure Authorized Public Disclosure Authorized PROGRAM INFORMATION DOCUMENT (PID) CONCEPT STAGE Report No.: Operation Name Second Disaster
Public Disclosure Authorized Public Disclosure Authorized Public Disclosure Authorized Public Disclosure Authorized PROGRAM INFORMATION DOCUMENT (PID) CONCEPT STAGE Report No.: Operation Name Second Disaster
Climate Insurance Fund (CIF)
") Climate Insurance Fund (CIF) Developing Climate Insurance Markets Around the Globe Through Equity/Debt Investments and Technical Assistance to Facilitate Healthy Development Agenda 1 The Climate Insurance
Climate Insurance Fund (CIF) Developing Climate Insurance Markets Around the Globe Through Equity/Debt Investments and Technical Assistance to Facilitate Healthy Development Agenda 1 The Climate Insurance
Public-Private Partnerships for Agricultural Risk Management through Risk Layering
 I4 Brief no. 2011-01 April 2011 Public-Private Partnerships for Agricultural Risk Management through Risk Layering by Michael Carter, Elizabeth Long and Stephen Boucher Public and Private Risk Management
Agricultural Insurance and Regulatory Implications
 Report of the 4th A2ii IAIS Consultation Call Agricultural Insurance and Regulatory Implications 26 June 2014 Governments are increasingly recognizing the relevance of insurance for farmers and rural dwellers
Sreeja S. Nair UNDP INDIA
 Sreeja S. Nair UNDP INDIA Potential Uses of Disaster Databases Pre-disaster Phase Develop a simple disaster risk indexing system that tracks the patterns of disaster risk - spatially and temporally. Develop
Brief Profile: Philippines
 Mutual Microinsurance Sector s Experience in Promoting Financial Inclusion and Resiliency among the Poor and Low Income Households in the Philippines Jun Jay Perez Executive Director Microinsurance MBA
Submission. 10 March 2016
 Submission Best practices, challenges and lessons learned from insurance-related solutions that address the risk of loss and damage associated with the adverse effects of climate change 1 Munich Climate
PRODUCTIVE SECTOR COMMERCE PDNA GUIDELINES VOLUME B
 PRODUCTIVE SECTOR COMMERCE PDNA GUIDELINES VOLUME B 2 COMMERCE CONTENTS n INTRODUCTION 2 n ASSESSMENT PROCESS 3 n PRE-DISASTER SITUATION 4 n FIELD VISITS FOR POST-DISASTER DATA COLLECTION 5 n ESTIMATION
Catastrophe Risk Financing Instruments. Abhas K. Jha Regional Coordinator, Disaster Risk Management East Asia and the Pacific
 Catastrophe Risk Financing Instruments Abhas K. Jha Regional Coordinator, Disaster Risk Management East Asia and the Pacific Structure of Presentation Impact of Disasters in developing Countries The Need
Session 4 Status of Climate Finance in the Philippines
 Session 4 Status of Climate Finance in the Philippines Workshop on Corruption Risks and Anti- Corruption Strategies in Climate Finance Manila, Philippines 25 to 27 May 2015 Summary of Day 1 2 Session objective
Climate Risk. Insurance in the Caribbean. Making Weather Index Microinsurance Work for Vulnerable Individuals Latin American Workshop on
 Climate Risk Adaptation and Insurance in the Caribbean Making Weather Index Microinsurance Work for Vulnerable Individuals Microinsurance Sobiah Becker September 29, 2013 Guadalajara Getting to Know Our
Agriculture Index Insurance in India. With focus on Weather & Flood Index August 01, 2015
 Agriculture Index Insurance in India With focus on Weather & Flood Index August 01, 2015 Agenda 1. An Introduction to Swiss Re 2. Overview of Index based Agriculture Insurance 3. How Weather Index Crop
2016/EPWG/SDMOF/009 Utilizing Government Social Structures for Emergency Preparedness and Response
 2016/EPWG/SDMOF/009 Utilizing Government Social Structures for Emergency Preparedness and Response Submitted by: World Food Programme 10 th Senior Disaster Management Officials Forum Iquitos, Peru 8 9
Impact Assessment of Microfinance For SIDBI Foundation for Micro Credit (SFMC)
") Impact Assessment of Microfinance For SIDBI Foundation for Micro Credit (SFMC) Phase 1 Report July 2001 March 2002 By Putting people first EDA Rural Systems Pvt Ltd 107 Qutab Plaza, DLF Qutab Enclave-1,
Impact Assessment of Microfinance For SIDBI Foundation for Micro Credit (SFMC) Phase 1 Report July 2001 March 2002 By Putting people first EDA Rural Systems Pvt Ltd 107 Qutab Plaza, DLF Qutab Enclave-1,
SOCIOECONOMIC FLOOD IMPACT ASSESSMENT IN NADI AND BA, Fiji
 SOCIOECONOMIC FLOOD IMPACT ASSESSMENT IN NADI AND BA, Fiji Following the destructive floods of January 2009, the Government of Fiji requested the Pacific Islands Applied Geoscience Commission (SOPAC) to
Climate Risk Management For A Resilient Asia-pacific Dr Cinzia Losenno Senior Climate Change Specialist Asian Development Bank
 Climate Risk Management For A Resilient Asia-pacific Dr Cinzia Losenno Senior Climate Change Specialist Asian Development Bank APAN Training Workshop Climate Risk Management in Planning and Investment
Regional Capacity Development Workshop: Mainstreaming DRR in Sustainable Development Planning Myanmar s Country Disaster Profile
 Regional Capacity Development Workshop: Mainstreaming DRR in Sustainable Development Planning Myanmar s Country Disaster Profile 13-16 September 2016 New Delhi, India Key Disaster Impacts: Overview Myanmar
Background Paper. Market Risk Transfer. Phillippe R. D. Anderson The World Bank
 Background Paper Market Risk Transfer Phillippe R. D. Anderson The World Bank Market Risk Transfer Background Paper for the World Development Report 2014 on Opportunity and Risk: Managing Risk for Development
What is disaster risk? Progression of approaches. It s not that simple! Increasing disaster losses due to temperature rises and climate change?!
 Increasing disaster losses due to temperature rises and climate change?! A Climate Risk Management Approach to Adaptation to Climate Change and Disaster Reduction Kamal Kishore Bureau for Crisis Prevention
What is microinsurance and why does it matter?
 Policy, regulation and supervision FOCUS NOTE 1 What is microinsurance and why does it matter? The rationale for microinsurance from a regulator s perspective March 2009 By Doubell Chamberlain, Christine
Improving Crop Production Monitoring and Agricultural Insurance Solutions through Satellite Technology
 Remote Sensing-based Information and Insurance for Crops in Emerging Economy Improving Crop Production Monitoring and Agricultural Insurance Solutions through Satellite Technology Feeding seven billion
EOCNOMICS- MONEY AND CREDIT
 EOCNOMICS- MONEY AND CREDIT Banks circulate the money deposited by customers in the banks by lending it out to businesses at a rate of interest as a credit, which then acts as the income of the bank....
REDUCING DISASTER RISK a challenge for development
 Reducing Disaster Risk: a challenge for development REDUCING DISASTER RISK a challenge for development A Global Report from : United Nations Development Programme Bureau for Crisis Prevention and Recovery
Andrew Goodland RISK MANAGEMENT: THE CASE OF THE LIVESTOCK SECTOR IN MONGOLIA
 Andrew Goodland RISK MANAGEMENT: THE CASE OF THE LIVESTOCK SECTOR IN MONGOLIA Outline 1. Brief context nature of risk in Mongolia 2. Conceptual framework for understanding and addressing risk in the agricultural
3 RD MARCH 2009, KAMPALA, UGANDA
 INNOVATIVE NEW PRODUCTS WEATHER INDEX INSURANCE IN MALAWI SHADRECK MAPFUMO VICE PRESIDENT, AGRICULTURE INSURANCE 3 RD MARCH 2009, KAMPALA, UGANDA Acknowledgements The Commodity Risk Management Group at
Recent weather disasters Statistics of natural catastrophes Reasons for increasing losses Risk reduction strategies Conclusions
 Geo Risks Research Munich Reinsurance Company Topics Recent weather disasters Statistics of natural catastrophes Reasons for increasing losses Risk reduction strategies Conclusions Weather records and
France s Funds and Insurance Schemes for Natural Disasters. Update
 France s Funds and Insurance Schemes for Natural Disasters Update 1 Mandatory cover of losses arising from Natural Catastrophes in: all Physical Damage (a.k.a. Fire ) insurance policies covering risks
Climate Insurance Fund
 Climate Insurance Fund An innovative approach to safeguard against extreme weather events in developing countries Frankfurt, 5 th July, 2013 Monika Beck Director Competence Center Financial Sector Development
Disaster Risk Reduction and Financing in the Pacific A Catastrophe Risk Information Platform Improves Planning and Preparedness
 Disaster Risk Reduction and Financing in the Pacific A Catastrophe Risk Information Platform Improves Planning and Preparedness Synopsis The Pacific Islands Countries (PICs) 1, with a combined population
Context/ Questions/ Methods/ Findings/ Policy Implications
 Built-In-Resilience: Learning from Grassroots Coping Strategies to Climate Variability Huraera Jabeen BRAC University, Bangladesh Adriana Allen University College London, UK Dr Cassidy Johnson University
Panel 6: Inclusive Insurance: Building Resilience through Partnerships. Session Synopsis
 Panel 6: Inclusive Insurance: Building Resilience through Partnerships Session Synopsis Moderator: Mr. Krishnan Narasimhan, Financial Inclusion Specialist for Solomon Islands, Pacific Financial Inclusion
GOVERNMENTS IN THE LEAD ON FINANCIAL PREPAREDNESS
 GOVERNMENTS IN THE LEAD ON FINANCIAL PREPAREDNESS Lessons learned from around the world Wednesday, November 18, 2015 African Union Addis Ababa, Ethiopia GOVERNMENTS IN THE LEAD ON FINANCIAL PREPAREDNESS
Disaster Risk Management in the Caribbean Case Study: Rapid Damage and Loss Assessment following the 2013 Disaster
 Belize benefits from knowledge and experiences from the PPCR Disaster Risk Management in the Caribbean Case Study: Rapid Damage and Loss Assessment following the 2013 Disaster Photo Credit: http://gov.vc
GLOSSARY. 1 Crop Cutting Experiments
 GLOSSARY 1 Crop Cutting Experiments Crop Cutting experiments are carried out on all important crops for the purpose of General Crop Estimation Surveys. The same yield data is used for purpose of calculation
Allianz Climate Solutions. Fourth Annual Meeting San Giorgio Group October 16, Simone Ruiz, Head of Climate Advisory & Projects
 Allianz Climate Solutions Fourth Annual Meeting San Giorgio Group October 16, 2014 Simone Ruiz, Head of Climate Advisory & Projects Insurance is an important financing mechanism for resilient land use
Sharm El Sheikh Declaration on Disaster Risk Reduction. 16 September Adopted at the Second Arab Conference on Disaster Risk Reduction
 Sharm El Sheikh Declaration on Disaster Risk Reduction 16 September 2014 Adopted at the Second Arab Conference on Disaster Risk Reduction City of Sharm El Sheikh, Arab Republic of Egypt, 14 16 September
Module 6 Book A: Principles of Contract Design. Agriculture Risk Management Team Agricultural and Rural Development The World Bank
 + Module 6 Book A: Principles of Contract Design Agriculture Risk Management Team Agricultural and Rural Development The World Bank + Module 6 in the Process of Developing Index Insurance Initial Idea
Introduction to Disaster Management
 Introduction to Disaster Management Definitions Adopted By Few Important Agencies WHO; A disaster is an occurrence disrupting the normal conditions of existence and causing a level of suffering that exceeds
Community-Based SME For Road Maintenance
 Community-Based SME For Road Maintenance Insights from the W.B and IADB-Peruvian Rural Roads maintenance contracts Project & Poverty Reduction Presented by Jacob Greenstein (EGAT) Scope of Presentation
Catastrophe Risk Management in a Utility Maximization Model
 Catastrophe Risk Management in a Utility Maximization Model Borbála Szüle Corvinus University of Budapest Hungary borbala.szule@uni-corvinus.hu Climate change may be among the factors that can contribute
Growing emphasis on insurance systems
 Growing emphasis on insurance systems Roger C Stone, University of Southern Queensland, Australia. World Meteorological Organisation, Commission for Agricultural Meteorology. IDMP Geneva September 14-16,
PROGRAM OF INDICATORS OF DISASTER RISK AND RISK MANAGEMENT IN THE AMERICAS. Review and Update. Omar D. Cardona
 PROGRAM OF INDICATORS OF DISASTER RISK AND RISK MANAGEMENT IN THE AMERICAS Review and Update Omar D. Cardona IRDR SC Member National University of Colombia ERN Evaluación de Riesgos Naturales - América
ASEAN Disaster Risk Financing and Insurance Forum A Joint Initiative of ASEAN, World Bank, GFDRR and UNISDR November 2011, Jakarta, Indonesia
 ASEAN Disaster Risk Financing and Insurance Forum A Joint Initiative of ASEAN, World Bank, GFDRR and UNISDR 8-10 November 2011, Jakarta, Indonesia Synthesis of Day 2 (9 November 2011) SESSION 3: PANEL