Endorsement by the Board of Thames Water Utilities Limited 2 Section 1 Executive Summary 9
|
|
|
- Jade Freeman
- 6 years ago
- Views:
Transcription

1
2
3 Table of contents Endorsement by the Board of Thames Water Utilities Limited 2 Section 1 Executive Summary 9 A Introduction... 9 B Background C Performance requirements D Allowed expenditure E Risk:reward package F Our overall conclusions on the Draft Determination G Structure of this response Section 2 Wholesale Water 16 A Introduction B Outcomes & Performance Commitments C Delivery Incentives D Calculating the Wholesale Water Price Control E Uncertainty Mechanisms Section 3 Wholesale Wastewater 37 A Introduction B Outcomes & Performance Commitments C Delivery Incentives D Calculating the Wholesale Wastewater Price Control Section 4 Thames Tideway Tunnel 56 A Introduction B Separate price control C Outcomes, performance commitments and delivery incentives D Calculating the TTT Price Control E Uncertainty Mechanisms Section 5 Retail Household 75 A Introduction B Outcomes and Performance Commitments C Delivery Incentives D Calculating the Retail household price control
4 E Schedule 1: RA6 Service Incentive Mechanism F Schedule 2: CRMB ODI Section 6 Retail Non Household 100 A Introduction B Calculating default tariffs C Duration of price control D Customer feedback on structure of tariffs Section 7 Appointed Business 107 A Introduction B Risk & Reward C Affordability D AMP6 reporting Appendix A Wholesale Water 127 WWT01 WB3:Compliance with drinking water quality standards Ofwat/DWI KPI WWT02 WB5: Average hours lost supply per property served, due to interruptions >4hr WWT03 Asset health (Water) WWT04 ODI deadbands WWT05 Water Infrastructure Shortfall WWT06 AMP5 Service Standard Outputs Resilience (Water) WWT07 Revenue Correction Mechanism Adjustments (Water) WWT08 Ofwat s horizontal checks on ODI Appendix B Wholesale Wastewater 128 WWS01 SC9: Reduce the amount of phosphorus entering rivers to help improve aquatic plant life WWS02 SB3: Properties Protected from flooding due to rainfall WWS03 SB4: Number of Internal flooding incidents, excluding those due to overloaded sewers (SFOC) WWS04 SC2: Total category 1-3 pollution incidents from sewage related premises 128 WWS05 Asset health (Wastewater) WWS06 SC7: Modelled reduction in properties affected by odour WWS07 ODI deadbands
5 WWS08 Totex costs Counters Creek and Sewer Flooding Programme 128 WWS09 Business rates (Wastewater) WWS10 Open Water costs (Wastewater) WWS11 Wastewater infrastructure shortfall WWS12 AMP5 Service Standard Outputs Energy WWS13 AMP5 Service Standard Outputs Odour WWS14 AMP5 Service Standard Outputs Resilience (Wastewater) WWS15 Other AMP5 logging reductions (Wastewater) WWS16 Revenue Correction Mechanism adjustments (Wastewater) Appendix C Thames Tideway Tunnel 130 TTT01 Executive Summary TTT02 Introduction and background TTT03 TTT Price Control TTT04 AMP TTT05 Resilience TTT06 Development TTT07 Risk TTT08 Inflation TTT09 Construction TTT10 Land TTT11 Indirect costs TTT12 Corporate overheads TTT13 Governance and assurance Appendix D Retail Household 132 RHH01 New Costs (CRMB) RHH02 Metering Cost to Serve RHH03 Occupancy Turnover Appendix E Retail Non Household 133 RNHH01 CRM and Billing System RNHH02 Additional costs of market opening RNHH03 Customer feedback on structure and term of default tariff RNHH04 Base capex for AMP
6 Glossary ACICR ACTS Alliance / eight20 AMP5 AMP6 Board BPS Business Improvement Programme Capex CCG CCWater Change Protocol CIS CMA C2DEs COPI Counters Creek CRC Scheme CRMB Adjusted Cash Interest Cover Ratio Average Cost to Serve Eight20 is an alliance of eight companies which will complete about half of our projected capital programme in and beyond Asset Management Planning period 5, from April 2010 to March 2015 inclusive Asset Management Planning period 6, from April 2015 to March 2020 inclusive The Board of Thames Water Utilities Ltd Basis Points Thames Water programme that commenced in 2013/14 to identify areas where we could provide a more efficient service Capital Expenditure Thames Water s Customer Challenge Group The Consumer Council for Water. Represents water and sewerage consumers in England and Wales. The process, defined by Ofwat, that companies should follow if seeking financial recognition of significant changes in outputs Capital Expenditure Incentive Scheme. Mechanism used by Ofwat to set expenditure assumptions and associated rewards or penalties for out- or under-performance in AMP5. The Competition & Markets Authority The three lower socio-economic groups consulted in our customer research Construction Output Price Index The sewerage catchment which straddles the border of the London Boroughs of Hammersmith and Fulham and Kensington and Chelsea CRC (Carbon Reduction Commitment) Energy Efficiency Scheme Order 2010 Customer Relationship Management & Billing DD Ofwat s Draft Determination of prices for the period Defra Discount Rate EA EBITDA The Department for Environment, Food and Rural Affairs The annual rate used to convert all costs into their present value so that they can be compared across different time periods The Environment Agency Earnings before interest, taxes and depreciation FD04 Ofwat s Final Determination of prices for the period
7 FD09 Ofwat s Final Determination of prices for the period Halcrow Halcrow Group Limited. Company number: IDoK IP June 2014 Submission K Lee Tunnel Linklaters Mains Replacement Independent Review Mean Zonal Compliance Interim Determination of price limits Infrastructure provider Thames Water s June 2014 revised Business Plan submission The annual, variable factor, which, in addition to RPI, is applied to water and sewerage prices (RPI + K) Part of the strategic London TTT Improvements. Will transport sewage from Abbey Mills pumping station in Stratford to Beckton Sewage Treatment Works. Linklaters LLP. Registered number: OC Independent review by Black & Veatch of the costs of our mains replacement programme Measure of drinking water quality based on geographical area NEP5 National Environmental Programme 5 NI NIRS NPV Ofwat Opex PAYG PCR Notifiable Item National Infrastructure Renewal Scheme Net Present Value Short form of The Water Services Regulation Authority Operating expenditure Pay As You Go Performance commitment response PR04 Price review conducted in 2004 by Ofwat for the period PR09 Price review conducted in 2009 by Ofwat for the period RCC RCM RCV RORE RPI SDAC SFOC Shaft G Relevant Change of Circumstance. Conditions defined by companies licences which, if met, can be used to trigger an IDoK Revenue Correction Mechanism. Mechanism used by Ofwat to share between companies and customers the benefits and risks of companies recovering more or less revenue than it assumed when setting price limits. Regulatory capital value. The value of the capital base of each company for the purposes of setting price limits. Return on Regulatory Equity Retail Price Index A sewerage drainage area catchment is the area that drains to a sewage treatment works. This term may also be used to define sub-areas that drain to a pumping station within the main SDAC. Sewer flooding other causes A principally below-ground shaft required for the construction of the Lee Tunnel 7
8 Thames Water TIG TTT TBM UKWIR WACC Thames Water Utilities Limited Tideway Integration Group Thames Tideway Tunnel. The final part of a larger strategic solution needed to significantly reduce sewage discharges into the River Thames. Tunnel boring machine UK Water Industry Research WIA91 The Water Industry Act 1991 WOC WSRA Weighted average cost of capital. Used by Ofwat to calculate the revenue required by companies to provide a return to investors. Water-only company. Statutory undertakers offering only water services. The Water Services Regulation Authority (Ofwat) 8
9 Section 1 Executive Summary A Introduction This document sets out our response to Ofwat s Draft Determination of Thames Water s PR14 price controls (DD) 1. Overall, we are impressed by the quality of the documents produced by Ofwat under demanding timescales. Indeed, there are many aspects of the Draft Determination that we can support, including Ofwat s confirmation that: our customer research now fully meets Ofwat s Risk Based Review tests; the majority of our performance commitments and Outcome Delivery Incentives meet Ofwat s requirements; our plans are affordable for our customers both in AMP6 and in the longer term; and several significant elements of expenditure (e.g. NEP5 and Deephams) are acceptable We welcome the decision for a consistent 2.5% net margin in Retail Non Household across all companies, and the inclusion of TTT revenue in the retail margin both Household and Non Household. We also welcome Ofwat s firm indication that it is prepared in the Final Determination to set a smooth bill profile, reflecting the wishes of our customers, notwithstanding that, at this stage, there remain differences between Ofwat s and Thames Water s views as to the appropriate levels of allowed expenditure. Whilst it is clear that Ofwat has aimed to follow an open and transparent process, the Draft Determination introduced some unexpected changes to the PR14 methodology which we do not consider to be in the interests of customers. For Thames Water, Ofwat s interventions: require significantly improved performance in without acknowledging the costs associated with this, or that our Performance Commitments were based on extensive conversations with our customers regarding the levels of service they were willing to pay for; reduce allowed expenditure during by 860m, despite Ofwat s acknowledgement in the Risk Based Review that we had put forward an efficient plan; and increase risk by increasing the likelihood of potential penalties while reducing the likelihood of a reward. The Draft Determination also indicates that rewards may be further reduced by means of an adjustment to WACC at the Final Determination in December Setting price controls for , Draft price control determination notice: company-specific appendix Thames Water, Ofwat, August
10 Following the publication of the Draft Determination, we have continued to engage with our CCG on the relevant aspects of our business plan. Our initial analysis of Draft Determination implications was circulated to the CCG on 9 September 2014, following which a series of targeted meetings were held on key aspects of our plan. Further meetings were held with the CCG throughout September, where the CCG was taken through the overall scope of our planned response. We have conducted additional customer research in the areas of Retail Non-household tariffs and smoothing of customers bills. The CCG challenged and approved our approach to the research undertaken. We acknowledge that Ofwat has left it open to companies to confine their representations to the main issues arising from the Draft Determination. Whilst we share Ofwat s objective for an efficient process, it is our considered opinion that customers long-term interests are better served by responding to all of the material issues that Ofwat has raised in its Draft Determination. We have therefore set out our views on all material areas of agreement and disagreement, and provided the additional information requested by Ofwat in a number of areas (including on some issues and concerns of a more technical nature that we will work with Ofwat to address before the Final Determination). For Ofwat s convenience, our response mirrors the overall structure of the Draft Determination as closely as possible. B Background When it launched the PR14 process in 2012, Ofwat made clear that one of its key objectives was to develop a framework in which companies would be rewarded for engaging with their customers and developing plans which reflected their needs. By placing the emphasis on companies to develop plans that met their customers requirements, Ofwat would be able to initiate lasting change in the industry to the enduring benefit of customers. We have embraced this change in approach in full. We have developed a robust, wellevidenced, efficient and challenging business plan carefully designed to meet the requirements of our customers. Our board has taken full ownership of the development of our business plan, providing clear strategic direction and challenging and reviewing our plans at every stage of the process. Our business plan, as submitted in December 2013, was based on a very thorough understanding of our customers wants and needs. We carried out a detailed customer programme over a three year period which included qualitative and quantitative research, insight based on existing customer contacts and two full scale customer consultations. Most importantly, in our final acceptability testing a majority of our customers confirmed that our plans were acceptable to them. In addition, our customer consultation programme and our business plan proposals were scrutinised and challenged independently by our Customer Challenge Group (CCG) and reviewed by our quality regulators the Drinking Water Inspectorate, the Environment Agency, and Natural England. Our plans also reflected very efficient costs, including self-imposed cost reduction targets of around 160m capex, and around 100m opex over the period. These efficiencies were over and above our current Business Improvement Programme savings of 85m. All costs were challenged by our alliance partners and benchmarked where appropriate. 10
11 In June 2014, following feedback on the Risk Based Review, and further engagement with our customers, we refined our plans, introducing a more comprehensive set of Outcome Delivery Incentives, and removing the majority of the uncertainty mechanisms that we had proposed in December. We also confirmed that the business could accept a reduced industry-wide WACC, notwithstanding the heightened risks that we faced associated with the TTT. However, we made clear that our ability to accept the lower WACC was conditional on the recognition that we had put forward an efficient plan, and that the business would be allowed to share 50% of the benefits of that efficient plan, in line with the PR14 methodology. Against this background, we were confident that the proposals we put forward in June 2014 both satisfied customer requirements, and were fully consistent with the regulatory framework that Ofwat had set out for PR14. However, whilst the Draft Determination is supportive of many aspects of those proposals, we are concerned about the impact of Ofwat s interventions on: performance requirements; expenditure allowances; and the risk:reward package. C 1.14 Performance requirements Ofwat s interventions to set revised industry-wide service standards for specific performance metrics, such as drinking water quality and sewer flooding, give rise to a number of concerns: by intervening to set service standards in this way, Ofwat is undermining the incentive for companies to own their plans in future. We believe this to be contrary to Ofwat s original objective and, therefore, not in the interests of our customers; by requiring all companies to achieve the same standard, Ofwat has overlooked the fact that customers in different parts of the country have different preferences with respect to prices and service levels, preferences which we have incorporated in to our plan by talking to our customers at every stage of our business planning process; by requiring companies to achieve upper quartile performance in respect of every performance metric it has identified, Ofwat is effectively requiring an even higher level of performance than that of an upper quartile company (a company that would average the upper quartile level rather than meet or exceed it in every single area); and Ofwat has assumed that customers have paid for upper quartile performance. However, most customers will neither have paid for upper quartile performance in past bills, nor would they pay for this during because Ofwat s cost models determine the upper quartile efficiency for average performance, not for upper quartile performance. In the case of Thames Water, the funding challenge is even greater than it is for other companies, as Ofwat is proposing to hold Thames Water s allowed expenditure for its Wholesale Water price control to a level below that implied by the upper quartile efficient cost boundary. In addition, there has been no consideration of the fact that service performance is heavily influenced by the existing asset base, and there has not been the time required to make the investment in the assets to change the performance levels Ofwat also appears to have overlooked important facts in the way in which it has applied its horizontal checks. For example, Ofwat s calculation of the upper quartile threshold for drinking water quality does not account for the relative incidence of lead pipework in companies 11
12 networks. The target is therefore unrealistic for Thames Water s area where 62% of properties have lead pipework, compared to the rest of the industry where levels of lead pipes are as low as 17% In addition, the horizontal audit on flooding has had a disproportional impact on our customer focused flooding programme, and could incentivise the delivery of non-cost beneficial schemes. At the same time, Ofwat has not reflected the full value of our AMP6 sewer flooding programme in its Wholesale Wastewater baseline. D 1.17 Allowed expenditure As set out in the table below, the challenges to allowed expenditure are substantial. Table 1: Differences in allowed expenditure m June Submission Ofwat DD Difference Variance Wholesale water 3,643 3, % Wholesale wastewater 3,876 3, % TTT % Retail household % Retail non-household % Total 9,099 8, % Source: Thames Water calculations. Note: For retail businesses, allowed expenditure is shown as allowed cost to serve and June 2014 submission values are prices. All other costs are prices In some cases, such as the planned TTT expenditure and the challenges to certain elements of the Retail control, we understand why Ofwat has requested more information to demonstrate how the costs are in the interests of customers. With that in mind, we have provided further evidence to support our plan and demonstrate what we believe is the best outcome for our customers, making it clear why we believe this evidence meets Ofwat s gateway tests. In these areas, we look forward to Ofwat restoring allowed expenditure in its Final Determination. In other cases, including the unanticipated intervention to reduce the allowed expenditure for the Wholesale Water price control, we question the basis upon which Ofwat has intervened and its impact on customers. We are particularly concerned about the proposal to apply a capping solution. This has the effect of disallowing c 360m 2 of baseline totex over , thereby setting the totex baseline 10% below the upper quartile efficient level of expenditure for Water Wholesale (as determined by Ofwat s independent modelling). If retained in the Final Determination, we think 2 The c 360m is the difference between Ofwat s calculated baseline and its capped baseline. Table 1 shows allowed expenditure difference which reflects Ofwat's 75:25 interpolation. 12
13 that an unintended consequence of this intervention would be to undermine the incentives for all companies to produce efficient plans in future. This would not be in the long term interests of customers. Alternative approaches, such as adapting the sharing factors between customers and the company would in our view provide a more appropriate response and are likely to have a less significant effect on future incentives to produce efficient plans Critical to the delivery of the performance commitments we have proposed for our retail household business is the successful implementation of our new customer relationship and billing system. This investment will provide customers with a wide range of the benefits they have told us they want including full online account management and new innovative tariffs. Our response sets out further evidence supporting this investment, as well as our proposals for how to protect customers in the event that the investment does not deliver as envisaged. The retail household section also provides details of a number of additional average cost to serve adjustments that we recommend Ofwat takes into account in its Final Determination. These include a change to the allocation of costs between unmeasured and metered activity and an adjustment to reflect the unusually high number of rental properties and the transient nature of our customer base that means that default rates are higher than in other parts of the country. We also propose a number of technical adjustments related to the use of the 2012/13 price base, the impact of the TTT and the efficiency savings we had proposed through our customer outcomes. The non-household retail business has also provided additional evidence to support the necessary investment in a new customer relationship and billing system to meet the needs of customers and the competitive market. We have responded in detail to the other comments raised by Ofwat regarding market opening costs and the default tariff structure and set out our case for not deflating the price base. We believe that the additional evidence should enable Ofwat to approve and include our revised costs to serve in the default tariff. We are also concerned that some of the legacy adjustments proposed are not appropriate, including legacy TTT, shortfalling, logging below materiality threshold and shortfalling vs. logging. E Risk:reward package We question whether the nature of the risk:reward package that is implicit in the Draft Determination is in the long-term interest of customers. This package involves substantially higher risk and less reward than the package underpinning our June 2014 Submission, which was based on our customers preferences. In terms of the risk, Ofwat has proposed changes to our ODI framework, including increasing the penalty levels. In certain cases, we can accept the modifications to the ODIs, for example the inclusion of penalties for performance. However, we cannot accept the risks implicit in Ofwat s proposed, narrowly defined uncertainty mechanisms for the TTT which overlook a range of events beyond our control that could give rise to delays in this crucial. We have therefore put forward an alternative proposal in Section 4. 13
14 1.27 In terms of rewards, we flagged in our June 2014 Submission the particular risks that we face with the TTT, as evidenced by the Moody s Credit Opinion 3 and S&P s recent note which places Thames Water on negative outlook 4. Ofwat has so far failed to acknowledge these additional risks. We have, therefore, set out the evidence to support the inclusion of these risks in any assessment of the appropriate reward for the company, and encourage Ofwat to take this evidence into account before reaching a balanced view on the WACC in its Final Determination. F 1.28 Our overall conclusions on the Draft Determination Overall, there are many areas of the Draft Determination that we support. In those areas where we cannot support the approach Ofwat has proposed, we have sought to provide further evidence to explain why the intervention is not in the interests of customers. We continue to support wholeheartedly the principle that companies should own their plans and that these plans need to be based on customers preferences. We welcome the positive engagement we have had with Ofwat during the query process and we hope that these detailed representations will lead to a Final Determination that reflects the service levels, total expenditure, and risk and reward package that is in the best interests of our customers. G 1.29 Structure of this response For Ofwat s convenience, the structure of this response mirrors that of the Draft Determination as closely as possible. It is, therefore, structured as follows: Section 1 (this section) provides an overall high level summary of our response to the Draft Determination; Section 2 responds to the Wholesale Water Draft Determination, including in particular representations on the 5% cap, the impact of the interventions on performance commitments and ODIs and the legacy adjustments. Supplementary information and detailed responses on specific issues regarding the Wholesale Water Draft Determination are included in Appendix A; Section 3 responds to the Wholesale Wastewater Draft Determination, including in particular representations on the impact of the interventions on performance commitments and ODIs, in particular for sewer flooding and on legacy adjustments. Supplementary information and detailed responses on specific issues regarding the Wholesale Wastewater Draft Determination are included in Appendix B; Section 4 summarises our response to the TTT Draft Determination, to complement the fully detailed response set out in Appendix C; 3 4 Moody s Credit Opinion: Thames Water Utilities Limited 16 April 2014 (Thames Water June 2014 Submission). Credit FAQ: How Does OFWAT's Latest Price Review Affect The U.K.'s Water Companies?, 16 September
15 Section 5 responds to the Retail household price control. Supplementary information and detailed responses on specific issues regarding the Retail Household Draft Determination are included in Appendix D; Section 6 responds to the Retail Non-household price control. Supplementary information and detailed responses on specific issues regarding the Retail Nonhousehold Draft Determination are included in Appendix E; and Section 7 includes our response to those aspects of the Draft Determination that apply at the appointed business level. 15
16 Section 2 Wholesale Water A 2.1 Introduction In this section we set out our views, supported by analysis and evidence, on the following: the application of Ofwat s horizontal checks to the performance commitments for drinking water quality and supply interruptions. We consider that the resulting interventions are not in customers interest. Details are provided in Section B; the delivery incentives for asset health, which we consider are disproportionate, and clarification on the interpretation of the ODI deadbands. Details are provided in Section C; the 5% cap. We welcome Ofwat s continuing assessment that our Wholesale Water business costs over AMP6 are very efficient, although the cap used in place of the totex modelling to set allowed totex is unreasonable and not in customers longer-term interests. Details are provided in Section D; Ofwat s assessment of the reconciliation for our performance, which we are challenging. We also provide additional evidence requested by Ofwat in respect of certain service standards outputs in its of 13 August Details are provided in Section D; and the uncertainty mechanism for business rates, which is unlikely to apply in practice. Details are provided in Section E. 2.2 Further details and evidence, which are referenced throughout this section, are provided in Appendix A. B 2.3 Outcomes & Performance Commitments Ofwat has emphasised throughout the price review process that a fundamental principle of the approach to PR14 is the drive to increase customer engagement and business ownership of plans. 5 We support this approach, and have engaged extensively with both our customers and Customer Challenge Group (CCG). 6 Our outcomes, performance commitments (PCs) and outcome delivery incentives (ODIs) in our June 2014 Submission have emerged from this extensive engagement and the cost benefit analysis we carried out, based on willingness to pay studies and dedicated customer research on delivery incentives. 5 6 For example, see Ofwat, Final methodology and expectations for companies business plans (July 2013), Section 1.3 and Ofwat DD notice, page 11. Details were provided in our December 2013 Submission (SE02 Customer Engagement and SE11 Customer Challenge Group) and our June 2014 Submission (Appendix 2 Customer Line of Sight). 16
17 We have worked hard to adopt a package of PCs and ODIs that conformed to Ofwat s guidance on the PR14 methodology (July 2013), and risk and reward guidance (January 2014). We are pleased with the positive feedback we have received from Ofwat on our customer research and note that, in many instances, Ofwat has accepted the commitment levels and incentives proposed in our June 2014 Submission. As Ofwat had previously acknowledged, our progress in this area and had stated that we had relatively few issues, 7 we are therefore disappointed at the degree of interventions, and now find ourselves in a position in which the funding (both in terms of cost allowances and returns for risk) do not align with the PCs and ODIs we have to meet. Where Ofwat has intervened on performance commitments, we have assessed whether these changes are in the best interest of customers (based on the extensive engagement we have had with our customers and CCG) and whether these changes are reasonable based on further information from the horizontal checks. Our analysis has raised a number of material concerns relating to: horizontal checks; water quality (WB3); and supply interruptions (WB5). 2.8 We set out these concerns below and provide further details in Appendix A. Horizontal checks If applied appropriately, we consider that Ofwat s horizontal checks provide a useful sensecheck across the industry around the ambition of each company s plan and the extent to which each company can earn rewards for less than upper quartile performance. However, we are concerned that the application of these horizontal checks to set PCs is not in the interest of customers and is unreasonable, for the reasons summarised below. We provide further detail in Appendix A, Annex WWT08. First, Ofwat's interventions undermine the ownership of plans by businesses, and all of the long term advantages to customers that can flow from that. Our PCs have been developed in consultation with our customers and CCG. In many cases, these have been replaced by a requirement calculated through the horizontal checks, without adequate adjustment for the many and varied factors that went into developing these PCs. This will have a detrimental impact on the incentive of companies, and their CCGs, to engage in comparable processes in the future, which would lead to worse outcomes for customers. Second, it is unreasonable to assume that each company should meet the same level of performance by 1 April This does not fit with Ofwat s design of the PR14 process, where all companies were invited to set PCs according to the preferences of their own customers. More specifically, Ofwat s interventions cut across the findings from our customer research as to the level of performance that customers want, i.e. our customers said it would be disproportionately expensive to achieve these more stretching performance levels in 7 For example, in the meeting with Ofwat to discuss feedback on the PCs and ODIs on 10 July
18 AMP6, and evidence suggests that this is an inefficient solution to manage the longer term risk in a sustainable manner Third, by requiring companies to achieve upper quartile performance in respect of every performance metric it has identified, Ofwat is effectively requiring an even higher level of performance than that of an upper quartile company (a company that would average the upper quartile level rather than meet or exceed it in every single area). Fourth, it is not reasonable for performance commitments to be set automatically at upper quartile performance. These interventions appear to be based on Ofwat s assumption that customers have paid and will continue to pay for upper quartile performance, and thus should receive this as soon as possible. However, this assumption is not correct because: in the past, most customers have neither received nor paid for upper quartile performance. Instead, charges across companies have varied to reflect a wide variety of standards. Therefore, to the extent that past spending drives performance (which is expected given the capital intensive and long-term planning nature of the industry, which determine service levels long after the investment is made), many customers have not paid for upper quartile performance; in respect of , Ofwat is also proposing to set price controls (or expenditure incentives ) based on allowing upper quartile efficiency. This is a lower level of allowed expenditure than that necessary to achieve and sustain upper quartile performance as service performance tends to be better among those companies whose bills are higher; for Thames Water, the inconsistency between the required service performance and allowed expenditure is even greater because the 5% cap applied by Ofwat assumes that Thames Water can achieve industry upper quartile levels of performance with around 360m (over 10%) less expenditure than Ofwat's modelling suggests Thames Water (operating to an upper quartile efficient level) requires; and Ofwat s econometric modelling targets upper quartile totex efficiency but only average performance, with any additional costs from more stretching levels of performance to be reflected through additional cost claims outside the model. This is reflected in Ofwat s Draft Determination: We consider that the models do capture average industry quality and complexity of treatment and, as noted by CEPA, the inclusion of a time trend captures industry wide changes in expenditure related to quality of service over time. Where a company is proposing a properly justified programme that would significantly improve quality over and above what it has done in the past or above what other companies are undertaking then it could either make a special cost factor claim or submit an appropriately calibrated ODI to provide the necessary funding In addition to these issues with the interventions based on the horizontal checks, we have identified a number of factors not taken into account in the horizontal check calculations, where company data has not been normalised sufficiently in order to be comparable. This is necessary to ensure some companies do not benefit from windfalls while other companies are unjustly penalised. We discuss these factors further below for each PC. 8 Ofwat Draft Determination technical appendix A3 wholesale water and wastewater, page
19 Overall, our findings mean that we have serious concerns that the interventions made on the basis of the horizontal checks will harm customers both in AMP6 and the longer-term. We therefore strongly encourage Ofwat to withdraw these interventions on the PCs as a result of the horizontal checks. We note that prior to our June 2014 Submission, Ofwat had clarified its guidance that companies should only be rewarded under the ODIs for stretching performance. 9 As the ODI deadbands and reward caps are used to determine the range in performance over which ODI rewards are determined, we were surprised that Ofwat did not use the findings from its horizontal checks to instead sense-check and challenge the levels of reward deadbands, taking into account the same important factors identified above. We provide specific recommendations for the drinking water quality and supply interruptions ODIs in Section C. Drinking Water Quality We have always aimed for and will continue to strive to achieve 100% compliance and a clean and safe drinking water supply. However, the actions to achieve this should be proportionate and reasonable, to protect customers from facing disproportionate costs that they are not willing to pay for. Analysis by us and external bodies estimates that 100% compliance would require up to 3bn of investment for total lead removal, 10 in addition to further investment for the removal of other elements such as nickel. With this in mind, we support the concept of setting a commitment level of 100% across the industry to show drinking water quality remains an industry priority. However, we are very concerned about the intervention that Ofwat has made to align the penalty deadbands with its assessment of upper quartile performance, which cuts across our customer research. 11 This intervention would not be in customers interests because: achieving 99.96% (to avoid an ODI penalty) 12 would be disproportionately costly. Our analysis estimates that 99.96% compliance would require an investment of approximately 64m for the large increase in lead pipe replacement on our network and also our customers private plumbing. 13 This is because of the high incidence of lead pipework in our area (62% of the pipework connecting to our customers properties, compared with an industry average, including Thames Water, of 36.1%), which is outside reasonable management control; this investment of approximately 64m achieves a benefit-cost ratio 14 of 0.34 (i.e. costs are around three times the size of the benefits). This investment would therefore not be For example, IN 14/08, 2014 price review information for companies on revising their outcomes proposals, May 2014 CIWEM s position on lead in drinking water July The performance we have committed to aligns with our customer expectations and is supported by the customer willingness to pay evidence as described in our June 2014 Submission, PCR PC WB3. This is based on our assumption that penalties start to apply beyond the revised deadband in the Draft Determination of 99.96%, i.e. at levels of performance of 99.95% and below, in line with Ofwat s to Thames Water on 26 September Appendix A, Annex WWT01 WB3: Compliance with Drinking Water Quality standards, pp.12. Projects with a benefit-cost ratio more than one means that benefits are greater than costs, and a ratio less than one means that costs are greater than benefits (and therefore the project is not allocatively efficient for society). 19
20 cost-beneficial for our customers. By contrast, our June 2014 Submission was costbeneficial with a benefit-cost ratio of 1.18; and the DWI 15 supported the performance commitments in our June 2014 Submission and not the additional investment to reach these more stretching levels Ofwat has also not reflected an important factor in its upper quartile calculation by not taking into account the tightening in the lead standard. 16 On a like-for-like basis, the 99.94% proposed in our June 2014 Submission for the year 2015/16 is equivalent to 99.98% 17 based on the AMP5 lead standard. Due to this, it is not reasonable to compare AMP5 with AMP6 performance and assume that a similar level of work will achieve the same performance. As mentioned above, Thames Water has a much higher incidence (62%) of lead pipework connecting to our customers properties compared to the industry average (36.1%), which is a legacy of historical investment decisions, in line with Ofwat s and DWI s requirements, which is therefore outside reasonable management control in AMP6. This means the change in lead standard will affect Thames Water disproportionately, and should therefore be adjusted for in any industry comparison. Based on the factors above, we request that Ofwat reverts to setting the deadband to the level in our June 2014 Submission, which is supported by our customer research, analysis of cost-beneficial levels and support from the DWI. Though not our preference, if Ofwat was to set customers views to one side, it should make consequential adjustments to account for its replacement of customers views with the more demanding performance standard. For Thames Water, this would mean both removing the 5% cap and allowing Thames Water the additional costs associated with meeting the industry-wide standard. We provide further details and evidence on these issues in Appendix A, Annex WWT01. Supply Interruptions We are concerned about the intervention by Ofwat on our proposed Supply interruptions PC, which moved the target from 0.13 to 0.11 hours per property from onwards. This is not in the interest of our customers because the performance commitment cuts across our customers preferences. Our water plan, which has been assessed to be efficient, delivers performance at 0.13 hours per property. Our research showed that the costs of more stretching performance would be disproportionately costly to achieve. To achieve the short term improvement and to ensure this performance is then sustained would require an investment of 71m totex, comprising: Letter from DWI, dated 15 October Based on the information submitted by the Company, the Inspectorate supports the need for a scheme to reduce the risks to wholesomeness associated with the above named parameter in water supplied to consumers, for drinking water quality reasons. The European health-based standard for lead in drinking was reduced from 25ug/l to 10ug/l on the 25 December Appendix A, Annex WWT01 WB3: Compliance with Drinking Water Quality standards, pp 6. We provide further details and evidence on these issues in Appendix A, Annex WWT02. 20
21 acceleration of our mains replacement programme without collection of the information required to target investment in the most cost-beneficial way; and use of short-term opex solutions to meet the tighter performance target for AMP6. This does not represent the best solution on a whole-life cost basis The customer research evidence in our June 2014 Submission showed that customers are not willing to pay for this more stretching level of service set by Ofwat. 19 Our June 2014 Submission focuses on delivering a sustainable level of performance for our customers, based on delivering the following key elements aligned with the recommendations of the Mains Replacement Independent Review (MRPIR) these were: 20 integrating each investment area and solution to deliver multiple benefits; including increased monitoring solutions rather than replacement; and improving our understanding of the future (deterioration) to sustain performance We are concerned that the change in the PC could move this focus from longer-term sustainable solutions to short-term improvements, which are not in customers long-term interests. In addition, Ofwat s comparison of companies omits important factors. Our operating circumstances mean that we face additional challenges to maintain and improve performance relative to others in the industry. This includes having the highest density of properties per km (leading to the highest risk of an interruption to supply), with the urban areas of London having the slowest moving traffic (causing increased delays in our workforce being able to safely reach and resolve any interruption) and having the oldest asset base embedded largely in London clay that continues to erode our mainly metallic pipework (leading to an increased prevalence of bursts per km and likelihood of interruptions). These factors should be accounted for when comparing our performance relative to the industry. Based on the factors above, our preference would be for Ofwat to revert to setting the PC and deadbands to the levels in our June 2014 Submission, which is supported by our customer research and analysis of cost-beneficial levels of service. Though not our preference, if Ofwat was to set customers views to one side, it should make consequential adjustments to account for its replacement of customers views with the more demanding performance standard. For Thames Water, this would mean both removing the 5% cap and allowing Thames Water the additional costs associated with meeting the industry-wide standard. In addition, we would request that Ofwat sets deadbands to account for the catch up required and the natural variation in environmental factors affecting the measure that are outside reasonable management control This was described in our June 2014 Submission in PCR PC WB5. Further information on the MIRPIR and its incorporation into our plan are outlined in the appendix T0018 TW IAD Distribution Mains 2013 in our December 2013 Submission and Performance Commitment Response PR14 June 104 PCR PC WB5 in our June 2014 Submission. 21
22 C 2.33 Delivery Incentives We consider that a number of Ofwat s interventions appear to be reasonable. These are: including ODIs in We stated in our June 2014 Submission that we thought it would be more practical to set incentives for performance at PR19 (so ODIs would be based on actual, not forecast performance) and expected to be accountable for performance. As Ofwat s view is that performance should form part of PR14 we are not challenging this intervention; widening the ODI penalty collar in for PC WC2 Leakage. We stated in our June 2014 Submission that we thought that the collar in provided adequate protection for customers. We recognise, however, that Ofwat stated in its final PR14 methodology that it would intervene where necessary to set consistent incentives for leakage 21 and that other companies have the potential for penalties on leakage in ; and widening the penalty collar for the four asset health PCs (WB1, WB2, SB1 and SB2). We stated in our June 2014 Submission that we thought that the collar represented an appropriate balance of risk during AMP6. We have reflected on whether we can assume the risk associated with a lower collar than the P10 outcome, and have resolved to do so on behalf of our customers However, we raise concerns below relating to: asset health (WB1 and WB2); and interpretation of ODI deadbands. Asset health 2.35 Ofwat has intervened on the two Wholesale Water asset health ODIs as follows: rolling forward the ODI penalty to cover year 5 ( ); moving the penalty collar to five years of deteriorating service, as Ofwat did not consider that the collar in our June 2014 Submission provided adequate protection for customers; removing the penalty deadband of two years of marginal service, meaning that a single year of marginal service would result in a penalty; and 2.36 increasing the penalty rate for WB1 from 4.6m (which represented incremental cost + 10% premium, to provide a disincentive to underspend) to 5.75m (which represents incremental cost + 10% premium + 25% premium ), on the basis that this would provide additional protection, in recognition of shortfalls in AMP5. As set out above, we are not challenging the first two interventions. The third and fourth interventions, however, do not provide additional protection for customers, while further skewing the ODI framework to the downside. We explain why below. 21 See, for example, section in Ofwat, Setting price controls for final methodology and expectations for companies business plans, July
23 Asset health deadband The deadband in our June 2014 Submission (where penalties are incurred for marginal/deteriorating performance in two or more consecutive years) provides additional protection for our customers. Where the company incurs marginal performance in one year, the deadband combined with the annual ODI means the incentive to bring performance back to stable in the following year is twice as large as the incentive without the deadband, 22 as this would be the penalty avoided. Therefore, the deadband provides additional protection for customers over the case where there is no deadband by increasing the incentive to recover less than stable performance. The aim of the PCs is to focus on providing a stable level of service for future customers. The deadband in our June 2014 Submission was set so as to ensure that the company is penalised when either: (i) there is a sustained marginal or deteriorating state of the assets; or (ii) the asset performance at the end of AMP6 is either marginal or deteriorating. In both cases, penalties would be incurred under the deadband. However, without a deadband, penalties would be incurred for a single year of underperformance before the end of AMP6, which does not necessarily indicate a sustained marginal or deteriorating state of the assets, or a marginal or deteriorating state at the end of AMP6, and therefore is disproportionate. We note that, during AMP6, customers are protected from a single year of underperformance through the ODI penalties for related PCs for supply interruptions and drinking water quality. The maximum financial penalty attributable to these separate performance measures in our June 2014 Submission is 74m over AMP6. This means that the company already faces a substantial incentive to maintain performance for current customers, where the deadband for asset health reflects protection for future customers and mitigates the risk of unnecessary double-counting of ODI penalties. We would therefore encourage Ofwat to include the deadband from our June 2014 Submission in the Final Determination, to reflect the appropriate protection for our customers and the balance of risk. Asset health infrastructure penalty rate for WB Ofwat s intervention to increase the penalty rate is not necessary for additional customer protection because: for the Asset Health penalty we have already added a penalty premium to the incremental avoided costs, which increases the incentive rate by 20% compared to using avoided costs only. We set out in our June 2014 Submission that this provides a material disincentive to underspend and underperform. The additional 25% premium added by Ofwat means that the incentive rate is equivalent to a 50% premium on incremental avoided costs. 23 This is significantly above the premium applied by Ofwat So for example, where the incentive rate is 4.6m per year per status decrement, the avoided penalty (and therefore incentive) to recover marginal service from the previous year would be 9.2m. In our June 2014 Submission, we applied a 10% premium on avoided costs as a proxy for willingness to pay (WTP) in the penalty formula. This results in a penalty incentive rate that is 20% higher than incremental avoided costs. Ofwat s application of an additional 25% premium therefore results in a total premium above incremental avoided cost of 50%, i.e. penalty incentive 23
24 for other companies ( 25% premium ), and would not further protect customers as our June 2014 Submission already included an incentive rate materially above avoided incremental costs; and Ofwat justified its intervention on the basis of Thames Water s AMP5 performance. However, underperformance on supply interruptions (the reason for the marginal rating in AMP5) will also incur a penalty in AMP6 under the specific supply interruptions ODI, which is linked to lost customer benefits. This means the change in incentive rate double-counts the need for additional customer protection, imposing a disproportionate penalty on the company. Note that any shortfall penalties for performance in AMP5 would amount to a double penalty (though we set out our challenges to this shortfall penalty in Section D) We would therefore encourage Ofwat to restate the penalty rate for WB1 to be in line with our June 2014 Submission. Asset health penalty collar 2.43 Ofwat s intervention on the penalty collar increases the maximum potential penalty under the two asset health ODIs (from 37m to 104m). Given this additional risk, we consider it is appropriate to provide further transparency in the details of the ODI about the assessment of the PC in practice. We have provided in Appendix A, Annex WWT03, the additional wording from our June 2014 Submission and subsequent query responses that we consider should be included in the Final Determination. Interpretation of ODI deadbands When specifying reward and penalty deadbands in our June 2014 Submission, we had assumed that the rewards and penalties would only be incurred for performance outside the deadband range (i.e. the first point beyond the deadband is the level of service at which the incentive first applies). We were initially concerned that the deadband interpretation stated in the Draft Determination, which is that a deadband is the level of service at which the incentive first applies unless otherwise stated (e.g. by using a "greater than" sign), 24 amounted to a difference in approach. However, we understand from a query response to Thames Water on 26 September 2014 that Ofwat s approach to the operation of deadbands was intended to align with ours. In order to clarify the interpretation of deadbands, we have proposed presentational changes to the deadbands in line with Ofwat s guidance, provided in Appendix A, Annex WWT04. This is necessary to avoid any ambiguity in the interpretation of deadbands and to ensure that the ODI impacts presented in Ofwat s Risk Assessment Tool (RAT) v3 accurately reflect the true potential rewards and penalties. 24 rate =1.25 *(WTP cost * 50%) = 1.25 * (cost * 110% cost * 50%) = Cost * 75%, which is 50% higher than incremental avoided cost (i.e. Cost * 50%). This is set out in Draft Determination company-specific appendix, page 119, footnote 11 and Ofwat s response to query ref 1/9/14 12 in an from Andrew Chesworth (Ofwat), 5 September
25 D Calculating the Wholesale Water Price Control 5% Cap A key principle followed by Ofwat throughout the price control process is that the baseline set for any given company should be as independent as possible from that company s business plan. Ofwat and its expert advisors have gone to substantial lengths 25 to develop econometric models that ascertain independent baselines for the purposes of setting allowed expenditure. It has also used its advisors to develop independent views on the explanatory variables of expenditure. 26 Ofwat has consulted on the models and obtained feedback from companies. Having reviewed and taken account of this feedback, it decided to retain the modelling approach. 27 It follows that Ofwat is satisfied that its models are fit for purpose and enable it to discharge its statutory duties. Draft Determination In the Draft Determination, in a late change in its approach, Ofwat has introduced an arbitrary adjustment which it calls its capping solution that limits the baseline to be no more than five per cent higher than a company s planned expenditure. Ofwat s capping solution applies to three of the ten WASCs, including to our Wholesale Water business. The effect of this is that Ofwat s baseline, instead of being as independent as possible from the company s own plan is in fact driven entirely by the company s business plan (being simply five per cent more than the company s business plan level). For the price controls that the arbitrary 5% cap has been applied to, this overwrites all of the detailed econometrics developed by its experts. Ofwat argues that its capping solution seeks to strike a balance between the interests of maintaining incentives to be more efficient, on the one hand, and ensuring that consumers pay no more than is reasonably necessary for the services they receive. Ofwat supports its judgement with a number of considerations, which include: the approach to the enhanced companies provides an effective boundary to the efficiency of other companies; the natural imperfections of all modelling and information asymmetry result in a risk that the models may over-estimate required totex; the need for a consistent approach across companies; providing strong protection for customers; specific known modelling impacts including scale/density; and The establishment of these models by expert advisors is an important part of the reason for Ofwat increasing its budget. See Thames Water s formal representation letter on the PR14 wholesale cost assessment models, 3 June For example, in Annex 1 of the DD technical appendix A3 Wholesale Water and Wastewater, Ofwat concluded that the totex models have important advantages over a more disaggregated approach in assessing comparative efficiency (page 84) and that there was no compelling evidence to suggest different weights to different models and consequently we applied an equal weight of 1/3 to each modelling stream (page 88). 25
26 the importance of recognising that companies may have made real efforts to secure efficiencies beyond those expected by Ofwat. Our response Our analysis shows that Ofwat s capping solution does not maintain incentives to be efficient nor does it ensure that over the long-term consumers pay no more than is necessary, indeed quite the reverse is true. We illustrate below that: the capping solution does not protect customers or maintain incentives for efficient plans; the premise for Ofwat s capping solution is incorrect; the approach is not consistent between companies; and there are better options for customers than a 5% absolute cap. The capping solution does not protect customers or maintain incentives for efficient plans In the three price controls where Ofwat applies its capping solution, there is a short-term price reduction for the subset of customers that take the relevant service from the companies affected by this cap, compared to the methodology used by Ofwat in the other 26 wholesale price controls. However, in the medium and longer term, the impact will be adverse for all customers as it takes away the incentive on companies to produce stretching plans. To illustrate this, our analysis showed that under the 5% cap, a company that submitted a plan that avoided this cap (with totex that is slightly less than 5% below the baseline), would be better off than a company who submitted a more stretching plan and subject to the 5% cap. 28 It appears that Ofwat must have been aware of this risk as it considered a solution that would set the baseline equal to business plan expenditure. This was rejected as Ofwat considered that it could have a detrimental impact on customers over time because companies may not be as incentivised to deliver an efficiently priced business plan in subsequent control periods. 29 We agree, though our analysis demonstrates that allowing a 5% efficiency outperformance only marginally mitigates this risk. Any efficiencies leading to the business plan totex being more than 5% below the baseline will be automatically passed to customers, providing no incentives to stretch the plan further. The disincentive to produce stretching plans is exacerbated by Ofwat s solution that applies an absolute cap on outperformance rather than adjusting the baseline on a proportional basis. Our detailed analysis shows that over the medium to longer-term, customers would be harmed by this intervention DDSE64, FTI, Assessment of Ofwat s totex cap at PR14, September 2014, page 28. DD technical appendix A3 Wholesale water and wastewater, page 17. DDSE64, FTI, Assessment of Ofwat s totex cap at PR14, September 2014, pages 9 and
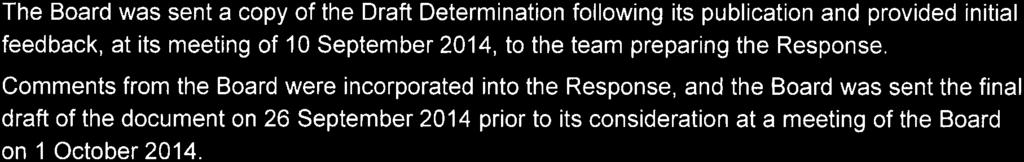
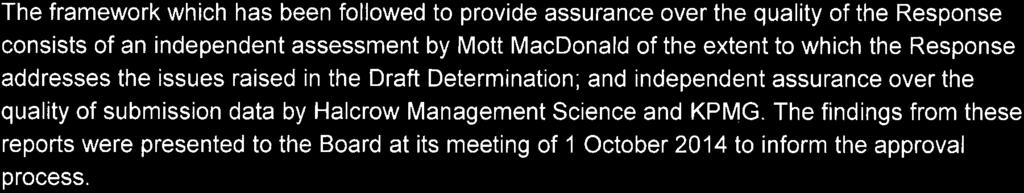
27 The premise for Ofwat s capping solution is incorrect Ofwat assumes that if customers pay more in this control than companies have requested in their business plans then they are paying more than it is in customers interest to pay. However, the analysis above demonstrates that customers best interests are served by providing companies with strong incentives to produce stretching plans. This is the best way to protect customers. In technical appendix A3, Ofwat states that it considered using the modelled thresholds for the baseline (as it has in the other wholesale price controls) and that it rejected this option because this places a very significant reliance on the outcome of our wholesale cost modelling. 31 This position is not internally consistent, as Ofwat is placing significant reliance on its models as it uses them to discharge its statutory duties for all but three of its price controls. However, we see no reason why Ofwat should not place reliance on its models. It has followed a clear and consistent approach in developing its independent modelling, used expert advisors and consulted with the industry. It has considered representations from companies and finalised its models. We agree that there are some natural imperfections in all modelling. However, Ofwat already has mechanisms in place to deal with this risk, for example, triangulation of a range of models and the 75:25 interpolation of baseline and company forecasts, which Ofwat applies in setting allowed expenditure. In addition, customers will benefit directly from a material share in any outperformance, obtaining approximately 50 per cent of any efficiency savings. Ofwat considers that information asymmetries may lead to a customer detriment in that companies may be expected to devote resources seeking to correct any issues with modelling that underestimate costs whilst deploying fewer resources to correct any overestimate of costs. Whilst this is a valid concern if there is only a single regulated business, it does not apply in these circumstances where there are many comparators. The models apply to many companies, some of whom appear to be efficient in the modelling and some who appear to be inefficient. The models will therefore be subject to extensive review and challenge. Ofwat has received representations on its modelling from nearly all companies and has decided not to make any adjustments. Ofwat suggests that specific known modelling impacts such as scale/density could have an influence on the modelling results. However, we have considered this issue and the analysis is clear that scale and density are not correlated with stretching plans. This is shown in Figure 1 and Figure DD technical appendix A3 Wholesale water and wastewater, page
28 Figure 1: Length of mains versus modelled totex Source: DDSE64, FTI, Assessment of Ofwat s totex cap at PR14, September 2014 Note: Red points highlight the capped firms and yellow points highlight the enhanced firms. Figure 2: Property density versus modelled totex Source: DDSE64, FTI, Assessment of Ofwat s totex cap at PR14, September 2014 Note: Red points highlight the capped firms and yellow points highlight the enhanced firms We consider that Ofwat can and should place significant reliance on its modelling. Ofwat also suggests that the approach adopted for the two enhanced companies operated as effective boundaries to what level of efficiency could be allowed. We do not understand this logic. firstly, enhanced companies were not capped in any way - the use of each company s own business plan forecasts of explanatory variables was a sensible modelling adjustment. This change recognised that the apparent efficiency of South West Water reflected differences in the explanatory drivers of expenditure between its business 28
29 plan and the independent forecasts. For Affinity Water the change in forecast expenditure drivers did not make any material difference; and secondly, there has never been any suggestion that the enhanced companies would be the most efficient companies and obtain the best result in every aspect of the control. This approach has not been applied elsewhere. For example, SIM rewards are not capped at the level of the enhanced companies and neither is the efficiency of the Wholesale Wastewater totex. The benefits of fast-tracking have been clearly set out to be reputational, procedural and financial. The financial benefits have been set out to include access to enhanced menus with greater sharing of efficiency savings and the fast-tracking financial bonus. Nowhere did Ofwat state that an advantage of enhanced status was the ability to avoid an arbitrary cap relative to your plan, as this would not have been in the interest of customers Consequently, there is no logic for, or requirement to, set an upper bound for the difference between business plan expenditure and the independent baseline at the level for South West, i.e. 8%. The approach is not consistent between companies Ofwat suggests that there is a need for a consistent approach across companies (excluding the enhanced ones However, there is no consistency in approach as some companies will have their allowed expenditure based on Ofwat s detailed econometric models and independent baseline, whilst a few have their baseline set equal to their business plan plus an arbitrary 5%. As the 5% cap lacks objective justification, it therefore appears to be discriminatory. Ofwat also highlights that it is possible companies may have made real efforts on their part to secure efficiencies over and beyond those expected by Ofwat. 33 As detailed in SE6 Cost efficiency (provided with our December 2013 Business Plan), we included stretching efficiency targets in our Wholesale Water plan, including around 180m 34 of opex savings and improvement in our capex unit costs of around 10% based on the cost base standard methodology. As a result of Ofwat s approach, we would have been in a position to gain more from omitting these from our plan and outperform during AMP6. We are clearly being penalised for doing the right thing. If included in the Final Determinations, Ofwat s arbitrary adjustment to baselines will limit the incentive on all companies to include stretching efficiencies in future plans. This cannot be the best solution for customers. If a solution is needed, there are better options than the 5% absolute cap 2.67 As set out above, the 5% cap provides a disincentive for companies to provide stretching business plans in the future, which outweighs the short-term gains for customers. This leads to the conclusion that any adjustments should be limited to the methodology for setting the independent baseline, rather than setting an arbitrary cap on outperformance DD, technical appendix A3 Wholesale Water and wastewater, page 18. DD, technical appendix A3 Wholesale Water and wastewater, page 19. Thames Water December 2013 Submission, SE6 Cost efficiency, Tables SE6-11 and SE
30 However, if Ofwat still considers that there is a problem in need of a solution at this price review, to maintain the truth-telling incentives any adjustment needs to be proportional to the degree of outperformance rather than applying an absolute cap. For example, if the 5% outperformance was used as a trigger for sharing outperformance, rather than an absolute cap, this would retain incentives to submit stretching plans. Figure 3 below illustrates a simple example with companies retaining a 50% share of outperformance after the 5% trigger (based on assuming the same 50% sharing rate as the break-even point in the totex menu). Allowed totex would be set in the same way, taking 25:75 interpolation of the business plan and new baseline. This modification would retain strong incentives to submit stretching business plans while providing additional short-term protection for customers. The results are shown in Table 2 below. Figure 3: Illustration of alternative to 5% absolute cap Source: Thames Water 30
31 Table 2: Illustration of alternative to 5% absolute cap Company Business plan totex ( m) (A) DD baseline totex ( m) (uncapped) (B) 5% trigger totex ( m) (C)=(A)*10 5% 50% share totex ( m) (D)=50%* [(B)-(C)] New baseline totex ( m) (E) = (C) + (D) DD baseline to Business plan (%) (E) / (A) -1 SVT (Waste) TMS (Water) YRK (Water) 2,658 3,000 2, , % 3,249 3,773 3, , % 1,487 1,596 1, , % Source: Thames Water calculations, based on Ofwat s published DDs for each company Notes: SWT = South West Water, SVT = Severn Trent Water, TMS = Thames Water, YRK = Yorkshire Water Ofwat s approach to the 5% absolute cap places a disproportionate burden on companies that provide the most stretching plans. If Ofwat wanted to retain the same level of allowed totex in its DD for the three companies currently capped, we have calculated that this could be achieved by placing a 62% weighting on business plans and a 38% weighting on the DD baseline for these companies plans. 35 This has the advantage of rewarding companies at this price review according to the level of outperformance in the business plan. We note, however, that it would not be a sustainable solution for future price reviews as it would mean incentives are not transparent when companies next submit business plans. Open Water costs 2.72 In the DD, Ofwat s policy has been to include in its Wholesale Water baseline estimates of the external market costs only. This does not acknowledge the new obligations imposed by the 2014 Water Act on wholesale functions to prepare for an expanded market, which will lead to additional costs for Thames Water to develop the new systems capability, manage the wholesale customer lifecycle and revenue collection, and manage changes to market codes and system interface requirements. We therefore consider Ofwat s policy to be unreasonable in this respect, as it should recognise the additional costs to meet the new obligations. Reconciling performance 2.73 In this Section we respond to the interventions Ofwat has made on the AMP5 legacy adjustments for Wholesale Water. 35 The sum of business plan totex in AMP6 for Severn Trent (Wholesale Wastewater), Thames Water (Wholesale Water) and Yorkshire (Wholesale Water) is 7,393m. For these same plans, Ofwat s DD threshold is 8,368m. Under the 62:38 weightings, the new baselines add to 7,763m and allowed revenue (after the 75:25 interpolation) is 7,671m, the same as in Ofwat s DD under the 5% cap. 31
32 2.74 We support, in principle, Ofwat s approach to logging adjustments and have not objected to the SEMD shortfall on grounds of materiality. However, we consider that: our water infrastructure serviceability was stable in and is expected to be stable in , meaning that a shortfall should not be applied; the additional evidence we provide supports the need to include the back-billing component in the RCM adjustment; and we can demonstrate that we have delivered, or expect to deliver, the service standard outputs in AMP5 that Ofwat raised in its of 13 August We set out below a proposed additional shortfall for the Retail Household bill system, consistent with Section 5. The sections below and Appendix A provide further details and evidence on each of these items. Serviceability Shortfalls Ofwat has applied a shortfall of 18m on the basis of its assessment of water infrastructure serviceability. This reflected its assessment that our serviceability was marginal in and , based on the interruptions to supply greater than 12 hours (DG3) sub measure. In a meeting with Ofwat on 1 May 2014, 36 the discussion concluded that although DG3 submeasure performance was marginal, application of the shortfall would depend on performance recovery in and that it would be appropriate to consider this in the trueup mechanism in Ofwat s approach in the Draft Determination is not consistent with this approach. The basis for Ofwat s retrospective change in assessment has not been explained in the Draft Determination, which raises concerns about regulatory consistency and transparency. Regarding Ofwat s assessment of marginal serviceability in the Draft Determination: It is not appropriate to assess the overall sub-service as marginal in due to the performance in only one of the six serviceability sub measures i.e. DG3 performance. RD 15/06 sets out that for each sub-service all of the indicators should be considered together as a basket of measures to inform current and future service capability. This would lead to an assessment of stable for our water infrastructure serviceability in In , the overall sub-service demonstrated stable performance. We recognise that there are instances where measures have been above the upper control limit, but the DG3 measure is naturally volatile, and is subject to spikes in performance. It is, therefore, impacted disproportionately by shorter term influences such as the weather, and factors inherent in the type of water network we operate. Performance spikes can be attributed to factors such as age and configuration of our water network and the dense population base it serves in London. Individual bursts or network incidents can cause interruptions to supply leading to a disproportionate impact on the duration and 36 Note of the serviceability meeting with Ofwat on 1 May 2014 final, 1 May
33 number of properties impacted. In light of these factors, performance in reflected underlying stable performance. Based on the evidence presented on our performance, we believe our performance should be assessed as stable. In our PR14 June business plan submission, we reported our serviceability performance forecast in 2014/15 as stable on the basis that all of the six sub-measures were stable, within the control limits set by Ofwat. We have seen no evidence in the Draft Determination which suggests that this is not a reasonable assessment, although Ofwat has assessed our performance as marginal. We have provided updated performance information which reinforces our view. In the event that Ofwat still consider a shortfall to be appropriate, the level that has been applied is considered unreasonable due to mitigating circumstances. In the winter of the South East of England experienced the wettest months since 1910 and highest wind gusts since This stretched our operational response and that of other utilities. In Appendix A, Annex WWT05 we describe two events where, although these where greater than 12 hours in duration, the shortfall should not be applied. The mitigation for these is due to the health and safety of our workforce working in severe environmental conditions that required greater care As we disagree with Ofwat s assessment of marginal serviceability in and , we consider that a shortfall should not be applied, or the extent should be re-considered in light of the evidence within Annex WWT05. SEMD Shortfall 2.81 We note that Ofwat has applied a shortfall of 5.8m for delays to our delivery of SEMD outputs. For our June 2014 Submission, our assessment was that the delay to delivery is for factors outside of our control, and therefore these outputs should be treated through the logging-down mechanism and not shortfalling. As this was below the materiality threshold, we did not include this item as a log-down. However we accept Ofwat s intervention is relatively immaterial. Billing System Shortfall 2.82 For Retail Household (see Section 5), we have proposed an additional shortfall of 5.4m for costs allowed in AMP5 to deliver a new billing system that was written off. As set out in this section, we have assumed that this shortfall will be applied to the Wholesale Water and Wastewater controls. Assuming an equal split in this shortfall between Wholesale Water and Wastewater, the amount attributable to Wholesale Water would be 2.7m. Logging 2.83 We are not submitting any challenges on the Wholesale Water logging interventions. 33
34 RCM Ofwat has reduced our Revenue Correction Mechanism (RCM) adjustments from m to m, as a result of excluding 11.1m related to the back-billed amounts in our June 2014 Submission and other changes, particularly the inflation adjustment. The back-billing component of the RCM adjustment is important in incentivising companies to identify properties that they have charged less than they should have and to recover the amount owed. In our June 2014 Submission we included 11.1m, based on the use of cash collection rates as a proxy for amounts received. The requirement that companies should have received all back billed amounts due from the customer in order for it to form part of the back-billing component was first introduced in RAG 4.04 in February 2013, after the RCM and back-billing component were established. Given the scale of our back-billing information (20,000 lines of data), and that our system is set up to apply monies received against the oldest debt first, Ofwat s guidance in RAG 4.04 does not present a practical option, as we consider that the necessary resource time and system changes are disproportionate and therefore not in the interest of our customers. Following the challenge from Ofwat, we have developed an alternative methodology which refines the approach taken in our June 2014 Submission. The revised approach looks at each customer individually, where back-billing has taken place, and only includes those customers in the claimable value where they are fully up to date with their payments. This demonstrates that back-billed amounts have actually been received from the customers in line with the Ofwat requirement. The resulting back-billing component ( 10.3m) is similar to and slightly below the amount in our June 2014 Submission ( 11.1m). The results of the alternative methodology therefore support the scale of the component. KPMG have performed agreed upon procedures to agree the results using the alternative methodology to supporting calculations. We consider that the data provided from this alternative methodology, which is broadly corroborated by the results in our June 2014 Submission to demonstrate robustness, provides the evidence for the back-billing component to be reinstated in our RCM adjustment. Service Standards outputs Following its assessment of our outputs and obligations in , Ofwat wrote to us on 13 August 2014 setting out some concerns over delivery of AMP5 service standards and that it was considering applying shortfalls equal to the cost of the projects allowed at PR09 for the Final Determination. Ofwat therefore requested further evidence from Thames Water on these FD09 outputs. The areas of concern are set out in the figure below. 34
35 Figure 4: Ofwat assessment of service level outputs in Source: from Ofwat on 13 August In Appendix A, Annex WWT06 we provide further evidence on how the AMP5 investment has delivered the service standard outputs relating to Wholesale Water, i.e. Resilience water, as stated in the PR09 Final Determination. In summary: We assessed on all the water service assets in accordance with the current Ofwat, Halcrow 37 and Environment Agency methodologies and agreed with Ofwat the levels of protection needed to secure resilience today and in the future. Sites were prioritised for investment based on Ofwat s banding methodology, according to asset size (Ml/d for water sites). The proposals were validated with our Operations team using information on historical flooding occurrences. During the winter of , the Thames catchment was subject to some severe storms which resulted in extensive flooding along the River Thames and its tributaries. Although it has not been possible to ascribe a definitive return period to this event, it was sufficiently severe to be used as a reference point for assessing the vulnerability of assets as well as their resilience to an extreme rainfall event. An external study 38 into the performance of the required AMP5 flood resilience investment programme following the winter event demonstrated that the service standard outputs had been delivered to those sites affected and customer water supplies had been protected This further evidence demonstrates that we have delivered the service standard Ofwat (2008) Asset Resilience to Flood Hazards: Developing an analytical framework, Halcrow. MWH AMP5 Flood Resilience Investment Performance, September
36 E Uncertainty Mechanisms 2.94 Our main concerns are that: (i) Ofwat has not recognised the increase in cumulo rates expected to arise in the 2017 revaluation in setting its DD cost threshold; and (ii) the size of the materiality threshold for an IDoK means that this notified item for business rates is highly unlikely to provide risk mitigation in practice. 39 We request that Ofwat considers whether a bespoke materiality threshold would be appropriate for this uncertainty mechanism. 39 In order for an increase in rates to trigger an interim determination, the 15 year Net Present Value (NPV) of the relevant cost must pass both a triviality and materiality test. Based on appointee turnover in of 1,909m, the 10% materiality threshold would be 191m. To trigger this, the annual additional cost would need to be at least 16.9m, which is more than twice the additional annual cost ( 7.3m) under our P90 scenario (were costs increase by 60%) after accounting for the 75:25 sharing rate. 36
37 Section 3 Wholesale Wastewater A 3.1 Introduction In this section we set out our views, supported by analysis and evidence, on the following: the application of Ofwat s horizontal checks to the performance commitments for properties protected from rainfall flooding and sewer flooding (other causes) incidents. We consider that the resulting interventions are not in customers interest. Details are provided in Section B; the delivery incentives for asset health, odour reduction, phosphorous removal and pollution incidents, where we consider the interventions are disproportionate and not in the interest of customers. We also provide clarification on the interpretation of the ODI deadbands. Details are provided in Section C; Ofwat s cost assessment on our sewer flooding programme and business rates, which we consider have not properly reflected the costs we expect to incur. Details are provided in Section D; and Ofwat s assessment of the reconciliation for our performance, which we are challenging. We also provide additional evidence requested by Ofwat in respect of certain service standards outputs in its of 13 August Details are provided in Section D. 3.2 More detailed representations on specific issues are included in Appendix B Wholesale Wastewater. B Outcomes & Performance Commitments As set out in Section 2B for Wholesale Water, we support the fundamental principle of Ofwat s PR14 approach to drive towards increasing customer engagement and business ownership of plans. We have achieved this, for example, through our extensive engagement with customers on our flooding programme, which included industry-leading levels of customer research and valuations. Given Ofwat s acknowledgement of the progress we made in our June 2014 Submission, we are concerned at the degree of interventions which mean that the funding (both in terms of cost allowances and returns for risk) do not align with the PCs and ODIs we have to meet. We have a number of material concerns where interventions are not in the interest of customers. These concerns relate to: horizontal checks; 37
38 properties protected from flooding due to rainfall (SB3); and number of internal sewer flooding incidents excluding those due to overloaded sewers (SFOC s) (SB4). 3.6 We set out these concerns below and provide further details in Appendix B. Horizontal checks Section 2B for Wholesale Water sets out our views on the application of the horizontal checks. Overall our findings mean that we have serious concerns that the interventions made on the basis of the horizontal checks will harm customers both in AMP6 and the longer-term. We therefore strongly encourage Ofwat to withdraw these interventions on the PCs as a result of the horizontal checks. We set out below further details on our concerns for the relevant PCs. Properties protected from flooding due to rainfall (SB3) Our PC covers a wide range of causes of flooding and our proposed ODI provides an incentive to deliver cost-beneficial solutions for new flooding needs which arise in AMP6. In the DD, Ofwat has made an adjustment to the PC, increasing the required annual benefit from m (which is the sum of all hydraulic flooding schemes in our June 2014 Submission) to m (an increase of 52%). Ofwat has also confirmed that it intends to include an additional penalty if the Counters Creek Scheme is delayed. 41 We are concerned that this intervention is not in the interest of customers because the application of the horizontal check cuts across our customer research. The PC in our plan is underpinned by cost-beneficial schemes based on industry-leading customer research and valuation. We have estimated that scaling up the sewer flooding schemes to achieve m of annualised benefits by 2020 would require an additional 173m totex. Our current view is that it is highly unlikely that new cost beneficial schemes will materialise in AMP6 that will be sufficient to deliver a 10.4m (52%) increase in annualised benefit, and it would only be in customers interest to deliver these schemes if cost-beneficial. The simplification necessary to carry out a horizontal check across all companies has led to unintended consequences, which adversely affects Thames Water and our customers. The horizontal check calculation focuses on other causes flooding, which has very different solutions to hydraulic flooding (i.e. this can be mainly characterised by operational solutions for other causes flooding and capital intensive schemes for hydraulic flooding). We have maintained separate measures, to appropriately incentivise improvements in both areas of flooding, which are supported by our customer research and extensive engagement with our CCG. Given that the hydraulic flooding relates to capital intensive schemes that should only be undertaken if cost-beneficial over the longer term for customers, it is not appropriate to apply a catch-up to a level of performance that could only be achieved by starting to deliver non cost-beneficial schemes in AMP6, which is not in the longer-term interest of customers Further details are provided in Appendix B, Annex WWS02. Draft Determination company-specific appendix, page
39 We therefore feel strongly that the intervention Ofwat has applied is not justified and damaging to the company s ambition to deliver the most cost-beneficial flooding programme for customers We request that Ofwat sets the annualised benefits back to m from our June 2014 Submission, which is underpinned by customer valuations and the extensive customer research that we have undertaken, 42 and our knowledge of the current cost-beneficial schemes. In addition, we consider that the specific penalty for the late delivery of Counters Creek in the Draft Determination should be reworded to reflect the statements in our June 2014 Submission, which we consider offers better protection for customers. Internal flooding incidents, excluding those due to overloaded sewers (SFOC) (SB4) In the Draft Determination, Ofwat has changed the PC from 1,209 to 943 incidents from This represents an improvement of 28% on legacy assets. Ofwat has also removed the reward and changed the penalty deadbands and penalty collars in line with the PC changes. We accept the allowance of 256 incidents for S105A sewers and pumping stations that Ofwat has assumed in the Draft Determination. However, we are concerned that the other interventions on the PC cut across our extensive customer research. Our research showed that customers are not willing to pay for the step change improvement in performance that Ofwat has identified. A target of 687 incidents on legacy sewers would take us well beyond the enhanced case of 845 incidents that we presented in Table 2a in our June 2014 Submission. Our internal modelling suggests that this improvement could cost an additional 53m- 80m capex (based on triangulation of bottom-up and top-down approaches), which is disproportionately costly. We are surprised that Ofwat removed the rewards, given the drive to incentivise companies to achieve stretching performance for customers. Ofwat states that its intervention is due to the shortfall for AMP5 performance. This is disproportionate, as it double-counts the shortfall penalty, and is somewhat counter-intuitive, as customers may benefit most from additional incentives to stretch performance where companies are deemed to need to catch up during AMP6. Ofwat s approach to applying the horizontal check calculation does not capture all relevant factors. For the reasons set out in the flooding due to rainfall section above, the comparison should consider SFOC only, not both types of flooding combined. In addition, the horizontal check does not reflect the degree to which flooding incidents occur in central London because of the high proportion of properties with basements. Basements are at greater risk of flooding internally, because they are close to or below the sewer line. Seventy percent of flooding incidents in occurred in London. The industry comparison will not be robust if these factors are not controlled. Our preferred option would be for Ofwat to use the PC included in Appendix B, Annex WWS03, Table 1. We accept that the PC needs to show continuous improvement, but this should reflect the totex in our plan and be cost-beneficial. However, if Ofwat chooses to See Supporting Evidence SE02 included with our December 2013 wholesale plan. Further details are provided in Appendix B, Annex WWS03. 39
40 impose its own PC then we would request that Ofwat allows the additional costs associated with meeting the industry-wide standard. C Delivery Incentives As for Wholesale Water, we accept Ofwat s interventions to include ODIs in and to widen the collar for the two asset health PCs (SB1 and SB2). However, we have a number of material concerns in other areas where interventions are not in the interest of customers. These concerns relate to: asset health (SB1, SB2); odour (SC7); phosphorous removal (SC9); and pollution incidents (SC2). Asset Health (SB1 and SB2) Ofwat has intervened on the two proposed asset health PCs and ODIs as follows: rolling forward the ODI penalty to cover year 5 ( ); moving the penalty collar to five years of deteriorating service, as Ofwat did not consider that the collar in our June 2014 Submission provided adequate protection for customers; including S105A transferred private sewers within the scope of the PC; removing the penalty deadband of two years of marginal service, meaning that a single year of marginal service would result in a penalty; and increasing the penalty rate for SB2 from 4.5m (which represented incremental cost + 10% premium, to provide a disincentive to underspend) to 5.6m (which represents incremental cost + 10% premium + 25% premium ), on the basis that this would provide additional protection, in recognition of shortfalls in AMP As we set out in Appendix B, Annex WWS05, we accept the first three interventions. For the inclusion of S105a transferred assets within the scope of the PC, the revised targets should be consistent with our response given in Ofwat s Informal Outcomes Query", which are detailed in Appendix B, Annex WWS05, Addendum 1, Table A3. We have also proposed additional details in line with our response around the process for determining asset health performance. The fourth and fifth interventions, however, do not provide additional protection for customers, while further skewing the ODI framework to the downside. We set out our reasons briefly below with further detail in Section 2C for Wholesale Water, as these are also applicable to these interventions for Wholesale Wastewater. 44 Further details are provided in Appendix B, Annex WWS05. 40
41 Asset health deadband The deadband in our June 2014 Submission: provides additional incentive properties and therefore protection for customers; reflected the intention to ensure that the company is penalised when either: (i) there is a sustained marginal or deteriorating state of the assets; or (ii) the asset performance at the end of AMP6 is either marginal or deteriorating; and reduces the risk of double-counting of penalties, as poor performance in a single year will be penalised through ODI penalties for specific PCs (pollution incidents and sewer flooding other causes), up to the maximum penalty of 98.4m For the same reasons as set out in Section 2C (asset health deadband) we consider that Ofwat should reinstate the penalty deadband for SB1 and SB2, in line with the June 2014 Submission. Asset health infrastructure penalty rate As set out in Section 2C for Wholesale Water, we consider that Ofwat s intervention to increase the penalty rate for asset health infrastructure (from 4.505m to 5.6m) is not necessary for additional customer protection as our approach already includes an additional penalty premium. In addition, increasing the potential penalty based on AMP5 performance is disproportionate and double-counts the separate serviceability shortfall. We therefore consider that Ofwat should reinstate the penalty rate for SB2 to be in line with our June 2014 Submission. Modelled reduction in properties affected by odour (SC7) The ODI for odour set out in our June 2014 Submission included the prospect for rewards where we could demonstrate a reduction in the number of properties affected by odour over and above the target set in our plan, subject to certain stringent criteria being met. Ofwat has intervened on the ODI by reducing the reward cap in and by 8,000 properties in each year, which Ofwat identifies as being in line with removing an equivalent number of properties that are within 500m of a wastewater site where odour problems may arise, but are not currently an issue. 48 Our view is that the ODI set out in our June 2014 Submission ensures customers interests are maintained and should be retained as it: incentivises us to respond swiftly to emerging issues; is managed by a strong gateway to ensure investment represents value for money; and has a robust QA process in place Further details are provided in Appendix B, Annex WWS05. Further details are provided in Appendix B, Annex WWS05. Further details in Appendix B, Annex WWS06. Company-specific appendix, page
42 It is important to have a flexible incentive framework in this area as the full extent of people who are affected by odour issues is typically not reflected by the number of odour complaints. Also it allows us to react promptly to manage significant issues. A key learning point from past experiences is that timely intervention on odour mitigation costs less in the long run 49. Ofwat states that another reason for its intervention is due to the PC being based on modelled results. 50 As confirmed by an expert review 51, Odour Dispersion Modelling is the best technique currently available that gives a reasonable framework to assess odour reduction benefit and provides a robust framework for reporting our performance accurately and calculating any associated ODI rewards or penalties set out in our June 2014 Submission. 52 While the potential rewards ( 11m) from the ODI are greater than the potential penalties ( 3m), these reflect the size of the odour programme in our June 2014 Submission and the potential for additional (as opposed to fewer) odour issues to arise. We note that Ofwat has stated that the intervention results in a reward cap of 6.66m. 53 We calculate the impact of Ofwat s intervention is to reduce the reward cap to 7.5m. 54 If Ofwat retains the intervention for the Final Determination, we would ask that it checks and, if appropriate, corrects this amount in the Additional details table for PC SC7. Reduce the amount of phosphorus entering rivers to help improve aquatic plant and wildlife (SC9) In our June 2014 Submission we proposed an ex-post reward and penalty mechanism for this ODI, with rewards and penalties determined at PR19 based on actual costs and benefits. We believe this is in customers interests given the uncertainty regarding the NEP5 programme which will not be agreed with the Environment Agency until January We set out in the PCR 56 submitted in June 2014 Submission how this would work in practice. The DD included an intervention to require penalty and reward incentive rates to be set by , i.e. after the programme itself should be published but before the actual costs of the NEP5 investments are known. We believe that given the significant potential variation in unit costs between NEP schemes, customers are better protected by setting ex post incentive rates based on actual benefits delivered and costs incurred, as this ensures reward incentives are limited to additional cost-beneficial options and penalties disincentivise the non-delivery of non-cost-beneficial options Technical Appendix T0330 Thames Water, Final Business Plan, Section B6 Sewerage Services odour, DD company-specific appendix, page 115. DDSE02 J.Hobson (2014) How to demonstrate the benefit of odour abatement measures. Technical Commentary, September Reference A3.1.1 Outcome delivery and reporting. The DD quoted a figure of 66.6m (DD company-specific appendix, page 172), though Ofwat stated on 5 September 2014 in response to a query that it had made an error and intended to state 6.66m. This is calculated as the difference between the revised reward cap and the PC level in each year, multiplied by the incentive rate of 220 / per modelled reduction in properties per year. Further details are provided in Appendix B, Annex WWS01. June 2014 Submission, Appendix 2, Annex 1, Performance Commitment Response, PC SC9. 42
43 3.36 We request that Ofwat should set the ODI based on our June 2014 Submission. If setting parameters earlier, it may be reasonable to set the benefits part of the incentive rate after the NEP5 is published in January 2016, as the concern focuses on the particular variability in unit costs by site, given the types of solutions are very site-specific. Category 1-3 pollution incidents from sewage related premises (SC2) In our June 2014 Submission we proposed a financial reward and penalty incentive linked to the number of pollution incidents (Category 1, 2 and 3) from sewage related premises. Ofwat has made the following interventions to the PC and ODI in its Draft Determination: increased the penalty rate for pollution incidents; amended the performance commitment to include serious pollution incidents (category 1 and 2) as a separate commitment with a zero target and deadbands throughout AMP6; included a gateway clause which prevents rewards being earned for category 1 and 2 incidents; rolled forward the incentive structure to include ; and included the impact of private sewers In line with our comments for other PCs, we are not objecting to the extension of the incentive to cover or the inclusion in the PC (with appropriate change to the PC level) of S105a transferred assets. In addition, the gateway clause seems a reasonable intervention to focus rewards for stretching performance. However, we are challenging the first two interventions on the increase in the penalty rate, and the amended targets and deadbands, which are discussed below: Increased penalty rate for pollution incidents The ODI penalty incentive rate in our June 2014 Submission was set using the standard methodology. We understand that Ofwat has increased the penalty rate due to concerns that the penalty rate could be less than the average incremental cost per incident and therefore has the potential to incentivise the company to reduce costs and incur additional incidents. However, in practice the combination of the financial and reputational incentives mean that Thames Water is already strongly incentivised to improve its performance on pollution incidents and avoid deterioration, for the following reasons: under the Environmental Permitting (England and Wales) Regulations 2010, a pollution incident can result in us being fined and ordered by the court to pay additional costs; pollution incidents are a sub measure for the Asset Health ODI, so will provide additional penalties for failures on this measure; and 57 Further information provided in Appendix B, Annex WWS04. 43
44 we have a strong reputational incentive to achieve our performance commitment, from regular engagement with the Environment Agency and AMP6 performance reporting to our customers and Customer Challenge Group Given these financial and reputational incentives, we request that Ofwat revert back to the penalty rate in our June 2014 Submission. Performance Commitment for Serious Pollution Incidents Our Draft Determination includes new targets and incentives relating to serious pollution incidents which require Thames Water to meet a target of zero serious pollution incidents from Year 1 of AMP6 onwards. Penalties apply if any serious (Category 1 and 2) incidents occur. No rewards will be earned on this ODI in any year when a serious pollution incident occurs. We consider that the principle that no rewards should be earned for the ODI when a serious pollution incident occurs is reasonable, for the protection of customers, but that it is unreasonable to set a target and deadband of zero from because: Ofwat does not appear to have been consistent in how it has applied this intervention between companies. In some cases, Ofwat has used a glide path to zero serious pollution incidents; and the penalty duplicates other penalty regimes under: (a) the asset health ODI; (b) Environmental Permitting (England and Wales) Regulations 2010 if prosecution results, and (c) Regulatory Enforcement and Sanctions Act (RES) if the proposal for Enforcement Undertakings is adopted On this basis, we propose that Ofwat should: set a glide path to zero for the target Category 1 and 2 pollution incidents by , which aligns with the EA s aspiration; and set a penalty deadband that reflects the glide path and represents the average level of consented events that do not attract penalties under environmental legislation, as these are outside reasonable management control. ODI deadbands 3.47 As set out in Section 2C for Wholesale Water, when specifying reward and penalty deadbands in our June 2014 Submission, we had assumed that the rewards and penalties would only be incurred for performance outside the deadband range (i.e. the first point beyond the deadband is the level of service at which the incentive first applies). We were initially concerned that the deadband interpretation stated in the Draft Determination, which is that a deadband is the level of service at which the incentive first applies unless otherwise 58 We provide further detail on the issues and our proposed approach in Appendix B Annex WWS04. 44
45 stated (e.g. by using a "greater than" sign), 59 amounted to a difference in approach. However, we understand from a query response to Thames Water on 26 September 2014 that Ofwat s approach to the operation of deadbands was intended to align with ours In order to clarify the interpretation of deadbands, we have proposed presentational changes to the deadbands in line with Ofwat s guidance, provided in Appendix B, Annex WWS07. This is necessary to avoid any ambiguity in the interpretation of deadbands and to ensure that the ODI impacts presented in Ofwat s Risk Assessment Tool (RAT) v3 accurately reflect the true potential rewards and penalties. D Calculating the Wholesale Wastewater Price Control Sewer flooding programme We included a Cost Assessment Exclusion for our AMP6 hydraulic sewer flooding alleviation programme in our June 2014 Submission. Our June 2014 Submission also contained additional evidence on the cost benefit analysis and robustness of the cost in response to Ofwat s Risk-Based Review assessment of our December Business Plan, 60 and an ODI to protect customers against under-delivery. 61 The single cost assessment exclusion consisted of two distinct components: the Counters Creek scheme ( 257m); and other AMP6 sewer flooding schemes ( 101m) In the deep dive in its DD, Ofwat assessed Counters Creek and other flooding schemes separately, including calculating separate implicit allowances. The total implicit allowance for the cost assessment exclusion was 237m, equivalent to the upper quartile forecast from its sewer flooding cost assessment model, apportioned to Counters Creek and other schemes in proportion to their relative totex. Due to fails in its deep dive tests, Ofwat did not accept the Cost Assessment Exclusion above its implicit allowance, which was 121m (34%) lower than the programme in our June 2014 Submission. For example, Ofwat considered the Counters Creek scheme as an overall fail on the basis of the robustness of cost estimate. In this section we respond to each of Ofwat s concerns and set out why the full funding of the sewer flooding programme is appropriate and in the interest of customers. Our views are set out as follows: why funding our enhancement flooding programme is in the interest of our customers; what parts of Thames Water s sewer flooding programme are appropriate to be treated as a cost exclusions outside of Ofwat s modelling and the implicit allowance; and This is set out in Draft Determination company-specific appendix, page 119, footnote 11 and Ofwat s response to query ref 1/9/14 12 in an from Andrew Chesworth (Ofwat), 5 September GAR E - Hydraulic Flooding & Outfalls, June 2014 Submission Performance Commitment Response: SB3 Properties protected from flooding due to rainfall, June 2014 Submission
46 further evidence on the robustness of costs for Counters Creek. Funding the enhancement flooding programme is in the interest of our customers Our flooding programme has been developed bottom-up based on customer valuations, to deliver what our customers are willing to pay for. We demonstrated in our June 2014 Submission that the programme was cost-beneficial for customers. To reduce costs to the level in the Draft Determination would require a material reduction in scope, which would lead to a material reduction in the net benefits to our customers. Costs outside the implicit allowance 3.56 While we agree with Ofwat s total assessment of the size of the implicit allowance ( 237m), we consider that the apportionment between the components does not reflect the unique nature of the Counters Creek scheme compared with the rest of our programme. We have provided evidence to support this: first, as we explain in Appendix B, Annex WWS08, Ofwat s unit cost sewer flooding model does not take into account the scope or costs of Counters Creek, the largest single flooding project since the privatisation of the water industry; second, the cost driver of the model (which estimates a simple linear relationship between historic sewer flooding spend and number of billed properties) cannot account for the type of basement flooding the Counters Creek scheme is intended to alleviate We have estimated that 168m of AMP6 cost for Counters Creek are not captured by the implicit allowance from Ofwat s sewer flooding models. The implicit allowance in the DD ( 237m) is 48m higher than the remainder of the Counters Creek scheme ( 89m), 62 which is comparable to historic investment and therefore is captured by Ofwat s modelling, and the rest of our flooding programme ( 101m). To protect customers, we are proposing that the cost exclusion claim for the flooding programme be limited to 121m, the 168m for Counters Creek that is outside the implicit allowance less the 48m efficiency. Robustness of Cost Ofwat s deep dive assessment of the Counters Creek component cited a number of specific concerns regarding its robustness of cost test: the scheme should be supported by a full risk register with revisions to costs as the project matures; and we should provide benchmarking of the cost against other London tunnelling projects. We summarise below how we have addressed these concerns: 62 As set out in Appendix B, Annex WWS08 Totex costs Counters Creek and Sewer Flooding Programme. 46
47 We are submitting the latest best estimate (LBE) 63 of the Counters Creek scheme cost, together with external comparisons and a full risk/opportunity register. 64 The LBE is 306m, after taking into account the investigations into the most appropriate route. We are also providing in DDSE34 the full risk register for the project. The LBE has been signed off by Mott MacDonald and our eight 2 O Alliance team 65. On the basis of this latest estimate we are confident that our submitted cost of 284m is an efficient cost, representing an efficiency of 7% below our LBE. We note that this efficiency is in the range of the upper quartile challenge applied to the average efficiency totex forecasts in Ofwat s Basic Cost Threshold (10.4%). As such we consider that this additional evidence demonstrates our business plan estimate represents an upper quartile level of efficiency. We have conducted a benchmarking exercise against the National Grid London Power Tunnels project. This exercise concludes that whilst there are many positive and negative cost variances, the review supports the current Counters Creek cost estimate. 66 Business rates Our June 2014 Submission contained a P50 position on rates that reflected: (i) the expected increase in rates from the 2017 revaluation of rateable values; and (ii) the asset growth for our wastewater business. The Draft Determination has reduced the amount allowed for business rates by removing the increase expected to arise in the 2017 revaluation and capping increases due to asset growth at 5%, based on an assessment of sewerage rateable values from The allowance in the Draft Determination is, therefore, materially below a P50 position. We do not agree with the approach adopted in the Draft Determination as: the expected increase due to the 2017 revaluation can be predicted with a high degree of confidence. This is because the methodology used for the review is known, and the review will be based on indexation to building costs between April 2008 (which is known) and April We therefore know most of this indexation as of today (69 months out of 84); the changes in business rates costs should reflect actual expected asset growth, without an arbitrary cap. Thames Water is affected disproportionately by this cap because: o the major investment at our TTT extensions programme sites during AMP5, which were agreed in FD09, did not attract business rates in the baseline that Ofwat used to set the 5% cap, but will attract business rates in AMP6; This term is used in technical appendices and documents relating to the costing process for Counters Creek. As set out in Representation WWS08 Totex costs Counters Creek and Sewer Flooding Programme Further details are provided in Appendix B, Annex WWS08 This is provided in DDSE36 Appendix B, Annex WWS09 Draft Determination technical appendix A3 Wholesale Water and wastewater, page
48 o o the scale of the AMP5 TTT extensions programme and the AMP6 wastewater programme mean that the historic rates of asset growth across the industry do not reflect the recent and forward looking asset growth for Thames Water; and the RORE ranges targeted by Ofwat (e.g. in its risk and reward guidance in January 2014) contain a broadly symmetric totex risk. This is not consistent with using forecasts materially below our P50 forecast (where we have provided evidence to show these are robust forecasts) as it skews the business rates risk to the downside Ofwat s interventions, therefore, do not allow a notionally efficient company of Thames Water s size to recover its business rates costs in AMP6, and therefore should be revised to reflect our June 2014 Submission. Open Water costs Our June 2014 Submission included Open Water and market operator related costs of c. 21m for the combined wholesale business. The wastewater share of this total was 11.1m. Our submission explained that this expenditure was necessary to develop, among other things, new processes and system capability to interface with a number of new stakeholders and to accurately bill retailers in the expanded market for non-household customers. In the DD, Ofwat has allowed the shared costs associated with Open Water but disallowed the internal costs that we identified in our submission. This means that Ofwat s allowance for the waste business is 3.2m, some 7.9m less than our business plan requirement of 11.1m. While we welcome Ofwat s acknowledgement that future developments in the competitive market are likely to impose significant costs on wholesalers, we would strongly encourage Ofwat to look again at this cost allowance in the Final Determination. Appendix B, Annex WWS10 elaborates on our concerns in this area, providing further evidence for the new costs that our wholesale businesses will incur during AMP6 to comply with these new market arrangements. Reconciling performance Serviceability shortfall in In the DD, Ofwat has assessed our serviceability as marginal rather than our assessment of stable performance. We believe the DD position is not consistent with the Final Determination of our IDoK application published by Ofwat (November, 2013) where Ofwat reported that: We understand and recognise Thames Water s position on serviceability. Although an upper control limit was breached, failure at the overall sub-service level did not occur, and consequently we accept the argument put forward that a shortfall would be inconsistent with the approach we had signalled for the next price review. 69 Appendix B, Annex WWS10. 48
49 This related to 2 million of our overall proposal in this area in the Draft Determination [of the IDoK application] Given its stated position in the IDoK, on which we placed reliance, Ofwat should not change its position and should return to its previously reported position in the IDoK Final Determination, i.e. no shortfall for Serviceability performance in to Ofwat has assessed our wastewater infrastructure serviceability in 2012/13 to 2013/14 as deteriorating in contrast to our assessment of marginal. In RD15/06, Ofwat set out the approach for assessing serviceability which takes account of the trend in each indicator. The guidance also sets out the approach in making the serviceability assessment: Where serviceability is less than stable, there is usually a progression from marginal to deteriorating In , we recognise that our performance had worsened in two key indicators (pollutions and SFOC) compared with We believe that a movement from a stable position in (as per our assessment and the IDoK Final Determination) to deteriorating (Ofwat Draft Determination, August 2014) within one year is not in line with the guidance set out in RD15/06. In , we recognise that our performance in pollutions and SFOC were above the upper control limit, but as reported in TJ051 AMP5 Serviceability Report in our June 2014 Submission, our serviceability recovery plan demonstrated that our plans were effective in arresting the upward trend in these measures, with SFOC performance dropping back to close to the upper control limit and pollution performance stabilising in In addition, we believe that there are some clear mitigating factors for our performance as set out in Appendix B, Annex WWS11. Serviceability performance in For the two key measures which have impacted our serviceability performance, we have updated our forecast information for For (April to the end of August), SFOC has affected 350 properties. If we maintain this average performance of 70 properties per month, our year end performance would be 840 properties, below our upper control limit for this serviceability indicator of 875 properties. For 2014 year to date (January to the end of August), the number of network pollution incidents recorded on the Environment Agency s (EA) NIRS database is 177, 72 though the EA has attributed 16 of these incidents to flooding during the exceptional wet winter between Ofwat, Final determination of Thames Water s IDoK application, November 2013, Section 12.3 page 103. Ofwat, RD15/06: Assessing serviceability, October Wholesale Waste Water Performance Report, August
50 January and March (rather than asset failure or operational issues), 73 with further challenges already agreed with EA or to be considered before our October challenge meeting The actual number of serviceability related pollution incidents to the end of August could therefore be reduced to 129. Our forecast to the end of the year in December is for 215 serviceability network incidents, 75 compared with our reference level of 124 incidents and upper control limit of 147 incidents. In our June 2014 Submission, we reported that our forecast serviceability assessment in was stable, while in the Draft Determination, Ofwat assessed serviceability as deteriorating. We have changed our forecast assessment for to marginal on the basis that we have not yet demonstrated a period of control (more than one year, as per guidance in PR09/38) for the pollution measure. Application of serviceability shortfall from to In to we agree that the application of a shortfall is appropriate as our subservice assessment is less than stable in line with the guidance in PR09/38. In Annex 1 of RD15/06 Ofwat states that: Assessments take into account shorter term influences on performance, including benign or hard years, temporary operational factors and exceptional events Our analysis set out in Appendix B, Annex WWS11 shows that there is one exceptional event which should be taken into account before the pollution shortfall is applied and two exceptional events which should be taken into account before the SFOC shortfall is applied. For pollution incidents, changes made to our management from 2012 have meant a comparative increase in the reported incidents and should therefore be treated as an exceptional item in relation to serviceability performance, for which the reference level and control limits have been set on historical practice in relation to self-reporting. The results of this analysis are shown below: Table 3: Pollution incidents performance No. of incidents Reported performance / forecast Reduction if process improvements not undertaken * Adjusted performance Sources: Thames Water final Business Plan, Draft Determination modelling, Wholesale Waste Water Performance Report, August *Note: to end of August only Wholesale Waste Water Performance Report, August EA agreed to remove six of the 177 incidents from NIRS following our monthly challenge meeting on 5 September We are challenging a further 26 incidents. Wholesale Waste Water Performance Report, August Ofwat, RD15/06: Assessing serviceability, October
51 3.81 On the basis of the adjusted pollution performance in Table 3, our shortfall should be recalculated at 18.2m. This is shown in Table 4. Table 4: Revised pollution shortfall (post efficiency) m prices (latest forecast) AMP5 total Shortfall Draft Determination Revised shortfall Source: Ofwat legacy adjustment model We have evidence that the performance of SFOC was impacted by factors which are not included within the control limits currently set for this indicator. Therefore the scale of the SFOC shortfall should be revised to take account of these factors: the adoption of private sewers in October 2011, leading to heightened awareness of the reporting of sewer flooding incidents on the legacy network; and extreme rainfall in and increased the number of SFOC incidents experienced We have used a time series model to estimate the impact of these two factors and have adjusted our performance based on the results of this analysis. The impact of these two external factors has been used to adjust performance as shown below: Table 5: SFOC performance No. of Incidents Reported performance / forecast Private sewers impact (from October 2011) Extreme rainfall impact (months of extreme rainfall) 1 (Aug) 1 (Jun) 28 (Apr, Jun, Oct, Dec) 50 (Dec, Jan, Feb) 4 (Aug) Adjusted Performance , Sources: Thames Water final Business Plan, Draft Determination modelling, 77 Wholesale Wastewater Performance Report, August Note: Adjusted performance may not be the total of elements due to rounding. 77 DDSE69 Thames Water internal document AMP5 shortfall analysis.xls. 51
52 3.84 On the basis of the SFOC adjusted performance in Table 5, our shortfall should be recalculated at 4.7m. This is as per Table 6 based on the adjusted view of performance and the stable serviceability assessment for Table 6: Revised SFOC shortfall (post efficiency) m, Prices (latest forecast) AMP 5 total Shortfall Draft Determination Thames Water serviceability assessment Stable Marginal Marginal Marginal Revised shortfall Source: Ofwat legacy adjustment model. Logging In our June 2014 Submission we included a number of items relating to logging up and down. Ofwat has not taken into account an additional disclosure 79, included with the plan, relating to our Lee Tunnel logging down case. On the basis that the log down case was accepted by Ofwat, the known departure should be taken into account as it provides the latest forecast information related to the log down case. This would increase our logging down case for this scheme from 35.7m to 49.3m. In order to implement the intervention correctly, there should be a corresponding 13.6m increase in our AMP6 allowance to reflect the re-profiling of expenditure from AMP5 to AMP6. Revenue Correction Mechanism Ofwat has reduced our revenue correction mechanism (RCM) adjustments from m to m, as a result of excluding 7.9m related to the back-billed amounts in our June 2014 Submission and other changes, particularly to the inflation adjustment. The back-billing component of the RCM adjustment is important in incentivising companies to identify properties that they have charged less than they should have and to recover the amount owed. In our June 2014 Submission we included 7.9m, based on using cash collection rates as a proxy for amounts received. Section 2D for Wholesale Water sets out an alternative methodology which refines the approach taken in our June 2014 Submission. The revised approach looks at each customer individually, where back-billing has taken place, and only includes those customers in the claimable value where they are fully up to date with their payments. This demonstrates that Appendix A, Annex WWS16. Business Plan :June 2014, TJ070 Additional disclosures. Appendix B, Annex WWS17. 52
53 back-billed amounts have actually been received from the customers in line with the Ofwat requirement The resulting back-billing component ( 6.8m) is similar to and slightly below the amount in our June 2014 Submission ( 7.9m). The results of the alternative methodology therefore support the scale of the component. KPMG have performed agreed upon procedures to agree the results using the alternative methodology to supporting calculations. We consider that the data provided from this alternative methodology, which is broadly corroborated by the results in our June 2014 Submission to demonstrate robustness, provides the evidence for the back-billing component to be reinstated in our RCM adjustment. Retail Household billing system 3.92 For Retail Household (see Section 5), we have proposed an additional shortfall of 5.4m for costs allowed in AMP5 to deliver a new billing system that were written off. As set out in this section, we have assumed that this shortfall will be applied to the Wholesale Water and Wastewater controls. Assuming an equal split in this shortfall between Wholesale Water and Wastewater, the amount attributable to Wholesale Wastewater would be 2.7m. Service Standards outputs 3.93 Prior to the Draft Determination, 81 Ofwat notified us that there are four areas where additional information is required to confirm that our AMP5 programme will deliver the service standard outputs which were explicit in the PR09 Final Determination. The three areas related to Wastewater are: opex reduction through energy programmes; odour; and flood resilience Additional evidence supporting our delivery of these outputs are provided in WWS12 for energy, WWS13 for odour and WWS14 for flood resilience, and are summarised below. Service standard outputs - energy In our June 2014 Submission we did not propose any shortfall relating to AMP5 carbon outputs. In the communication above, Ofwat proposes a shortfall of up to a maximum of 17m. We understand this relates to the achievement of the carbon outputs set out in the FD09 Supplementary Report, which total 17m (in prices). In parts of our June 2014 Submission we had indicated that we were not forecasting to achieve the required service standard outputs relating to our carbon solutions. This was an error. Our June 2014 Submission forecast should have shown us outperforming our required activity output (400% of output) and substantially achieving our required service standard from A Chesworth (Ofwat) to C Gibson (Thames Water), Non-household information note & service standards outputs, 13 August 2014 Further details in Appendix B, Annex WWS12 53
54 output (99.2% of output), even before any further opex benefits arising from additional unfunded energy and carbon investments we have made are included This evidence shows that we have delivered the service standard output in AMP5. Service standard outputs - odour Ofwat is challenging our assessment of outputs for odour enhancement investment and is considering applying shortfalls equal to the cost of the projects allowed at FD09 ( 72.27m) if there are projects with insufficient evidence of achieving the service standard of reduced nuisance from odour. We have provided the evidence in Appendix B, Annex WWS13 showing how we test that we are delivering a reduction in odour, including endorsements for this approach by an independent industry expert. 84 So far, we have completed seven out of the nine schemes awarded at PR09. All sites have complied with the QA regime, with one exception (Farnham) where we are awaiting other operational activities to be implemented before we can complete the testing. Beckton and Long Reach odour enhancement schemes, which account for 80% of expenditure, are due to complete by March Beckton is 97% complete with primary tanks physically covered and emissions being treated by a new odour control unit. The takeover emissions tests are currently underway. Long Reach is 71% complete and emissions tests are scheduled for early 2015 aligned to the completion of sludge enhancement projects. We are confident that the Long Reach and Beckton schemes are sufficiently advanced that we will be able to demonstrate benefits by the end of AMP5 and therefore there is no need for a shortfall. Service standard outputs - flood resilience Ofwat has requested further evidence that projects and activities focused on improving the resilience of wastewater sites to extreme rainfall events have delivered the service standard of protecting the local watercourse. We have provided the evidence in Appendix B, Annex WWS14 and therefore a shortfall is not required. Our service standard is protecting the local watercourse from pollution following extreme weather events. Flood resilience measures have been put in place at Beckton Sewage Treatment Works (STW) and are due to complete at Riverside STW by March The evidence that environmental protection is in place is summarised below: during the recent wet weather event ( ), the alignment of predicted risk and actual events for Thames Valley wastewater sites shows that our framework is valid for assessing asset vulnerability; Appendix B, Annex WWS13 DDSE03 J. Hobson Resume, DDSE02 J. Hobson (2014) How to demonstrate the benefit of odour abatement measures. Technical Commentary, September Appendix B, Annex WWS14 54
55 for measures in place at Beckton STW, we have the latest flood risk maps, detailed level surveys and dialogue with operational staff that resulted in a suite of measures being accepted as valid to protect the site; and the overall framework we used to identify our investment at PR09 was in accordance with the current Ofwat, Halcrow and Environment Agency methodologies. 55
56 Section 4 Thames Tideway Tunnel A Introduction In this section we provide an overview of our representations in respect of the TTT ( TTT ) price control. More detailed responses and supporting evidence are provided in Appendix C. It is clear that there are proportionately greater differences between the Draft Determination for the TTT and our June 2014 Submission than for any of the other price controls. Whilst we welcome the clarity that parts of Ofwat s Draft Determination provided, we have a number of overriding concerns regarding Ofwat s proposals. These include aspects of the proposed licence condition (in particular, Ofwat s requirement for the control to be enduring), the performance commitments and penalty rates proposed by Ofwat, and the degree of adjustments Ofwat has made in some of its cost assessments. In our response we provide updated cost estimates and additional supporting evidence and present our representations with respect to Ofwat s suggested opening RCV adjustment. We also provide our representations in respect to Ofwat s proposed uncertainty mechanisms. When viewed in the round, the proposals we set out below: will result in a smoother bill profile for customers; will reduce unnecessary complexity and provide greater certainty for the TTT project and customers; represent a joined up approach between risk and uncertainty mechanisms; contain incentives targeted at outcomes and the removal of duplication, which would otherwise undermine the clarity and strength of the incentives; will mean that customers fund legitimate, economic and efficient activities; and will mean that customers will not pay twice for the same activities We have considered our proposals with the RORE framework. The analysis (Appendix C, TTT03) indicates a RORE range of +2.3% to -2.3% or +3.1% to -3.1% including financing risk of +/-0.8%. This provides a reasonable balance of risk and reward for Thames Water and strong and clear incentives. The structure of our response follows the structure of Ofwat s Draft Determination for the TTT as closely as possible, hence the remainder of this section is structured as follows: Sub-section B summarises our response to Ofwat s proposals for the separate TTT price control; Sub-section C sets out our response to Ofwat s proposals for performance commitments and associated incentives; 56
57 Sub-section D provides an overview of our response to Ofwat s calculation of the TTT price control, including a summary of our response to each cost category; and Sub-section E summarises our representation in respect of Ofwat s proposed uncertainty mechanisms To ensure that the data included within this Draft Determination representation is of good quality, and provides appropriate assurance to Ofwat, we have carried out a number of both internal and external assurance activities. Details of these are set out in detail in Appendix C, TTT13. There is a continuing dialogue between Thames Water and Ofwat on the TTT price control for AMP6, which Ofwat has acknowledged will continue beyond 3 October B 4.8 Separate price control In response to a request from Ofwat, our June 2014 Submission included a proposal for the additional wholesale and incremental tax costs we will incur with respect to the TTT project to be funded via a separate TTT wholesale price control. Our position is that this new price control would only apply for AMP6 and would automatically fold back into the Wholesale Wastewater price control at PR19. In the Draft Determination, Ofwat agreed that it would be appropriate to use a separate TTT price control for AMP6, and recognised there are a number of benefits to this, including: increased transparency; and separation of activities with different risk profiles and the provisions of bespoke (and focused) uncertainty mechanisms There were, however, two important differences between our proposal and the Draft Determination that we feel are not in customers best interests. First, whilst Ofwat supported the use of a separate TTT price control for AMP6, it did not agree that there should be an automatic expiry date of the price control, folding the TTT back our into Wastewater control in Ofwat has invited us to make further representations regarding the benefit to customers of folding the TTT back into Wastewater control. 87 Second, the Draft Determination precluded Thames Water collecting IP revenues in advance of IP licence award, which we proposed in order to meet customers stated preference for a smoothed bill profile We have, therefore, provided responses to both of these aspects of the Draft Determination below Page 34, Ofwat s Draft Determination. Page 34, Ofwat s Draft Determination. 57
58 Automatic expiry date 4.11 The following points summarise the arguments we have set out in Appendix C, TTT03, which demonstrate that the automatic expiry date for the TTT price control is in our customers interests: The Draft Determination states that the separate price control has been established to isolate activities with different risk profiles (which occur during the development phase), and enable the provision of bespoke uncertainty mechanisms.. As the development phase, and therefore the motives for introducing a separate price control, will conclude with the IP licence award early in AMP6, there appears to be no rationale for the control enduring. To persevere with an unnecessary, artificial construct beyond the development phase of the project adds complexity, and additional administrative burden, which are not in customers interests. Furthermore, separation of TTT implies that from 2020 the TTTrelated assets will be discrete from the rest of Thames Water s wastewater network. In order for it to tested, accepted and operate effectively, it must be viewed as an integrated part of the existing network. Finally, separating a single asset from our wastewater portfolio creates regulatory uncertainty for investors as it introduces a single asset risk exposure. Ultimately this means that the company is less able to diversify risk due to the separate controls and, as such, will lead to a higher cost of capital for the company, which will be borne by customers. Early collection of IP revenues As we demonstrated in our Business Plan, our customers have a clear preference for smooth bill profiles. 88 Ofwat s proposal to allow Thames Water to collect IP revenues only following its licence award will postpone the collection of revenue, leading to more than one year s revenue being collected at a time, thereby resulting in less smooth bill profiles for customers. Table 3 in Appendix C, TTT03 demonstrates that building a separate block for IP revenues in the TTT price control would permit us to collect revenues over a longer period of time, allowing us to present a smooth, IP related, bill increase of 2, 6 and 12. In contrast, without this early collection, and in order to keep the programme broadly in line with expectations when faced with a 6 month delay to IP licence award, we would be likely to present an IP price profile of 0 in , 0 in and 18 in We are aware that a material increase in one year as a result of the TTT would be a significant change to customers current expectations of bill profiles. Under circumstances whereby the IP is not awarded a licence, or its licence or the designation of the IP is revoked, Ofwat would direct us as to the treatment of any IP revenue collected. We would expect those sums (including interest) to be passed back to customers. As we set out below, we have proposed a new performance commitment which will ensure they are recompensed should the IP not be awarded its licence Page 68, Thames Water s Business Plan Part A, December See Appendix C, Annex TTT03 for more information. 58
59 C 4.14 Outcomes, performance commitments and delivery incentives In its Draft Determination Ofwat defined a series of performance commitments and related delivery incentives for the TTT price control, stating that: customers would not be adequately protected without performance commitments and incentives in this area We agree that an appropriate set of commitments and incentives would provide protection to customers in the context of the TTT project. Our Business Plan commitments were used as a starting point by Ofwat in its Draft Determination. As we set out below, however, Ofwat has made significant adjustments to our initial proposals. Specifically, in its Draft Determination Ofwat proposed three performance commitments for the TTT: Performance commitment T1: Limit the extent of delays on the overall programme timeline; Performance commitment T2: Engage effectively with the IP, and other stakeholders, both in terms of integration and assurance; and Performance commitment T3: Engage with our customers to build understanding of the Thames Tideway Tunnel project This section sets out our proposals in light of Ofwat s Draft Determination. It also summarises our proposals to include additional performance commitments if Section costs are transferred to the IP, and if the IP is not awarded its licence. A more detailed response can be found in Appendix C, TTT03. Performance commitment T1: We will support the timely and efficient delivery of the TTT Performance commitments can protect the interests of our customers in regard to the TTT by providing appropriate incentives to secure timely and efficient delivery of the TTT project. We support the inclusion in the Draft Determination of a performance commitment that seeks to protect customers in this respect. An effective commitment should be targeted at achieving outcomes and should strike an appropriate balance between the incentive applied and the additional risk that the incentive places on customers and the company. If an appropriate balance is not struck, this could result in higher overall costs for customers. Ofwat identified three strands to Performance commitment T1: T1A Successful procurement of the infrastructure provider (incentive type: reputational); Page 35, Ofwat s Draft Determination. Section 106 of the Town and Country Planning Act
60 T1B Acquisition of land rights for the project (incentive type: reputational); and T1C Completion of category 2 and 3 construction works and timely availability of sites to the IP (incentive type: financial penalty only) We set out our response to each of these in turn below. T1A Successful procurement of the infrastructure provider We agree that the procurement of the IP and the awarding of its licence should be components of performance commitment T1A, and that a reputational incentive is appropriate, as the success of the IP procurement will require the continuous agreement of multiple organisations. 92 Ofwat accepts that there is uncertainty around the exact timing of the IP and licence award dates, and we commit to keeping Ofwat fully apprised of developments in this area prior to the Final Determination. We have also proposed uncertainty mechanisms to account for any consequential impact on costs. 93 T1B Acquisition of land rights for the project The timely acquisition of land is an important aspect of the TTT project. We agree that a reputational incentive is appropriate for this strand of the performance commitment. We will publish changes in the timetable insofar as it is affected by IP procurement and the DCO. T1C Timely and efficient delivery of the TTT This strand of the performance commitment seeks to ensure that customers are protected against delays in construction activities and against additional costs. Ofwat has proposed financial penalties for this ODI if there are delays against the Main Works contracts. In response to Ofwat s proposals, we have revised our Alliance Agreement, 94 which now includes symmetrical rewards and penalties for members of the Alliance. It makes the provision for the IP to receive payments from Alliance partners in the event of delays or overspend, and incentivises all members to take account of overall project costs and timetables, rather than individual elements. This means that the overall impact on customers is a key element of the Agreement. Ofwat s proposal is limited to Category 2 and 3 works only. The revised Agreement provides clear incentives for Alliance members to deliver the TTT project efficiently and on time, while ensuring that customers are protected in the case of delays to construction. An additional, separate financial penalty specific to this performance commitment, therefore, would be not only superfluous but could also distort the effective incentives we are putting in place. Indeed, we would not be able to enter into the Alliance Agreement if Ofwat s proposed additional financial penalty was in place Thames Water, Ofwat, Defra, TTT Limited and IUK. See Section E and Appendix C, Annex TTT03. More information is provided in Appendix C, Annex TTT03. 60
61 Performance commitment T2: We will engage effectively with the IP and other stakeholders 4.29 We agree that a performance commitment for engagement with the IP and other stakeholders is appropriate, and that a reputation incentive is most suitable. More details on our proposals regarding the governance and reporting of this incentive can be found in Appendix C, TTT03. Performance commitment T3: We will engage with our customers to build understanding of the TTT project. We will liaise with the IP on its surveys of local communities impacted by construction We agree that a performance commitment for engagement with our customers is appropriate, and that a reputation incentive is most suitable. We assume that the incremental costs of our planned activities will be accounted for in prices. We do not agree, however, with Ofwat s proposal that we undertake related site surveys, as this would lead to a duplication of activities and costs. We believe this must be a core responsibility for the IP and its contractors. We will liaise with the IP, accordingly to ensure effective and timely engagement with communities where construction activity is taking place. More details on our proposals regarding the governance and reporting of this incentive can be found in Appendix C, TTT03. Performance commitment T4: We will pass back to customers S106 development costs if they are carried out by the IP We propose a new performance commitment to return S106 costs to customers if responsibility for delivery transfers to the IP, to ensure customers do not pay twice. More details on our proposals regarding the governance and reporting of this incentive can be found in Appendix C, TTT03. Performance commitment T5: We will collect revenue in advance of the IP licence award for the IP to smooth customer bills impacts As set out above, we have proposed that we collect IP related revenues from our customers in advance of the IP licence award. This revenue would be passed on to the IP in line with the pay when paid principle. This would benefit customers by smoothing the customer bill profile. In the event that the IP is never awarded a licence, or its licence or the designation of the IP is revoked, then Ofwat would direct us as to the treatment of any IP revenue collected. We would expect those sums (including interest) to be passed back to customers. More details on our proposals regarding the governance and reporting of this incentive can be found in Appendix C, TTT03. 61
62 D Calculating the TTT Price Control Menu In its Draft Determination, Ofwat specified a cost menu for non-land costs and proposed to maintain the no pain/no gain arrangements for land. These arrangements can support customers only if they adequately reflect the complexity and risks that need to be managed on the TTT project. Setting of an appropriate baseline is important to achieve this. We do not believe that the baseline in the Draft Determination is achievable in practice. In Appendix C, therefore, we provide substantial further evidence to allow Ofwat to arrive at an appropriate baseline. As we set out in detail in Appendix C, TTT03, we believe the definition of land under the no pain/no gain principle as defined in our June 2014 Submission represents a more appropriate allocation. 95 Costs On 6 August 2014 Ofwat wrote to Thames Water to inform us that very material differences remained between the TTT costs we put forward in our June 2014 Submission and Ofwat s assessment of efficient costs as part of its price review. We have used this information, along with that included in Ofwat s Draft Determination for example, on uncertainty mechanisms and new information since June, to provide an updated view of our expected costs during AMP6. We remain concerned that, notwithstanding new information and consequent adjustments we have been able to make, there remain material differences between our view of efficient costs and the view of Ofwat. We welcome this opportunity to provide additional information, and we trust Ofwat will take account of it in reaching its Final Determination. The remainder of this section takes each component of Ofwat s TTT cost assessment in turn. Each cost item is treated in detail in its own section in Appendix C (TTT04 TTT12), so we provide only a summary in this chapter. We do not discuss Ofwat s tests individually for each cost category as part of this summary. Table 7 below summarises our response to each of the AMP6 cost items that make up Ofwat s Draft Determination. 95 Ofwat does not include Other property costs in its allocation. These costs include the ongoing management of sites, which is essential to maximise the future sale value and is therefore in the best interests of our customers. 62
63 Table 7: Our response to Ofwat s Draft Determination cost assessment Prices m June 14 Business Plan Draft Determination October 2014 Response Development Construction Land Indirect Costs Risk Corporate Overheads Resilience TOTAL Source: June 2014 Submission, Ofwat s Draft Determination and Thames Water estimates Ofwat s Draft Determination identifies costs that are significantly lower than those we proposed in our June 2014 Submission. As we set our below, however, we are confident that the costs we set out in conjunction with our proposals for uncertainty mechanisms represent an appropriate balance of risk and costs for us and our customers. Resilience costs For the purposes of this PR14 submission "resilience" means the activities (which may extend beyond pure scope transfers from IP to Thames Water) and associated costs that may be desirable to mitigate the adverse consequences on the TTT project construction programme of a delay in the IP licence award beyond 1 July We note that Ofwat has construed resilience costs similarly as being "expenditure to maintain the overall project timetable if an infrastructure provider isn't appointed" in circumstances where the appointment of the IP is delayed. One of the targets for all privately financed infrastructure projects is to achieve a single closing, at which contracts are signed and finance becomes available. Occasionally, this is not possible, with the result that a so-called "split closing" becomes inevitable. Split closings are typically characterised by additional costs and risks. The current target timetable for the TTT project (and the one on which this response document is predicated) shows IP licence award taking place on the last date that a split closing can be avoided (1 July 2015). If IP licence award were to take place as a single closing after this date, then it would involve slippage of the underlying construction programme - that is, a slippage in the date of scheduled completion of the TTT project. However, the risk of slippage to the underlying construction programme can be mitigated if a split closing strategy is adopted. The logistics and practicalities of a split closing are referred to as the Resilience Plan. Although the TTT project stakeholders (Thames Water, Ofwat, Defra, IUK and TTT Limited) have collectively undertaken some initial scoping analysis of resilience activities, there is currently no agreed Resilience Plan and therefore there is also no agreed resilience budget. Accordingly, resilience has been removed from the AMP6 baseline figures in this response 63
64 document. The current plan is for stakeholders to re-engage on the Resilience Plan in October with a view to agreeing it during November In our June 2014 Submission we put forward a claim for Resilience costs of 109.9m ( prices). In its Draft Determination, however, Ofwat considered that the existing uncertainty mechanisms that already apply to the wholesale controls should afford adequate protection to the TTT project: We consider that mechanisms relating to RPI indexation, five-yearly price reviews, totex sharing rates, the flexibility provided by ODIs and the interim determination of K (IDoK) and substantial effects provisions all have merits in respect of the TTT Control In particular, Ofwat proposed to adopt a bespoke IDoK mechanism for the TTT price control and a mechanism for logging up costs if prices are not reopened: We propose to adopt a bespoke IDoK mechanism for the TTT Control for specified circumstances that are beyond management control. In addition, we propose a mechanism that would allow certain, specified costs to be logged up at the next price review if Thames Water does not reopen price controls before the next price review In considering these proposals we accept that the exact nature of any resilience response will depend on the cause, nature and extent of any delay. If an alternative mechanism is in place it may not be efficient, therefore, to commit now to specific resilience activities that we would undertake across all resilience scenarios. Taking this into account we agree with Ofwat that so long as sufficient provisions are made in the form of an appropriate Notified Item 98 Resilience costs should be funded through logging up and possibly also an IDoK mechanism. 99 As it is proposed, however, Ofwat s NI does not cover essential ongoing Development costs. As set out above, we will continue to refine our Resilience Plan in conjunction with our key stakeholders as we progress the TTT project Our response to Ofwat s Draft Determination, taking account of our proposed NI, 100 summarised in Table 8 below. Table 8: Our response to Resilience costs is Prices m June 14 Business Plan Draft Determination October 2014 Response Resilience * Source: June 2014 Submission, Ofwat s Draft Determination and Thames Water estimates. *Assuming that Ofwat accepts our proposals for an NI for development Page 45, Ofwat s Draft Determination. Page 45, Ofwat s Draft Determination. See Appendix C, TTT05 for more detail on our proposals. In our June 2014 Submission page 18 we stated that Thames may consent to commencing and progressing such works if it is clear that the potential liability for such works does not exceed that which it would ordinarily undertake as part of its core business and it is adequately protected and funded for taking on such works and the risks (direct or indirect) it would be assuming by carrying them out.. Set out in detail in Appendix C, Annex TTT03. 64
65 4.52 Finally, we note that Ofwat would be minded to include a financial incentive for resilience performance if resilience costs are included in its Final Determination. 101 However, including resilience activities in our NI for Development will provide sufficient protection for customers, and therefore an additional delivery incentive is not necessary. Development costs Development activities are those activities that Thames Water undertakes to progress the TTT project, including maintaining a team to lead the development phase of the project, ensuring Thames Water is ready for the delivery phase, and preparing for the procurement of the IP. These activities are crucial to the progression of the TTT project, and, in some cases, are legally binding (for example, some costs relating to planning obligations). The term development costs is used to refer to the costs of these activities. The 18.0m of Development costs Ofwat agreed to fund in the Draft Determination related solely to obligations we have to local authorities under Section 106 of the Town and Country Planning Act However, in our June 2014 Submission we did not include any cost estimate to cover development activities in the period before appointing an IP and including a handover period for the Thames Water client and IP procurement teams. The costs for this period were expected to be covered by the resilience funding included in the June 2014 Submission. As we have removed resilience costs we need to include development costs to support the continued development of the project including procurement of the IP. Specifically, we have identified 22.9m of costs that should be incorporated into the development cost item. A more detailed explanation and breakdown of these costs is provided in Appendix C, TTT06. In the event of the IP licence award being delayed beyond 1 July 2015, we propose that all the additional reasonable and efficient development costs incurred are funded via an NI for Development. Our proposal is set out in detail in Appendix C, TTT03. In its Draft Determination, Ofwat requested further representations to ensure that customers are fully protected should Thames Water incur lower development costs related to S106 agreements than have been allowed in Ofwat s Final Determination. We have proposed a Performance Commitment which provides for logging down to ensure that customers will not pay twice for any S106 costs that are transferred from Thames Water to the IP. Further information on this mechanism can be found in Appendix C, Annex TTT03. Table 9 below summarises our response to the Draft Determination with respect to Development costs. 101 Page 191, Ofwat s Draft Determination. 65
66 Table 9: Our response to Development costs Prices m June 14 Business Plan Draft Determination October 2014 Response Development Source: June 2014 Submission, Ofwat s Draft Determination and Thames Water estimates. Note: A more detailed breakdown is provided in Appendix C, Annex TTT06. The Section 106 cost in our response differ slightly from that put forward by Ofwat in its Draft Determination, reflecting our approach to adjustments for inflation, described below. Risk For the purposes of this response we define a risk as a description of a specific event which may or may not occur, together with its causes and consequences. 102 In the context of the TTT project, there are risks in many areas, including delays in procurement, risks associated with the DCO, 103 and events causing delays or additional costs in project delivery. As the project is currently in the development phase, it faces a large number of risks, creating a high level of cost and timing uncertainty. As we set out in detail in Appendix C, TTT07, the TTT project employs a leading approach to risk management, with risks continually evaluated to reflect the latest information. Our June 2014 Submission included risk costs of 135.9m ( prices). 104 Ofwat partially accepted the risk costs we put forward ( 30.3m, prices). The Draft Determination included construction risks but made no allowance for development risks. As mentioned above, this is inconsistent with its approach to uncertainty mechanisms, leaving the company with neither funding for risk in prices nor an opportunity to secure such funding through uncertainty mechanisms. In responding to Ofwat s Draft Determination, we have been able to reflect the latest information on risks associated with the TTT project. 105 In addition, we have reconsidered (and in some cases reduced) our risk cost estimates in the light of Ofwat s challenges. As we set out in Appendix C, TT03, we have also proposed an NI for development to account for Development risk costs should they arise. Our updated view of appropriate Risk costs is summarised in Table 10 below Infrastructure Risk Group, Managing Cost Risk & Uncertainty In Infrastructure Projects, 2013, page 48. We have excluded the risk costs associated with the DCO award, but retained those that have not been mitigated by the decision. 59.8m of delivery risks and 76.1m of development risks. Reflecting updates to the TTT project risk assessment (from the Rev06c2 to the Rev07a cost estimate). 66
67 Table 10: Our response to Risk costs Prices m June 14 Business Plan Draft Determination October 2014 Response Risk * Source: Thames Water June 2014 Submission and Ofwat s Draft Determination. *Assuming that Ofwat accepts our proposal that Development risk costs fall within the definition of an NI for Development Under Ofwat s proposed uncertainty mechanism, whilst the gap on Delivery risk has narrowed following our latest update to risks, there would be a very significant ( 48.6m6) gap for Development risk, as Ofwat has neither funded Development risks nor allowed for them to be covered by an uncertainty mechanism. If these costs are not allowed either ex ante (through cost assessment) or ex post (through an appropriate uncertainty mechanism) this will increase the likelihood of risk being unmitigated and potentially introduce new risks. The proposals that we have set out ensure that risk funding and uncertainty mechanisms are consistent. As we set out in more detail in Appendix C, TTT03, we have striven to adopt a balanced and reasonable approach which, through the definition of an NI to cover Development costs, mitigates the need for upfront increases in customer bills, whilst ensuring that we are funded for additional reasonable and efficient costs should they arise. Inflation Ofwat s Draft Determination identified certain inflation inconsistencies between our June 2014 Submission and its own assessment. The costs included in our Business Plan were consistent with Rev06C. Our estimates in the June 2014 Submission were updated for various items, some of which were in a more up to date price base but were judged to be a fairer reflection of costs. We have since updated our costs (Rev07) and ensured these are in a consistent price base with Ofwat s Draft Determination. In line with the Table A9 submitted in June 2014, we use the annual average indices included in this table to inflate and deflate as appropriate. The majority of TTT project costs are now in a 2014 price base. We have, therefore, adjusted costs to prices. Land costs Land costs are necessary to ensure that the land needed is acquired in time to support the TTT project. Land costs for the TTT project fall broadly into five categories: Land acquisition costs acquisition of all land interests required to support TTT; Land management costs costs associated with the management of land; Land sales and rental income sale revenue, sale costs and rental income; Compensation costs statutory and non-statutory compensation payable as a result of the TTT project; and 67
68 Other property costs other costs, such as for land referencing, site selection and consultancy staff costs In our June 2014 Submission we proposed AMP6 net land costs of 91.3m ( prices). In its Draft Determination, Ofwat provided significant challenge to our proposals, provisionally funding 51.0m ( prices). Ofwat s challenge focussed on three main areas: Mitigation & Compensation forecast costs inconsistent with the policies relating specifically to property acquisition; Camelford House specifically our assumption that rental income will deteriorate during the AMP; and Other property costs the level of justification we provided for both the need and level of these costs We have responded to Ofwat s challenges on aspects of the land cost estimates by reviewing the basis of the June Business Plan estimates and seeking further evidence to inform the best possible cost estimates. In regard to Camelford House, in light of new information we have used to calculate the assessment of rental deterioration over the five-year period, 106 we have assumed a lower rate of decline in rental income (from 50% to 20% over five years) based on third party evidence. This adjustment increases gross rental income estimates by 2.7m ( prices). We have also considered estimated rental income from properties which we anticipate acquiring as part of the Exceptional Hardship provisions of the Non-Statutory Off-site Mitigation and Compensation Policy. Rental income from these properties was not included within our June 2014 Submission. This adjustment increases rental income estimates by 9.3m ( prices). Property management costs ensure that we are maximising rental and long term value of our property portfolio. For this reason, we consider that they should be assessed alongside rental income. Accordingly, we have netted off property management costs (for Camelford House and other the Exceptional Hardship acquired properties) from the respective rental incomes, resulting in a transfer of these costs ( 9.8m, prices) from Other Property Costs to the Land Resale Value and Revenue. We have made no changes to the estimates for Statutory and Non-Statutory Compensation costs. In light of Ofwat s challenge, however, we have provided further evidence as to why the forecasts are consistent with our policies. 107 Our response to the Draft Determination is summarised in Table 11 below Including a relevant precedent from the Crossrail project. Set out in detail in Appendix C, TTT10. As we set out in Appendix C, TTT09, we have undertaken extensive governance and assurance activities to validate our costs, including compensation. 68
69 Table 11: Our response to Land costs Prices m June 14 Business Plan Draft Determination October 2014 Response Land Source: Thames Water June 2014 Submission, Ofwat s Draft Determination and Thames Water estimates Overall, our revised costs estimates for Land in AMP6 are now 72.0m ( prices), a reduction of 19.3m from our June 2014 Submission. Construction costs 4.75 The term construction encompasses the building works which Thames Water will deliver as part of the TTT project. Construction costs refers to the costs of these activities. The division of labour with the IP is such that Thames Water will be undertaking Category 2 (enabling works) and Category 3 (interface works) works, with the IP responsible for all Category 1 works. 108 Construction costs for each of the individual construction works to be undertaken by Thames Water are composed of three elements: Direct costs of construction works; Construction costs (such as site preparation and survey work); and Design costs The June 2014 Submission included an allowance for the TTT project Construction costs in AMP6 of 210.2m (excluding resilience, prices). In its Draft Determination Ofwat only partially accepted our proposed Construction costs. In particular, Ofwat concluded that there was insufficient evidence to show that Thames Water's design and Construction costs were efficient. In the light of Ofwat s Draft Determination, we have reviewed the scope, complexity and management of the site-wide design cost. In addition, cost profiling of the design costs in AMP6 has been reviewed to take into account of the works that will have already been completed in AMP5 (design of utility diversions, boat relocations, and TBM power supplies). We have reflected a reduction in the scope of Category 2 project management costs, reflecting transfers of scope from Thames Water delivered work to IP. Construction costs have also been updated to take into account costs based on recent contract awards. Appendix C, TTT10 provides a breakdown of work packages, allowing a comparison between the June 2014 Submission and the new estimates (including our efficiency challenge) included in this response. Our latest estimates have resulted in a reduction to base construction costs for Category 2 and Category 3 works of 20.1m ( prices). Responding to Ofwat s challenge, our total AMP6 Construction costs have reduced from 210.2m to 190.1m ( prices) since our June 2014 Submission (see Table 12 below). 108 A detailed definition of each of these categories can be found on page 23 of our June 2014 Submission. 69
70 Table 12: Our response to Construction costs Prices m June 14 Business Plan Draft Determination October 2014 Response Construction Source: June 2014 Submission, Ofwat s Draft Determination and Thames Water estimates. Indirect Costs The delivery model agreed by key stakeholders for the TTT project requires Thames Water to interface with the IP within an agreed commercial framework, such that it enables successful programme management, integration and governance of all Thames Water TTT-related activities. Indirect Costs are the resources by which Thames Water provides this role. In essence, Indirect Costs are the resource costs that Thames Water must incur during the course of the TTT project in order to deliver the lowest overall delivery cost for the TTT project. They also include the cost of acquiring incremental insurance cover in AMP Our June 2014 Submission proposed Indirect Costs of 65.3m ( prices). 110 In its Draft Determination, Ofwat only partially accepted our costs, allowing 21.3m of the 655.3m sought in this cost category. When preparing our response to the Draft Determination we have considered the feedback from Ofwat and have incorporated information which has become available since June. Our main concern is that the position set out by Ofwat in its Draft Determination will increase the risk of delays during the acceptance and testing phases. Appendix C, TTT11 sets out in detail the adjustments we have made to our proposals. In summary, the key changes we have made, which result in a lower cost assessment for this category and lower overall cost for customers, include: a reduction in Thames Water TIG/Embedded resourcing due to efficiencies being identified through optimising resources across teams; reduced scope in Category 2 project management reflecting transfers of scope from Thames Water delivered work to IP delivered work leading to a reduced project management overhead; the use of improved lower benchmarks for specialist external resources for peak lopping following further detailed review of activities and resource needs; and the removal of professional indemnity insurance Our response to the Draft Determination is summarised in Table 13 below Specifically: Environmental Impairment Liability Insurance, Construction, Public Liability and Terrorism Insurance, and Professional Indemnity Insurance. See Appendix C, TTT11 for more information. As set out in Appendix C, TTT11, our June 2014 Submission included costs to cover a three year extension to our Environmental Impairment Liability insurance, owing to changes to our latest construction profile for the TTT project. 70
71 Table 13: Our response to Indirect Costs prices m June 14 Business Plan Draft Determination October 2014 Response Indirect Costs Source: Thames Water June 2014 Submission, Ofwat s Draft Determination and Thames Water estimates Our response includes additional information based on a detailed bottom-up analysis of the activities that are required to support the TTT project and the resources required to undertake them. 111 It also presents evidence that benchmarks the Client role performed by the TIG against comparative projects, thereby demonstrating an efficient solution. Corporate overheads The term Corporate overheads refers to the resources required to provide central support services the TTT project will need to draw upon during AMP6. Corporate overheads are calculated from the bottom up, based on the level of support required from the Thames Water central support team for individual support departments. Without the support from the central team there would need to be a greater level of Thames Water dedicated resources within the project. Any reduction in funding for corporate overheads, therefore, would result in an increase in indirect costs. Our June 2014 Submission proposed Corporate overheads of 22.9m ( prices). In its Draft Determination, Ofwat provisionally accepted our proposals, on the assumption that we are able to demonstrate sufficient customer protection in this area. As we set out in more detail in Appendix C, TTT12, our analysis shows that sufficient protection will be provided to customers through the cost sharing arrangements under the totex menu, whereby both the TIG team and the central team are incentivised to keep costs down. Our internal and external assurance processes also provide confidence that our accounting of costs is robust. Our response to the Draft Determination, therefore, reflects some minor reductions in Corporate Overheads compared to our June 2014 Submission due to more recent bottom-up assessment, as summarised by Table 14 below. Table 14: Our response to Corporate overheads costs Prices m June 14 Business Plan Draft Determination October 2014 Response Corporate Overheads Source: Thames Water June 2014 Submission, Ofwat s Draft Determination and Thames Water estimates. Note: The difference between our June 2014 Submission and Ofwat s DD cost is due to a price base discrepancy in our response to query TMS-TID-006. More detail is provided in Appendix C, TTT Appendix C, Annex TTT11. 71
72 AMP5 costs 4.87 The TTT project costs we will incur during AMP5 are grouped into two categories: land and non-land. Due to the uncertainty surrounding these costs, we have agreed bespoke regulatory governance arrangements including backward-looking comfort letters. Ofwat also included within its PR09 Final Determination an NI for land. Specifically, Ofwat confirmed that the costs incurred during AMP5 due to the acquisition of land for the TTT that are greater than the amount allowed at PR09 would qualify for the NI provided that: the process and criteria for selecting land comply with the site selection methodology or are otherwise necessary for the delivery of the TTT; the timing of each acquisition is deemed reasonable; the purchase price of each acquisition is reasonable; and each acquisition is in all circumstances, in the opinion of Ofwat, reasonable We note that Ofwat has provided backward-looking comfort letters to Thames Water for costs incurred between and In its Draft Determination, however, Ofwat made a 46.5m ( prices) intervention for land, a 68.9m ( prices) intervention for nonland and a 0.5m ( ) prices adjustment to AMP4 expenditure. In Appendix C, Annex TTT04 we respond to each of Ofwat s challenges in turn, setting out further evidence underpinning our cost assessment and updating it where new information has become available. A summary of our position on land and non-land is provided below: AMP5 Land costs: o o Following a review of property transactions we confirm that there has been no double count with regards to land costs. Further evidence is provided in Appendix C, TTT04 demonstrating that there has been no double count of Carnwath Road, and that the rental income of Camelford House is justified. We accept Ofwat s reallocation of costs between land and non-land, assuming that the overall impact on Thames Water is neutral. AMP5 Non-Land costs: o o As set out in detail in Appendix C, Annex TTT04, we have presented an updated forecast for demonstrating it is economic, efficient and the appropriate assumption for the year. On this basis there is no requirement for an additional Ofwat efficiency challenge. As above, we accept the reallocation of costs where accepted in land. However, we refute the removal of inflation Our response to the Draft Determination is summarised in Table 15 below. 112 Final Determination of price limits Letter from Ofwat (Regina Finn) to Thames Water (David Owens), 25 November
73 Table 15: Our response to AMP5 costs ( m, 2012/13 prices) Claim category June Business Plan Draft Determination Representation Land Non-Land Total Source: June 2014 Submission, Ofwat s Draft Determination and Thames Water estimates As shown in Table 15 our representation reduces the gap between our June 2014 Submission and Ofwat s Draft Determination position. Some of this difference is accounted for by new information which became available between our June 2014 Submission and the Draft Determination. Where we have reaffirmed our position we have provided further justification underpinning our cost assessment. We believe that all AMP5 NI costs meet the requirements set out by Ofwat in PR09 and should therefore be included in the Final Determination. Our detailed logging up requirements are set out in Appendix C, TTT04. E Uncertainty Mechanisms As set out above, in its Draft Determination Ofwat proposed an NI for the transfer of scope between the IP and Thames Water, together with a bespoke IDoK mechanism. 113 In addition, it has proposed a mechanism that would allow certain costs to be logged up at the next price review if we do not apply to reopen prices during the period 114. In their current form, the mechanisms proposed by Ofwat will not cover the development costs incurred in the event of a delay in IP licence award. In addition no funding has been allocated for development risk in the Draft Determination. Consequently Ofwat s position does not reflect the nature and stage of the TTT project. Ofwat is also considering whether there should be an additional uncertainty mechanism for the impact of the planning consent as well as a Relevant Change of Circumstance for changes to the Project Specification and Preparatory Notices. Our full response to these proposals is set out in detail in Appendix C, TTT03, but in summary our principal concern is that Ofwat s treatment of risk and uncertainty is not in the long-term interests of our customers. By excluding significant project risks from either direct funding or its proposed uncertainty mechanisms, Ofwat is increasing the overall risk of the TTT project which could ultimately increase the cost to customers. We note that Ofwat recognises in its Draft Determination that we face unique risks around planning and IP procurement: % Materiality Threshold of TTT price control capex, and 2% Triviality Threshold for each Relevant Item. Only the Triviality assessment would apply to logging up claims and it would apply to any amounts over those funded rather than individual items. 73
74 There is currently uncertainty around the outcome of the planning process which is expected to be known in September The outcome may provide increased certainty in respect of the timing of activities to be carried out by Thames. However there are a range of scenarios where the impact on Thames Water may be no more certain than it is today We agree that there remain material risks following the DCO decision, and, as such, these contribute significantly to the overall risk of the TTT project. To protect customers from risks which may or may not materialise, we propose that the risks are not funded ex ante but should be covered by an NI for reasonable and efficient Development costs. As a result of our proposals, customers would be protected from paying up front for risks that do not materialise. 115 Table AA5.1, Annex 5, Ofwat s Draft Determination. 74
75 Section 5 Retail Household A Introduction In this section we provide an overview of our response to Ofwat s Draft Determination with respect to the Retail Household business. Overall, we are pleased that Ofwat has endorsed our approach to self-reporting, developing customer outcomes, performance commitments (PC) and delivery incentives and has made relatively few interventions on this aspect of our plan. We note, however, that in a small number of important areas, the approach set out in the Draft Determination is unlikely to be in the interests of customers, not least because the Draft Determination, as it stands, would leave the Retail Household business in an unsustainable financial position if it were a stand-alone company. This reflects the fact that Ofwat has disallowed some 11% of our proposed allowed expenditure. This section, therefore, sets out the evidence in support of the view that an alternative approach is likely to lead to better outcomes in these areas. Within that context, this section: assesses Ofwat s interventions on our outcomes and performance commitments (Section B); sets out our concerns with Ofwat s intervention on the ODI related to our new online account management system (Section C); and makes a number of representations on the calculation of the retail household price control including the allocation of costs between unmeasured and metered activity, and an adjustment to reflect the unusually high number of rental properties and the transient nature of our customer base. We also propose a number of technical adjustments relating to the use of the price base, the impact of TTT and the efficiency saving we propose through our customer outcomes (Section D). 5.3 Further analysis and evidence is provided in Appendix D. B 5.4 Outcomes and Performance Commitments Ofwat has made interventions on the performance commitments related to payment plans and cash collections rates as well as introducing a new SIM-related performance commitment. We consider each of these in turn. 75
76 RC1: Increase the number of customers on payment plans 5.5 Ofwat has intervened on performance commitment RC1 by removing the statement The performance commitment excludes the effect of the TTT. 116 Ofwat states that the number of customers on a payment plan should not be impacted by the TTT. 117 We accept this intervention and propose no further changes to this performance commitment. RC2: Increase cash collection rates Ofwat has intervened on performance commitment RC2 by removing the statement The performance commitment excludes the effect of the TTT. 118 Our analysis indicates that the TTT will have an adverse impact on collection rates, which means that the intervention implied by the Draft Determination would require an associated adjustment to the proposed performance levels. We set out in Table 16 the consequential amendments to the target compared to those included in the Draft Determination necessary to achieve the required adjustment for the TTT impact. In effect this is the equivalent to the target in our June 2014 Submission after the change in definition. The adjustment reflects our econometric estimates of the TTT impact on doubtful debt which equates to 6.4m across AMP6 (through average household bill size); the details of which were provided as part of our June 2014 Submission We request that Ofwat include the revised targets in the Final Determination. Table 16: RC2 Performance Commitment levels Starting level Committed performance levels Unit DD % 88.6% 89.0% 89.5% 90.0% 90.0% 91.0% Required revision Net change % 88.6% 89.0% 89.4% 89.7% 89.6% 90.4% % 0.0% 0.0% (0.1%) (0.3%) (0.4%) (0.6%) Source: Thames Water Draft Determination and CS Finance Team Thames Water Draft Determination company-specific appendix, page 189. Thames Water Draft Determination company-specific appendix, page 116. Thames Water Draft Determination company-specific appendix, page 190. As part of submission TJ075 Oxera report on assessment of Thames Waters proposed levels of doubtful debt over PR14. We note that this evidence, in conjunction with corroborating analysis provided in query responses to our June submission, was reviewed by PwC (on behalf of Ofwat) who assessed the strength of the evidence to be of commensurate quality to that provided by the two companies that received enhanced status. 76
77 RA6: Service Incentive Mechanism The Draft Determination has introduced a new performance commitment RA6 Service Incentive Mechanism (SIM) on the basis that SIM will continue to operate in as a comparative industry metric; therefore, we have included it as part of the package of incentives. The reward and penalty will be determined by Ofwat. 121 In the Draft Determination, the performance commitment target has been set as tbc in each year from to While we had not anticipated including this, it should not affect the overall risk and reward package since we had assumed that the industry-wide SIM specified by Ofwat would operate in addition to the ODIs proposed by Thames Water. For that reason we support the proposal to include this new SIM-related performance commitment. However, we are not yet clear whether a target should be included within the performance commitment, given that it will operate as an industry-wide incentive to be set by Ofwat. To the extent that Ofwat wishes to include a target for the Final Determination, we would propose an approach based upon Ofwat s template. We provide further details in Schedule 1 including our recommendation that the target in recognises that the implementation of CRMB may result in a temporary downturn in our SIM score. Our proposed approach ensures consistency with the wider framework for performance commitments. C 5.12 Delivery Incentives This section provides further details of our concerns with Ofwat s intervention on the ODI associated with our new online account management system. As a general point, the ODI was originally proposed and calculated on the basis that full funding for the CRMB system would be allowed in AMP6. The investment of 18.6m in AMP6 is material and should be considered separately when considering new costs and not netted off against the other outcomes. If partial funding is allowed then the consequence of this is that the ODI would no longer be valid and the basis for the calculation of the penalty will be incorrect and disproportionate. Our more specific concerns are set out below. RB1: Implement new online account management for customers supported by web-chat Performance commitment RB1 relates to the go live of our proposed new billing system, Customer Relationship Management and Billing (CRMB). The Draft Determination includes an intervention on the associated ODI for this performance commitment to include additional penalties of 6.5m in 2018/19 and for late go live of the system in AMP6. In our June 2014 submission, we did not consider that a graduated penalty structure relating to delays in go live during AMP6 was necessary or appropriate because there will already be a number of incentives on us to implement the system on time e.g. through SIM and the reputational incentives associated with other performance commitments. Rather, the penalty we proposed for non-delivery in AMP6 of 20.5m was based on the net cost in the period plus 121 Thames Water Draft Determination company-specific appendix, page
78 a 10% penalty premium. This provided more than sufficient protection for customers from underperformance because the full ODI penalty of 20.5m would be larger than the avoided costs of 18.6m in AMP6, thus providing a very strong incentive for us to implement the system on time In a subsequent query response to Ofwat of 15 July 2014, 122 we estimated the discounted benefits of the system to be 6.6m in and 6.4m in ,124 The two new penalties included in the Draft Determination are additional to the penalty included in our June 2014 submission and therefore increase the total potential penalty by 13m to 33.5m. Ofwat has also modified the references to ODI penalties being dependent upon whether delays occur for reasons outside of reasonable management control. We do not support this change given the scale and complexity of this project. Situations can occur in which even the best planning and management could not have foreseen. We believe that this wording should be reinstated in the ODI, especially as customers are also protected through SIM. The Draft Determination suggests that a graduated penalty structure for late delivery would provide the necessary protection for customers. However, we do not accept that this should be additional to the 20.5m penalty proposed in our June 2014 submission for non-delivery in AMP6. As set out above, our proposed penalty provides very strong protection for customers; it is not helpful to customers to provide an additional penalty for late delivery. The net effect of the proposed intervention is to increase the proposed penalty premium from 10% to 80% as set out in the table below. Table 17: Analysis of penalties associated with performance commitment RB1 m (at price base) % of avoided cost Avoided cost 18.6 N/A Thames Water proposed penalty % DD additional penalties % DD total penalty % Source: Thames Water Draft Determination and Thames Water analysis We suggest that the interests of customers would be better served if the ODI includes Ofwat s proposed new penalties for and provided that the additional 13m penalty is netted off from the 20.5m penalty, i.e. resulting in a penalty of 7.5m if go live does not occur in AMP6. Otherwise the Draft Determination will introduce a disproportionate and unnecessary level of penalty premium. This change is illustrated in Ofwat s template for the incentive rate shown in Table 18. We also ask Ofwat to take into account the adjustment we Outcome query response, sent to Ofwat on 15 July 2014 in response to initial Ofwat views on the performance commitments and ODIs. This is out of a total 10 year discounted benefit of 58m ( prices). From CBA and ODI Calcs for CRMB xlsx. We have assumed that the analysis set out in our query response formed the basis of Ofwat s proposed new penalty of 6.5m per year. 78
79 have made to our costs to reflect the 5.4m that we spent in AMP5 investigating the billing system. Further details can be found in Appendix D RHH01 New Costs (CRMB) A consequential change would also be required to the text added by Ofwat s intervention in the additional details" on the incentive. 125 Our proposals in this area are included in Schedule 2. Table 18: Proposed revisions to RB1 Outcome Delivery Incentive Incentive type Performance levels (status) Incentive rate ( at pricebase/status) Lower Upper Penalty CRMB billing system does not go live 6.5m in years 4 and 5 Penalty CRMB billing system not commissioned or on track for delivery CRMB billing system does not go live Additional 7.5m applicable in year 5 (total allowed cost in ACTS adjustment plus premium, less 6.5m in two years) Source: Thames Water Draft Determination and Thames Water D 5.20 Calculating the Retail household price control This section outlines our response to Ofwat s adjustment to the price base of the Average Cost to Serve (ACTS) calculation, the proposed ACTS adjustments, the treatment of new costs and Ofwat s request for additional information and evidence on the allocation of costs. In particular: we believe Ofwat should reconsider the application of its guidance to RPI for Retail; we have amended our allocation of costs between unmeasured and metered in a way which we believe is now consistent with the rest of the industry; we invite Ofwat to accept our case for investing in a new CRMB; we request Ofwat considers a revised net incremental expenditure associated with Outcome C due to its intervention on TTT; we ask Ofwat to consider our evidence for an adjustment to reflect the unusually high number of rental properties and the transient nature of our customer base; we urge Ofwat to reconsider the model for setting the Retail household control and in particular would welcome an approach that considers aggregate materiality for all new costs and adjustments; and 125 Thames Water Draft Determination company-specific appendix, pages
80 we ask Ofwat to consider our response to the changes we have made to our allocation of costs. Price Base 5.21 The Draft Determination challenges the price base methodology we have applied in arriving at our AMP6 numbers. Ofwat states While reviewing the company s cost allocations, we also noted that the company had submitted tables R3 and R4 in outturn prices. This is not in line with our guidance which required these tables to be prepared in base year prices. We have amended our models to deflate the company s household and nonhousehold costs to base year prices. 126 The impact of Ofwat s adjustment is a net reduction in Retail household operating expenditure of 21.1m; see Table 19 for a more detailed breakdown. Table 19: Impact of Ofwat adjustment to data table R3 (June 2014 Submission) Expenditure Total Total operating expenditure (excluding exceptional items) - submitted in June by TW, m at price base Revised - deflated in line with Ofwat adj. m at price base Variance to DD (4.2) (4.3) (4.3) (4.3) (4.1) (21.1) Source: Thames Water Draft Determination and Thames Water Analysis Within the data table commentary submitted as part of our June 2014 Submission, we did not deflate costs in in order to be consistent with Ofwat s guidance i.e. RPI should not be applied to Retail household costs In line with this guidance, we were required to use figures as our start point. 129 With these principles guiding our approach, we concluded that the most accurate representation of our operating costs was to use figures, with no inflationary adjustments under the premise that inflation should not be applied to Retail costs. We are aware that there appears to be a difference in interpretation across the industry in relation to the price base applied to data table R3, as can be seen from the Draft Determination published 29 August 2014; six out of eight Draft Determinations for water and Thames Water Draft Determination, 29 August 2014; pg. 50. Setting price controls for final methodology and expectations for companies business plans, pg Preparing business plans for the 2014 price review retail questions and answers 14 November 2013; pg. 4. Setting price controls for final methodology and expectations for companies business plans, pg
81 sewerage companies failed the price base test. We believe that these inconsistencies have arisen where other companies have applied a similar interpretation of Ofwat guidance in completing data table R In determining our methodology we have, once again, undertaken a very careful review of Ofwat s guidance including in-depth discussions with our assurance provider. We have determined that the two guiding principles that came out of the PR14 methodology are important and must be upheld: the ACTS will be calculated using the year data; 130 and RPI indexation is not appropriate for the Retail household control Application of the above principles implies using operating expenditure to calculate ACTS with no adjustment for inflation. For that reason, we propose that Ofwat accepts the operating expenditure submitted in data table R3 of the June 2014 Submission. We believe Ofwat should reconsider the application of its guidance in relation to RPI for Retail, aligning the forward looking methodology applied to AMP6 operating expenditure with the determination of the opening position. The impact of Ofwat accepting our representation will be to increase operating expenditure for Retail household by 21.1m. In line with the discussion above, data table R3 has been submitted based on operating expenditure in nominal terms, with no deflation for RPI. Cost to serve adjustments The Draft Determination sets out Ofwat s assessment of our proposed ACTS adjustments. In this section we set out our comments on Ofwat s assessment as well as providing our views on areas where additional adjustments might be required including the calculation of unmeasured and metered activity, the Thames Tideway Tunnel adjustment, new costs related to the CRMB, other new costs, costs associated with the unusually high number of rental properties along with the transient nature of our customer base and the impact of input price pressure. The calculation of unmeasured and metered activity In the Draft Determination Ofwat has allowed the costs shown in Table 20. The cost to serve was below the average of unmetered customers and therefore these costs have been allowed in full. However, for metered customers our cost to serve was above the average and therefore subject to an efficiency challenge. In total, this challenge amounts to 51.5m in absolute terms over AMP Setting price controls for final methodology and expectations for companies business plans, pg. 98. Setting price controls for final methodology and expectations for companies business plans, pg
82 Table 20: Thames Water Draft Determination Allowed Cost to Serve Cost per customer ( at nominal prices) Unmetered single service Unmetered water and waste Metered water only Metered waste only Metered water and waste Source: Thames Water Draft Determination company-specific appendix, page While we recognise that our cost to serve for metered costs is higher than the industry average, we were surprised by the degree of the disparity. For that reason, we carried out further analysis of Ofwat s published data on other companies cost to serve in order to better understand this difference. In particular, we wanted to establish whether the allocation of costs between metered and unmetered customers in our June 2014 Submission was consistent with the methodology applied by the rest of the industry. It is important that every company allocates these costs in exactly the same way otherwise there could be unintended consequences, such as companies being penalised for inefficiency when, in fact, the variance is a consequence of the allocation approach. We should emphasise, up front, that the evidence we have gathered and set out in no way casts doubt on the methodology applied by other companies in the industry. Rather it confirms that Ofwat s guidance can be interpreted in different ways and that the approach we applied for previous submissions differs from other companies while still being consistent with the guidance. The consequence of this is that the cost data provided to Ofwat in our June 2014 Submission does not allow a comparable cost to serve to be calculated for Thames Water. The approach we used to allocating costs for our June 2014 Submission (and earlier submissions) had the effect of inadvertently skewing our costs compared to the Industry, resulting in below industry average cost for unmetered customers, whilst showing significantly above the Industry cost for metered customers. In light of this new information, we have revised our allocation method to follow the allocation approach we believe has been adopted by the industry to provide a more comparable basis for cost to serve. Our new method allocates meter reading costs to metered customers along with the incremental costs of handling metered customers contacts. All other costs are allocated based on the number of connections. The effect of this change is to increase our AMP6 allowed retail cost to serve by 26.5m (at 12/13 prices and excluding net margin). Full details including our supporting analysis can be found in Appendix D RHH02 Cost to Serve. The impact of this change has been included in data table R3 and supporting line commentary. 82
83 5.36 We invite Ofwat to accept our case for a revision to our cost to serve and would be happy to discuss this further. TTT adjustment Our June 2014 Submission included a TTT related adjustment to cover additional costs (principally comprising bad debt and commissions) that arise from Thames Water acting as the principal to the billing arrangements with the TTT Infrastructure Provider. The value of our proposed adjustment was 13.9m. The Draft Determination rejects our proposal for an ACTS adjustment on the grounds that the adjustment would be below the materiality threshold. However, Ofwat has accepted that these costs should be included in our base opex as per the subsequent query dated 10 September This adjustment is summarised in the table below. Table 21: New Costs and Adjustments Spreadsheet in ACTS retail Model row m m m m m Total m June submission at price base Ofwat query response at price base Source: Thames Water and Ofwat query response (dated 16 September 2014) We therefore request that this amendment is included in the Final Determination. New costs (CRMB) Ofwat has allowed the new costs associated with the CRMB in the Draft Determination on the grounds that these costs do not result in material increases when taken together with the other efficiency savings that we have proposed. However, Ofwat also stated that it would expect to see further evidence supporting these investments, as well as proposals for how to protect customers in the event that the investment does not deliver as envisaged. 132 Our detailed representation on this issue is set out in Appendix D RHH01 New Costs (CRMB). The investment in a new CRMB is fundamental to the success of our Retail Household business. The system is a key enabler of our customer outcomes and performance commitments in AMP6. It also reduces business risk and improves resilience and agility, and importantly provides the foundation that will enable us to deliver customer service excellence into the future. 132 Thames Water Draft Determination company-specific appendix, page
84 5.42 We have carefully reviewed Ofwat s concerns and have addressed all of them. In particular, we have: confirmed the need for this investment and demonstrated materiality; proposed an adjustment to costs of 5.4m 133 to take into account money spent in AMP5 on investigating a new billing system. This is to be treated as a legacy adjustment rather than a reduction in cost in the Retail household price control; carried out detailed cost benefit analysis of alternative options; undertaken market testing by obtaining cost estimates from another major supplier, in addition to those we had already received; and commissioned assurance of our case by an independent expert We therefore invite Ofwat to accept our case for investing 77.7m 134 in a new CRMB in AMP6. This investment will provide customers with a wide range of the benefits they have told us they want including full online account management and new innovative tariffs. Significant bill collection improvements will also be supported through integration with our new credit collections management system and self-service platform. Better information and customer insight will enable us to continually improve our service and our teams will have the right tools to deliver our objective of customer excellence. It will reduce business risk and secure resilience to our sales, billing and cash collection, which is important for the company to function and provide a service to our customers. The system is planned to be implemented in , with a phased roll out across the customer base to minimise the risks associated with large and complex system implementations. Customers are protected if we fail to implement the new system by our outcome delivery incentive which will apply financial penalties if we do not go live on time. New Costs (Other) 5.45 In our June 2014 Submission, we included a net incremental reduction in expenditure of 10.2m due to the following outcomes: Outcome A: Improve customer service by doing the basics excellently and right first time; Outcome B: Offer a choice of easy to use contact options; and Outcome C: Improve cash collection from those customers that can pay and helping those customers who are struggling to pay Table 22 shows how this 10.2m has been derived across AMP Further details are included in the Wholesale water and wastewater sections of this response 77.7m is at price base 84
85 Table 22: Incremental expenditure associated with Retail Household outcomes (December 2013 submission) m at price base Total Outcome A (0.106) (0.007) (0.007) (0.005) Outcome B (0.362) (0.156) (0.018) (1.134) (0.671) Outcome C (9.425) (1.442) (2.227) (10.115) Total (0.362) (8.463) (1.082) (3.366) (10.219) Source: Retail Data Table R1 June Ofwat stated in the Draft Determination that the change in expenditure associated with these outcomes had not been factored into the calculation of new costs or the setting of household retail expenditure as this was identified late in their process. The changes to expenditure and the evidence supporting them would be considered when setting Final Determinations. However, the costs and benefits associated with these outcomes have in fact been included in Block A line 1 of data table R3, as our interpretation of the Ofwat reporting requirements 135 concluded that only exceptional items should be excluded from line 1 and reported in Block C of data table R3. Therefore, our net incremental reduction in expenditure due to our outcomes has in practice been factored into Ofwat s assessment and Draft Determination. As we note earlier in Section B, Ofwat has intervened on performance commitment RC2: Increase cash collection rates by removing the statement The performance commitment excludes the effect of the TTT. 136 We have set out our proposed amendments to the target; however, the intervention also has an impact on the change in expenditure of 6.4m for performance commitment RC2 and Outcome C. This arises because of the inclusion of the bad debt impact, ( 6.4m), of the TTT which was included in our June 2014 submission as an adjustment. 137 Table 23 shows how this impacts upon the expenditure associated with Outcome C compared to the June 2014 submission Thames Water Draft Determination company-specific appendix, page 190. PR14 June 2014 GAR G RBR6 Impact of TTT on Retail costs. 85
86 Table 23: Impact of the Ofwat intervention for incremental expenditure associated with Outcome C, m at price base Outcome C Total June 2014 Business Plan (9.425) (1.442) (2.227) (10.115) Impact of Ofwat intervention Revised expenditure (9.199) (0.869) (1.576) (7.567) Source: CS Finance, PR14 representations TTT adj v1.2, , & Retail Data Table R1 June The net effect of this adjustment is to reduce the saving associated with Outcome C from 10.1m to 7.6m. We request that Ofwat considers this revised net incremental expenditure in our Final Determination. It should also be noted that the depreciation of 23.7m associated with the new CRMB system was included in data table R3 but not reported in data tables R1 and R2a because there was no robust way of apportioning the costs to specific outcomes. This was highlighted in our June 2014 Submission. However, the AMP6 benefits associated with the new system are reported under the relevant Outcome. Further details on the CRMB can be found in Appendix D RHH01 New Cost (CRMB) of this document. Impact of occupancy turnover Our June 2014 Submission explained that further work was ongoing to understand the impact on our costs of the transient population in our area. We have now had the opportunity to examine this issue in greater detail and propose a new Actual Cost to Serve adjustment associated with the higher levels of rented property and transient population within our region. Full details of our representation can be found in Appendix D RHH03 Occupancy Turnover. In summary, our analysis shows that: the high proportion of rented property in our area is correlated to the level of bad debt costs, meaning that the efficient level of our bad debt costs is higher than the industry average; and higher than average occupancy turnover levels increase the number of contacts that we have with customers which, in turn, leads to additional cost Our proposed ACTS adjustment related to this issue is 93.2m (2013/14 prices) and we believe this meets the requirements of the criteria set by Ofwat in so far as it: has a material impact on our costs. This adjustment exceeds Ofwat s materiality threshold of 2.25% (which equates to 16.3m in absolute terms for Thames Water); 86
87 is beyond efficient management control. An independent review of our approach in this area confirmed that we apply best practice in most areas and have included in our business plan the actions and outcomes to address the areas that are not performing; and impacts the company in a materially different way to other companies. Our analysis shows that we have the highest levels of occupancy turnover and rental properties in the water industry reflecting the fact that our operating area covers London which has exceptionally high internal and international migration rates Our submission in this area builds on our earlier analysis of these issues including input from Oxera. 138 We have now commissioned two further reports as well as carrying out some additional in-house analysis. The first of these is a report by Experian on the levels of transient population and rented properties across the water industry. The second is a report by NERA who have modelled the correlation between bad debt and rented properties using information contained in the Experian report and building upon the work set out in our June 2014 business plan submission. We invite Ofwat to include our proposed adjustment in the Final Determination, not least because this would reduce the overall industry average cost to serve. Input price pressure We note that of the 14 companies for whom Draft Determinations were issued on 29 August 2014, ten applied for additional funding in relation to input price pressure. This indicates that the majority of companies also believe, as we do, that input price pressures are unavoidable with respect to Retail Household. We also note that of these ten applications, Ofwat accepted Yorkshire Water s submission in this area. Whilst Ofwat has been clear that it has only made an allowance for companies whose costs are upper quartile, the logical consequence of that approach is to recognise that retail entities within the water sector are faced with unavoidable cost pressure related to input prices. Therefore, if upper quartile efficient companies face these cost pressures, then by extension all retail companies must face similar pressures because input price pressure is likely to be independent of efficiency performance. We invite Ofwat to reconsider its position on input price pressures by making allowance for these costs in the Final Determination. The approach to assessing materiality 5.60 In this section of our response we have identified a number of factors largely outside of our control that are likely to impact upon our calculation of average cost to serve (ACTS). Ofwat s publication Setting price controls for final methodology and expectations for companies business plans sets out the approach it will take to setting the household retail control ACTS. 138 See for example TJ075 Oxera report on assessment of Thames Water s proposed levels of doubtful debt over PR14. 87
88 5.61 That document explains that Ofwat will consider adjustments where the company can demonstrate that an issue: has a material impact on its costs; is beyond management control (having taken all possible steps to control it); and impacts the company in a materially different way to other companies The materiality threshold is set at 2.25% of base operating costs plus depreciation. This represents a relatively high hurdle for all companies. For Thames Water, this gives an absolute materiality threshold of 16.3m for AMP6 based on the financial assumptions included in the Draft Determination. We note that there are likely to be cases where companies can pass the second and third criteria, while failing the materiality test. The result is that there will be no specific allowance for that individual cost adjustment. Another important aspect of the overall control is the Retail household margin, which has been set at 1%. The margin has been included to ensure the control covers all relevant costs (including a reasonable return) and to allow the financial performance associated with providing the relevant services to stand alone. In our case, if (and only if) all of the cost targets are met, the margin would imply a profit of 89m. This means with a materiality threshold of 16.3m any real cost that we incur that has been disallowed on grounds of materiality could significantly erode this margin. We are concerned that an accumulation of individual materiality failures could fundamentally undermine one of Ofwat s stated purposes for the retail margin i.e. to cover all relevant costs (including a reasonable return). We believe this is potentially unfair. We have provided Ofwat with evidence for costs relating to a CRMB, new costs associated with our outcomes, company specific costs associated with the billing and collection of the Thames Tideway Tunnel and the unusually high level of rental properties and transient population in our footprint area. If these costs are not allowed in the Final Determination on grounds of materiality, the net effect would be to erode our household retail margin. The margin is placed under further pressure by the efficiency challenge set by Ofwat, the requirement to fund the capital for investment and the decision to exclude input price inflation from the control. When all of these factors are considered together we are concerned that the Retail household control is not financially sustainable. For that reason, we would urge Ofwat to reconsider the model for setting the retail household control. In particular, we would welcome an approach that considers aggregate materiality for all new costs and adjustments e.g. by allowing any item which exceeds 10% of the allowed retail margin to be automatically considered material. The margin is placed under further pressure by the efficiency challenge set by Ofwat, the requirement to fund the capital for investment and the decision to exclude input price inflation from the control. When all of these factors are considered together we are concerned that the Retail household control is not financially sustainable. For that reason, we would urge Ofwat to reconsider the model for setting the retail household control. In particular, we would welcome an approach that considers aggregate materiality for all new costs and adjustments 88
89 e.g. by allowing any item which exceeds 10% of the allowed retail margin to be automatically considered material. Allocation of costs 5.69 Ofwat has identified a number of issues regarding our allocation of costs and has listed a number of actions that it requires us to address. We consider each of these in turn. IT costs (telephony) and facilities, building and grounds maintenance The Draft Determination notes that the company has not allocated the following costs between retail and wholesale in accordance with our guidance IT costs (telephony) and facilities, building and grounds maintenance. 139 Following correspondence through the query process, Ofwat 140 has confirmed that it no longer requires us to respond to the allocation of IT costs (telephony) and facilities, building and ground maintenance between retail and wholesale. These allocations were included in the Draft Determination for completeness but no further comment is included as our cost allocation in these areas has now been deemed appropriate. Debt management The Draft Determination notes that the company has not allocated debt management between household and non-household in accordance with our guidance. and goes on to request a calculation of what the allocation of costs would be between household and nonhousehold..allocating debt management between household and non-household in accordance with our guidance (on a sample basis if required). 141 Ofwat s guidance is based upon debt outstanding for more than 30 days whereas our approach considered debt outstanding over 90 days. In response to the Draft Determination, we have carried out a report to examine outstanding debt over 30 days and compared this to our June 2014 submission. The impact of using the 30 day debt report for debt management costs, compared to the 90 day report is shown in the table below. Using the debt over 30 days report, the percentage differential allocation for household would be 0.4% compared to the 90 day report, details are provided in Table Thames Water Draft Determination company-specific appendix, page 49. Outcome query response, sent to Ofwat on 30 August 2014 in response to Thames Water Draft Determination company-specific appendix Thames Water Draft Determination company-specific appendix, page
90 Table 24: The allocation of debt management costs, m at price base Debt management costs 2016 m 2017 m 2018 m 2019 m 2020 m Total m Household Original submission Revised submission Impact Non-household Original submission Revised submission Impact (0.026) (0.026) (0.026) (0.028) (0.027) (0.133) Source: CS Finance Team As the impact of this change is below Ofwat s materiality threshold, line 1 of date table R3 has not been updated to reflect this change. Doubtful debts In the Draft Determination, Ofwat states that it expects Thames Water to submit a crosscheck of its allocation of doubtful debts based on write offs against an allocation based on the movement in outstanding debt and present us with the results of this cross-check (that is, how different would the allocation between household and non-household be based on the movement in outstanding debt from 31 March 2013 to 31 March 2014). 142 We do not calculate our provision for doubtful debts on an individual customer basis because our current systems are not configured to separately segment this type of debt into household and non-household. We therefore used an alternative cost allocation methodology in our June 2014 submission. Our approach 143 is to calculate doubtful debt across the entire retail customer base and then to allocate this between Household and Non Household based on actual write off performance over the previous five years. This allocation approach is considered to provide an appropriate cost allocation methodology in light of the capability of our current systems. In AMP6 we are proposing to implement new systems for Retail Household and Non-Household which will enable separate bad debt provisions to be calculated. Effectively, the approach used in our June 2014 Submission allocated doubtful debts to Household and Non Household to an accurate degree since it was based on five years of historic data. The check required by Ofwat is to compare the movement in outstanding debt from 31 March 2013 to 31 March 2014 against our doubtful debt allocation. Since our system 142 Thames Water Draft Determination company-specific appendix, page As set out in Technical Appendix TJ078 Bad Debt Allocation. 90
91 does not differentiate our debt book by Household and Hon Household, we are unable to perform the test requested by Ofwat We considered whether it would be possible to manually calculate the charge but the volume of debtors and transactions that need to be assessed make this impractical in the time available. We do not believe that any other potential cost allocation methodology would be as accurate as that used in our PR14 submission and, accordingly, would not provide the same degree of confidence as our current methodology. We would be happy to discuss this further with Ofwat. Principal use guidance The Draft Determination states the company has not complied with the principal use guidance with respect to the allocation of capital costs and depreciation. 144 We have adjusted data table R3 accordingly so that it complies with the principal use guidance. The net impact is that data table R3 now includes an additional m of depreciation across AMP6. We ask Ofwat to reconsider its guidance as it currently penalises wholesale to the extent that if data tables W3 and S3 are amended to reflect the m cost transfer to Retail Household, the wholesale price controls would be underfunded by this amount. Customer ratio guidance 5.84 The Draft Determination states the company has not used the prescribed customer number ratio of 1:3 for dual service customers when allocating its costs between household and nonhousehold using customer numbers. 145 In response, we have corrected our allocation of general and support costs to comply with the customer ratio of 1:3 as required by Ofwat, see Table Thames Water Draft Determination company-specific appendix, page Thames Water Draft Determination company-specific appendix, page
92 Table 25: Analysis of Retail Household and Retail Non-Household general and support costs m at price base Household Total Original submission Revised submission Impact Non-household Original submission Revised submission Impact (0.066) (0.066) (0.066) (0.066) (0.066) (0.330) Source: CS Finance Team As the impact of this change is below Ofwat s materiality threshold, line 1 of table R3 has not been updated to reflect this change. Cost allocation summary 5.86 In response to Ofwat s requests for clarification of our approach to cost allocation in these areas, we engaged KPMG to perform specific agreed upon procedures on the changes made following the Draft Determination. We consider that we have fully addressed Ofwat s concerns in these areas and would invite further comment if there are any issues that require further clarification. Our updated data table R3 has been submitted as part of our response. Summary of the Retail household price control 5.87 We have proposed a number of representations for adjustments to the Retail Price Control, provided additional information to support our June submission and made the changes to our cost allocation, as required by Ofwat. These have been reflected in a revised data table R3 which is accompanying this document. In summary we have: explained the basis for the use of price base; updated our methodology for allocating costs between unmetered and metered customers; included the Thames Tideway Tunnel adjustment within line 1 total operating expenditure (exc exceptional items) costs of data table R3; provided additional information to support the investment in a new CRMB; updated and clarified how we have reported our new costs associated with our service outcomes; 92
93 proposed a new adjustment, which meets Ofwat s criteria, to take account of the unusually high number of rental properties and the transient nature of our customer base on our cost to serve; asked Ofwat to reconsider input price pressure for Retail and to reduce the materiality threshold; and processed changes to cost allocation including the Principal use guidance in respect of capital costs and depreciation The impact of these changes would be an increase in our allowed cost to serve based on the Ofwat Retail feeder model. 93
94 E Schedule 1: RA6 Service Incentive Mechanism Section B explains our views on Ofwat s proposed new performance commitment related to the SIM. In that section we noted that it was not currently clear whether Ofwat proposed to include targets in the Final Determination and that, if it did, then these should be based on Ofwat s template. Our proposed approach is set out in Table 26 and is based on the change in SIM score, reflecting our expected improvements in customer service performance across AMP6, albeit with a temporary downturn when our Customer Relationship Management and Billing (CRMB) system is implemented (which is also reflected in performance commitment RA1 and RA3). We have also made a number of additional adjustments to the performance commitment template provided in the Draft Determination to provide further clarity on our proposed approach: 146 We have provided additional details on the measurement units; We have included a reference to the proposed horizontal audits. This is in line with our other performance commitments and ODIs, where we make reference to the assurance process to ensure that the associated rewards and penalties are calculated robustly; and We have included a statement around the reward cap and penalty collar. This is in line with the other financial ODIs and reflects the reward and penalty ranges specified in Ofwat s conclusions on AMP6 SIM. 147 Table 26: RA6 Proposed performance commitments Unit Starting level Committed performance levels Performance Change Base Performance Performance Performance Performance commitment in score year improvement improvement on improvement improvement on on previous previous year on previous previous year year excluding Retail year household charging & billing Source: Thames Water Thames Water Draft Determination company-specific appendix, pages Ofwat, Service incentive mechanism (SIM) for 2015 onwards conclusions, April 2014, page 4. 94
95 Table 27: RA6 Additional details Necessary detail on measurement units The performance commitment is for an annual improvement in SIM score between and The target in recognises that the implementation of CRMB may result in a temporary downturn in SIM score. The target is, therefore, for an improvement in performance excluding any direct impact from the CRM and Billing system. This adjustment applies to the later years of AMP6 should the CRMB system be implemented later than Frequency of performance commitment measurement and any use of averaging Timing and frequency of rewards/penalties Form of reward/penalty Any other information or clarifications relevant to correct application of incentive Annual Penalties and rewards will be calculated at PR19, to be applied in Adjustment to revenue Ofwat determined reward and penalty incentive. Incentive to be determined with appropriate horizontal audits. The annual reward cap is 6% of average annual Retail household revenue in AMP6 and the penalty collar is 12% of average annual Retail household revenue in AMP6. Source: Thames Water. 95
96 F Schedule 2: CRMB ODI Section C explains the ODI relating to our planned CRMB implementation. The Draft Determination suggests that a graduated penalty structure for late delivery would provide the necessary protection for customers. However, we do not accept that this should be additional to the 20.5m penalty proposed in our June 2014 submission for non-delivery in AMP6. As set out in Tables 29 and 30 our proposed penalty provides very strong protection for customers; it is not helpful to customers to provide an additional penalty for late delivery. Household retail outcome B: Offer a choice of easy to use contact options Performance commitment RB1: Implement new online account management for customers supported by web-chat Detailed definition of performance measure: 5.94 The delivery of the new online self-serve channel is measured by ensuring that the go live date is achieved by the end of the relevant financial year (i.e. 31 March). Go Live is defined as the system has been commissioned for the start of a phased roll-out for customers, the system being used to bill customers, update accounts, capture contacts, record payments, and for online account management that Thames Water s customers can sign up for to use the new service. It will also provide the functionality to deliver alternative tariffs. Incentive type: Financial penalty only. Table 28: Performance commitments Unit Starting level Committed performance levels Performance Status Limited Limited Limited New online Online self Online self Commitment online online online self serve serve serve channel channel channel Penalty Status CRMB CRMB CRMB billing collar billing billing system not system system is commissioned does not not live nor on track for go live AMP7 delivery Penalty Status CRMB billing deadband system is not live 96
97 Table 29: Incentive rates Incentive type Performance levels (status) Incentive rate ( /status) Lower Upper Penalty CRM and New online self serve 6.6m (annual discounted Billing system channel introduced in benefit foregone by does not go customers) live in Penalty CRM and Online self serve 6.4m (annual discounted Billing system channel in benefit foregone by is not live in customers) Penalty CRM and CRMB billing system 7.5m (total AMP6 allowed Billing system does not go live in cost in ACTS adjustment not AMP6 plus premium, less the commissioned amount already returned to or on track for customers through AMP7 delivery penalties in and ) Table 30: Additional details Necessary detail on measurement units Frequency of PC measurement and any use of averaging Timing and frequency of rewards/penalties Form of reward/penalty Any other information or clarifications relevant to correct application of incentive The measurement unit is the delivery of the new online selfserve channel. Delivery is measured by the go live date being achieved by the end of the relevant financial year (i.e. 31 March). Performance commitment reported at end of each financial year and reviewed through independent assurance process. Penalties will be calculated at PR19, to be applied in AMP7 Adjustment to revenue This commitment is fully enabled by the system and has a commitment to go live as being by the end of Go Live would be defined as the system has been commissioned for the start of a phased roll-out for customers, the system being used to bill customers, update accounts, capture contacts, record payments, and for online account management that Thames Water s customers can sign up for to use the new service. It will also provide the functionality to deliver alternative tariffs. 97
98 The ODI penalty would be up to a maximum of the allowed AMP6 cost (depreciation charge net of opex savings, which is equal to 18.6m) plus a 10% premium to ensure that Thames Water has an incentive to deliver the system, resulting in a maximum penalty of 20.5m. The ODI penalty relates to whether: i) the system goes live at the target date of ; ii) the system goes live by the end of AMP6; and, if not iii) whether this is due to causes within reasonable management control. The plan will be to roll-out the system to all customers, with go live being the start of this phased roll-out to customers. Reasonable management control will depend on the specific circumstances, but the test is whether the issue could have been foreseen and/or efficiently mitigated by a prudent company. The ODI therefore works as follows under four possible outcomes: 1. The system goes live in AMP6 (i.e. by 31 March 2020), but later than the target date of 31 March 2018 ODI penalty equal to the discounted benefits foregone, for each year in which the go live of the system is delayed 2. The system goes live in AMP6 but to a lower specification than planned (e.g. limited functionality, or the plan is to roll out the system to only a subset of customers) ODI penalty in and equal to the discounted benefits foregone due to late delivery, plus an ODI penalty to return appropriate portion of allowed AMP6 cost (plus 10% premium) net of penalties already incurred in and Penalty is calculated by Thames Water and verified by an independent third party, in line with approach to independent assurance for all ODIs 3. The system does not go live in AMP6, due to unforeseen reasons outside reasonable management control (e.g. legislative or market changes, significant contractual dispute), but Thames Water can demonstrate mitigating actions and is on track for full 98
99 system roll out in AMP7 ODI penalty in and equal to the discounted benefits foregone due to late delivery. It will be necessary to ensure AMP7 funding to deliver the system does not double-count AMP6 funding (net of amount already returned to customers through penalties in and ). This is subject to third party verifications and assurance, in line with approach to independent assurance for all ODIs 4. The system does not go live in AMP6, where: (i) this is due to reasons within reasonable management control; or (ii) Thames Water is not on track for full system roll out in AMP7 ODI penalty in and equal to the discounted benefits foregone due to late delivery plus an ODI penalty of 7.5m (i.e. equal to allowed AMP6 depreciation net of opex savings plus 10% premium, less amount already returned to customers through penalties in and ). This is subject to third party verifications and assurance, in line with approach to independent assurance for all ODIs Performance and the financial ODI will be assured independently; Thames Water will report performance in a transparent manner to its customers, stakeholders and Customer Group. Thames Water will publish progress against this performance commitment on an annual basis, providing transparency to customers and ensuring incentives for the company remain current. 99
100 Section 6 Retail Non Household A Introduction In this section we provide an overview of our response to Ofwat s Draft Determination with respect to the Retail Non-Household business. There are many areas of the Draft Determination that we can accept. For example, we support Ofwat s proposed update to the calculation of costs associated with the defined benefit pension scheme and the application of a net margin. We note, however, that in a number of areas, the approach set out in the Draft Determination is unlikely to be in the interests of customers. Our main areas of concern relate to Ofwat s proposed adjustments to our costs for a new Customer Relationship Management and Billing system, market opening costs and the price base. The remainder of this chapter is structured as follows: Section B sets out our views and, where relevant, additional evidence related to Ofwat s assessment of our cost proposals for calculating default tariffs; Section C provides our response to Ofwat s request for us to consider whether five years is an appropriate length of control for the non-household market; and Section D summarises the key points arising from the consultation we have been able to carry out with customers in relation to the structure of tariffs. 6.3 Further information and evidence related to the response of the Retail Non-Household business is provided in Appendix E. B 6.4 Calculating default tariffs In the Draft Determination, Ofwat adjusted our proposed costs from 116m to 96m stating that we had failed to provide sufficient evidence for certain costs which have consequently been disallowed. This section outlines our position in relation to these costs and provides additional information to support their inclusion in our Retail Non-Household allowance. Specifically we propose that Ofwat should reconsider its position on the following costs: those relating to the creation of a new dedicated Retail Non-Household CRM and Billing system; base capex for AMP6; and market opening and central market costs. 6.5 This section also includes our views on Ofwat s proposed use of the 2012/13 price base and the impact of input price pressure. 100
101 Costs of a dedicated CRM and billing system The Draft Determination states that there is insufficient evidence on the need, costs or benefits for a new Customer Relationship Management and Billing system for Non-Household customers.. [and] no clear explanation of how the value of this investment was derived. 148 Our response to this assessment including further evidence in support of our proposals is set out below. Appendix E Annex RNHH01 provides a full explanation of the reasons why the new systems are critical to our operations. In summary, implementing new CRM and billing systems are in the best interests of our customers and are needed to ensure compliance as a provider of last resort. Market compliance will drive additional activity and cost in retail businesses through process changes and system integration with the Market Operator High Volume Interface (HVI). This will challenge and stress our current systems beyond their capability. Importantly, the new system is required to minimise the risk of a system failure. The risk of failure of our current system is growing. If a major failure occurs the impact will be significant, affecting our customers and the business from both a financial and reputational perspective. The new system will also provide a number of significant benefits for customers including: full online account management; enabling cultural change to deliver what our customers expect; integration with smart metering, providing accurate and frequent consumption information and alerts as this technology penetrates the customer base; choice of different tariffs and billing frequencies. Examples include online tariff and for metered customers' tariffs that support water consumption reduction and therefore charges; improved right first time is enabled by a single view of the customer which provides our teams with easy-to-access information and history; and improved credit management which aims to reduce the doubtful debt for nonhousehold customers by 22% from 38m in AMP5 to 30m in AMP As a result of the implementation of the new system, we expect to see improved customer satisfaction evidenced by lower complaints by the end of AMP6, providing a foundation for achieving top-quartile performance in AMP7. We are confident that our cost assessment is robust because we have undertaken a detailed analysis of the options available, with the support of relevant independent IT experts. We have market tested the costs through a competitive process for CRM and Billing tools and we have carried out a thorough cost benefit analysis of the various options. In addition, we have sought and considered the views of our customers to ensure that our preferred option is consistent with their preferences. Through this process we have been able to reduce the capex requirements to 17.69m from our June Business plan submission estimate of 20.5m. We have already committed to spend 148 Draft Determination, Thames Water company-specific appendix, page
102 in the region of 1.5m in AMP5 on the CRM and Billing systems in the procurement process and early design phase. Therefore we would seek funding for the remaining capex spend in AMP6 of 16.19m. We consider that the proposed investment meets the new cost assessment criteria set out by Ofwat because: the system can be installed and ready for testing with the market operator by October 2016, in order to meet the deadline for market opening in April 2017, a timetable dictated by the regulatory regime. Without meeting this need, there is a significant risk we will fail to be ready for market opening and will therefore be non-compliant; and the system will meet the needs of customers identified through our customer engagement programme that cannot currently be delivered by the existing systems. The additional functionality will include but is not limited to: integration with smart metering; full online account management; proactive communication through customers channel of choice; the ability to issue credit notes; enhanced credit management; and consolidated billing We understand that certain incumbent water retailers have already implemented new systems and therefore have the costs built into the base AMP5 RCV. Under Ofwat s approach to calculating default tariffs for non-household businesses, these retailers will be able to include the depreciation charge associated with this investment in the cost to serve allowance. Not allowing Thames Water to recover such costs in AMP6 will place our business at a disadvantage, to the detriment of customers. We do not believe it is the intention of Ofwat to create this inequality and would welcome approval of the costs based on this new evidence to ensure a more equitable playing field in the Non-Household market. To further illustrate this point, we have provided a simple comparison of the costs to serve for the non-household market for two similar sized companies after adjusting for customer numbers as set out in Table 33. Table 33: Comparison of Costs to Serve for three Non-household retailers, prices A. Draft Determination Costs to serve over AMP6 ( m) B. Total retail non-household customers (number) C. Customer base as % of total nonhousehold market (%) D. Allowed Costs to serve per customer over AMP6 ( ) Severn Trent ,800 16% 437 United Utilities ,100 14% 648 Thames Water ,900 20% 323 Source: Thames Water analysis, based on a) Ofwat s draft determinations for Severn Trent, United Utilities and Thames Water, b) company Annual return data and c) July 2014 Consultation on Ofwat s section 13 proposal to modify the licences of appointees in England and Wales condition R1, p Column A shows the total cost to serve included in the draft determination, Column B shows the number of non-household customers for each company. Column C shows the current share of the total non-household market for each company. Column D shows allowed cost to 102
103 serve per customer over AMP6. The table shows that United Utilities was allowed 118m for serving 14% of the NHH customer base and Severn Trent 87m for serving 16%. We have been allowed 96m to serve 20% of the NHH customer base. These other two companies, therefore, have a much higher allowed cost to serve per customer in their default tariffs Within that context, our response provides the additional evidence in support of our new billing system that is required to meet the needs of our customers and the competitive market and we recommend that these costs should be included in the default tariff. Base capex costs for AMP The detailed assessment that we have undertaken of the IS business architecture to inform the specifications for the new CRM and Billing systems has facilitated a full and detailed review of the base IT capex requirement. This has led to a reduction in the base IT capex costs for AMP6 from 5.7m to 0.59m as detailed in Appendix E Annex RNHH04. Therefore, our revised proposal is to reduce the overall capex investment for base IT including new CRMB systems in AMP6 from 26.2m in our June 2014 business plan Submission to 16.78m. Market Opening costs and central market costs The Draft Determination states that sufficient evidence has not been provided for the costs associated with the central market costs and additional activity for market opening. 149 We have therefore provided more detail in Appendix E Annex RNHH02. In its recent consultation 150 document published in July 2014, Ofwat detailed the annual costs of implementation of Open Water and the market operator. The expected contribution of Thames Water in AMP6 to these costs is 7.88m (taking the mid-case of each estimated annual total in the Ofwat consultation). The Open Water governance work stream recently determined that the costs will be split 50/50 between Retail and Wholesale. 151 This information was not available at the time of our June Business Plan Submission. We have therefore revised our central market costs for AMP6 down from 4.6m to 3.95m to reflect these developments. We have also provided details of our internal company-specific costs for additional activity preparing for market opening which we have revised down from 4.0m to 3.89m. These are in addition to the Open Water and market operator costs ( central market costs ) detailed above. Therefore, based on the additional information provided in this representation we would welcome a decision by Ofwat to include these costs in our default tariffs for AMP6, which in total have been revised down from 8.6m to 7.84m Draft Determination company-specific appendix, page 59. Consultation on Ofwat s section 13 proposal to modify the licences of appointees in England and Wales- condition R1 Consultation on Ofwat s section 13 proposal to modify the licences of appointees in England and Wales condition R1, page
104 Price Base 6.23 There is currently a difference between Thames Water and Ofwat over the appropriate application of Ofwat guidance in respect of the correct price base to use, and in fact whether a price base should be considered at all. Specifically we seek to show how Ofwat guidance has been applied in arriving at the operating expenditure numbers submitted in Retail Non- Household Data Table R4 as part of our June 2014 Business Plan Submission. In determining our methodology we have carried out a careful review of Ofwat guidance and held in-depth discussions with our assurance provider. Two guiding principles are: 1) the costs to serve will be calculated using the year 2013/14 data; and 2) RPI indexation is not appropriate for the Retail Non-Household business These principles suggest to us that operating expenditure used to calculate the default tariff should be operating expenditure in nominal prices with no adjustment for inflation. On that basis, we propose that Ofwat should accept our original operating expenditure figures submitted in Data Table R4 of the June PR14 Business Plan. The implications of Ofwat s deflation adjustment are summarised in the table below. Table 31: Impact of Ofwat adjustment to Data Table R4 Expenditure Total Total opex (excluding exceptional items) - submitted in June 2014, m at price base Revised - deflated in line with Ofwat adj. m 12/13 prices Variance to Draft Determination (0.6) (0.6) (0.6) (0.6) (0.6) (3.0) Source: Data Tables, June 2014 Submission to Ofwat (Final Data Tables Workbook - PR14 June 2014 Submission BAU Including TTT.xlsm) Tables R4 and A We invite Ofwat to reconsider the application of its guidance in relation to RPI for Retail, aligning the forward looking methodology applied to AMP6 operating expenditure with the determination of the opening position. The impact of Ofwat accepting our representation will be to increase operating expenditure for Retail Non-household by 3m. Allocation of costs 6.27 In the Retail Household section of the Draft Determination Ofwat has identified a number of issues regarding our allocation of costs (which also affect Retail Non Household) and has listed a number of actions that it requires us to address. These are considered in Section
105 C Duration of price control Ofwat has asked for feedback on the duration of the Retail Non Household price control, specifically on whether or not it is appropriate to set default tariffs for a five-year period. To ensure our proposals reflect the views of customers, we have conducted additional customer engagement. Through qualitative deliberative-style research, consisting of focus groups and in-depth interviews with a broad spectrum of different types of Non Household customer, we explored views on these issues. We chose this approach because of the limited time available in which to conduct the research and relatively complex subject matter, which required in-depth explanation. There are benefits for customers from certainty on the pricing structure and this will be provided by a five-year default tariff term. Our customer research (ref Appendix E, Annex RNHH03) indicates that some support for the five-year term extends across small, medium and large consumers of our water and wastewater services. We have shared and discussed the customer research with our CCG. Whilst customers currently generally support a five year price control, there is an argument that customers would secure greater benefits from the ability to have Ofwat review default tariffs in advance of, or after the first year of market opening. We would be supportive, therefore, of such an approach if Ofwat were to adopt it. D Customer feedback on structure of tariffs Ofwat has requested that companies provide evidence that there is customer support for the structure of the proposed average revenue controls and associated default tariffs. We have consistently maintained a customer focused approach to developing our business plan. In line with this, we have continued to engage with our Non Household customers (including focus groups and one-to-one interviews) and the CCG since the Draft Determination, on various issues, including the structure of tariffs. In general, there was a certain element of surprise among customers about how much of the customer bill was made up of wholesale costs. The majority of customers did not have any issue with the proposed margin levels of 2.5%. The subject of allocation of debt costs was contentious. Customers of all sizes were unhappy about the principle of paying for the bad debt incurred by others. But while larger customers were broadly supportive of the proposed allocation of bad debt, smaller customers felt they would be unfairly penalised. Faced with these divergent, and apparently irreconcilable views, we revisited the original assumptions around our debt allocation, and we have decided that we stand by those assumptions in the absence of conclusive evidence in support of a different approach. In summary, there is overall agreement among customers with the principle of paying for the services that customers use and a tariff structured around consumption bands is considered to be fair and reasonable. 105
106 106
107 Section 7 Appointed Business A 7.1 Introduction In this section we provide an overview of our representations in respect of the appointed business. These include representations on: risk and reward in particular the impact of Ofwat s interventions on the ODI RORE, the two per cent RORE cap on ODIs and the cost of capital; affordability covering our comments on PAYG rates; and AMP6 Reporting. Further evidence supporting our comments on the cost of capital is included in DDSE60. B Risk & Reward The return on regulatory equity (RORE) is the measure selected by Ofwat to assess the risk around the business plan. It represents the return due to shareholders divided by the equity component of RCV assumed in the notional capital structure, and aims to show the possible range of returns earned by shareholders against the assumed cost of equity. In the preparation of our June 2014 Submission we undertook dedicated customer research to inform the development of our performance commitment and ODI package. As part of this research 152 we explicitly tested customers preferences for the RORE impact of ODIs (expressed in terms of variability in customer bills). As stated in the Draft Determination (page 71), our customer research established that most customers were shown to support a bill range linked to ODI performance of ±1.5% RORE. As part of its approach to testing whether companies have put forward an appropriate balance of risk and reward, Ofwat has calculated the RORE impact of the ODI package in each company s business plan. 153 We comment below on two particular aspects of Ofwat s approach that we do not believe are in the best interests of customers, namely the impact of Ofwat s interventions on the ODI RORE range and the proposed 2% RORE cap and collar to be applied to the ODI impact TJ045 Customer research to inform and support revised Outcome Delivery Incentives, Eftec/ICS, June For example, in its Risk Assessment Tool (RAT) and Draft Determination notice: company-specific appendix Thames Water, Figure A7.1, pg
108 Impact of Ofwat interventions on RORE range As we noted above, the ODIs we proposed in our June submission were calibrated to provide a RORE range commensurate with that selected by our customers. In the Draft Determination, Ofwat has made a number of interventions to our package of performance commitments and ODIs that have a material impact on the scale of financial ODI rewards and penalties. The interventions change the incentive package from being one that is largely symmetrical to one that is materially asymmetrical and where the P50 position is non-zero, as can be seen in Figure 5 below. This means that Ofwat s calculation of an overall P50 position with no ODI penalty is materially incorrect, with this error cascading to all the calculations of RORE and all of Ofwat s calculated credit metrics. As set out elsewhere in this response, we support Ofwat s interventions where these are proportionate and incentivise the right behaviour for our customers. The package that results from this subset of interventions yields a RORE impact of -1.8% to +0.99%. 154 This range, shown in Figure 5 below as our response, is more consistent with our customers preferences than the range implied by the sum of all the interventions in the Draft Determination. These RORE ranges are illustrated in Figure 5 below. Figure 5: RORE ranges to represent revised deadbands Source: Thames Water calculations of RORE impact calculated assuming a zero per cent tax rate based on Draft Determination and customer research by ICS/Eftec. 7.9 It can be seen from the figure above that the potential RORE range associated with the revised package of performance commitments and ODIs, as set out earlier in this document, 154 Some of the difference in RORE range between our June submission and this revised package (c.0.1 pp.) is attributable to differences in AMP6 RCV contained in Ofwat s Draft Determination. 108
109 is more consistent with our customers preferences than those in the Draft Determination. To be consistent with the preferences expressed by our customers, Ofwat should, therefore, accept this package in its Final Determination. 2% RORE cap on ODIs In our June 2014 Submission we proposed a set of performance commitments (PCs) and outcome delivery incentives (ODIs) for the two Wholesale plans. Where we had financial ODIs, we proposed penalty collars and reward caps that limited overall financial exposure. In our calculations of RORE, we assumed a notional capital structure (i.e. 62.5% gearing) and a 0% tax rate. We considered that this tax rate to be appropriate as: our business plan does not expect the notional company to pay any tax in AMP6, so variations would not have a tax impact; and any revenue adjustments made in AMP7 as a result of the AMP6 incentive mechanisms are expected to include an adjustment to AMP7 tax funding to reflect any change in tax generated (in line with the PR14 treatment of AMP5 incentive mechanisms), so there is no tax impact on the return on equity In the Draft Determination, Ofwat has proposed an industry-wide aggregate cap and collar on ODIs of ± 2% of RORE. While there is netting off between years, there is no netting off between rewards and penalties. 155 Ofwat s proposal is for the cap and collar to be applied at the price control level to Wholesale Water, Wholesale Wastewater and Retail Household, 156 but not to the TTT. 157 In its analysis, Ofwat has used a tax rate of 20% to assess the RORE impact across the industry in its Risk Assessment Tool (RAT) including with respect to the ODIs. Our representation on the 2% RORE cap on ODIs 7.14 We support the use of an aggregate cap and collar to provide additional certainty for customers and companies, given the move to performance commitments and ODIs has not yet been tested. For it to be effective in practice, we believe that a number of adjustments to the proposals are required. We set these out below. First, as noted above, our dedicated customer research on ODIs showed that our customers supported ODIs with impacts in the range of ±1.0% to 1.5% RORE, 158 assuming zero tax impacts. To align with the views of our customers, therefore, the aggregate cap and collar should be applied at ±1.5% RORE. Second, in Technical Appendix A2, (page 41) Ofwat states that the TTT is excluded from the cap as the ODI (associated with performance commitment T1C) will not be assessed within the period. As we understand it, this premise is not correct and the ODI will be assessed within the period (as shown in our company Further details are provided in DD technical appendix A2 outcomes, pages We do not understand how the RORE cap will apply to household without any RCV. DD technical appendix A2 outcomes, page 41. TJ045 Customer research to inform and support revised Outcome Delivery Incentives, Eftec/ICS, June
110 specific technical appendix, page 193). The aggregate cap and collar should, therefore, apply equally to the TTT price control. 159 Third, the RORE calculation should be based on notional gearing (to avoid movements in actual gearing changing the level of the cap/collar). Fourth, the aggregate cap and collar should be monitored on an annual basis to provide transparency to customers and stakeholders on the operation of the performance commitments and ODIs. Fifth, whether or not a company pays corporation tax, it is not correct to apply a tax adjustment to the ODI impact as notional tax is fully funded at PR19, as can be seen from the table below. Table 32: Illustration of impact of tax on ODIs on RORE calculation Before ODI penalties Company A (pays notional tax) Company B (pays no notional tax) Allowed costs before return on equity and tax Allowed return on equity Allowed tax Allowed revenue Return to equity Equity RCV RORE 6.0% 6.0% Both companies incur ODI penalties of 84 Allowed costs before return on equity and tax Allowed return on equity Allowed tax 83 0 ODI penalty Allowed revenue Return to equity Equity RCV RORE 3.5% 3.5% Source: Thames Water calculations. Impact of tax on tax ignored for simplicity. 159 In our TTT response we highlight the overlap between the proposed commitment and the Alliance Agreement, which seek to achieve the same objective. 110
111 The table shows the calculation for Company A (which pays notional tax) and Company B (which pays no notional tax). It can be seen from the table that whether or not a company pays notional tax, the impact of an ODI penalty equivalent to 2.5% of RORE is the same. However, Ofwat applies tax to the ODI penalties in assessing the RORE impact for the purposes of applying the ODI cap. In doing so it is understating the size of the overall impact. For example, if tax is applied to the 84m penalty in the example above, the resulting ODI RORE impact is understated as 2.0%. 160 As such the cap will not apply despite an actual ODI impact of 2.5% of RORE being incurred. If Ofwat continues to apply tax to the ODI impacts in assessing the cap, the effect will be to increase the potential exposure to ±2.5 per cent of RORE. Cost of capital 7.17 In our June 2014 Submission, we stated that our overall view of the allowed return was that on a standalone basis it was too low and could be expected, over time, to have an adverse effect on the attractiveness of the industry for investors and put long-term investment at risk. 161 In particular, we highlighted: the unique additional risk that the TTT places on us and its impact on our credit rating; the squeeze to the retail margins arising from indexation of the wholesale controls; 162 that the asset beta at 0.3 appears low in comparison to the value used by Competition Commission (CC) in the Northern Ireland Electricity (NIE) determination, using the same historical data source; the increase in the expected RORE range (arising in part from a wider ODI range), in accordance with Ofwat s risk and reward guidance, which is likely to lead to an increase in observed betas over historical levels; changes in our proposed uncertainty mechanisms to reflect Ofwat guidance, which has increased our exposure; the assessment of the risk-free rate and overall market returns have been affected by views of low growth rates, although we note that the Governor of the Bank of England has signalled that growth is returning to normal levels ; 163 and that Ofwat understates the forward-looking cost of debt In its draft price control determination notice, Ofwat has stated that it will review the cost of capital in our Final Determination to take account of market and regulatory developments A post-tax ODI penalty of 67m (assuming a notional tax rate of 20%) implies a return to equity of 133m ( 200m allowed return on equity less 67m post-tax ODI penalty) and RORE impact of 2.0% Our adoption of Ofwat s assessment of the appropriate allowed return in our June submission was on the basis of accepting all of Ofwat s guidance and methodologies in the round. Since Ofwat has changed its methodologies in a number of material respects, our adoption of Ofwat s allowed return is no longer valid. Indexation of the wholesale controls will increase customer bills in nominal prices, which will result in increases to bad debts and collection commission costs. As the retail income will be fixed in nominal prices, this increase in costs will result in retail margins below one per cent. Consequently, the adjustment of the appointed business WACC for the retail margin will be over-stated. Inflation Report May 2014, opening remarks by the Governor. 111
112 In Technical Appendix A6 risk and reward, Ofwat sets out more detail on its view of the relevant market and regulatory developments and states that Both regulatory developments and market evidence on the cost of debt suggests that the allowed cost of capital has fallen since our January guidance In its risk and reward guidance published in January 2014, Ofwat took a wide spectrum of information into account in reaching its conclusion that 3.85 per cent was an appropriate allowed return for the appointed business. In any update, it should continue to consider that full spectrum of information including changes introduced in the Draft Determination which increase risk - for example, its interventions on the horizontal audits. Setting the regulatory cost of capital for any price control requires a degree of judgment, but in the current abnormal economic circumstances, the scope for adverse effects arising from this judgement is heightened. Markets remain volatile, and the risk of interpreting the situation at any given date as though it were stable should not be ignored. Ofwat should therefore be cautious in inferring from any short-term changes in the inputs to the cost of capital calculation, that any changes to the overall cost of capital are required. Further, as the economy continues to recover, the effect of the unwinding of the current unconventional monetary policy tools adds an additional layer of complexity to estimating the parameters of a cost of capital calculation that will apply for the next five years. The consequences, given the current, low cost of capital, are that the probability distribution of forward movements in the cost of capital is asymmetric i.e. it is more heavily skewed towards increases. These basic points inform our comments below in relation to the three areas identified by Ofwat for review: inflation (where recent developments in market expectations do not support any revision to Ofwat s assumptions); the cost of equity (where Ofwat s rate is materially lower than other recent regulatory determinations); and the cost of debt (where recent short-term reductions appear to be consistent with normal volatility rather than indicating any long-term decline) In addition, we provide comments on the impact of the TTT. Inflation 7.24 RPI inflation declined during August 2014 and is currently 2.4% 166 (which is below Ofwat s current assumption). Our view, supported by our advisors analysis, of inflation expectations suggests that there has been little change in future expectations since January 2014 (when the Risk and Reward Guidance was published). If anything, inflation expectations have lowered slightly since January. Recent developments in market expectations do not therefore support a revision to Ofwat s inflation assumption Draft price control determination notice, August 2014, p29. Draft price control determination: technical appendix A6 risk and reward, p13. ONS, August
113 7.25 The fact that Ofwat s inflation assumption is currently lower than those used in other recent regulatory decisions does not support a revision. The figures used by the CC, and by Ofgem, ought properly to be considered in the round. For example, Ofwat s cost of equity assessment, as described below, is already materially lower than those set out in both the ED1 Draft Determination and the NIE Final Determination. It would be wrong to accept either as precedent for one parameter but not another. Cost of equity 7.26 In the Draft Determination, Appendix A6, Ofwat compares its cost of equity assessment to the NIE Final Determination 167 and the ED1 Draft Determination. 168 Table 33 below expands on this comparison by including: (i) the NIE Final Determination, but assuming a gearing that is consistent with Ofwat s notional gearing assumption; (ii) the NI Water Draft Determination (also re-geared to be consistent with Ofwat s assumptions); and (iii) the implied nominal cost of equity, taking into account the corresponding inflation assumptions. Table 33: Summary of regulatory cost of equity assessments Ofwat DD14 NIE Final Determination (re-geared) ED1 Draft Determination NI Water Draft Determination (re-geared) Gearing 62.5% 62.5% 65.0% 62.5% Total equity market return 6.75% 6.50% 6.50% 6.5% Risk free rate 1.25% 1.50% 1.50% 1.5% EMRP 5.50% 5.00% 5.00% 5.00% Asset beta Debt beta Equity beta Cost of equity (real) 5.65% 6.4% 6.0% 6.95% Inflation 2.80% 3.25% 3.0% 3.59% Cost of equity (nominal) 8.6% 9.9% 9.2% 10.8% Source: FTI Analysis. Notes: The CC did not provide a point estimate for each of the individual inputs to the cost of equity estimate. For the purpose of this table some of the point estimates have been inferred from the CC s overall WACC calculation Competition Commission (March 2014) NIE Final Determination. Ofgem (July 2014) RIIO-ED1, Draft Determination. 113
114 Table 33 above shows that Ofwat s current assessment of the cost of equity is materially lower than the equivalent rebased figures in the recent determinations from the CC and Ofgem. This is predominantly due to differences in the assessment of the asset beta and the risk free rate, but partially offset by Ofwat s higher total equity market return assumption. Table 34 below compares Ofwat s equity beta calculation to the equity beta calculations in the NIE Final Determination (after adjusting the gearing assumption) and the ED1 Draft Determination and the NI Water draft determination (after adjusting the gearing assumption). Table 34: Asset and equity betas regulatory precedent Ofwat DD14 NIE Final Determination (re-geared) ED1 Draft Determination NI Water Draft Determination (re-geared) Gearing 62.5% 62.5% 65.0% 62.5% Asset beta Debt beta Equity beta Source: Setting the Cost of Capital for PR14, FTI Report, DDSE Table 35 above suggests that Ofwat s asset beta assumption of 0.30 may be too low and significantly lower than the asset betas assumed by the CC (0.40) and Ofgem (0.38). It is also significantly lower than that assumed for PR09 (0.40). As a result, Ofwat s equity beta (0.80) is significantly lower than the recent regulatory decisions of the CC (0.98 after re-gearing) and Ofgem (0.90). Cost of debt 7.30 The table below shows a comparison of Ofwat s cost of debt assessment and the cost of debt findings in the NIE Final Determination and the ED1 Draft Determination. We have included the implied nominal cost of debt, taking into account the corresponding inflation assumptions. Table 35: Summary of regulatory cost of debt assessments Ofwat DD14 NIE Final Determination ED1 Draft Determination Ratio of embedded:new debt 75:25 90:10 - Cost of new debt (real) 2.65% 2.14% 2.40% Cost of embedded debt (real) 2.65% 3.20% 2.40% Allowance for debt fees 0.10% n/a 0.20% Cost of debt (real) 2.75% 3.1% 2.60% Inflation 2.80% 3.25% 3.0% Cost of debt (nominal) 5.6% 6.4% 5.7% Source: Setting the Cost of Capital for PR14, FTI Report, DDSE60 114
115 Table 35 above shows that Ofwat s cost of debt assumptions are broadly consistent with the ED1 Draft Determination. The NIE Final Determination is less relevant as a comparator as it takes into account NIE s higher actual cost of debt. Although the iboxx indices have declined in recent months, we caution against placing too much emphasis on short-term market movements in the context of a five-year price control. The iboxx A and BBB corporate bond indices are inherently volatile and have oscillated around similar levels for the past three years within a band of approximately 100 BPS. The index is currently near the bottom of this band. We do not believe that it can be said, with any robustness, that rates have declined, rather than simply having moved in a way which is consistent with recent volatility. In addition, Ofwat assumed in its risk and reward guidance that only around 50% of any increase in gilts would translate into increases in corporate bond yields. Analysis from our advisors suggests the correlation is closer to 70%. This suggests that the cost of new debt in Ofwat s risk and reward guidance understates the likely cost of corporate debt. TTT risks The TTT is a large and complex project - currently expected to cost around 4.2 billion. It needs to be delivered by a third party infrastructure provider ( IP ) to separate the associated risks and costs of financing and delivering such projects within a distinct infrastructure provider. 169 Whilst an IP insulates us from many of the incremental risks, we are not fully insulated from all these risks, because we are (and will continue to be) involved and our total investment to deliver the parts of the project where we retain full responsibility will amount to 1.5 billion. Rating agencies consider our risk profile to be higher than the rest of the industry as a consequence of the TTT project. Moody s now require a higher AICR 170 ratio than the industry norm due to the uncertainties around the TTT and more recently Standard & Poor s have placed us on negative outlook with one contributory element being that S&P view the expenditure associated with Thames Water's financing of the Thames TTT Tunnel (TTT) expenses as increasing the level of uncertainty. 171 Overall assessment of the cost of capital 7.38 Any change to Ofwat s cost of capital estimation needs to be considered in light of: (i) the water companies original business plans; (ii) the original conclusions from the Risk and Reward Guidance (updated to reflect the increased risk in the ODI framework following Ofwat s horizontal checks as set out in the draft determination); (iii) the impact in our case of the TTT; and (iv) recent regulatory precedent. That precedent, however, needs to be considered in the context of all elements of the cost of capital. Figure 6 below compares Ofwat s current assessment of the cost of debt and the cost of equity to recent regulatory Ofwat, Criteria for selecting specified infrastructure projects a consultation on draft guidance, October 2013, page 5. Adjusted interest cover ratio. How Does OFWAT's Latest Price Review Affect The U.K.'s Water Companies?, 16 September
116 precedent and the original water company business plan submissions. In order to make the figures comparable, they are shown in nominal prices using the relevant inflation assumptions implicit in the various sources. Figure 6: Comparison of Ofwat s current estimate of the cost of capital, regulatory precedent and water company submissions 12.00% 11.00% 10.00% 9.00% 8.00% 7.00% 6.00% Water company submissions Ofwat NIE Final Determination (re-geared) ED1 Draft Determination NI Water Draft Determination (re-geared) 5.00% 4.00% Cost of debt (nominal) Cost of equity (nominal) Source: Thames Water financial model Figure 6 above shows that, while Ofwat s assessment of the cost of debt is within the range defined by the water company submissions and recent regulatory precedent, 172 its assessment of the cost of equity is not. In real terms, given Ofwat s lower inflationary expectations, Ofwat s assumptions would be within, but towards the bottom of, the equivalent range. Further evidence in support of the above points is included within supporting evidence DDSE60. C Affordability PAYG In the Draft Determination Ofwat concluded that it did...not intend to intervene on PAYG. 173 However, it also stated that The Company will need to consider the implications of our wholesale cost interventions for its choice of PAYG and RCV run-off rates in its responses to the Draft Determination.... Ofwat s interventions have had the impact of reducing allowed revenue from our June 2014 Submission by 500 million, which results in a bill profile that our customers have previously The NIE Final Determination is based on NIE s actual cost of debt and so is less comparable to Ofwat s and Ofgem s assessments Draft Determination Thames Water Company specific appendix, page
117 indicated is not in line with their preferences, namely a reducing profile in AMP6 followed by a sharp rise in AMP In our June 2014 Submission, 174 we set out the results of our customer engagement on bill profile preferences, both within the AMP and over the longer term. Customers strongly preferred a bill profile that offered them the smoothest series of bill increases in the longer term up to , looking for a smooth and stable bill with no rapid spikes in their bill year-on-year. Customers strongly rejected a bill profile that pushed back bill increases into 175, 176 AMP7, despite the fact that this option offered a flat bill until Our customers views are very important to us and whilst our previous research provides evidence that customers would support revenue re-profiling to ensure a smoother price increase through to the end of AMP7, we have sought to engage customers specifically upon this issue by conducting additional customer research. To ensure we gained robust and up-to -date evidence around customer preferences we have undertaken both quantitative and qualitative research. In order to achieve a smooth bill profile based on the Draft Determination,, there would be a need to bring forward 250m revenue into AMP6 from future periods. Thus, without prejudice to the company s position as set out in this representation we undertook the customer engagement on this basis. Customers express preference for smooth bills Quantitative research We conducted an online survey among 1,017 of our customers. Sample quota controls were set to ensure a representative sample of our customers. Quotas were set on age, gender and social grade, as well as ensuring combined and waste-only customers were represented in the research. 177 Respondents were shown two separate information screens. After each screen, they were asked to state a preference in a follow up-question. In each screen the respondent was shown two billing scenarios over the next 10 years Scenario 1 (a fluctuating bill) and Scenario 2 (a smooth bill). The results were as follows: 77% preferred the smooth bill rise scenario based on the basic description. The main reasons for preferring this scenario focused on the nature of the gradual increase, being spread over time, as well as for budgeting reasons and affordability; and Appendix 4. Most customers believe that Thames water provides an affordable service, however, they don t want to see significant increases in bills. If bills are to increase over the next few years to pay for keeping services functioning well, these bills should increase gradually. Office for Public Management, What customers are telling us. Review of PR14 customer engagement and research studies for Thames Water, page 10, July Revenue Allocation Research, an Opinion Leader report for Thames Water, May Thames Water billing scenarios, 19 September 2014 Final, DDSE
118 61% preferred the smooth bill increase when it was explained with additional financial information. This information clearly demonstrated that smoothing involves customers paying more upfront (though the same amount overall). The main reasons for preferring Scenario 2 the smooth bill increase were focused on the benefits of a steady/gradual increase, followed by the need for less borrowing The smooth bill rise (before provision of the additional information) remains the preferred billing option for both the initial case and also when further financial information is provided across all main demographic groups including age, gender, social grade and customer type. Customer groups C2, D, and E show the lowest level of preference for the smooth option at 57% when provided additional financial information (although this option is still preferred). For those switching from Scenario 2 (smooth) to Scenario 1 (fluctuating) when provided with the additional information, the main reasons for changing views were due to personal circumstances rather than a rejection of Thames Water asking for more money up front. Qualitative research We examined domestic and business customer views on different bill profiles over AMP6 and AMP7, as well as on the mechanism by which bill profiles might be smoothed, i.e. by moving revenue from AMP7 to AMP Two options were shown to domestic customers: Option 1 showed a fluctuating increase and Option 2 showed a smooth increase. The majority, around three-quarters, chose Option 2 (the smoothed bill profile) at the start of the discussion. Their main reasons for this were that they wanted a stable and predictable bill that made cost increases easy to manage for their household. Those who chose Option 1, around a quarter, did so because they could see the advantage of paying less in the short term, even if that meant a spike in their bill in Most of those who chose Option 1 wanted to keep their water bill as low as possible in the short term due to personal circumstances (because they were studying, had small children, were ill, etc.). Following the initial vote, there was discussion of the full range of services delivered by Thames Water and of Thames Water s sources of revenue and programme of expenditure. Information on each of these was shown to customers and discussed in full, so that they were as informed as was possible within the context of a focus group, about how Thames Water raises and spends money. Although there was a slight shift in preference at the end of these discussions, a clear majority, still around three-quarters, chose Option 2 (smooth bill), despite the fact that they would have to pay more within the first five years of the bill profile. Many were in favour of Thames Water raising revenue from customers, rather than banks and shareholders, as they perceived this would mean the business would not have to make such large interest or dividend payments and would be able to deliver services more cheaply in the long run. There were few differences in preference across the sample, whether by location or age. Customers in every category preferred Option 2 (the smoothed bill profile). 178 Opinion Leader Thames Water Revenue Allocation Final, DDSE
119 For business customers we received a similar response with nine out of ten businesses interviewed preferring Option 2 (the smoothed profile). They cited easy to plan and easy to budget as the main reason for their choice. 179 We have engaged with our CCG in developing the materials used in both the quantitative and qualitative research and have kept them informed of the results of the research at regular intervals. We have received positive responses from the CCG in terms of both the robustness of the research undertaken and the clear approach we have taken to explain the smoothingbills option to the customers. Without knowing the precise outcome of the review, it is not possible to state how much revenue should be deferred or advanced in order to achieve smooth bill profiles. Nonetheless, we can say that if it proved necessary to smooth bill profiles, we would propose, in accordance with our customer research summarised above, that revenue be advanced from AMP7 to provide for a smoother increase to average household bills, while still ensuring that bills do not increase during AMP6 in real terms before the inclusion of TTT charges. PAYG percentage adjustments Our customer engagement, summarised above, shows that, given the expected increases in prices as a result of the TTT, that they would prefer such increases to their bills to be smooth over the longer term. Revenue smoothing can equally be accommodated through a PAYG or RCV run-off rate adjustment; the impact upon customer bills, revenues and the RCV will be the same. We have adopted the PAYG route as this appears to be consistent with wider practice across the industry and it provides the necessary flexibility to enable Ofwat to make further adjustments to our Draft Determination-based proposals to reflect the outcome of interventions at the Final Determination. We set out below our proposals to amend the PAYG percentages in order to bring about a smoother overall increase to prices in line with our customers preferences as a consequence of the outcome of the Draft Determination and how this may need to be adjusted by Ofwat in its application of its Final Determination in December However, we are confident that following our representations, our Final Determination will have a higher level of allowed revenues and there may be no need for any PAYG adjustment. It is important to be clear that we are amending our PAYG percentages primarily to smooth bills over the period, as supported by our customers. Given that company debt is fungible, supporting both the core business and our TTT works, it is equally valid for the additional revenue to be adjusted through the core wholesale or TTTspecific controls. We have therefore assumed below that the adjustments are made through the core business controls (split 50:50 between Wholesale Water and Wastewater) although it would have the same effect if the adjustment was made to the TTT-specific control. In order to smooth average household bill increases arising from the Draft Determination over the medium term, as supported by our customers, the PAYG percentages for each year of AMP6 need to be amended. This increases the PAYG percentages on average across the 179 Thames Water NHH Revenue Allocations Report, Final , DDSE
120 AMP for Wholesale Water by 4.7%, from 57.9% to 62.6%, and for Wholesale Wastewater (excluding the TTT) by 4.3%, from 50.4% to 54.7% The table below summarises the year-on-year PAYG percentages which should apply over the AMP and the additional revenue arising for each Wholesale control, totalling 250m. Table 36: Revised PAYG percentages and revenue impact 2012/13 prices 2015/ / / / /20 Wholesale Water PAYG % - Representation Revenue increase compared to DD ( m) Wholesale Wastewater (excl. TTT) PAYG % - Representation Revenue increase compared to DD ( m) Source: Thames Water financial model The PAYG percentage adjustment required has been calculated to be the level necessary to smooth expected average household bill increases (including the effect of the TTT) across AMP6 and AMP7 in line with our customers preference. The calculation above has been based upon the outcome of the Draft Determination, without taking into account the effect on the Final Determination of our representations or any other interventions by Ofwat, which may further affect the overall revenue allowance. In order to ensure that bill increases remain in line with the final acceptability testing of our June 2014 Submission, Ofwat should adjust the final PAYG percentages included in the Final Determination to ensure that its interventions do not increase non-ttt revenues above that included in our June 2014 Submission (within which bills did not rise in real terms before the TTT) as per the following table: Table 37: PAYG revenues upper reference level m, 2012/13 prices 2015/ / / / /20 Total revenues* excluding the TTT 1, , , , ,970.5 * Wholesale and retail revenues from customers (excluding all TTT IP revenues, Thames Water delivered TTT revenues and TTT-related retail revenues) per our June Plan but stated in line with Ofwat s definition of allowed revenues in the Draft Determination (therefore including capital 180 Using a straight average of the five yearly PAYG percentages as presented by Ofwat in the DD. Note, our June Plan expressed the AMP6 average percentage differently, using total fast money divided by total totex for the AMP. 120
121 contributions for the purposes of defining the reference cap). Source: Thames Water financial model (June 2014 Business Plan, submission case) We would not support the further use of the PAYG mechanisms to advance revenues from AMP7 to offset the impact of any further reduction in allowed revenue in the Final Determination (such as through a WACC reduction) to address the financeability of the notional company for the reasons we have set out below with regarding the application of the financing test. However, and without prejudice to our primary position on the use of advanced revenues set out above, if Ofwat s interventions at the Final Determination reduce revenues below that set out in the Draft Determination, further adjustments to the PAYG percentages should only be made to ensure that the overall average household bill increase (including TTT) remains smooth in line with our customers preferences. The total allowed revenues which arise, following our calculated post-draft Determination PAYG percentage adjustment, described above, should be used as this reference point. Table 38: PAYG revenues lower reference level m, 2012/13 prices 2015/ / / / /20 Wholesale Water Revenue reference level - after PAYG% change Wholesale Wastewater (excluding TTT) Revenue reference level - after PAYG% change Source: Thames Water financial model The relationship between revenues and the PAYG percentage for each service is summarised in the table below, and shows the adjustment Ofwat should make within the Final Determination if revenues are increased or decreased from the lower reference level (per Draft Determination) as set out above. If revenues increase above the upper reference level (per June Plan) then the PAYG percentage should be reduced accordingly by reference to the same adjustment factors, to ensure that average household bills before the TTT do not then increase in real terms. Table 39: PAYG and revenue linkage % Water Wastewater PAYG required to offset 10m change in revenue (in total across the AMP) Source: Thames Water financial analysis. 121
122 In addition to the impacts on Wholesale revenues, there will be an associated increase to Retail revenues as a consequence of applying the Retail margin to the higher Wholesale revenues which arise through an increase to the PAYG percentage. These effects are relatively small (at 1% for Household and 2.5% for Non-Household) and should not adversely affect the overall smoothing of customer bills, so we propose that the effects on Retail revenues are allowed to flow through from the changes to Wholesale revenues without further intervention. The overall impact of adjusting the PAYG percentage as set out above is to smooth average household bill increases across AMP6 and AMP7 whilst still ensuring that average household bills do not increase during AMP6 in real terms before the inclusion of TTT charges. In making this representation, and in calculating the necessary PAYG percentage adjustments, we have sought to ensure, in addition to gaining customer support, that: bills do not rise in real terms before taking into account the TTT; short term and long term financeability is not put at risk; resulting PAYG percentages remain within the industry range; and the effective percentage of the WACC reduction passing to customers during AMP6 remains positive and in line with the rest of the industry We address each of these factors in the following sub-sections. Impact on bills 7.74 The following table sets out the profile of bills following the PAYG percentage adjustment set out in this representation, and compares to that presented for final acceptability testing in our June 2014 Submission. Table 40: Average household bills (excluding the TTT), 2012/13 prices 2014/ / / / / /20 June Submission DD plus PAYG% representation Source: Thames Water financial model and June 2014 Business Plan (submission case) The analysis above is based upon our methodology to calculate average household bills, 182 consistent with our approach in the June 2014 Submission and in customer consultations at that time. It is also consistent with our more recent engagement with customers with regard to post-draft Determination bills and the potential to amend the PAYG percentage Thames Water June 2014 Business Plan Appendix 4, Table A4 1-1 (the submission case ). In its DD Ofwat adopted a different approach to the calculation of average household bills. 122
123 7.76 Following the adjustment to PAYG percentages and associated increase in revenues (by 250m across AMP6) we note that overall average household bills before taking into account the TTT reduce in real terms over the AMP by 8 (2.2%). Impact on financeability It is important to be clear that we are amending our PAYG percentages primarily in order to smooth bills over the period, as supported by our customers. Based on our current understanding, we do not expect that bringing forward revenues into AMP6 would improve the Moody s post-maintenance interest cover ( PMICR ) or gearing ratios on our actual balance sheet as we have received updated, and very clear, statements from our financial advisors and directly from Moody s themselves that Moody s will look through the effects of such timing adjustments when calculating their interest cover ratios (in line with their previous statements). 183 Hence these key ratios in AMP6 and AMP7 should not change as a result of revenues advanced through PAYG. On a notional balance sheet basis, advancement of revenues will improve the adjusted cash interest cover ratio ( ACICR ) in AMP6 by ~0.2x as Ofwat has defined it within its financial modelling, although we note that the application of this ratio in the Draft Determination differs from that set out in its September 2013 Q&A methodology update, 184 which indicated that fast money, rather than opex, should be deducted when calculating funds from operations. If Ofwat adopted its original stated methodology (which is more in line with Moody s approach) in its notional financing tests, then the effect on financeability on a notional balance sheet basis of revenues advanced under PAYG would also be broadly neutral in the short and longer term. We therefore encourage Ofwat to reconsider how it discharges its statutory duty to ensure that companies can finance their functions by adjusting its notional financing test to reflect the realities of how credit quality is assessed by one of the key rating agencies. This will enable maintenance of the trust and confidence, which the markets place on the regulator s financing duty. This underpins the perception of low risk in the sector and from which customers benefit in the form of a low cost of capital. With regard to the definition of ACICR which Ofwat currently applies, the ratio is improved in AMP6 by advancing revenues. Looking further ahead, and mindful that it is difficult to be precise about financial ratios beyond AMP6 (in particular given uncertainties regarding the allowed WACC at that time), the effect of revenue advancement must be to place pressure on ratios in AMP7 and potentially beyond. We would expect, as the real/nominal mismatch between actual and funded allowances unwinds, that this pressure will ultimately also unwind, but that this may happen in later AMP periods, so potentially requiring further adjustments to the PAYG percentages in the meantime. We propose to maintain the cash flow benefit associated with increasing the PAYG percentage by retaining the revenue within the business (and not to increase dividends Special Comment: UK Water Sector - Speed of money cannot address potential financeability concerns, Moody s (May 2013). Reinforced by Moody s in their Industry Outlook: UK Water (23 October 2013) and again in their Special Comment on Water Sector (13 February 2014). Ofwat Preparing business plans for the 2014 price review Q&A, 23 September See question 20, page
124 beyond that set out in our plan and that which may become payable through efficient delivery under the performance incentives applicable in AMP6 under the PR14 methodology). This has the added benefit of improving financial flexibility and strengthens the overall financial position of the company and its resilience to cost shocks. This should serve to protect certain ratios in AMP6 and in AMP7 (and beyond) on a notional balance sheet basis We therefore conclude that bringing forward revenue into AMP6 by increasing the PAYG percentage would not compromise the financeability of the company. The revised PAYG percentages remain within the industry range 7.84 We have adjusted the Wholesale Water and Wastewater (excluding TTT) PAYG percentages to ensure that the revenue impact is spread 50:50 across the two controls. The effect of making these adjustments is set out in the charts below, comparing our revised percentages with the industry, based on our understanding of other water and sewerage company (WASC) Draft Determinations. Figure 7 Water PAYG percentages 80% 75% 70% 65% 60% 55% 50% 45% 40% 35% 30% Source: Thames Water financial model and Ofwat Draft Determination documents. 124
125 Figure 8 Sewerage PAYG (excluding TTT) percentages 60% 55% 50% 45% 40% 35% 30% Source: Thames Water financial model and Ofwat Draft Determination documents Our conclusion is that by making the proposed PAYG percentage adjustments, we would remain within the range of PAYG percentages across the industry. The effective percentage of the WACC reduction passing to customers during AMP6 remains positive and in line with the rest of the industry In its City Briefing on 29 August 2014 Ofwat presented a chart on slide 27 which set out the proportion of WACC reduction (between December and June plans) which each WASC passed to its customers in AMP6. The proportion ranged from 100% (for Thames and South West) to almost -20% for Yorkshire. Adjusting our PAYG% for AMP6 would reduce our percentage to 30% which would remain within the industry range. Confirmation of RCV run-off rates 7.88 We note in Ofwat s DD that it has used the RCV run-off rates included in the data table version of our June 2014 Submission. Whilst we included lower rates in our submission case this was solely due to the assumption we made, within that case, that Ofwat would set totex revenues based on the outcome of its totex cost models. Some deferral of revenue was necessary, in this scenario, to ensure that customer bills did not rise in real terms before the TTT. Since Ofwat has not made a full totex allowance and applied a cap, the need for an adjusted run-off rate falls away. Therefore, it is appropriate for Ofwat to continue apply the unadjusted run-off rates included in our data table case as used by Ofwat in the Draft Determination. D 7.89 AMP6 reporting In Technical Appendix A9 to the Draft Determination, Ofwat set out proposals for three levels of assurance requirements in the price control period related to the monitoring and 125
126 reporting of business plan commitments. Ofwat also stated that there will be a consultation on industry-wide reporting, monitoring and assurance arrangements in the autumn In its Draft Determination Ofwat has commented that it is satisfied with our proposals for selfreporting and will consider our assurance requirements as part of the Final Determination. Ofwat has invited comments on its proposals which are provided below. We support Ofwat s proposed framework and agree that the use of the three categories of assurance (strong assurance, selected assurance and self-assurance) will provide for proportionate reporting. However, both the criteria by which Ofwat will assign companies to each category and the process (or processes) for movement between categories during the price control period need to be objective, clear and published. The assurance framework also needs to provide clarity on the assurance process and requirements for companies in each of the three categories. We will engage positively with Ofwat s consultation in the autumn. Ofwat has indicated that in its consideration of which of the three reporting categories companies will be placed in the Final Determinations, they will consider responses to the letter, issued in August 2014, to a number of companies suggesting that they provide further assurance for elements of their plans as part of their representation on the Draft Determinations. 185 We have responded to this letter in Section 5C. 185 Letter from Sonia Brown to a number of water companies - PR14 June business plan: Concerns regarding quality of data and assurance, August
127 Appendix A Wholesale Water WWT01 WB3:Compliance with drinking water quality standards Ofwat/DWI KPI WWT02 WB5: Average hours lost supply per property served, due to interruptions >4hr WWT03 Asset health (Water) WWT04 ODI deadbands WWT05 Water Infrastructure Shortfall WWT06 AMP5 Service Standard Outputs Resilience (Water) WWT07 Revenue Correction Mechanism Adjustments (Water) WWT08 Ofwat s horizontal checks on ODI 127
128 Appendix B Wholesale Wastewater WWS01 SC9: Reduce the amount of phosphorus entering rivers to help improve aquatic plant life WWS02 SB3: Properties Protected from flooding due to rainfall WWS03 SB4: Number of Internal flooding incidents, excluding those due to overloaded sewers (SFOC) WWS04 SC2: Total category 1-3 pollution incidents from sewage related premises WWS05 Asset health (Wastewater) WWS06 SC7: Modelled reduction in properties affected by odour WWS07 ODI deadbands WWS08 Totex costs Counters Creek and Sewer Flooding Programme WWS09 Business rates (Wastewater) 128
129 WWS10 Open Water costs (Wastewater) WWS11 Wastewater infrastructure shortfall WWS12 AMP5 Service Standard Outputs Energy WWS13 AMP5 Service Standard Outputs Odour WWS14 AMP5 Service Standard Outputs Resilience (Wastewater) WWS15 Other AMP5 logging reductions (Wastewater) WWS16 Revenue Correction Mechanism adjustments (Wastewater) 129
130 Appendix C Thames Tideway Tunnel TTT01 Executive Summary TTT02 Introduction and background TTT03 TTT Price Control TTT04 AMP5 TTT05 Resilience TTT06 Development TTT07 Risk TTT08 Inflation TTT09 Construction TTT10 Land TTT11 Indirect costs 130
131 TTT12 Corporate overheads TTT13 Governance and assurance 131
132 Appendix D Retail Household RHH01 New Costs (CRMB) RHH02 Metering Cost to Serve RHH03 Occupancy Turnover 132

133 Appendix E Retail Non Household RNHH01 CRM and Billing System RNHH02 Additional costs of market opening RNHH03 Customer feedback on structure and term of default tariff RNHH04 Base capex for AMP6 133
Draft price control determination notice: company-specific appendix South West Water
 April 2014 Setting price controls for 2015-20 Draft price control determination notice: company-specific appendix South West Water Contents A1 Overview 2 A2 Wholesale water 6 A3 Wholesale wastewater 21
16 January Totex menu choices. Source: Thames Water menu choices. Shares of totex spend calculated based on Ofwat s menu formula.
 Introduction Following publication of Ofwat s PR14 final determination in December 2014, 1 Thames Water has considered its totex menu choice options. Table 1 below sets out our menu choices and the company
South West Water Business Plan Update Ofwat s Draft Determination
 South West Water Business Plan Update 2015-20 Ofwat s Draft Determination Contents 01 Highlights 02 Executive summary 04 Key revenue building block components Appointee Wholesale Retail Returns 10 Performance
Cover sheet. Introduction
 Cover sheet Introduction These guidance tables support companies in completing the pro-forma for their Business plan presentations to Ofwat Board members and senior leadership that will take place during
Balancing Risk & Reward at PR19
 Balancing Risk & Reward at PR19 A report for United Utilities Water Limited August 2017 EY i Important Notice This Report (Report) was prepared by Ernst & Young LLP for United Utilities Water Limited (UU)
Board assurance of our PR19 business plan resubmission. South Staffs Water (incorporating Cambridge Water)
") Board assurance of our PR19 business plan resubmission South Staffs Water (incorporating Cambridge Water) Board assurance statement The Board considers all the elements add up to a business plan that is
Board assurance of our PR19 business plan resubmission South Staffs Water (incorporating Cambridge Water) Board assurance statement The Board considers all the elements add up to a business plan that is
Investor summary. Our Fast Track Plan
 Investor summary Our Fast Track Plan An introduction from the Chief Executive We re truly delighted Severn Trent has been selected as one of only three Fast Track companies by Ofwat in its assessment of
United Utilities Water Limited PR14 Reconciliation Executive Summary and Overview July 2018
 United Utilities Water Limited PR14 Reconciliation Executive Summary and Overview July 2018 Copyright United Utilities Water Limited 2018 1 Background and purpose of this document During 2018, all Water
UNITED UTILITIES PR19 BUSINESS PLAN SUBMISSION
 United Utilities Group PLC 3 September 2018 UNITED UTILITIES PR19 BUSINESS PLAN SUBMISSION United Utilities Water Limited has today submitted its business plan covering the 2020-25 period. Highlights of
Delivering Water 2020: consultation on PR19 methodology Guidance on business plan data tables
 11 July 2017 Trust in water Delivering Water 2020: consultation on PR19 methodology Guidance on business plan data tables Supporting document to the proposed data tables www.ofwat.gov.uk 1 About this document
South West Water: focused on PR19 Analyst & Investor Presentation. 15 September 2017
 South West Water: focused on PR19 Analyst & Investor Presentation 15 September 2017 Agenda Delivering our strategy PR19 methodology reflections Our WaterFuture vision to 2050 Conclusions and Q&A Close
Financial resilience analysis
 Appendix 13g: Financial resilience analysis Contents Objective 3 Method 3 Reverse stress testing 3 a. Method 3 b. Results 4 Forward stress testing 7 a. Method 7 b. Results 7 c. Summary 9 Scenarios prescribed
Board assurance of our PR19 business plan. South Staffs Water (incorporating Cambridge Water)
") Board assurance of our PR19 business plan South Staffs Water (incorporating Cambridge Water) Board assurance statement The Board considers all the elements add up to a business plan that is high quality
Board assurance of our PR19 business plan South Staffs Water (incorporating Cambridge Water) Board assurance statement The Board considers all the elements add up to a business plan that is high quality
OUR PLAN Representations on the Draft Determination October 2014 I NN
 OUR PLAN 2015-20 Representations on the Draft Determination October 2014 I NN OVA TI ON ON ATI OR AB LL CO TRAN SFORMATION 1 2 3 4 5 6 7 8 9 10 11 12 Executive Summary Executive Summary Our Representations
Here for you. Annual performance report 2016/17
 Here for you. Annual performance report 2016/17 See what s inside 2 Performance highlights Chief Executive Officer s Review 8 Outcome delivery incentive performance 10 Here for customers 14 Safe and reliable
Annual Performance Report 2017 Introduction
 Introduction Copyright United Utilities Water Limited 2017 1 Introduction Contents Introduction... 3 Executive Summary... 8 Overview of the year... 9 Our customer service and operational performance...
Here for you. Annual performance report 2015/16
 Here for you. Annual performance report 2015/16 2015/16 2015/16 See what s inside Performance highlights Chief Executive Officer s Review 8 Water performance highlights 12 Waste performance highlights
PR19 UPDATE. 4 September 2018
 PR19 UPDATE 4 September 2018 CREATING OUR PLAN A plan that starts with people The most the most in-depth programme of customer engagement we've ever carried out An outside-in approach: talking to people
A challenging initial assessment for the water companies in England and Wales
 Agenda Advancing economics in business A challenging initial assessment for the water companies in England and Wales On 31 January, Ofwat published its Initial Assessment of Plans as part of the current
Towards a risk and reward framework for PR19: an exploration of the relationships between incentives, cost allowances and rates of return
 Towards a risk and reward framework for PR19: an exploration of the relationships between incentives, cost allowances and rates of return A report for Thames Water Utilities Limited March 2017 Disclaimer
Cover sheet. Introduction. Instructions Please select your company from this drop down list: Submission
 Cover sheet Introduction These guidance tables support companies in completing the pro-forma for their Business plan pre September-October 2018. The tables include references to the relevant PR19 business
2014 Price Review Business Plan Supporting Appendices Change Protocol. Published 2 December 2013
 2014 Price Review Business Plan Supporting Appendices Published 2 December 2013 2 Contents Page Section 1. Introduction... 3 Section 2. Mechanism for implementing the change protocol... 3 Section 3. The
SETTING PRICE LIMITS FOR OFWAT S FRAMEWORK AND APPROACH A RESPONSE FROM NORTHUMBRIAN WATER JANUARY 2008
 SETTING PRICE LIMITS FOR 2010-15 OFWAT S FRAMEWORK AND APPROACH PAGE 1 OF 8 Executive Summary Proposed changes introduce uncertainty and undermine stability The draft methodology paper proposes a number
2019 PRICE REVIEW UPDATE
 2019 PRICE REVIEW UPDATE 14 JULY 2017 Tittesworth Reservoir, Staffordshire AGENDA Overall approach PR19 new news Customer ODIs (1) Totex Retail Financing New markets PR19 Timetable Summary Liv Garfield
Appendix RA11 1. Board assurance statement 2. Jacob s independent assurance reports 3. Independent internal audit report.
 Appendix RA11 1. Board assurance statement 2. Jacob s independent assurance reports 3. Independent internal audit report 1 April 2019 1. Board assurance statement Making water count business plan 2020/25
FORECASTS OF COMMON PERFORMANCE COMMITMENTS
 FORECASTS OF COMMON PERFORMANCE COMMITMENTS Report for Yorkshire Water August 2018 This document provides forecasts for four of the common performance commitments over AMP7. Using three separate approaches,
A11: Aligning risk and return. Supporting material
 A11: Aligning risk and return Supporting material OVERVIEW This appendix provides additional material in support of the Risk and Return section of our plan. In particular, it provides some additional explanation
A reduction of over 1 billion in expenditure compared to AMP5. Innovation, efficiency and use of market mechanisms are contributors to lower costs.
 1 Good morning everyone, I m Steve Mogford, Chief Executive of United Utilities, and I d like to welcome you all to today s webcast presentation. I m going to take about 20 minutes to take you through
performance level - forecast PCL met? forecast forecast outperformance payment or underperformance penalty in-period ODIs
 Page 1 of 13 PR19 Business plan data tables - June 2018 Water resources Water network plus Wastewater network plus Bioresources (sludge) 4 Residential retail Business retail Direct procurement for customers
Our finances explained. October 2016
 Our finances explained. October 2016 About our finances. Steve Robertson Chief Executive Officer We are the UK s largest water and wastewater services provider, serving London and the Thames Valley, with
Interim Results 6 months ended 30 September November 2013 London
 Interim Results 6 months ended 30 September 2013 26 November 2013 London Disclaimers This presentation contains certain forward-looking statements with respect to Severn Trent's financial condition, results
Financial Performance Monitoring,
 Financial Performance Monitoring, 2016-2017 Final Report 19 February 2018 Submitted to Consumer Council for Water by: Economic Consulting Associates Economic Consulting Associates Limited 41 Lonsdale Road,
SSC - Appendix A35. South Staffordshire Water PR19. Monte Carlo modelling of ODI RoRE. Issue 3 Final 29/08/18. South Staffordshire Water
 Document Ti tle SSC - Appendix A35 South Staffordshire Water PR19 Monte Carlo modelling of ODI RoRE Issue 3 Final 29/08/18 South Staffordshire Water South Staffordshire Water PR19 Project No: B2342800
PR19 FINAL METHODOLOGY
 PR19 FINAL METHODOLOGY 18 December 2017 Draycote Water, Warwickshire AGENDA Our thoughts on PR19 Areas of specific interest Momentum into AMP7 Levers of outperformance Timeline & Conclusions Q&A Liv Garfield
Credit Opinion: Thames Water Utilities Ltd.
 Credit Opinion: Thames Water Utilities Ltd. Global Credit Research - 20 Sep 2013 United Kingdom Ratings Category Outlook Corporate Family Rating -Dom Curr Thames Water Utilities Cayman Finance Limited
Strategic supplies Guidance
 WATER ACT 2003 WATER SUPPLY LICENSING Strategic supplies Guidance December 2005 Guidance on strategic supplies Chapter Page number 1. Introduction and outline 2 1.1 Background 2 1.2 Purpose of this guidance
Statement of Board Assurance provided to the Water Services Regulation Authority Indicative Wholesale charges
 Statement of Board Assurance provided to the Water Services Regulation Authority 2019-20 Indicative Wholesale charges October 2018 Contents Statement of Board Assurance provided to the Water Services Regulation
Our finances explained.
 Our finances explained. October 2017 About our finances. Every day, 365 days a year, we provide 2.6 billion litres of one of life s essential ingredients - high quality drinking water - to nearly 10 million
FULL YEAR 2017/18 RESULTS 23 MAY 2018
 FULL YEAR 2017/18 RESULTS 23 MAY 2018 1 DISCLAIMERS Cautionary statement regarding forward-looking statements This document contains statements that are, or may be deemed to be, forward-looking statements
United Utilities Proposed approach to the water resources RCV allocation at PR19
 United Utilities Proposed approach to the water resources RCV allocation at PR19 January 2018 1 Contents 1. Overview and Executive Summary... 3 2. Our approach... 4 3. Options considered... 4 4. Issues
PR19 Business Plan Summary for Investors
 PR19 Business Plan 2020-2025 Summary for Investors PR19 Business Plan 2020-2025 Summary for Investors Severn Trent Plc 1 Contents 01 Executive Summary 02 Financial Summary 03 Lowest Possible Bills 04 Investment
HALF YEAR RESULTS FOR THE SIX MONTHS ENDED 30 SEPTEMBER 2017
 United Utilities Group PLC 22 November HALF YEAR RESULTS FOR THE SIX MONTHS ENDED 30 SEPTEMBER Customer focus delivers further improvements A leading company for customer satisfaction Doubling the number
NEW CONNECTION SERVICES CHARGING RULES 2018/19
 NEW CONNECTION SERVICES CHARGING RULES 2018/19 1. INTRODUCTION This document sets out: the charging rules for new connection services (including agreements for the adoption of self laid infrastructure)
PR14 Reconciliation Information
 PR14 RECONCILIATION INFORMATION INFORMATION PR14 Reconciliation Information APP5 - PR14 RECONCILIATION - PERFORMANCE COMMITMENTS APP6 - PR14 RECONCILIATION - SUB MEASURES APP9 - ADJUSTMENTS TO RCV FROM
Preliminary Results. Year ended 31 March Presentation 29 May 2009
 Preliminary Results Year ended 31 March 2009 Presentation 29 May 2009 Disclaimers For the purposes of the following disclaimers, references to this "document" shall be deemed to include references to the
Northumbrian Water response to Water 2020: consultation on the approach to the cost of debt for PR19
 Northumbrian Water response to Water 2020: consultation on the approach to the cost of debt for PR19 Overview We welcome the consultation on the approach to the cost of debt. In preparing this response,
Severn Trent Water Accounting Separation Methodology Statement
 Severn Trent Water Accounting Separation Methodology Statement 1. Business structure, systems and sources of information used to populate tables 2. Population of lines within the accounting separation
HALF YEAR RESULTS FOR THE SIX MONTHS ENDED 30 SEPTEMBER 2018
 United Utilities Group PLC 21 November HALF YEAR RESULTS FOR THE SIX MONTHS ENDED 30 SEPTEMBER Customers continue to be at the heart of everything we do Delivering customer service improvements through
Reporter s Overview of the Northumbrian Water June Return 2011
 Reporter s Overview JR11 Reporting The Reporter for Northumbrian Water Ltd, Chris Turner, supported by a team of technical and operational specialists from has examined, tested and provided opinion to
Appendix 8h: Approach to cost adjustment claims. Author: Yorkshire Water
 Appendix 8h: Approach to cost adjustment claims Author: Yorkshire Water Yorkshire Water PR19 Submission Appendix 8h: Approach to cost adjustment claims 2 Contents Contents 2 Approach to cost adjustment
ANNUAL. PERFORMANCE REPORT Year ended 31 March 2016
 ANNUAL PERFORMANCE REPORT Year ended 31 March 2016 Contents Introduction 5 Reporting our performance 6 Disclosures required by RAG 3 7 Report of the auditor 8-9 Section 1 - Regulatory financial reporting
Irish Water 2019 Revenue Control
 An Coimisiún um Rialáil Fóntas Commission for Regulation of Utilities Irish Water 2019 Revenue Control Information Paper Reference: CRU/17/332 Date Published: 07/12/2017 www.cru.ie Executive Summary The
Methodology information paper 8: Rolling incentives
 Methodology information paper 8: Rolling incentives Introduction In the Strategic Review of Charges 2006-10 we, the Commission indicated our intention to apply rolling incentives in the next regulatory
Water and Sewerage Services
 Water and Sewerage Services Cost and Performance Report for PC13 An assessment of NI Water s costs and performance November 2015 About the Utility Regulator The Utility Regulator is the independent non-ministerial
INTERIM RESULTS. Six months ended 30 September th November 2015
 INTERIM RESULTS Six months ended 30 September 2015 26th November 2015 LIV GARFIELD Chief Executive Officer 2 By 2020 to be the most trusted water company Delivering an outstanding customer experience,
Long Term Investment in Infrastructure. Water Industry Forum 26 January Christopher Royce Head of Strategic Investment Management
 Long Term Investment in Infrastructure Water Industry Forum 26 January 2016 Christopher Royce Head of Strategic Investment Management Historical expenditure trends Water UK Published Data 2 Asset Management
The Water Industry Commission for Scotland Scottish Water Scottish Water
 The Water Industry Commission for Scotland Scottish Water Scottish Water Reporter s Report SR10 2 nd Draft Business Plan Appendix C Investment and Outputs Plan April 2009 SCOTTISH WATER REPORTER S REPORT
Flood Risk Management Planning in Scotland: Arrangements for February 2012
 Flood Risk Management Planning in Scotland: Arrangements for 2012 2016 February 2012 Flood Risk Management (Scotland) Act 2009 1 Contents Forewords 1. Introduction to this document... 5 2. Sustainable
Economic regulation of capacity expansion at Heathrow: policy update and consultation
 Consumers and Markets Group Economic regulation of capacity expansion at Heathrow: policy update and consultation CAP 1610 Published by the Civil Aviation Authority, 2017 Civil Aviation Authority, Aviation
United Utilities Group PLC. Credit Investor update Summer 2017
 United Utilities Group PLC Credit Investor update Summer 2017 Agenda UU overview and investment proposition Financial and operational performance Financing and credit ratings Water regulation and PR19
A risk-based approach to setting the baseline for base capital maintenance
 0 March 2011 Northumbrian Water Limited Regulatory compliance: reducing the regulatory burden A risk-based approach to setting the baseline and improving incentives for capital maintenance - a discussion
The Strategic Review of Charges : The draft determination
 The Strategic Review of Charges 2006-10: The draft determination Our approach to setting charge caps volume 3 WATER INDUSTRY COMMISSIONER FOR SCOTLAND Contents Executive summary Page 3 1. Our approach
Northumbrian Water response to. Water 2020: Regulatory framework for wholesale markets and the 2019 price review
 Northumbrian Water response to Water 2020: Regulatory framework for wholesale markets and the 2019 price review Northumbrian Water response to Water 2020: Regulatory framework for wholesale markets and
On 30 July, Ofgem published Draft Determinations (DDs) for the remaining 10 electricity distribution
 for the remaining 10 electricity distribution") briefing note: 14 august 2014 Ofgem s RIIO-ED1 Slow Track Draft Determinations On 30 July, Ofgem published Draft Determinations (DDs) for the remaining 10 electricity distribution network operators (DNOs),
briefing note: 14 august 2014 Ofgem s RIIO-ED1 Slow Track Draft Determinations On 30 July, Ofgem published Draft Determinations (DDs) for the remaining 10 electricity distribution network operators (DNOs),
Funding efficiently incurred embedded debt at PR19
 Funding efficiently incurred embedded debt at PR19 A report for SES Water June 2017 Disclaimer This report (Report) was prepared by Ernst & Young LLP for Sutton and East Surrey Water plc (trading as SES
Water supply licensing guidance on eligibility
 Water today, water tomorrow Water supply licensing guidance on eligibility www.ofwat.gov.uk Contents 1. Introduction 2 2. The obligations of appointed water companies 5 3. Premises 7 4. Household and non-household
Preliminary Results. Year ended 31 March Presentation 5 June 2008
 Preliminary Results Year ended 31 March 2008 Presentation 5 June 2008 0 Disclaimers For the purposes of the following disclaimers, references to this "document" shall be deemed to include references to
Data Assurance Summary
 Data Assurance Summary Annual Reporting 2016 17 15 July 2017 Page 2 Data Assurance Summary 2016 17 Contents 2 1. About this document 3 2. Background 4 3. Strengthening our controls and procedures 5 4.
Preliminary Results. Year ended 31 March May 2010 The Lincoln Centre, London
 Preliminary Results Year ended 31 March 2010 28 May 2010 The Lincoln Centre, London Sir John Egan Chairman Mike McKeon Finance Director Highlights 2008/09 2009/10 Change m m % Group Turnover 1,642 1,704
FULL YEAR RESULTS FOR THE YEAR ENDED 31 MARCH 2018
 United Utilities Group PLC 24 May 2018 FULL YEAR RESULTS FOR THE YEAR ENDED 31 MARCH 2018 Putting customers first Customers benefiting from better service, greater resilience and improved efficiency Delivering
Yorkshire Water Board Assurance Statement
 Yorkshire Water Board Assurance Statement 2018-19 02 Contents Board Assurance Statement & Board Signatures Charges data assurance summary Charges rules compliance review Appendix CCWater timetable Bill
Study of the market for new appointments and variations summary of findings and next steps
 10 October 2017 Trust in water Study of the market for new appointments and variations summary of findings and next steps www.ofwat.gov.uk Contents 1. Background and purpose of this document 2 2. Summary
SEVERN TRENT INVESTOR ROADSHOW. Upper Derwent Valley, Peak District National Park
 SEVERN TRENT INVESTOR ROADSHOW Upper Derwent Valley, Peak District National Park 1 THE WATER SECTOR IN ENGLAND AND WALES Listed companies: - Severn Trent - United Utilities - Pennon (SW Water) Inflation-linked
ACCOUNTING SEPARATION STATEMENT Analysis of Operating and Fixed Asset Costs by Business Unit
 ACCOUNTING SEPARATION STATEMENT 2017-18 Analysis of Operating and Fixed Asset Costs by Business Unit 1. PURPOSE OF METHODOLOGY The purpose of this methodology statement is to explain how the totex and
Business plan briefing Thames Water. Company Business Plan Presentation Pro forma
 Company Business Plan Presentation Pro forma 1 Contents Contents 2 1. Background 3 1.1 Company pen pic 3 1.2 List of attendees 4 2. Key business plan metrics 5 3. Appendices 14 Appendix 1: Company presentation
Interim Results 6 months ended 30 September The Lincoln Centre, London
 Interim Results 6 months ended 30 September 2012 27 November 2012 27 November 2012 The Lincoln Centre, London Highlights Financial performance in line with expectations Enhanced investment programme delivering
Minute of the first meeting of the Water Forum. Severn Trent Centre, Coventry. 2 March Milo Purcell. Ian Butterfield.
 Minute of the first meeting of the Water Forum Severn Trent Centre, Coventry 2 March 2012 Present: Chair Consumer Council for Water (CCWater) Drinking Water Inspectorate (DWI) Environment Agency Natural
HALF YEAR 2017/18 RESULTS
 HALF YEAR 2017/18 RESULTS 23 November 2017 Upper Derwent Valley, Peak District National Park DISCLAIMERS Cautionary statement regarding forward-looking statements This document contains statements that
FULL YEAR RESULTS FOR THE YEAR ENDED 31 MARCH 2017
 United Utilities Group PLC 25 May 2017 FULL YEAR RESULTS FOR THE YEAR ENDED 31 MARCH 2017 Industry leading customer satisfaction, innovation and operational performance Record SIM scores resulting in upper
Introduction. General assurance processes
 1 Introduction We understand that customers and other stakeholders want information about our performance and that the information needs to be accessible and understandable. We are committed to providing
Thames Water Utilities Limited Investor Report 30 September 2016
 Thames Water Utilities Limited Investor Report 30 September 2016 1 Important Notice This report is being distributed in fulfilment of a document, the Common Terms Agreement (the CTA ), which governs the
CEPA review of CAA Economic regulation of capacity expansion at Heathrow: policy update and consultation, (CAP1610) cost of capital issues
 cost of capital issues") CEPA review of CAA Economic regulation of capacity expansion at Heathrow: policy update and consultation, (CAP1610) cost of capital issues For the Heathrow Airline Operators Committee (AOC), February 2018
CEPA review of CAA Economic regulation of capacity expansion at Heathrow: policy update and consultation, (CAP1610) cost of capital issues For the Heathrow Airline Operators Committee (AOC), February 2018
Response to Ofwat s Cost of Debt Consultation for PR19 For Portsmouth Water
 Response to Ofwat s Cost of Debt Consultation for PR19 For Portsmouth Water 17 October 2016 Project Team James Grayburn Zuzana Janeckova Jinzi Guo NERA Economic Consulting Marble Arch House, 66 Seymour
Developer Services Charging Arrangements for 2018/19
 Developer Services Charging Arrangements for 2018/19 Document Owner: Tom Kelly Issued: February 2018 Next review planned: February 2019 www.seswater.co.uk SES Water Charging Arrangements Page i Contents
DEVELOPER (NEW CONNECTION) CHARGING CONSULTATION
 CHARGING CONSULTATION") DEVELOPER (NEW CONNECTION) CHARGING CONSULTATION OCTOBER 2017 This second consultation document sets out Anglian Water s proposals for the new Developer charging arrangements. This is as a result of the
DEVELOPER (NEW CONNECTION) CHARGING CONSULTATION OCTOBER 2017 This second consultation document sets out Anglian Water s proposals for the new Developer charging arrangements. This is as a result of the
Severn Trent Water Accounting Separation Methodology Statement
 1. Business Structure Accounting Separation Methodology Statement 2015/16 Severn Trent Water Accounting Separation Methodology Statement 2. Population of lines within the accounting separation tables 3.
MAY Carbon taxation and fiscal consolidation: the potential of carbon pricing to reduce Europe s fiscal deficits
 MAY 2012 Carbon taxation and fiscal consolidation: the potential of carbon pricing to reduce Europe s fiscal deficits An appropriate citation for this report is: Vivid Economics, Carbon taxation and fiscal
THE TAKEOVER PANEL MISCELLANEOUS CODE AMENDMENTS
 RS 2009/2 Issued on 16 December 2009 THE TAKEOVER PANEL MISCELLANEOUS CODE AMENDMENTS STATEMENT BY THE CODE COMMITTEE OF THE PANEL FOLLOWING THE EXTERNAL CONSULTATION PROCESS ON PCP 2009/2 CONTENTS 1.
Advice to the Minister on the Economic Regulatory Framework for the public water services sector in Ireland
 Advice to the Minister on the Economic Regulatory Framework for the public water services sector in Ireland DOCUMENT TYPE: REFERENCE: Advice Paper CER/14/076 DATE ISSUED: 31 March 2014 Non-technical summary
Department for Regional Development consultation on proposals for new water legislation.
 Elizabeth House 116 Holywood Road Belfast BT4 1NY Eddie Dobbin Water Policy Division Department for Regional Development Room 122 Clarence Court 12-18 Adelaide Street Belfast BT2 8GB 29 August 2014 Dear
Developments in the allowed cost of capital
 Developments in the allowed cost of capital Moody s 2017 UK Water Sector Conference London, UK Sahar Shamsi, Senior Consultant 17 October 2017 Overview The Ofwat PR19 WACC not only matters for the water
Thames Water Utilities Limited Investor Report 30 September 2017
 Thames Water Utilities Limited Investor Report 30 September 2017 1 Important Notice This report is being distributed in fulfilment of a document, the Common Terms Agreement (the CTA ), which governs the
Regulatory Accounts 2015/16
 2015/16 1 Directors certificate of going concern Statement of Directors Responsibilities The Directors of NI Water are required to prepare financial statements which comply with the requirements of Condition
STRONG PERFORMANCE AND ON TRACK TO MEET OUR TARGETS HALF YEAR RESULTS FOR THE SIX MONTHS ENDED 30 SEPTEMBER 2016
 United Utilities Group PLC 23 November STRONG PERFORMANCE AND ON TRACK TO MEET OUR TARGETS HALF YEAR RESULTS FOR THE SIX MONTHS ENDED 30 SEPTEMBER Highlights Further improvements in customer satisfaction:
January Cost of Capital for PR09 A Final Report for Water UK
 January 2009 Cost of Capital for PR09 A Final Report for Water UK Project Team Dr Richard Hern Tomas Haug Anthony Legg Mark Robinson Contact Dr Richard Hern Ph: +44 (0)20 7659 8582 Fax: +44 (0)20 7659
Protocol for the maintenance of flood and coastal risk management assets (England only) Version 4, 27/01/2014 UNCLASSIFIED
 Version 4, 27/01/2014 UNCLASSIFIED") Protocol for the maintenance of flood and coastal risk management assets (England only) Version 4, 27/01/2014 UNCLASSIFIED We are the Environment Agency. We protect and improve the environment and make
Protocol for the maintenance of flood and coastal risk management assets (England only) Version 4, 27/01/2014 UNCLASSIFIED We are the Environment Agency. We protect and improve the environment and make
PR19 Business Plan. Water Resources RCV Allocation Submission January 2018
 PR19 Business Plan Water Resources RCV Allocation Submission January 2018 Introduction... 3 Overview of Company Water Resources... 3 Ofwat s Technical Guidance on Issues to Consider... 4 1. Definition
Preliminary Results Year ended 31 March May 2012 The Lincoln Centre, London
 Preliminary Results Year ended 31 March 2012 30 May 2012 The Lincoln Centre, London Mike McKeon Finance Director Highlights 2010/11 2011/12 Change % Group turnover ( m) 1,711.3 1,770.6 3.5 Profit before
Response to Ofcom s consultation on price rises in fixed term contracts
 Response to Ofcom s consultation on price rises in fixed term contracts 14 March 2013 Price rises in fixed term contracts Ombudsman Services consultation response 1 Summary 1.1 About Ombudsman Services
United Utilities Wholesale Charges A consultation on United Utilities proposed NAV tariff
 United Utilities Wholesale Charges A consultation on United Utilities proposed NAV tariff 1. Introduction The New Appointments and Variations (NAV) regime allows new entry into the wholesale water and