United Utilities Group PLC. Credit Investor update Summer 2017
|
|
|
- Rodger Lindsey
- 5 years ago
- Views:
Transcription


1 United Utilities Group PLC Credit Investor update Summer 2017
2 Agenda UU overview and investment proposition Financial and operational performance Financing and credit ratings Water regulation and PR19 Supporting information 2
3 UU overview and investment proposition
 c 10.7bn (31/03/17) Net debt c 6.")
4 United Utilities Who we are United Utilities Group PLC (UU) is the UK s largest listed water company Through its subsidiary, United Utilities Water Limited, UU manages the regulated water & wastewater network in the North West of England, serving around 7 million people & 200,000 businesses Revenue c 1.7bn in FY2016/17 Regulatory capital value (RCV) c 10.7bn (31/03/17) Net debt c 6.6bn (31/03/17) Market capitalisation c 6.8bn (31/03/17) UU s ordinary shares - listed on London Stock Exchange & trade over-the-counter in the USA in the form of American Depositary Receipts (1 ADR = 2 Ords) Of the 1,700 million litres we supply every day, well over half is from Cumbria and Wales. The two biggest reservoirs are Thirlmere and Haweswater in Cumbria. We own and manage over 56,000 hectares of land, making us the largest corporate landowner in England. We help to protect over 400km of coastline and around 7,000km of rivers flowing across our region. We operate 93 water treatment works and 567 wastewater treatment works 4
5 Investment proposition Why invest in United Utilities? Clear vision to be the best water company in the UK, providing great service to our customers Management team with extensive commercial, operational and regulatory experience Track record of regulatory outperformance; exceeded our targets Wholesale revenue and asset base linked to RPI inflation through to at least 2020 Clarity on allowed returns through to 2020 Water Plus Non-Household Retail JV with Severn Trent - well positioned for full market opening Significant improvements in operational performance and customer service Low cost of debt locked in and robust capital structure with a stable A3 rating Dividend policy targeting annual growth of at least RPI inflation through to
6 Vision To be a leading UK water company Deliver long-term shareholder value by providing: Best service to customers At the lowest sustainable cost In a responsible manner Shareholder value driven by regulatory outperformance: Totex Operational Financing 6
7 Capital structure Robust and sustainable capital structure Aim to at least retain existing credit ratings for UUW with Moody s and S&P Moody s has an A3 rating with a Stable outlook Standard & Poor s has a BBB+ rating with a Positive outlook Target gearing range of 55% to 65% supports robust capital structure Financing headroom into 2019 Average term to maturity of debt portfolio of around 20 years 7
8 Dividends policy targets sustainable growth 2016/17 full year dividend of pence per ordinary share Increase of 1.1% compared to prior year, in line with dividend policy Target growth rate of at least RPI each year to 2020, from 2014/15 base RPI based on November from prior year - mirrors RPI in price limits Consistent with growth in regulatory capital value Recognise importance of income to shareholders 8
9 Pence Dividends Sustainable dividend growth Total dividend per share / / / / / / /17 AMP 5 AMP 6 Interim DPS Final DPS 9
10 Financial and operational performance
11 Financial summary Key takeaways Good set of results maintaining tight cost control Higher RPI delivers further growth in RCV, but increases index-linked finance charge Pensions hedging working effectively Robust capital structure Over two thirds of funding requirements already raised First CPI-linked debt issued by a UK utility Debt portfolio locks in outperformance Hedging policy means we are well placed to manage future financing costs 11
12 Financial performance Good set of results Underlying operating profit of 623m, up 3% - reported operating profit of 606m (impacted by market reform and restructuring costs) Underlying profit after tax of 313m, reflecting higher RPI inflation on finance charge - reported profit after tax of 434m (impacted by one-off deferred tax credit and disposal of business retail) Underlying EPS of 46.0 pence, down 1.7p or 4% - reported EPS of 63.6p Full year dividend of pence per share, up 1.1% in line with policy Robust capital structure, with RCV gearing at 61% 12
13 Operational highlights Another strong performance Record SIM scores resulting in upper quartile performance Systems Thinking approach delivering industry leading innovation and operational performance Sector leading status with Environment Agency and Dow Jones Sustainability Index 804m investment taking total AMP6 investment to 1.6bn over first two years Accelerated investment delivering further operational and customer benefits and contributing to a net ODI reward of 6.7m Additional 100m of new investment to improve resilience for customers Robust capital structure and effective pensions hedging 13
14 Additional 100m investment Sharing net outperformance Announcing additional investment of c 100m to be made available across the remainder AMP6 Investing in resilience for the benefit of customers Additional investment funded through anticipated net outperformance 20m to be made available in 2017/18 Similar to the approach we took in AMP5 14
15 SIM points Customer satisfaction Best ever qualitative SIM scores Good performer Ofwat SIM qualitative performance wave four 2016/ Water & sewerage companies Water only companies Poor performer 3.6 DVW WSK UU PRT SEW NES BRL SBW ANH SVT WSH YKY AFW SWT SRN SSC TMS SES 15
16 SIM points Customer satisfaction Marked improvement in quantitative SIM scores Poor performer Ofwat SIM quantitative performance 2016/17* Water & sewerage companies Water only companies Good performer 0 PRT SBW SEW UU SVT DVW NES SWT YKY WSH TMS SRN AFW * Quantitative SIM for 2016/17 is based on a datashare of 13/18 water companies, using 12 month actuals 16

17 Net regulatory capital spend profile Accelerating investment a further 804m invested this year Acceleration of investment to deliver early customer and operational benefits m TCQi 90% TCQi 93% NB. The UU AMP6 investment programme shown on this chart does not constitute a forecast and is subject to change 17
18 m Outcome delivery incentives (ODIs) Improving our targets further ODIs reward/penalty ranges m + 50m - 100m + 30m - 70m + 30m - 50m Further reduction to downside risk m P10/P90 range PR14 Soft guidance May 2015 Target May 2016 New target May 2017 Total net ODI reward earned to date of 9.2 million 18
19 Leading operational and environmental performance UU assessed as Industry Leading Company Industry Leading Company status measured through EA assessment Best ever performance against DWI metrics Industry leading capability in our integrated control centre (ICC) Customer innovations setting new benchmarks in the industry Pollution Incidents Serious Pollution Incidents
20 Outcome delivery incentives (ODIs) Another good performance in 2016/17 Wastewater ODIs m reward/ (penalty) Private sewers service index 7.4 Wastewater category 3 pollution incidents 3.3 Sewer flooding index (1.5) Maintaining our wastewater treatment works - Other 6 wastewater ODIs 0.3 Wastewater net reward 9.5 Water ODIs m reward/ (penalty) Reliable water service index (8.0) Water quality service index (3.6) Average minutes lost - Leakage 9.1 Other 5 water ODIs (0.3) Water net (penalty) (2.8) Total net reward

21 Leading company in embracing innovation Contributing to over 400m efficiencies Davyhulme modernisation project c 200m in AMP6 Design for manufacture and assembly (DfMA) standardised design and cost efficiency Nereda process control technology efficiency in wastewater process Real time production planning with network modelling Telemetry backbone connecting our sites and integrated control centre 21

22 Investing in resilience Manchester resilience project Planned maintenance outage of Haweswater aqueduct Extensive use of innovative technology Underpinned by real-time production planning with central control Committed to further outage in AMP6 for additional work Longer term approach to be considered in the context of a wider Manchester resilience project 22

23 Non-household retail 1 April 2017 full market opening Well prepared when the market opened Successful with large corporates Won multi-site customers Anticipate active market and Water Plus well placed to compete 23
24 Financing and credit ratings
25 RCV and gearing RCV gearing supports robust capital structure % % % RCV m % RCV gearing 1 within our target range, supporting a solid A3 credit rating % % /03/ /03/ /03/ /03/ /03/ /03/ /03/ % RCV RCV gearing 1 RCV gearing calculated as group net debt / United Utilities Water s regulatory capital value (based on shadow RCV for AMP6, adjusted for actual spend) and presented in outturn prices. RCV at 31/03/2017 = 10,719m 25
26 Financing Leading the way on CPI debt > 1.7bn of c 2.5bn financing requirements already raised CPI-linked first CPI-linked debt issued by a UK utility o 40m raised from private placements in December 2016, with 15-year and 20-year maturities o 60m raised from private placement in February 2017, with a 20-year maturity RPI-linked o c 73m raised from private placements in December 2016, with 15-year and 20-year maturities o Total of 813m raised previously Nominal o Total of 736m raised previously 200m committed bank facilities agreed or renewed since September 2016 Financing headroom into
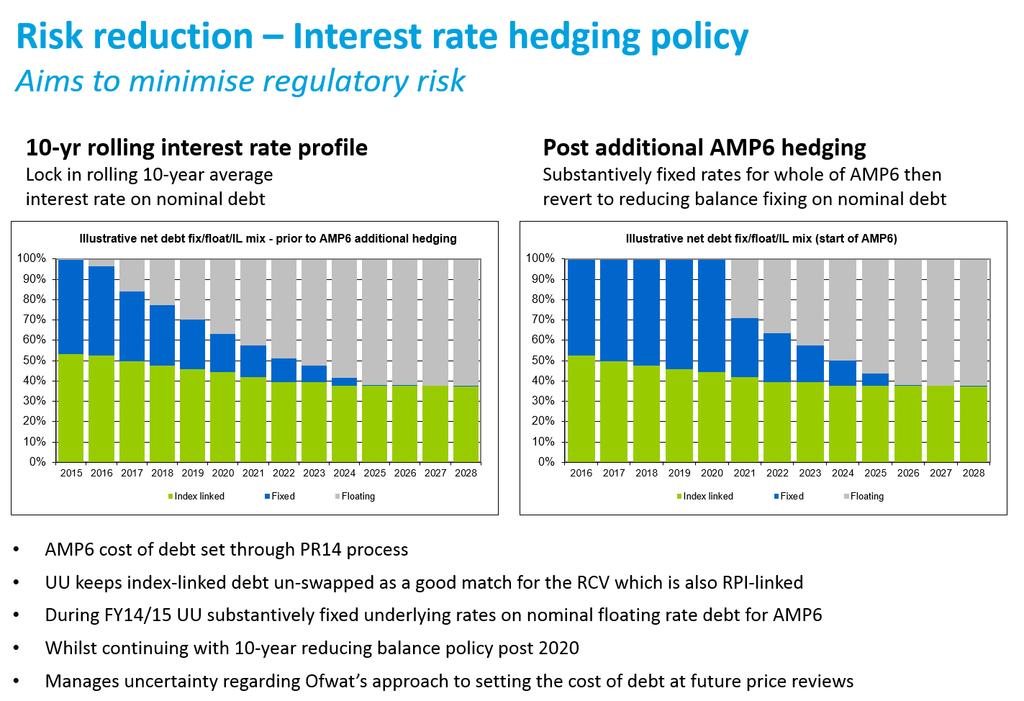
27 Hedging Clearly articulated financial risk management Debt portion of RCV remains largely hedged for inflation Index-linked debt portfolio now c 3.6bn with an average cost of 1.3% real Around half of pension liabilities hedge a substantial proportion of the remaining debt portion of RCV Nominal debt portfolio fixed for at average rate of c3.6% 1 Possible hedging response to Ofwat s proposed CPI transition and approach to setting the cost of debt currently being considered 1 Interest rate is inclusive of credit spreads 27
28 m Pensions Hedging continues to work well m surplus IFRS pensions surplus 126m surplus 275m surplus 215m surplus 248m surplus Mar 15 Sep 15 Mar 16 Sep 16 Mar 17 Assets Liabilities 28
29 Financing and liquidity at 31 March 2017 Gross debt = 7,384.5m Headroom / prefunding = 698.9m 489.1m, Other EIB loans 557.4m, Other borrowings 875.0m, Yankee bonds (USD) 564.2m, Euro bonds (EUR) m Cash and short-term deposits Medium-term committed bank facilities ,543.4m, EIB and other RPI linked loans 1,296.5m, GBP bonds Undrawn EIB term loan facilities Short-term debt (229.4) Term debt maturing within one year (94.5) 99.6m, GBP CPI linked bonds 1,959.3m, GBP RPI linked bonds Total headroom / prefunding Excludes 150m facilities maturing within one year 29
30 Debt structure at 31 March 2017 United Utilities Group PLC Yankees: $250m in 18s $350m in 19s $400m in 28s United Utilities PLC Baa1 stable; BBB- positive Other debt: Short-term loans 135m United Utilities Water Limited A3 stable; BBB+ positive Ring-fenced and regulated by Ofwat Euro MTNs: 5bn in 17s 150m in 18s 500m in 20s 375m in 22s 300m in 27s 50m in 32s 1 200m in 35s 100m in 35s 1 35m in 37s 1 70m in 39s 1 100m in 40s 1 50m in 41s 1 100m in 42s 1 50m in 43s 1 50m in 46s 1 50m in 49s 1 510m in 56s 1 150m in 57s 1 Other debt: EIB index-linked loans 1,088m 1 Other index-linked loans 300m 1 Other EIB loans 489m Short-term loans 67m 10bn dual currency loan Other sterling loans 128m United Utilities Water Finance PLC 3 Guaranteed by United Utilities Water Ltd Euro MTNs: 25m in 25s 1 52m in 27s 20m in 28s 1 35m in 30s 1 30m in 30s 30m in 31s HK$600m in 31s 38m in 31s 1 20m in 31s 2 27m in 36s 1 29m in 36s 1 20m in 36s 2 60m in 37s 2 1 RPI linked finance 2 CPI linked finance 3 United Utilities Water Finance PLC (UUWF) is a financing subsidiary of United Utilities Water Limited (UUW) established to issue new listed debt on behalf of UUW. Notes issued by UUWF are unconditionally and irrevocably guaranteed by UUW and are rated in line with UUW s credit ratings. 30


31 Term debt maturity profile as at 31 March Average term to maturity of around 20 years 1 Future repayments of index-linked debt include inflation based on an average annual RPI rate of 3% and an average annual CPI rate of 2% 31
32 m European Investment Bank funding maturity profile Medium to long-term maturity profile 1200 EIB funding maturity profile To 31 Mar Existing EIB funding Additional EIB funding Notes Future repayments of EIB RPI linked debt include inflation based on an average annual RPI rate of 3%. Dark blue areas represent EIB loans currently drawn and outstanding. Light blue areas include the remaining 175m of 250m AMP6 loan signed April 2016 (assumes drawn in 2017), and assumes a further 250m AMP6 is signed and drawn in 2018 (this being the second tranche of a 500m AMP6 funding package approved by EIB in 2016). It is assumed that these loans are drawn down in index-linked form on an amortising repayment basis with an average loan life of approximately 10-years. 32
33 Credit rating summary Aim to at least retain current credit ratings for UUW (Moody s = A3, S&P = BBB+) supports efficient access to debt capital markets Moody s Investors Service (Moody s) UUW* rated A3, UU rated Baa1. Stable outlook for both companies threshold for A3 rating: net debt to RCV ratio below 68% and adjusted interest cover above 1.6x Standard & Poor s (S&P) UUW* rated BBB+, UU rated BBB-. Positive outlook for both companies adjusted FFO-to-debt threshold for a BBB+ rating is 9-10% * Any notes issued by UUW s financing subsidiary United Utilities Water Finance PLC (UUWF) are expected to be rated in line with UUW s credit rating 33
34 Water regulation and PR19
35 Ofwat s legal duties Primary Ensure companies properly carry out their functions Ensure companies can finance their functions Protect interests of consumers, wherever appropriate by promoting effective competition Secondary Promoting economy and efficiency Contributing to the achievement of sustainable development Ensure Ofwat gives no undue preference 1 Secure the long-term resilience of water and sewerage systems 1 1 added as part of the Water Act
36 Regulatory capital value Market capitalisation (shortly after flotation) + Pre 2015: Capital investment : RCV additions (from totex) - Pre 2015: Capital charges : RCV run-off +/- Inflation adjustment = Regulatory capital value (RCV) Plus other adjustments at each price control 36
37 Growth in UUW regulatory capital value (RCV) 1 Attractive long-term growth 12,000 Average growth rate of > 350m p.a. from privatisation through to ,000 m 8,000 6,000 4,000 2, Further environmental improvements and adaptation to climate change should continue to drive long term growth 1 Outturn prices: growth based on the RCV published in the final determination and assuming an inflation rate of 2.5% p.a. 37
38 Ofwat s final determination December 2014 Weighted average cost of capital Debt Real pre tax 2.59% 1 Equity Real post tax 5.65% Notional gearing 62.5% WACC Appointee business (vanilla, real) 3.74% 2,3 Includes retail margin allowance of 0.14% Wholesale business (vanilla, real) 3.60% 2 1 Assumes ratio of 75% embedded debt / 25% new debt. Cost of embedded debt = 2.75% & cost of new debt = 2.1%. 2 Quoted ratios for non-enhanced companies. Enhanced companies received a slightly higher appointee WACC of 3.85%/ wholesale WACC of 3.70% WACC (vanilla, real) of 5.1%; derived from pre-tax debt of 3.6%, post-tax equity of 7.1% and a notional gearing of 57.5% 38


39 Water 2020 UU actively participating Market reform Water 2020 Water resources Raw water distribution Water treatment Treated water distribution Sewer collection Sewage treatment Sludge treatment Sludge disposal Water resources Water network plus Wastewater network plus Sludge treatment, transport and disposal Achieve full allowance across all four price controls Compete for enhancement projects > 100m 39
40 Ofwat Water 2020 Key points so far Indexation Confirmed phased transition from RPI to CPI (or CPI-H); CPI/CPI-H will apply 100% for revenues 50% applied to opening wholesale RCV in 2020 with new additions in allocated to CPI(H) portion; further transition likely at PR24 and beyond Water resources Separate total revenue control to incentivise competition Bioresources Separate average revenue control for sludge treatment and disposal Direct procurement encouraged for discrete projects with a whole life totex > 100m discrete, enhancement, non-sludge projects only Cost of debt methodology proposed move to indexation of cost of new debt embedded debt assessed with reference to sector embedded debt costs and market benchmarks 40
41 PR19 key dates Engaging with Ofwat on price review process Date Event 11 July 2017 Ofwat publish methodology consultation 25 August 2017 Companies to respond to Ofwat s methodology consultation 29 September 2017 Companies to submit Bioresources RCV allocation December 2017 January 2018 March 2018 Ofwat publish final methodology and risk based review Companies to submit Water Resources RCV allocation Companies submit special factor claims 3 September 2018 Companies to submit business plans July 2019* December 2019* Draft determination Final determination * Current view with further clarification expected in the July methodology consultation 41
42 Supporting information Where we operate 2016/17 full year results ODI performance 2016/17 additional detail on selected ODIs Financial risk reduction PR14 regulatory framework and final determination Recent UK regulated water M&A transactions

43 Where we operate Regulated UK water & wastewater business Customer premises Water 3.2m Wastewater 3.2m Regional population of around 7 million 43
44 2016/17 full year results
45 Reported income statement One-off tax credit and profit on disposal enhance earnings m Year ended 31 March Revenue 1 1, ,730.0 Operating expenses (733.6) (798.4) EBITDA Depreciation and amortisation (364.9) (363.7) Operating profit Investment income and finance expense (189.0) (219.4) Profit on disposal of non-household retail business Share of profits of joint ventures Profit before tax Tax (8.5) 44.0 Profit after tax Earnings per share (pence) Total dividend per ordinary share (pence) UU Water appointed: 1,671m, UU Water non-appointed: 9m, Non UU Water: 24m (2016/17) 45
46 Underlying income statement Good financial performance m Year ended 31 March Revenue 1 1, ,730.0 Operating expenses (567.9) (594.0) Infrastructure renewals expenditure (148.3) (168.2) EBITDA Depreciation and amortisation (364.9) (363.7) Operating profit Net finance expense (237.3) (201.0) Share of profits of joint ventures Profit before tax Tax (76.0) (82.8) Profit after tax Earnings per share (pence) Total dividend per ordinary share (pence) UU Water appointed: 1,671m, UU Water non-appointed: 9m, Non UU Water: 24m (2016/17) 46
47 Profit before tax reconciliation m Year ended 31 march Operating profit Investment income and finance expense (189.0) (219.4) Profit on disposal on non-household retail business Share of profits of joint ventures Reported profit before tax Adjustments: Water quality incident Flooding incidents in Dec 15 (net of insurance proceeds recognised) 1.4 (0.6) Non-household retail market reform Restructuring costs Profit on disposal on non-household retail business (22.1) - Net fair value losses/(gains) on debt and derivative instruments (24.3) 26.3 Interest on swaps and debt under fair value option Net pension interest income (10.2) (3.1) Capitalised borrowing costs (29.1) (21.3) Underlying profit before tax Relates to market reform restructuring costs incurred preparing the business for open competition in the non-household retail market 47
48 Profit after tax reconciliation m Year ended 31 March Reported profit after tax Adjustments: Water quality incident Flooding incidents in Dec 15 (net of insurance proceeds recognised) 1.4 (0.6) Non-household retail market reform Restructuring costs Profit on disposal of non-household retail business (22.1) - Net fair value losses/(gains) on debt and derivative instruments (24.3) 26.3 Interest on swaps and debt under fair value option Net pension interest income (10.2) (3.1) Capitalised borrowing costs (29.2) (21.3) Deferred tax credit - change in tax rate (58.2) (112.5) Agreement of prior years' tax matters (15.5) (3.4) Tax in respect of adjustments to underlying profit before tax 6.2 (10.9) Underlying profit after tax Basic earnings per share (pence) Underlying earnings per share (pence) Relates to market reform restructuring costs incurred preparing the business for open competition in the non-household retail market 48
49 Underlying operating costs Movements m Year ended 31 March Movement Revenue 1, ,730.0 Employee costs (140.9) (143.7) 2.8 Hired and contracted services (93.4) (96.8) 3.4 Property rates (91.6) (86.3) (5.3) Materials (62.8) (62.7) (0.1) Power (68.7) (65.0) (3.7) Bad debts (29.9) (39.2) 9.3 Regulatory fees (26.8) (24.9) (1.9) Third party wholesale charges (3.0) (15.1) 12.1 Cost of properties disposed (8.6) (10.5) 1.9 Other expenses (42.2) (49.8) 7.6 (567.9) (594.0) 26.1 Infrastructure renewals expenditure (IRE) (148.3) (168.2) 19.9 Depreciation and amortisation (364.9) (363.7) (1.2) Total underlying operating expenses (1,081.1) (1,125.9) 44.8 Underlying operating profit Adjustments: Water quality incident - (24.8) Flooding incidents (net of insurance proceeds) (1.5) 0.6 Business retail market reform 1 (5.8) (11.1) Restructuring costs (10.1) (0.9) Reported operating profit Relates to market reform restructuring costs incurred preparing the business for open competition in the business retail market 49
50 Bad debt and cash collection Sustainable improvement Household bad debt as a percentage of regulated revenue reduced to 2.5% in 2016/17 from 3.0% in 2015/16 Reflects Better cash collection in both 2015/16 and 2016/17 More help for customers struggling to pay Bad debt will continue to be one of our principal challenges because the North West is the most deprived region in England 50
51 Finance expense Underlying interest charge lower m Year ended 31 March Investment income Finance expense (202.7) (224.4) (189.0) (219.4) Less net fair value (gains)/losses on debt and derivative instruments (24.3) 26.3 Adjustment for interest on swaps and debt under fair value option Adjustment for net pension interest income (10.2) (3.1) Adjustment for capitalised borrowing costs (29.2) (21.3) Underlying net finance expense (237.3) (201.0) Average notional net debt 6,232 5,853 Average underlying interest rate 3.8% 3.4% Effective interest rate on index-linked debt 3.7% 2.8% Effective interest rate on other debt 3.9% 4.2% 51
52 Finance expense: index-linked debt Cash benefit for the group m Year ended 31 March Cash interest on index-linked debt (48.2) (51.2) RPI adjustment to index-linked debt principal - 3 month lag 1 (65.6) (27.7) RPI adjustment to index-linked debt principal - 8 month lag 2 (15.1) (10.2) Finance expense on index-linked debt (128.9) (89.1) Interest on other debt (including fair value option debt and swaps) (108.4) (111.9) Underlying net finance expense (237.3) (201.0) Cash interest payment of 48m on c 3.6bn of index-linked debt Increase in indexation charge mainly due to higher RPI on 3 month lagged debt RPI impact on RCV exceeds RPI impact on debt principal 1 Affected by movement in RPI between January 2016 and January Affected by movement in RPI between July 2015 and July
53 Financial position Robust capital structure m At 31 March Property, plant and equipment 10, ,031.4 Retirement benefit surplus Other non-current assets Cash Other current assets Total derivative assets Total assets 12, ,906.8 Gross borrowings (7,384.5) (6,978.0) Other non-current liabilities (1,620.8) (1,592.5) Other current liabilities (349.5) (369.1) Total derivative liabilities (249.7) (261.7) Total liabilities (9,604.5) (9,201.3) TOTAL NET ASSETS 2, ,705.5 Share capital Share premium Retained earnings 1, ,878.8 Other reserves SHAREHOLDERS' EQUITY 2, ,705.5 NET DEBT 1 (6,578.7) (6,260.5) 1 Net debt includes cash, borrowings and derivatives 53
54 Movement in net debt * Moderate increase in line with expectations * Net debt includes derivatives which incorporate regulatory swaps 54
55 Derivative analysis Derivatives intrinsically linked to debt m At 31 March Derivatives hedging debt Derivatives hedging interest rates beyond 2015 (243.0) (242.1) Derivatives hedging commodity prices (9.0) (18.5) Total derivatives assets and liabilities Derivatives hedging debt; hedge our non index-linked debt into sterling, floating interest rate debt. Typically these are designated in fair value hedge accounting relationships Derivatives hedging interest rates beyond 2015; fix our sterling interest rate exposure beyond This is in line with our strategy of fixing interest on a 10 year rolling average basis. This is supplemented by fixing substantially all remaining floating exposure across the future regulatory period around the time of the price control determination Derivatives hedging commodity prices; fix a proportion of our future electricity prices in line with our policy Derivatives are included within net debt to eliminate, to a certain extent, the fair value recognised in borrowings and thereby present a more representative net debt figure Further details of our group hedging strategy can be found in the Group financial statements 55
56 Cash flow statement Cash from operations covers investing activities m Year ended 31 March Net cash generated from operating activities Net cash used in investing activities (804.6) (676.8) Net cash generated from/(used in) financing activities 22.0 (46.4) Net movement in cash 38.2 (37.6) 56
57 ODI performance 2016/17 Additional detail on selected ODIs
")

58 Outcome delivery incentives (ODIs) Wastewater ODIs strong performance areas Worse Better Worse Better 58
")

59 Outcome delivery incentives (ODIs) Wastewater ODIs challenging targets Worse Better Worse Better 59
 Water")

60 Outcome delivery incentives (ODIs) Water ODIs challenges in 2016/17 Better Worse Better Worse 60

61 Outcome delivery incentives (ODIs) Water ODIs best ever leakage performance Better Worse Best ever leakage performance Significant focus on detection, repair times and pressure management Self learning pressure management valves with new central control Systems Thinking approach in action 61
62 Financial risk reduction
63 63
64 Risk reduction Pensions Innovative mechanism reduces funding risk Innovative inflation funding mechanism (IFM) designed to facilitate: use of UU s natural RPI hedge a lower risk investment strategy Natural RPI hedge pension scheme deficit funding based on fixed inflation assumption UU contributions flexed for difference between assumption and actual RPI inflation risk hedged through RPI indexation of RCV IFM covers approximately half the pension scheme liabilities, with the other half covered by external market hedging Lower risk investment strategy pension assets <25% equities or other high risk assets underlying interest rates largely hedged through external market swaps and gilts approximately 50% of liabilities hedged for inflation through external market swaps and index-linked gilts Significantly less volatility in UU pension scheme funding levels 64
65 PR14 regulatory framework and final determination
66 Price control structure for Wholesale Water Domestic Retail Business Retail Wholesale Waste Water Cost to Serve Default Tariff 66

67 Ofwat s PR14 final methodology Notional capital structure retained Continuation of RCV approach for wholesale controls; indexed to RPI Companies permitted to submit special factor claims 67

68 Price Review Building blocks for allowed Wholesale revenues 68
69 Ofwat s final determination December 2014 Allowed revenues m AMP6 total Wholesale water (2012/13 prices) ,331 Wholesale wastewater (2012/13 prices) ,954 Wholesale revenue (2012/13 prices) 1,429 1,443 1,458 1,472 1,483 7,285 Retail household (nominal prices) Retail Non-household (nominal prices) Retail revenue (nominal prices) Total revenue (variable price base)* 1,597 1,608 1,616 1,626 1,640 8,087 * Not consistent with statutory accounting / IFRS revenues 69
70 Ofwat s final determination December 2014 Adjustments for performance Revenue adjustments largely accepted: 132m allowed relating to period derives mainly from revenue correction mechanism and opex incentive allowance Good serviceability performance: did not receive a penalty all four asset classes rated at least stable for 2013/14 Significant improvements in SIM moved UU into no penalty zone notable achievement given AMP5 starting position as an outlier 70
71 Ofwat s final determination December 2014 Wholesale price controls Wholesale totex FD threshold of 5,328m 1 (2012/13 prices) 188m below UU October proposal of 5,516m but 427m higher than DD, reflecting additional totex exclusions accepted Wholesale totex in revenue calculation of 5,296m 2 (2012/13 prices) split: 2,356m water and 2,940m wastewater Wholesale pay as you go ratios: water =66%, wastewater =50% pay as you go ratio flexed in line with allowed totex Allowed wholesale revenue of 7,285m (2012/13 prices) split: 3,331m water and 3,954m wastewater Nominal growth in the RCV of c 1.5bn (c15%) across comprising c 0.2bn real growth and c 1.3bn RPI uplift (assuming 2.5% p.a. RPI) 1 Includes pension deficit repair allowances 2 Combines Ofwat s estimates of efficient costs with the companies forecasts in the ratio 75:25. Excludes pension deficit repair allowances 71
72 Ofwat s final determination December 2014 Retail price controls Allowed retail household revenue of 616m (nominal prices) 20m p.a. special factor claim relating to income deprivation allowed reflects impact of the extreme levels of deprivation in the North West on our costs includes bad debt and associated costs Allowed retail non-household revenue of 186m (nominal prices) No inflationary increases allowed on retail price controls 72
73 /household Ofwat s final determination December 2014 Average household bills 500 Average household customer bill - combined ( ) 475 RPI* Average bill / / / / / /20 *Assumes 3% p.a. RPI inflation from 2017/18 to 2019/20 73
74 Impact of RPI inflation Short-term timing differences 2016/17 Regulated revenue Nov 14 to Nov 15 RPI 1 movement --> 1 Apr 16 price limits (2016/17 financial year) Dividend policy (target of at least RPI p.a.) Nov 14 to Nov 15 RPI --> 2016/17 dividends (mirrors RPI in price limits) Regulatory capital value (RCV) Opening RCV inflated by Mar 16 to Mar 17 RPI Plus RCV additions (from totex) in the year --> 31 Mar 17 RCV (year-end gearing calc.) Index-linked debt 2 Jan 16 to Jan 17 --> adjustment to principal for 2016/17 (debt on 3 month lag) Jul 15 to Jul 16 --> adjustment to principal for 2016/17 (debt on 8 month lag) 1 Retail Prices Index (RPI) 2 Indexation of principal is calculated based on monthly movements in RPI 74
75 Recent UK regulated water M&A transactions
76 Premium to RCV Recent UK regulated water transactions Premium to RCV 60% UK regulated water M&A transactions 50% Dee Valley** 40% 30% 20% Cambridge S Staffs Mid Kent Sutton Bristol Southern S East East Surrey Yorkshire Thames Anglian Northumbrian Sutton & East Surrey Veolia UK water only companies Bournemouth* 10% 0% Jan 03 Jan 04 Jan 05 Jan 06 Jan 07 Jan 08 Jan 09 Jan 10 Jan 11 Jan 12 Jan 13 Jan 14 Jan 15 Jan 16 Jan 17 *Bournemouth acquisition c25% RCV premium based on a book value of debt, but >50% RCV premium based on fair value of debt **Dee Valley acquisition c50% RCV premium based on a book value of debt, but c100% RCV premium based on fair value of debt Source: JP Morgan to Dec 10, Deutsche Bank from Jan 11 76
77 Cautionary statement This presentation contains certain forward-looking statements with respect to the operations, performance and financial condition of the group. By their nature, these statements involve uncertainty since future events and circumstances can cause results and developments to differ materially from those anticipated. The forward-looking statements reflect knowledge and information available at the date of preparation of this presentation and the company undertakes no obligation to update these forward-looking statements. Nothing in this presentation should be construed as a profit forecast. Certain regulatory performance data contained in this presentation is subject to regulatory audit. 77
78
STRONG PERFORMANCE AND ON TRACK TO MEET OUR TARGETS HALF YEAR RESULTS FOR THE SIX MONTHS ENDED 30 SEPTEMBER 2016
 United Utilities Group PLC 23 November STRONG PERFORMANCE AND ON TRACK TO MEET OUR TARGETS HALF YEAR RESULTS FOR THE SIX MONTHS ENDED 30 SEPTEMBER Highlights Further improvements in customer satisfaction:
HALF YEAR RESULTS FOR THE SIX MONTHS ENDED 30 SEPTEMBER 2017
 United Utilities Group PLC 22 November HALF YEAR RESULTS FOR THE SIX MONTHS ENDED 30 SEPTEMBER Customer focus delivers further improvements A leading company for customer satisfaction Doubling the number
Company specific adjustments to the WACC A report prepared for Ofwat
 www.pwc.co.uk Company specific adjustments to the WACC A report prepared for Ofwat August 2014 Contents Executive Summary 4 1. Introduction 7 Background 7 Structure of this report 8 2. Company-specific
FULL YEAR RESULTS FOR THE YEAR ENDED 31 MARCH 2017
 United Utilities Group PLC 25 May 2017 FULL YEAR RESULTS FOR THE YEAR ENDED 31 MARCH 2017 Industry leading customer satisfaction, innovation and operational performance Record SIM scores resulting in upper
INTERIM RESULTS. Six months ended 30 September th November 2015
 INTERIM RESULTS Six months ended 30 September 2015 26th November 2015 LIV GARFIELD Chief Executive Officer 2 By 2020 to be the most trusted water company Delivering an outstanding customer experience,
Financial Performance Monitoring,
 Financial Performance Monitoring, 2016-2017 Final Report 19 February 2018 Submitted to Consumer Council for Water by: Economic Consulting Associates Economic Consulting Associates Limited 41 Lonsdale Road,
FULL YEAR RESULTS FOR THE YEAR ENDED 31 MARCH 2018
 United Utilities Group PLC 24 May 2018 FULL YEAR RESULTS FOR THE YEAR ENDED 31 MARCH 2018 Putting customers first Customers benefiting from better service, greater resilience and improved efficiency Delivering
PR19 UPDATE. 4 September 2018
 PR19 UPDATE 4 September 2018 CREATING OUR PLAN A plan that starts with people The most the most in-depth programme of customer engagement we've ever carried out An outside-in approach: talking to people
HALF YEAR 2017/18 RESULTS
 HALF YEAR 2017/18 RESULTS 23 November 2017 Upper Derwent Valley, Peak District National Park DISCLAIMERS Cautionary statement regarding forward-looking statements This document contains statements that
UNITED UTILITIES PR19 BUSINESS PLAN SUBMISSION
 United Utilities Group PLC 3 September 2018 UNITED UTILITIES PR19 BUSINESS PLAN SUBMISSION United Utilities Water Limited has today submitted its business plan covering the 2020-25 period. Highlights of
2019 PRICE REVIEW UPDATE
 2019 PRICE REVIEW UPDATE 14 JULY 2017 Tittesworth Reservoir, Staffordshire AGENDA Overall approach PR19 new news Customer ODIs (1) Totex Retail Financing New markets PR19 Timetable Summary Liv Garfield
Interim Results 6 months ended 30 September November 2013 London
 Interim Results 6 months ended 30 September 2013 26 November 2013 London Disclaimers This presentation contains certain forward-looking statements with respect to Severn Trent's financial condition, results
Good morning and welcome ladies and gentlemen to our half year results presentation. The first half of this financial year has been a very busy
 1 Good morning and welcome ladies and gentlemen to our half year results presentation. The first half of this financial year has been a very busy period for us. I will be talking about political and regulatory
FORECASTS OF COMMON PERFORMANCE COMMITMENTS
 FORECASTS OF COMMON PERFORMANCE COMMITMENTS Report for Yorkshire Water August 2018 This document provides forecasts for four of the common performance commitments over AMP7. Using three separate approaches,
HALF YEAR RESULTS FOR THE SIX MONTHS ENDED 30 SEPTEMBER 2018
 United Utilities Group PLC 21 November HALF YEAR RESULTS FOR THE SIX MONTHS ENDED 30 SEPTEMBER Customers continue to be at the heart of everything we do Delivering customer service improvements through
United Utilities Water Limited PR14 Reconciliation Executive Summary and Overview July 2018
 United Utilities Water Limited PR14 Reconciliation Executive Summary and Overview July 2018 Copyright United Utilities Water Limited 2018 1 Background and purpose of this document During 2018, all Water
PR19 FINAL METHODOLOGY
 PR19 FINAL METHODOLOGY 18 December 2017 Draycote Water, Warwickshire AGENDA Our thoughts on PR19 Areas of specific interest Momentum into AMP7 Levers of outperformance Timeline & Conclusions Q&A Liv Garfield
HALF YEAR RESULTS FOR THE SIX MONTHS ENDED 30 SEPTEMBER 2014
 United Utilities Group PLC 26 November HALF YEAR RESULTS FOR THE SIX MONTHS ENDED 30 SEPTEMBER Continuing operations (Restated 1 ) Revenue 859.4m 845.7m Underlying operating profit 2 343.1m 339.8m Operating
FULL YEAR 2017/18 RESULTS 23 MAY 2018
 FULL YEAR 2017/18 RESULTS 23 MAY 2018 1 DISCLAIMERS Cautionary statement regarding forward-looking statements This document contains statements that are, or may be deemed to be, forward-looking statements
Preliminary Results Year ended 31 March May 2012 The Lincoln Centre, London
 Preliminary Results Year ended 31 March 2012 30 May 2012 The Lincoln Centre, London Mike McKeon Finance Director Highlights 2010/11 2011/12 Change % Group turnover ( m) 1,711.3 1,770.6 3.5 Profit before
H1 18/19 RESULTS. 22 November 2018
 H1 18/19 RESULTS 22 November 2018 DISCLAIMERS Cautionary statement regarding forward-looking statements This document contains statements that are, or may be deemed to be, forward-looking statements with
South West Water: focused on PR19 Analyst & Investor Presentation. 15 September 2017
 South West Water: focused on PR19 Analyst & Investor Presentation 15 September 2017 Agenda Delivering our strategy PR19 methodology reflections Our WaterFuture vision to 2050 Conclusions and Q&A Close
A reduction of over 1 billion in expenditure compared to AMP5. Innovation, efficiency and use of market mechanisms are contributors to lower costs.
 1 Good morning everyone, I m Steve Mogford, Chief Executive of United Utilities, and I d like to welcome you all to today s webcast presentation. I m going to take about 20 minutes to take you through
Cover sheet. Introduction
 Cover sheet Introduction These guidance tables support companies in completing the pro-forma for their Business plan presentations to Ofwat Board members and senior leadership that will take place during
Preliminary Results. Year ended 31 March Presentation 29 May 2009
 Preliminary Results Year ended 31 March 2009 Presentation 29 May 2009 Disclaimers For the purposes of the following disclaimers, references to this "document" shall be deemed to include references to the
Preliminary Results. Year ended 31 March May 2010 The Lincoln Centre, London
 Preliminary Results Year ended 31 March 2010 28 May 2010 The Lincoln Centre, London Sir John Egan Chairman Mike McKeon Finance Director Highlights 2008/09 2009/10 Change m m % Group Turnover 1,642 1,704
Investor summary. Our Fast Track Plan
 Investor summary Our Fast Track Plan An introduction from the Chief Executive We re truly delighted Severn Trent has been selected as one of only three Fast Track companies by Ofwat in its assessment of
South West Water Business Plan Update Ofwat s Draft Determination
 South West Water Business Plan Update 2015-20 Ofwat s Draft Determination Contents 01 Highlights 02 Executive summary 04 Key revenue building block components Appointee Wholesale Retail Returns 10 Performance
Cover sheet. Introduction. Instructions Please select your company from this drop down list: Submission
 Cover sheet Introduction These guidance tables support companies in completing the pro-forma for their Business plan pre September-October 2018. The tables include references to the relevant PR19 business
SEVERN TRENT INVESTOR ROADSHOW. Upper Derwent Valley, Peak District National Park
 SEVERN TRENT INVESTOR ROADSHOW Upper Derwent Valley, Peak District National Park 1 THE WATER SECTOR IN ENGLAND AND WALES Listed companies: - Severn Trent - United Utilities - Pennon (SW Water) Inflation-linked
Interim Results 6 months ended 30 September The Lincoln Centre, London
 Interim Results 6 months ended 30 September 2012 27 November 2012 27 November 2012 The Lincoln Centre, London Highlights Financial performance in line with expectations Enhanced investment programme delivering
Annual Performance Report 2017 Introduction
 Introduction Copyright United Utilities Water Limited 2017 1 Introduction Contents Introduction... 3 Executive Summary... 8 Overview of the year... 9 Our customer service and operational performance...
Notes to the financial statements appendices
 A4 Financial risk management Risk management The board is responsible for treasury strategy and governance, which is reviewed on an annual basis. The treasury committee, a subcommittee of the board, has
Developments in the allowed cost of capital
 Developments in the allowed cost of capital Moody s 2017 UK Water Sector Conference London, UK Sahar Shamsi, Senior Consultant 17 October 2017 Overview The Ofwat PR19 WACC not only matters for the water
United Utilities Group PLC. Annual Report and Financial Statements for the year ended 31 March 2015
 helping life flow smoothly United Utilities Group PLC Annual Report and Financial Statements for the year ended 31 March 2015 United Utilities at a glance United Utilities is the UK s largest listed water
Financial resilience analysis
 Appendix 13g: Financial resilience analysis Contents Objective 3 Method 3 Reverse stress testing 3 a. Method 3 b. Results 4 Forward stress testing 7 a. Method 7 b. Results 7 c. Summary 9 Scenarios prescribed
Delivering Water 2020: consultation on PR19 methodology Guidance on business plan data tables
 11 July 2017 Trust in water Delivering Water 2020: consultation on PR19 methodology Guidance on business plan data tables Supporting document to the proposed data tables www.ofwat.gov.uk 1 About this document
Preliminary Results. Year ended 31 March Presentation 5 June 2008
 Preliminary Results Year ended 31 March 2008 Presentation 5 June 2008 0 Disclaimers For the purposes of the following disclaimers, references to this "document" shall be deemed to include references to
Draft price control determination notice: company-specific appendix South West Water
 April 2014 Setting price controls for 2015-20 Draft price control determination notice: company-specific appendix South West Water Contents A1 Overview 2 A2 Wholesale water 6 A3 Wholesale wastewater 21
Interim Results. 6 months to 30 September November 2010 The Lincoln Centre, London
 Interim Results 6 months to 30 September 2010 23 November 2010 The Lincoln Centre, London Disclaimers For the purposes of the following disclaimers, references to this "document" shall be deemed to include
SEVERN TRENT INVESTOR ROADSHOW. New pipeline from Lickhill on the River Severn to Frankley water treatment works
 SEVERN TRENT INVESTOR ROADSHOW New pipeline from Lickhill on the River Severn to Frankley water treatment works INVESTMENT CASE THE WATER SECTOR Inflation-linked regulatory model offering attractive dividend
Our finances explained. October 2016
 Our finances explained. October 2016 About our finances. Steve Robertson Chief Executive Officer We are the UK s largest water and wastewater services provider, serving London and the Thames Valley, with
Credit Opinion: Thames Water Utilities Ltd.
 Credit Opinion: Thames Water Utilities Ltd. Global Credit Research - 20 Sep 2013 United Kingdom Ratings Category Outlook Corporate Family Rating -Dom Curr Thames Water Utilities Cayman Finance Limited
United Utilities Group PLC
 United Utilities Group PLC Annual Report and Financial Statements for the year ended 31 March 2017 Welcome to our Annual Report and Financial Statements for the year ended 31 March 2017 As the UK s largest
Preliminary Announcement of Annual Results 24 May 2016 Results for the year to 31 March 2016
 Preliminary Announcement of Annual Results 24 May 2016 Results for the year to 31 March 2016 A promising start to the new regulatory period Group financial results in line with expectations and reflect
United Utilities Water Limited
 Annual Report and Financial Statements for the year ended 31 March 2017 Contents Strategic report Directors, advisers and other information 2 Chairman and Chief Executive Officer s review 3 What we do
London Roadshow Private Client Investment Managers (PCIMs)
") London Roadshow Private Client Investment Managers (PCIMs) March 2018 Environmental Sustainable Profitable Pennon Group plc 2017 2018 Disclaimer For the purposes of the following disclaimers, references
London Roadshow Private Client Investment Managers (PCIMs) March 2018 Environmental Sustainable Profitable Pennon Group plc 2017 2018 Disclaimer For the purposes of the following disclaimers, references
Balancing Risk & Reward at PR19
 Balancing Risk & Reward at PR19 A report for United Utilities Water Limited August 2017 EY i Important Notice This Report (Report) was prepared by Ernst & Young LLP for United Utilities Water Limited (UU)
Preliminary Announcement of Annual Results 29 May 2014 Results for the year to 31 March 2014
 Preliminary Announcement of Annual Results 29 May 2014 Results for the year to 31 March 2014 Highlights In-line or below inflation bill increases for last four years Severn Trent remains lowest average
FULL YEAR RESULTS FOR THE YEAR ENDED 31 MARCH 2011
 United Utilities Group PLC 26 May (continuing operations) FULL YEAR RESULTS FOR THE YEAR ENDED 31 MARCH (restated)* Underlying operating profit** 596.4 706.3 Underlying profit before taxation** 329.2 482.6
15B. TARGET CREDIT RATINGS FOR WATER COMPANIES AT PR19
 Anglian Water 15B. TARGET CREDIT RATINGS FOR WATER COMPANIES AT PR19 Target credit ratings for water companies at PR19 13 February 2018 Anton Krawchenko Director, Capital and Debt Advisory Office: +44
Half Yearly Financial Report 23 November 2017 Interim results for the six months to 30 September 2017
 Half Yearly Financial Report 23 November 2017 Interim results for the six months to 30 September 2017 Strong customer delivery and investment across the network drive continued progress Group financial
PR19 Business Plan Summary for Investors
 PR19 Business Plan 2020-2025 Summary for Investors PR19 Business Plan 2020-2025 Summary for Investors Severn Trent Plc 1 Contents 01 Executive Summary 02 Financial Summary 03 Lowest Possible Bills 04 Investment
Setting Price limits for PR09. Mark Worsfold 25 November 2010
 Setting Price limits for 2010-15 PR09 Mark Worsfold 25 November 2010 http://www.ofwat.gov.uk/pricereview/ Water today, water tomorrow Ofwat s strategy Water today, water tomorrow Regulatory framework Quality
Yorkshire Water Services Ltd
 Yorkshire Water Appendix A Business Review Business Review Appendix A Yorkshire Water Services Ltd Interim Report and Financial Statements Registered number: 2366682 Yorkshire Water Business Review Business
Half Year Results 2016/17 for the period ended 30 September 2016 Building Momentum, Driving Growth
 25 November 2016 Half Year Results 2016/17 for the period ended 30 September 2016 Building Momentum, Driving Growth Chris Loughlin, Pennon Chief Executive said: Pennon has delivered a good performance
performance level - forecast PCL met? forecast forecast outperformance payment or underperformance penalty in-period ODIs
 Page 1 of 13 PR19 Business plan data tables - June 2018 Water resources Water network plus Wastewater network plus Bioresources (sludge) 4 Residential retail Business retail Direct procurement for customers
A11: Aligning risk and return. Supporting material
 A11: Aligning risk and return Supporting material OVERVIEW This appendix provides additional material in support of the Risk and Return section of our plan. In particular, it provides some additional explanation
OUR PLAN Representations on the Draft Determination October 2014 I NN
 OUR PLAN 2015-20 Representations on the Draft Determination October 2014 I NN OVA TI ON ON ATI OR AB LL CO TRAN SFORMATION 1 2 3 4 5 6 7 8 9 10 11 12 Executive Summary Executive Summary Our Representations
Credit Opinion: Dwr Cymru Cyfyngedig. Global Credit Research - 23 Sep Ratings. Contacts. Key Indicators
 Credit Opinion: Dwr Cymru Cyfyngedig Global Credit Research - 23 Sep 2010 Cardiff, United Kingdom Ratings Category Outlook Corporate Family Rating Moody's Rating Stable A3 Contacts Analyst Phone Stefanie
SEVERN TRENT INVESTOR ROADSHOW. Upper Derwent Valley, Peak District National Park
 SEVERN TRENT INVESTOR ROADSHOW Upper Derwent Valley, Peak District National Park THE WATER SECTOR IN ENGLAND AND WALES Listed companies: - Severn Trent - United Utilities - Pennon (SW Water) Key sector
Severn Trent Water Accounting Separation Methodology Statement
 Severn Trent Water Accounting Separation Methodology Statement 1. Business structure, systems and sources of information used to populate tables 2. Population of lines within the accounting separation
Costs and performance
 PERFORMANCE Overview This report examines Scottish Water s costs and performance in 2008-09. Contact Katherine Russell Director of Corporate Affairs T 01786 430200 E enquiries@watercommission.co.uk INTRODUCTION
Annual Performance Report 2017/18. Part 3 - Performance Summary
 Annual Report 217/18 Part 3 - Page 1 3 2 2.1 By reference to Led Success Promises 4 2.2 of overall 5 2.3 By reference to Outcomes and PR14 Price Controls 7 2.4 against Individual 8 3 APR Tables 3A - Outcome
A challenging initial assessment for the water companies in England and Wales
 Agenda Advancing economics in business A challenging initial assessment for the water companies in England and Wales On 31 January, Ofwat published its Initial Assessment of Plans as part of the current
Annual Report United Utilities Group PLC
 Annual Report United Utilities Group PLC Annual Report and Financial Statements for the year ended 31 March 2016 United Utilities is the UK s largest listed water company Through its subsidiary, United
London Investor Roadshow February 2017
 London Investor Roadshow February 2017 Disclaimer For the purposes of the following disclaimers, references to this document shall mean this presentation pack and shall be deemed to include references
United Utilities Water Limited
 helping life flow smoothly United Utilities Water Limited (formerly United Utilities Water PLC) Report and Financial Statements for the year ended 31 March 2015 Contents Strategic report Directors, advisers
Presentation Results for the half year ended 30 June 2009
 Hastings Funds Management Limited ABN 27 058 693 388 AFSL No. 238309 Level 16, 90 Collins Street Melbourne VIC 3000 Australia T +61 3 8650 3600 F +61 3 8650 3701 www.hfm.com.au Melbourne, London, New York,
Ofwat PR19 review. The Cost of Capital setting the scene for PR19. Economic Consulting Associates. May 2017
 Ofwat PR19 review The Cost of Capital setting the scene for PR19 May 2017 Submitted to the Consumer Council for Water by: Economic Consulting Associates Economic Consulting Associates Limited 41 Lonsdale
Thames Water Utilities Limited Investor Report 30 September 2017
 Thames Water Utilities Limited Investor Report 30 September 2017 1 Important Notice This report is being distributed in fulfilment of a document, the Common Terms Agreement (the CTA ), which governs the
Staff Paper 3. Financing Scottish Water. 3.1 Introduction
 Staff Paper 3 Financing Scottish Water This staff paper has been produced by our office to assist stakeholders in responding to the Draft Determination. The material reflected in this staff paper has informed
Preliminary Announcement of Annual Results 23 May 2018 Results for the year to 31 March 2018
 Preliminary Announcement of Annual Results 23 May 2018 Results for the year to 31 March 2018 Customer focus, significant investment and operational delivery drive strong performance Keeping customers at
Half Yearly Financial Report 26 November 2015 Interim Results for the six months to 30 September 2015
 Half Yearly Financial Report 26 November 2015 Interim Results for the six months to 30 September 2015 Severn Trent Plc Good start to new regulatory period Good start to the year, underpinning our intention
Recommendations for the Weighted Average Cost of Capital
 Recommendations for the Weighted Average Cost of Capital 2020-2025 Final Report 27 November 2017 Submitted to the Consumer Council for Water by: Economic Consulting Associates Economic Consulting Associates
Our finances explained.
 Our finances explained. October 2017 About our finances. Every day, 365 days a year, we provide 2.6 billion litres of one of life s essential ingredients - high quality drinking water - to nearly 10 million
Severn Trent Water Accounting Separation Methodology Statement
 1. Business Structure Accounting Separation Methodology Statement 2015/16 Severn Trent Water Accounting Separation Methodology Statement 2. Population of lines within the accounting separation tables 3.
PROPOSAL FOR ADDITIONAL FINANCIAL COVENANTS MAY 2015
 PROPOSAL FOR ADDITIONAL FINANCIAL COVENANTS MAY 2015 Affinity Water Contacts Duncan Bates 01707 277 202 duncan.bates@affinitywater.co.uk CFO Joined Veolia Water UK in 1992 Appointed CFO of Affinity Water
Thames Water Utilities Limited Investor Report 30 September 2016
 Thames Water Utilities Limited Investor Report 30 September 2016 1 Important Notice This report is being distributed in fulfilment of a document, the Common Terms Agreement (the CTA ), which governs the
Funding efficiently incurred embedded debt at PR19
 Funding efficiently incurred embedded debt at PR19 A report for SES Water June 2017 Disclaimer This report (Report) was prepared by Ernst & Young LLP for Sutton and East Surrey Water plc (trading as SES
Half Yearly Financial Report 22 November 2018 Interim results for the six months to 30 September 2018
 Half Yearly Financial Report 22 November 2018 Interim results for the six months to 30 September 2018 Continued strong performance while investing for the future Ongoing delivery for customers Upper quartile
PR19 Business Plan Presentation Pro-forma August 2018 update
 PR19 Business Plan Presentation Pro-forma August 2018 update Briefing for Ofwat Non-Executive Directors and senior leadership As indicated in our final methodology for the 2019 price review (PR19) published
Appendix 13f Financeability analysis Price controls. Appendix 13f: Financeability Price Controls
 Appendix 13f: Financeability Price Controls Contents 1. Objective 3 2. Method 3 a. Key financial ratios to be tested 3 b. Target ratios 4 c. Ratio calculation 4 d. Comparison to target 5 3. Results 6 a.
ACCOUNTING SEPARATION STATEMENT Analysis of Operating and Fixed Asset Costs by Business Unit
 ACCOUNTING SEPARATION STATEMENT 2017-18 Analysis of Operating and Fixed Asset Costs by Business Unit 1. PURPOSE OF METHODOLOGY The purpose of this methodology statement is to explain how the totex and
Interim Financial Information and Report. For the six months ended 30 September 2016 (Unaudited)
") Interim Financial Information and Report For the six months ended () Page 2 Southern Water Services Interim Financial Information and Report Contents 3 Interim management report operational performance
Interim Financial Information and Report For the six months ended () Page 2 Southern Water Services Interim Financial Information and Report Contents 3 Interim management report operational performance
Yorkshire Water Services Limited
 CREDIT OPINION Yorkshire Water Services Limited Update following outlook change to stable Update Summary Rating Rationale RATINGS Yorkshire Water Services Limited Domicile United Kingdom Long Term Rating
Northumbrian Water response to Water 2020: consultation on the approach to the cost of debt for PR19
 Northumbrian Water response to Water 2020: consultation on the approach to the cost of debt for PR19 Overview We welcome the consultation on the approach to the cost of debt. In preparing this response,
GO-AHEAD FULL YEAR RESULTS for the year ended 30 June September 2012
 GO-AHEAD FULL YEAR RESULTS for the year ended 30 June 2012 6 September 2012 FULL YEAR RESULTS OVERVIEW A strong performance; results in line with management expectations Record passenger levels across
February Roadshow (including Half Year Results 2018/19)
") (including Half Year Results 2018/19) Pennon Group plc 2018 Disclaimer For the purposes of the following disclaimers, references to this document shall mean this presentation pack and shall be deemed to
(including Half Year Results 2018/19) Pennon Group plc 2018 Disclaimer For the purposes of the following disclaimers, references to this document shall mean this presentation pack and shall be deemed to
Investor Report For the quarter ended 31 March 2017
 Investor Report For the quarter ended 31 March 2017 Important Notice This report is being distributed in fulfilment of a document, the Common Terms Agreement (CTA), which governs the company s obligations
Notional company ratios. & financial resilience
 Notional company ratios & financial resilience 1 Context Since privatisation the water sector has maintained strong investment grade credit rating; this has benefitted customers as the lower cost of financing
ANNOUNCEMENT OF PRELIMINARY RESULTS
 The leading high service distributor to engineers worldwide ANNOUNCEMENT OF PRELIMINARY RESULTS YEAR ENDED 31 MARCH 2009 29 May 2009 Agenda Overview and current trading Ian Mason Financial performance
2 nd Quarter Earnings Call Tuesday, August 7, 2018
 Delivering today for a brighter tomorrow 2 nd Quarter Earnings Call Tuesday, August 7, 2018 P PPL Corporation 2018 1 Cautionary Statements and Factors That May Affect Future Results Any statements made
ANNUAL. PERFORMANCE REPORT Year ended 31 March 2016
 ANNUAL PERFORMANCE REPORT Year ended 31 March 2016 Contents Introduction 5 Reporting our performance 6 Disclosures required by RAG 3 7 Report of the auditor 8-9 Section 1 - Regulatory financial reporting
H results. innogy SE 11 August 2017 Bernhard Günther CFO
 H1 2017 results innogy SE 11 August 2017 Bernhard Günther CFO Notice This document contains forward-looking statements. These statements are based on the current views, expectations, assumptions and information
BUSINESS OVERVIEW. Strong cash generation and robust balance sheet Stable bus profits support interim dividend increase of 6.5% * Before amortisation
 BUSINESS OVERVIEW Half year results in line with management expectations. Full year expectations lowered due to challenges in GTR and a slowdown in passenger journeys in regional bus Regional bus operating
Annual Performance Report 2016/17. Part 4 Additional regulatory information
 Annual Performance Report 2016/17 Part 4 Additional regulatory information Annual Performance Report 2016/17 4 Additional regulatory information Index Page 4A Non-financial information 1 4B Wholesale totex
Annual Performance Report 2015/16. Part 3 - Performance Summary
 Annual Report 215/16 Part 3 - Page 1 3 2 2.1 By reference to Led Success Promises 4 2.2 of overall performance 5 2.3 By reference to Outcomes and PR14 Price Controls 7 2.4 against Individual 8 3 summary
H1 16 interim results. 22 September 2015
 H1 16 interim results 22 September 2015 Important notice 2 This presentation may include certain forward-looking statements, beliefs or opinions, including statements with respect to the Company s business,
RAG 1.08 Principles and guidelines for regulatory reporting under the new UK GAAP regime
 April 2017 Trust in water RAG 1.08 Principles and guidelines for regulatory reporting under the new UK GAAP regime www.ofwat.gov.uk Contents 1. Introduction 2 2. Current cost accounting 8 Appendix 1: Wholesale