Incentives and Risk Taking in Hedge Funds
|
|
|
- Lorena West
- 5 years ago
- Views:
Transcription
1 Incentives and Risk Taking in Hedge Funds Roy Kouwenberg Aegon Asset Management NL Erasmus University Rotterdam and AIT Bangkok William T. Ziemba Sauder School of Business, Vancouver EUMOptFin3 Workshop University of Bergamo May 17-21, 2004
2 We present a theoretical study of how incentives affect hedge fund risk and returns and an empirical study of the performance of a large group of operating hedge funds. Most hedge fund managers receive a flat fee plus a share of the returns above a benchmark. We investigate how these features of hedge fund fees affect risk taking by the fund manager in the behavioural framework of prospect theory. The performance related component encourages funds managers to take excessive risk. However, risk taking is greatly reduced if a substantial amount of the manager s own money is in the fund as well. Average returns though, both absolute and risk-adjusted, are significantly lower in the presence of incentive fees.
3 What is the impact of incentive fees on hedge fund risk and performance, both in theory and practice? Carpenter (2000) analyses the effect of incentive fees on the optimal investment strategy of a fund manager in a continuous-time framework: A manager with an incentive fee increases the risk of the fund s investment strategy if the fund value is below the benchmark specified in the incentive fee contract. This risk taking behaviour is expected, as the fund manager tries to increase the value of the call option on fund value. If the fund value rises above the benchmark the manager reduces volatility, in some cases even below the optimal volatility level of a fund without incentive fees.
4 We extend Carpenter (2000) along two lines: 1. incorporating management fees and 2. Incorporating investments of the manager in the fund. Most fund managers charge a fixed proportion of the fund value as management fee, to cover expenses and provide business income. Management fees should moderate risk taking, as negative investment returns reduce the future stream of income from management fees. Most fund managers invest their own money in the fund. This eating your own cooking, helps to realign the motivation of the fund manager with the objectives of the other investors in the fund. The fact that hedge fund managers typically risk both their career and their own money while managing a fund is a positive sign to outside investors. The personal involvement of the manager, combined with a good and verifiable track record, could explain why outside investors are willing to invest their money in hedge funds, even though investors typically receive very limited information about hedge fund investment strategies and also possibly face poor liquidity due to lock-up periods in some funds. We expect that the hedge fund manager s own stake in the fund is an essential factor influencing the relationship between incentives and risk taking.
5 We analyse the effect of incentive fees on risk taking in a continuous-time framework, taking management fees and the manager s own stake in the fund into account. We do not use a standard normative utility function like HARA for the preferences of the fund manager. We use the behavioural setting of prospect theory - a framework for decision-making under uncertainty developed by Kahneman and Tversky (1979). This utility is based on actual human behaviour observed in experiments. Siegmann and Lucas (2002) argue that loss aversion, an important aspect of prospect theory, can explain the non-normal return distributions of hedge funds. How do hedge fund managers driven by these preferences react to incentive fees. We also derive an expression for the value of the manager s incentive fee, as in Goetzmann, Ingersoll and Ross (2003). It can be worth more than 15% of the fund value.
6 We take into account the fund manager s optimal investment strategy under prospect theory to derive the value of the fee. We find that loss averse hedge fund managers increase risk taking in response to the incentive fees, regardless of whether the fund value is above or below the benchmark. If a substantial amount of the manager s own money in the fund (30% or more), risk taking due to incentive fees is reduced considerably. Finally, the value of the incentive fee option increases enormously as a result of the manager s optimal investment strategy, e.g. from 0.8% to 17% of initial wealth.
7 Model Formulation W(0) = initial wealth of hedge fund manager Y(0) = initial size of the hedge fund v [0,1] is the fraction of the fund owned by the manager Investors own 1-v Management fee α 0 of fund value (1-v)Y(T) Incentive fee β 0 of fund s performance in excess of the benchmark B(T) = (1-v) β max[y(t)-b(t),0] Assume that the fund manager does not hedge his exposure to the fund s value with his wealth outside of the fund Assume that the rate of return on the private portfolio equals the riskless rate R(0) - but the results hold with stochastic returns. The portfolio manager s wealth at the end of period T is (1) W(T) = vy(t) + α(1 - v)y(t) + β(1 -v)max{ Y(T) - B(T), 0 } + (1 + R(0))(W(0) -vy(0)).
8 The utility function is The fund manager has a threshold θ(t) > 0 for separating gains and losses. The parameters 0 < γ 1 1 and 0 < γ 2 1 determine the curvature of the value function over losses and gains respectively. The parameter A > 0 is the level of loss aversion of the hedge fund manager. In prospect theory it is assumed that losses are more important than gains, i.e. A> 1: so the pain of a loss exceeds the positive feeling associated with an equivalent gain. Risky assets with prices S k (0) for k = 1,, K and a riskless asset with price S 0 (0) are available as potential investments for the hedge fund manager. The risky asset prices follow Ito processes with drift rate µ k (t) and volatility σ k (t), where t is between 0 and T, while the riskless asset has a drift rate of r(t) and volatility of zero
9 where the interest rate r(t), the vector of drift rates r(t) and the volatility matrix σ(t) are adapted (possibly path-dependent) processes The fund manager selects a dynamic investment strategy, determined by the weights w k (t) of risky assets k = 1,, K in the fund, and the weight of the riskless asset w 0 (t), at any time t in the continuous interval between 0 and T. For any self-financing vector of portfolio weights w(t) at time 0 t T, the fund value Y(t) then follows the stochastic process (using vector notation) where w 0 (t) = 1 - k w k (t) has been substituted and r denotes a (Kx1) vector of ones
10 The hedge fund manager maximizes the expectation of the value function at the end of the evaluation period T, by choosing an optimal investment strategy for the fund using
11 The effect of incentive fees on implicit loss aversion We analyse the effect of incentive fees on risk taking by examining the value function V(W(T)) of the fund manager at T. We first specify the fund manager personal threshold s Θ(T), separating gains from losses in the value function. The hedge fund manager will only earn incentives fees if the fund value Y(T) exceeds the benchmark value B(T) at the end of the evaluation period. The fund value Y(T) = B(T) is the main point of focus for the manager, separating failure from success. Just achieving the benchmark B(T) would leave the manager with the following amount of personal wealth at the end of the year, W(T) = vb(t) + α(1-v)b(t) + Z(T). We assume that this amount of personal wealth is the threshold that separates gains from losses for the fund manager (7) θ(t) = vb(t) + α(1- v)b(t) + Z(T).
12 Given the threshold specification in equation (7), the condition W(T) θ(t) is equivalent to Y(T) B(T). The manager will consider fund performance below the benchmark as a loss (failure) and performance in excess of the benchmark as a gain (success) leading to additional income from incentive fees. Substituting the expression for W(T) in equation (1) into the value function V(W(T)), yields Since W(T) θ(t) is equivalent to Y(T) B(T) and substituting equation (7) for θ(t) into (8) yields the following expression for the manager s value function
13 We can multiply the value function by a constant, without affecting the solution of the manager s optimal portfolio choice problem (6). We simplify the manager s value function back to the standard format, multiplying V(W(T)) by ( v + (α+β)(1-v) is the implicit level of loss aversion relevant for the optimal portfolio choice problem of the fund manager. Hence, under the mild assumption that the manager s personal threshold for separating gains and losses hinges on the hedge fund s critical level B(T) for earning incentive fees, the manager s objective can be reduced to the standard prospect theory specification in (10) as a function of fund value Y(T), with B(T) as the threshold separating gains from losses and  as the implicit level of loss aversion.
14 Investigation of the effect of incentive fees on risk taking Examination of the expression for the implicit level of loss aversion  in (11). Thus an increase in the incentive fee will reduce the implicit level of loss aversion of the hedge fund manager s optimal portfolio choice problem. Hence, the manager of a hedge fund with a large incentive fee should care less about investment losses than a manager without such a fee, if the fund manager is trying to maximize the expectation of the value function of prospect theory.
15 Proposition 2 considers the impact of the manager s own stake in the fund on the implicit level of loss aversion. Given γ 1 = γ 2, a manager with a large own stake in the fund should optimally care more about losses than a manager without such a stake. The sufficient condition γ 1 = γ 2 means that the value function has the same curvature over gains as over losses. Tversky and Kahneman (1992) have estimated the parameters of the value function of prospect theory from the observed decisions made under uncertainty by a large group of people. A = 2.25 for the average level of loss aversion and γ 1 = γ 2 = 0.88 for the curvature of the value function. Since they did not find a significant difference between γ 1 and γ 2 the condition γ 1 = γ 2 seems plausible.
16 Given these estimated preference parameters, Figure 1 displays the implicit level of loss aversion  as a function of the incentive fee for three different levels of the manager s stake in the fund (v = 5%, v = 20% and v = 50%). Figure 1 demonstrates that the manager s implicit level of loss aversion is 2.25 without incentive fees (v = 0). As the incentive fee increases, the implicit level of loss aversion of the fund manager decreases, indicating that the manager should optimally care less about losses and more about gains due to the convex compensation structure. The negative impact of incentive fees on implicit loss aversion is mitigated to some extent if the manager owns a substantial part the fund.
17
18 The Optimal Investment Strategy with Incentive Fees Before we reduced the value function of the fund manager back to standard format V * (Y(T)), as a function of terminal fund value Y(T). The optimal portfolio choice problem (6) is To facilitate the solution of the optimal portfolio choice problem assume that markets are dynamically complete. Market completeness implies the existence of a unique state price density ζ(t), also known as pricing kernel, defined as
19 Under the assumption of complete markets, Berkelaar, Kouwenberg and Post (2003) solve the optimal portfolio choice problem of a loss averse investor in (6) with the martingale methodology, following Basak and Shapiro (2001). The solution is derived in two steps. First, the optimal fund value Y * (T) is derived as a function of the pricing kernel Y*(T) at the planning horizon (see Proposition 3). Second, the optimal dynamic investment strategy that replicates these fund values is derived under the assumption that the risky asset prices follow Geometric Brownian motions and the riskless rate is constant (see Proposition 4).
20
21
22 To analyze the effect of incentive fees on the investment strategy of the fund manager, we use the fact that the implicit level of loss aversion  of the fund manager decreases as a function of the incentive fee level (see Proposition 1). Proposition 5 shows how a decrease of  affects the optimal fund values Y * (T) at the evaluation date T.
23 Hence an increase of the incentive fee makes the manager seek more payoffs in good states of the world with low pricing kernel (due to the decrease of y) and less in bad states (due to the decrease of ξ * ).
24 The effect of an increase of the incentive fee on the optimal investment strategy Assume that there is only one risky asset, representing equity, with a Sharpe ratio of κ = 0.10 and a volatility of σ = 20%, and a riskless asset with r 0 = 4%. The evaluation period is one year (T = 1) and the fund manager has the standard preference parameters for the value function (A = 2.25, γ 1 = γ 2 = 0.88). The initial fund value is Y(0) = 1, the threshold for the incentive fee is B(T) = 1, the management fee is α = 1% and the manager s own stake in the fund is v = 20%. Given these parameters, Figure 2 shows the optimal weight of risky assets in the fund w * (t), as a function of fund value Y(t) at time t = 0.5. Each line in Figure 2 represents a different level of incentive fee β, ranging from 0% to 30%. The fund manager takes more risk in response to an increasing incentive fee. The increase in risk is more pronounced when fund value drops below the benchmark B(T). Due to the structure of the value function of prospect theory, a fund manager without an incentive fee will increase risk at low fund values as well; incentive fees amplify this behaviour.
25 The effect of an increase of the incentive fee on the optimal investment strategy
26 Figure 3 shows the effect on the optimal investment strategy of changing the manager s own stake in the fund v, given an incentive fee of β = 20%. It demonstrates that an increase of the manager s share in the fund can completely change risk taking. With a stake of 10% or less, the manager behaves extremely risk seeking as a result of the incentive fee. However, with a stake of 30% or more, the investment strategy is similar to the base case of 100% ownership (without an incentive fee).
27
28 Figure 4 shows the manager s initial weight of risky assets w(0), as a function of the incentive fee β. The different lines in Figure 4 represent different levels of the manager s own stake in the fund (v). Again higher incentive fees lead to increased risk taking; the increase in risk taking is more drastic when the managers own stake in the fund is low ( 30%).
29
30 The Value of the Manager s Incentive Fee Option A typical hedge fund charges a fixed fee of 1% to 2% and an incentive fee of 20%. For hedge fund investors it is worthwhile to know what the value of these fees are. We use the framework developed to determine the option value of hedge fund fees. In a complete market, any European option with a set of payoffs X(T) at time T can be priced as follows with the pricing kernel ξ(t) where X(0) is the initial value of the contingent claim. The pay off of the incentive fee at time T under the manager s optimal strategy is X(T) =(1-v) β max{ Y * (T) B(T), 0 } since manager s only charge outsiders a fee (there is no fee on their own investment in the fund). We can find the incentive fee value at time 0 by calculating the expectation in (19).
31
32 Figure 5 plots the value of a 20% incentive fee as a function of the manager s stake in the fund, using the same set of parameters as in Figure 2 (κ = 0.10, σ = 20%, r 0 = 4%, T = 1, Y(0) = 1, B(T) = 1, = 1% and A = 2.25, γ 1 = γ 2 = 0.88). Figure 5 shows that the value of the 20% incentive fee ranges from 0.0% to 17% of the initial fund value, depending on the manager s own stake in the fund. If the manager s stake in the fund is 100%, the manager does not care about the incentive fee and manages the fund conservatively since it is a personal account. However, as the manager s stake in the fund goes to zero, the manager starts to increase the volatility of the investment strategy in order to reap more profits from the incentive fee contract.
33
34 Figure 6 shows the optimal volatility of the fund returns Y(T)/Y(0) as a function of the manager s stake in the fund, given the incentive fee of 20%. The fund manager greatly increases the fund s return volatility as the manager s own stake in the fund decreases, to maximize the expected payoff of the incentive fee. The increase of the value of the incentive fee due to this change in investment behaviour is as much 2125% in this example; from 0.0% to 17% of initial fund value.
35
36 Empirical Analysis of Incentives and Risk Taking in Hedge Funds We use the Zurich Hedge Fund Universe, formerly known as the MAR hedge fund database, provided by Zurich Capital Markets. The database includes a large number of funds that have disappeared over the years, which reduces the impact of survivorship bias. The data starts in January 1977 and ends in November There are 2078 hedge funds in the database and 536 fund of funds. We analyse the data from January 1995 to November 2000 since the database keeps track of funds that disappear starting January The return data is net of management fees and net of incentive fees. The hedge funds in the database are classified into eight different investment styles by the provider: Event-Driven, Market Neutral, Global Macro, Global International, Global Emerging, Global Established, Sector and Short-Sellers. We merge the styles Global International, Global Established and Global Macro into one group, denoted Global Funds, as these three styles have similar investment style descriptions. Global Emerging funds is a separate category, denoted Emerging Markets, as the funds within this style are often unable to short securities and emerging market funds have quite different return characteristics compared to the other global funds.
37
38 We distinguish between funds that were still in the database in November 2000 (alive) and funds that dropped out (dead) and between individual hedge funds and fund of funds. The median incentive fee for hedge funds is 20%. An incentive fee of 20% is the industry standard, and 71.4% of the funds use it. Only 8.5% of all hedge funds do not charge an incentive fee. The median management fee is 1%. The majority of funds (71.5%) charge a fee between 0.5% and 1.5%, while only 4.2% of the funds do not charge a management fee. An investor in fund of funds has to pay fees to the fund of fund manager. On average, fund of funds charge slightly lower fees than individual hedge funds, although the median incentive fee is still 20% (dead and alive funds combined). Only 6.2% of fund of funds do not charge an incentive fee. The median management fee of fund of funds is 1%.
39 Table 1 shows that the hedge funds had an average net asset value of US$98.6 million (75.8 million for dead funds). The net asset value distribution is very positively skewed: the top 25% funds according to size manage about 80% of the total asset value. The database contains 15 hedge funds and 2 fund-of-funds with an average net value of more than US$1 billion. The funds in the database are relatively young, with an average age of 4 years for living funds and 2.6 years for dead funds (same for hedge funds and fund of funds). The relatively young age of the funds has to do with the rapid growth of the hedge fund industry over the period For a study of the performance of the funds in the database over this period see Kouwenberg (2003).
40 Incentives and Risk Taking in Hedge Funds: Empirical Results Empirical studies of incentives and risk taking in the literature typically test whether funds with poor performance in the first half of the year increase risk in the second half of the year, (see e.g.. Brown, Harlow and Starks 1996, Chevalier and Ellison 1997 and Brown, Goetzmann and Park 2001). The idea behind this approach is that funds with an incentive fee, or facing a convex performance-flow relationship, will increase risk after bad performance in the first half of the year to increase the value of their out-of-the-money call option on fund value. Considered within the context of the prospect theory framework applied in this paper, such a test is less meaningful. Loss averse fund managers will always increase risk as their wealth drops below the threshold, regardless of incentive fees (see Figure 2). A more distinguishing effect of incentive fees within the prospect theory framework is that incentives reduce implicit loss aversion and lead to increased risk taking across the board, even at the start of the evaluation period (see Figure 4). We therefore test if the risk of hedge funds returns increases as a function of the fund s incentive fee.
41 Hedge fund returns are non-normal due to the dynamic investment strategies of the funds (see Fung and Hsieh 1997, 2001 and Mitchell and Pulvino 2001). Still, empirical studies of the relationship between risk taking and incentives in hedge funds only consider volatility as a risk measure (Ackermann, McEnally and Ravenscraft 1999, Brown, Goetzmann and Park 2001 and Agarwal, Daniel and Naik 2002), even though volatility can not fully capture the non-normal shape of hedge fund return distributions. We thus focus on non-symmetrical risk measures, namely the 1 st downside moment and maximum drawdown, as well as the skewness and kurtosis of hedge fund returns. The 1 st downside (upside) moment is defined as the conditional expectation of the fund returns below (above) the risk free rate. Maximum drawdown is defined as the worst performance among all runs of consecutive negative returns.
42
43 Table 2 shows the cross-sectional average of ten different risk and return measures of the hedge funds in the database, conditional on the level of the incentive fee. The risk measures are volatility, 1 st downside moment (relative to the risk free rate), maximum drawdown, skewness and kurtosis. The return measures are the fund s mean return and 1 st upside moment. And three riskadjusted performance measures; the Sharpe ratio, Jensen s alpha and the gain-loss ratio. The gain-loss ratio is defined as the ratio of the 1 st upside moment to the 1 st downside moment. Berkelaar, Kouwenberg and Post (2003) demonstrate that the gain-loss ratio can be interpreted as a measure of the investor s implicit level of loss aversion. The last column of Table 2 displays the p-value of an ANOVA-test for differences in means between the incentive fee groups.
44 The first row of Table 2 shows that hedge funds without incentive fee, on average, have considerably higher mean returns than funds that do charge an incentive fee (means are significantly different between groups). The difference in average return after fees between the 93 funds without an incentive fee and the majority of funds with a fee of 20% is 8.5% per year. This gap of 8.5% reduces to 6.2% if we control for differences in investment style between the two groups. Another 3.8% of the performance differential can be explained by the cost of the 20% incentive fee. Hence, only 2.4% of the performance differential remains unaccounted for, which could easily be due to sampling error and does not indicate any significant difference in investment skills. Funds with an incentive fee cannot make up for the costs of the fee. We do not find statistically significant evidence that incentive fees lead to drastic changes in average volatility, 1 st downside moment and maximum drawdown of hedge funds.
45 We do find significant differences in average skewness and kurtosis between incentive fee groups. The latter finding seems to be caused mainly by the relatively small group of funds with an incentive fee in excess of 20%. When we examine the results for the three risk-adjusted performance measures, Sharpe ratio, alpha and gain-loss ratio, we find significant differences between incentive fee groups. Funds without an incentive fee achieve the best risk-adjusted performance on average, while funds charging a below average incentive fee have relatively poor performance. We conclude from Table 2 that incentive fees reduce the mean return and riskadjusted performance of funds, while the effects on risk are not very clear-cut. We also analysed the data after correcting for differences in investment styles by measuring deviations from the average in each style group, but the conclusions are similar.
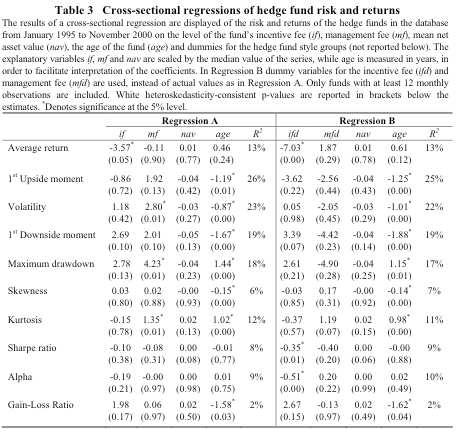
46 To control for other hedge fund characteristics such as fund size, age, management fee and investment style group, we estimate the following cross-sectional regression model for the hedge fund risk and return measures where a i denotes the cross-sectional hedge fund statistic under consideration of fund i = 1,, I, d ih is a dummy which equals one if fund i belongs to hedge fund style h = 1,..., H and zero otherwise, if i is the incentive fee, mf i the management fee, nav i is the mean net asset value of the fund and age i is the number of years that the fund is in the database.
47
48 Table 3 reports the cross-sectional regression results. Columns 2 to 6, denoted by Regression A, refer to regression model (23). Columns 7 to 11, denoted by Regression B, refer to a slightly modified version of the model, which uses a dummy variable for the incentive fee and a dummy for the management fee; the dummy variables are one if a fee is charged and zero otherwise. We do not report the estimated hedge fund style dummies d ih in Table 3 to save space. Funds with higher fees earn significantly lower mean returns. The only other significant effect of incentive fees is a reduction of Sharpe ratios and alphas (only in Regression B, with incentive fee dummies). There is no significant effect of incentive fees on any of the five risk measures at the 5% confidence level. However, there is an economically relevant increase of the 1 st downside moment and the maximum drawdown due to incentive fees, as the estimated coefficients are large. Moreover, the increase in the 1 st downside moment is significant at the 10% level in both regressions.
49 Incentives and Risk Taking in Fund of Funds: Empirical Results We repeat the empirical analysis for the fund of funds in the database. We regress on log of volatility to reduce the non-normality of the residuals (skewness) Table 4 displays the cross-sectional average of the ten risk and return measures, conditional on the level of the incentive fee. We use three incentive fee groups instead of four, due to the relatively small number of fund of funds (403 in total). Again we find significant differences between the average mean returns of the incentive fee groups. Fund of funds with high fees, earn higher returns on average. The 1 st upside moment is also significantly different across groups and larger for fund of funds with higher fees. There are no significant differences in the five risk measures between groups. The three risk-adjusted performance measures, Sharpe ratio, alpha and gain-loss ratio, are significantly different across groups and relatively large for fund of funds with high fees ( 20%).
50
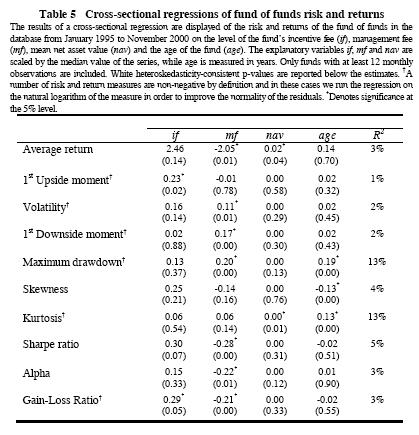
51 Table 5 contains the estimation results of the cross-sectional regression model (23) for fund of funds. The coefficient of the incentive fee variable is significantly positive in the cross-sectional regression on the 1 st upside moment, volatility, maximum drawdown and gain-loss ratio (at the 5% level). There is an economically relevant positive impact on the mean return, 1 st downside moment, skewness and Sharpe ratio as well, based on the magnitude of the estimated coefficients. Hence, for the fund of funds in the database we find that higher incentive fees are linked to increased upside potential and increased risk taking. Risk-adjusted returns increase as well, so investors seem to be better of with fund of funds that charge higher incentive fees. In the case of management fees, Table 5 shows that they are a drag on performance: higher fees significantly reduce average returns, Sharpe ratios and alphas. In this case we do not report additional results for a regression with incentive fee dummies and management fee dummies as there are only a few funds with zero incentive fees, leading to a lack of statistical power.
52
53 A potential explanation for the positive relationship between incentive fees and (riskadjusted) returns in Table 4 and 5 is that fund of fund managers with incentive fees opt for a more risky basket of hedge funds to increase the value of their call option on fund value, leading to more upside return potential and more risk as well. The fund of fund managers themselves might argue that funds with better manager selection skills generate higher returns and are therefore able to charge higher incentive fees. A weak point of the latter story is that it does not explain why fund of fund managers with better skills have more risky returns on average as well; the skill advantage should allow good managers to achieve better returns, while taking less risk.
54 Conclusions In this paper we analyse the relationship between incentives and risk taking in the hedge fund industry. We use prospect theory to model the hedge fund manager s behaviour and derive the optimal investment strategy for a manager in charge of a fund with an incentive fee arrangement. We find that incentive fees reduce the manager s implicit level of loss aversion, leading to increased risk taking. However, if the manager s own stake in the fund is substantial (e.g. > 30%), risk taking will be reduced considerably. We also derive an expression for the option value of the incentive fee arrangement, taking into account the manager s optimal investment strategy. We show that the fund manager increases the value of the incentive option by increasing the volatility of fund returns.
55 In the second part of the paper we examine empirically whether hedge fund managers with incentive fees indeed take more risk in practice, using the Zurich Hedge Fund Universe (formerly known as the MAR database) in the period January 1995 to November The cross-sectional analysis shows that hedge funds with incentive fees have significantly lower mean returns (net of fees) and worse risk-adjusted performance. The difference is 8.5% per year. However, if we control for investment style, the 8.5% gap becomes 6.2% and the cost of the assumed incentive 20% fee is 3.8% reducing the difference to 2.4%. There is no significant effect on volatility, but the 1 st downside moment of returns increases substantially in the presence of incentive fees (significant at the 10% level). Our results illustrate the importance of using downside risk measures, given the non-normality of hedge funds returns. Funds of funds charging higher incentive fees have more risky and higher returns on average. Hence, funds of funds take more risk in response to incentive fees. It seems unlikely that fund of fund managers with higher incentive fees are more skilful, as that story does not explain why risk taking increases as well as a function of incentive fees.
Optimal Portfolios under a Value at Risk Constraint
 Optimal Portfolios under a Value at Risk Constraint Ton Vorst Abstract. Recently, financial institutions discovered that portfolios with a limited Value at Risk often showed returns that were close to
Market Timing Does Work: Evidence from the NYSE 1
 Market Timing Does Work: Evidence from the NYSE 1 Devraj Basu Alexander Stremme Warwick Business School, University of Warwick November 2005 address for correspondence: Alexander Stremme Warwick Business
HEDGE FUND PERFORMANCE IN SWEDEN A Comparative Study Between Swedish and European Hedge Funds
 HEDGE FUND PERFORMANCE IN SWEDEN A Comparative Study Between Swedish and European Hedge Funds Agnes Malmcrona and Julia Pohjanen Supervisor: Naoaki Minamihashi Bachelor Thesis in Finance Department of
Pricing Dynamic Solvency Insurance and Investment Fund Protection
 Pricing Dynamic Solvency Insurance and Investment Fund Protection Hans U. Gerber and Gérard Pafumi Switzerland Abstract In the first part of the paper the surplus of a company is modelled by a Wiener process.
Global Journal of Finance and Banking Issues Vol. 5. No Manu Sharma & Rajnish Aggarwal PERFORMANCE ANALYSIS OF HEDGE FUND INDICES
 PERFORMANCE ANALYSIS OF HEDGE FUND INDICES Dr. Manu Sharma 1 Panjab University, India E-mail: manumba2000@yahoo.com Rajnish Aggarwal 2 Panjab University, India Email: aggarwalrajnish@gmail.com Abstract
Financial Mathematics III Theory summary
 Financial Mathematics III Theory summary Table of Contents Lecture 1... 7 1. State the objective of modern portfolio theory... 7 2. Define the return of an asset... 7 3. How is expected return defined?...
1 Consumption and saving under uncertainty
 1 Consumption and saving under uncertainty 1.1 Modelling uncertainty As in the deterministic case, we keep assuming that agents live for two periods. The novelty here is that their earnings in the second
Effectiveness of CPPI Strategies under Discrete Time Trading
 Effectiveness of CPPI Strategies under Discrete Time Trading S. Balder, M. Brandl 1, Antje Mahayni 2 1 Department of Banking and Finance, University of Bonn 2 Department of Accounting and Finance, Mercator
Risk and Return in Hedge Funds and Funds-of- Hedge Funds: A Cross-Sectional Approach
 Australasian Accounting, Business and Finance Journal Volume 6 Issue 3 Article 4 Risk and Return in Hedge Funds and Funds-of- Hedge Funds: A Cross-Sectional Approach Hee Soo Lee Yonsei University, South
Financial Giffen Goods: Examples and Counterexamples
 Financial Giffen Goods: Examples and Counterexamples RolfPoulsen and Kourosh Marjani Rasmussen Abstract In the basic Markowitz and Merton models, a stock s weight in efficient portfolios goes up if its
The Black-Scholes Model
 IEOR E4706: Foundations of Financial Engineering c 2016 by Martin Haugh The Black-Scholes Model In these notes we will use Itô s Lemma and a replicating argument to derive the famous Black-Scholes formula
HEDGE FUND MANAGERIAL INCENTIVES AND PERFORMANCE
 HEDGE FUND MANAGERIAL INCENTIVES AND PERFORMANCE Nor Hadaliza ABD RAHMAN (University Teknologi MARA, Malaysia) La Trobe University, Melbourne, Australia School of Economics and Finance, Faculty of Law
Characterization of the Optimum
 ECO 317 Economics of Uncertainty Fall Term 2009 Notes for lectures 5. Portfolio Allocation with One Riskless, One Risky Asset Characterization of the Optimum Consider a risk-averse, expected-utility-maximizing
Binomial Option Pricing
 Binomial Option Pricing The wonderful Cox Ross Rubinstein model Nico van der Wijst 1 D. van der Wijst Finance for science and technology students 1 Introduction 2 3 4 2 D. van der Wijst Finance for science
Smooth pasting as rate of return equalisation: A note
 mooth pasting as rate of return equalisation: A note Mark hackleton & igbjørn ødal May 2004 Abstract In this short paper we further elucidate the smooth pasting condition that is behind the optimal early
Effect of booms or disasters on the Sharpe Ratio
 Effect of booms or disasters on the Sharpe Ratio Ziemowit Bednarek and Pratish Patel March 2, 2015 ABSTRACT The purpose of this paper is to analyze the effect of either booms or disasters on the Sharpe
CHOICE THEORY, UTILITY FUNCTIONS AND RISK AVERSION
 CHOICE THEORY, UTILITY FUNCTIONS AND RISK AVERSION Szabolcs Sebestyén szabolcs.sebestyen@iscte.pt Master in Finance INVESTMENTS Sebestyén (ISCTE-IUL) Choice Theory Investments 1 / 65 Outline 1 An Introduction
INTERTEMPORAL ASSET ALLOCATION: THEORY
 INTERTEMPORAL ASSET ALLOCATION: THEORY Multi-Period Model The agent acts as a price-taker in asset markets and then chooses today s consumption and asset shares to maximise lifetime utility. This multi-period
1 The Solow Growth Model
 1 The Solow Growth Model The Solow growth model is constructed around 3 building blocks: 1. The aggregate production function: = ( ()) which it is assumed to satisfy a series of technical conditions: (a)
Dynamic Portfolio Choice II
 Dynamic Portfolio Choice II Dynamic Programming Leonid Kogan MIT, Sloan 15.450, Fall 2010 c Leonid Kogan ( MIT, Sloan ) Dynamic Portfolio Choice II 15.450, Fall 2010 1 / 35 Outline 1 Introduction to Dynamic
Problem set 5. Asset pricing. Markus Roth. Chair for Macroeconomics Johannes Gutenberg Universität Mainz. Juli 5, 2010
 Problem set 5 Asset pricing Markus Roth Chair for Macroeconomics Johannes Gutenberg Universität Mainz Juli 5, 200 Markus Roth (Macroeconomics 2) Problem set 5 Juli 5, 200 / 40 Contents Problem 5 of problem
The Cross-section of Managerial Ability and Risk Preferences
 The Cross-section of Managerial Ability and Risk Preferences Ralph S.J. Koijen Chicago GSB October 2008 Measuring managerial ability Mutual fund alphas from a performance regression using style benchmarks
Computational Finance. Computational Finance p. 1
 Computational Finance Computational Finance p. 1 Outline Binomial model: option pricing and optimal investment Monte Carlo techniques for pricing of options pricing of non-standard options improving accuracy
Incentives and Endogenous Risk Taking : A Structural View on Hedge Fund Alphas
 Incentives and Endogenous Risk Taking : A Structural View on Hedge Fund Alphas Andrea Buraschi, Robert Kosowski and Worrawat Sritrakul Booth School and Imperial College 1 May 2013 1 May 2013 1 / 33 Motivation
Capital Constraints, Lending over the Cycle and the Precautionary Motive: A Quantitative Exploration
 Capital Constraints, Lending over the Cycle and the Precautionary Motive: A Quantitative Exploration Angus Armstrong and Monique Ebell National Institute of Economic and Social Research 1. Introduction
Portfolio Optimization using Conditional Sharpe Ratio
 International Letters of Chemistry, Physics and Astronomy Online: 2015-07-01 ISSN: 2299-3843, Vol. 53, pp 130-136 doi:10.18052/www.scipress.com/ilcpa.53.130 2015 SciPress Ltd., Switzerland Portfolio Optimization
Mathematics of Finance Final Preparation December 19. To be thoroughly prepared for the final exam, you should
 Mathematics of Finance Final Preparation December 19 To be thoroughly prepared for the final exam, you should 1. know how to do the homework problems. 2. be able to provide (correct and complete!) definitions
A Portrait of Hedge Fund Investors: Flows, Performance and Smart Money
 A Portrait of Hedge Fund Investors: Flows, Performance and Smart Money Guillermo Baquero and Marno Verbeek RSM Erasmus University Rotterdam, The Netherlands mverbeek@rsm.nl www.surf.to/marno.verbeek FRB
Log-Robust Portfolio Management
 Log-Robust Portfolio Management Dr. Aurélie Thiele Lehigh University Joint work with Elcin Cetinkaya and Ban Kawas Research partially supported by the National Science Foundation Grant CMMI-0757983 Dr.
Are Market Neutral Hedge Funds Really Market Neutral?
 Are Market Neutral Hedge Funds Really Market Neutral? Andrew Patton London School of Economics June 2005 1 Background The hedge fund industry has grown from about $50 billion in 1990 to $1 trillion in
Portfolios with Hedge Funds and Other Alternative Investments Introduction to a Work in Progress
 Portfolios with Hedge Funds and Other Alternative Investments Introduction to a Work in Progress July 16, 2002 Peng Chen Barry Feldman Chandra Goda Ibbotson Associates 225 N. Michigan Ave. Chicago, IL
Asset Pricing Anomalies and Time-Varying Betas: A New Specification Test for Conditional Factor Models 1
 Asset Pricing Anomalies and Time-Varying Betas: A New Specification Test for Conditional Factor Models 1 Devraj Basu Alexander Stremme Warwick Business School, University of Warwick January 2006 address
Yale ICF Working Paper No First Draft: February 21, 1992 This Draft: June 29, Safety First Portfolio Insurance
 Yale ICF Working Paper No. 08 11 First Draft: February 21, 1992 This Draft: June 29, 1992 Safety First Portfolio Insurance William N. Goetzmann, International Center for Finance, Yale School of Management,
Consumption and Portfolio Decisions When Expected Returns A
 Consumption and Portfolio Decisions When Expected Returns Are Time Varying September 10, 2007 Introduction In the recent literature of empirical asset pricing there has been considerable evidence of time-varying
Advanced Financial Economics Homework 2 Due on April 14th before class
 Advanced Financial Economics Homework 2 Due on April 14th before class March 30, 2015 1. (20 points) An agent has Y 0 = 1 to invest. On the market two financial assets exist. The first one is riskless.
Dynamic Asset and Liability Management Models for Pension Systems
 Dynamic Asset and Liability Management Models for Pension Systems The Comparison between Multi-period Stochastic Programming Model and Stochastic Control Model Muneki Kawaguchi and Norio Hibiki June 1,
The Cass Centre for Asset Management Research
 The Cass Centre for Asset Management Research Locking in the profits or putting it all on black? An empirical investigation into the risk-taking behaviour of hedge fund managers Andrew Clare 1 and Nick
Resolution of a Financial Puzzle
 Resolution of a Financial Puzzle M.J. Brennan and Y. Xia September, 1998 revised November, 1998 Abstract The apparent inconsistency between the Tobin Separation Theorem and the advice of popular investment
Mean-Variance Optimal Portfolios in the Presence of a Benchmark with Applications to Fraud Detection
 Mean-Variance Optimal Portfolios in the Presence of a Benchmark with Applications to Fraud Detection Carole Bernard (University of Waterloo) Steven Vanduffel (Vrije Universiteit Brussel) Fields Institute,
The Morningstar Rating Methodology
 The Morningstar Rating Methodology Morningstar Research Report 13 June 2006 2006 Morningstar, Inc. All rights reserved. The information in this document is the property of Morningstar, Inc. Reproduction
Asset Allocation Given Non-Market Wealth and Rollover Risks.
 Asset Allocation Given Non-Market Wealth and Rollover Risks. Guenter Franke 1, Harris Schlesinger 2, Richard C. Stapleton, 3 May 29, 2005 1 Univerity of Konstanz, Germany 2 University of Alabama, USA 3
Advanced Stochastic Processes.
 Advanced Stochastic Processes. David Gamarnik LECTURE 16 Applications of Ito calculus to finance Lecture outline Trading strategies Black Scholes option pricing formula 16.1. Security price processes,
The mean-variance portfolio choice framework and its generalizations
 The mean-variance portfolio choice framework and its generalizations Prof. Massimo Guidolin 20135 Theory of Finance, Part I (Sept. October) Fall 2014 Outline and objectives The backward, three-step solution
Variable Annuities with Lifelong Guaranteed Withdrawal Benefits
 Variable Annuities with Lifelong Guaranteed Withdrawal Benefits presented by Yue Kuen Kwok Department of Mathematics Hong Kong University of Science and Technology Hong Kong, China * This is a joint work
Monte Carlo Simulations
 Monte Carlo Simulations Lecture 1 December 7, 2014 Outline Monte Carlo Methods Monte Carlo methods simulate the random behavior underlying the financial models Remember: When pricing you must simulate
On Tournament Behavior in Hedge Funds: High Water Marks, Managerial Horizon, and the Backfilling Bias
 On Tournament Behavior in Hedge Funds: High Water Marks, Managerial Horizon, and the Backfilling Bias George O. Aragon Arizona State University Vikram Nanda Arizona State University December 4, 2008 ABSTRACT
Portfolio Construction Research by
 Portfolio Construction Research by Real World Case Studies in Portfolio Construction Using Robust Optimization By Anthony Renshaw, PhD Director, Applied Research July 2008 Copyright, Axioma, Inc. 2008
Path-dependent inefficient strategies and how to make them efficient.
 Path-dependent inefficient strategies and how to make them efficient. Illustrated with the study of a popular retail investment product Carole Bernard (University of Waterloo) & Phelim Boyle (Wilfrid Laurier
4: SINGLE-PERIOD MARKET MODELS
 4: SINGLE-PERIOD MARKET MODELS Marek Rutkowski School of Mathematics and Statistics University of Sydney Semester 2, 2016 M. Rutkowski (USydney) Slides 4: Single-Period Market Models 1 / 87 General Single-Period
Cash Accumulation Strategy based on Optimal Replication of Random Claims with Ordinary Integrals
 arxiv:1711.1756v1 [q-fin.mf] 6 Nov 217 Cash Accumulation Strategy based on Optimal Replication of Random Claims with Ordinary Integrals Renko Siebols This paper presents a numerical model to solve the
Consumption- Savings, Portfolio Choice, and Asset Pricing
 Finance 400 A. Penati - G. Pennacchi Consumption- Savings, Portfolio Choice, and Asset Pricing I. The Consumption - Portfolio Choice Problem We have studied the portfolio choice problem of an individual
Solving dynamic portfolio choice problems by recursing on optimized portfolio weights or on the value function?
 DOI 0.007/s064-006-9073-z ORIGINAL PAPER Solving dynamic portfolio choice problems by recursing on optimized portfolio weights or on the value function? Jules H. van Binsbergen Michael W. Brandt Received:
Calculation of Volatility in a Jump-Diffusion Model
 Calculation of Volatility in a Jump-Diffusion Model Javier F. Navas 1 This Draft: October 7, 003 Forthcoming: The Journal of Derivatives JEL Classification: G13 Keywords: jump-diffusion process, option
PROFIT SHARING IN HEDGE FUNDS. Xue Dong He and Steven Kou. June 21, 2016
 PROFIT SHARING IN HEDGE FUNDS Xue Dong He and Steven Kou June 21, 2016 Abstract In a new scheme for hedge fund managerial compensation known as the first-loss scheme, a fund manager uses her investment
MASSACHUSETTS INSTITUTE OF TECHNOLOGY 6.265/15.070J Fall 2013 Lecture 19 11/20/2013. Applications of Ito calculus to finance
 MASSACHUSETTS INSTITUTE OF TECHNOLOGY 6.265/15.7J Fall 213 Lecture 19 11/2/213 Applications of Ito calculus to finance Content. 1. Trading strategies 2. Black-Scholes option pricing formula 1 Security
Creditor countries and debtor countries: some asymmetries in the dynamics of external wealth accumulation
 ECONOMIC BULLETIN 3/218 ANALYTICAL ARTICLES Creditor countries and debtor countries: some asymmetries in the dynamics of external wealth accumulation Ángel Estrada and Francesca Viani 6 September 218 Following
Which GARCH Model for Option Valuation? By Peter Christoffersen and Kris Jacobs
 Online Appendix Sample Index Returns Which GARCH Model for Option Valuation? By Peter Christoffersen and Kris Jacobs In order to give an idea of the differences in returns over the sample, Figure A.1 plots
AMH4 - ADVANCED OPTION PRICING. Contents
 AMH4 - ADVANCED OPTION PRICING ANDREW TULLOCH Contents 1. Theory of Option Pricing 2 2. Black-Scholes PDE Method 4 3. Martingale method 4 4. Monte Carlo methods 5 4.1. Method of antithetic variances 5
Multi-period mean variance asset allocation: Is it bad to win the lottery?
 Multi-period mean variance asset allocation: Is it bad to win the lottery? Peter Forsyth 1 D.M. Dang 1 1 Cheriton School of Computer Science University of Waterloo Guangzhou, July 28, 2014 1 / 29 The Basic
ON THE ASSET ALLOCATION OF A DEFAULT PENSION FUND
 ON THE ASSET ALLOCATION OF A DEFAULT PENSION FUND Magnus Dahlquist 1 Ofer Setty 2 Roine Vestman 3 1 Stockholm School of Economics and CEPR 2 Tel Aviv University 3 Stockholm University and Swedish House
Jaime Frade Dr. Niu Interest rate modeling
 Interest rate modeling Abstract In this paper, three models were used to forecast short term interest rates for the 3 month LIBOR. Each of the models, regression time series, GARCH, and Cox, Ingersoll,
1 Asset Pricing: Replicating portfolios
 Alberto Bisin Corporate Finance: Lecture Notes Class 1: Valuation updated November 17th, 2002 1 Asset Pricing: Replicating portfolios Consider an economy with two states of nature {s 1, s 2 } and with
Lecture 8: Introduction to asset pricing
 THE UNIVERSITY OF SOUTHAMPTON Paul Klein Office: Murray Building, 3005 Email: p.klein@soton.ac.uk URL: http://paulklein.se Economics 3010 Topics in Macroeconomics 3 Autumn 2010 Lecture 8: Introduction
Managerial leverage and risk-taking incentives in the case of endogenous balance sheet size
 Managerial leverage and risk-taking incentives in the case of endogenous balance sheet size Elisabeth Megally January 15, 2016 Abstract A potential shortcoming of the celebrated Merton (1974) framework
(High Dividend) Maximum Upside Volatility Indices. Financial Index Engineering for Structured Products
 Maximum Upside Volatility Indices. Financial Index Engineering for Structured Products") (High Dividend) Maximum Upside Volatility Indices Financial Index Engineering for Structured Products White Paper April 2018 Introduction This report provides a detailed and technical look under the hood
(High Dividend) Maximum Upside Volatility Indices Financial Index Engineering for Structured Products White Paper April 2018 Introduction This report provides a detailed and technical look under the hood
Consumption and Portfolio Choice under Uncertainty
 Chapter 8 Consumption and Portfolio Choice under Uncertainty In this chapter we examine dynamic models of consumer choice under uncertainty. We continue, as in the Ramsey model, to take the decision of
OPTIMAL PORTFOLIO CONTROL WITH TRADING STRATEGIES OF FINITE
 Proceedings of the 44th IEEE Conference on Decision and Control, and the European Control Conference 005 Seville, Spain, December 1-15, 005 WeA11.6 OPTIMAL PORTFOLIO CONTROL WITH TRADING STRATEGIES OF
Assicurazioni Generali: An Option Pricing Case with NAGARCH
 Assicurazioni Generali: An Option Pricing Case with NAGARCH Assicurazioni Generali: Business Snapshot Find our latest analyses and trade ideas on bsic.it Assicurazioni Generali SpA is an Italy-based insurance
Edgeworth Binomial Trees
 Mark Rubinstein Paul Stephens Professor of Applied Investment Analysis University of California, Berkeley a version published in the Journal of Derivatives (Spring 1998) Abstract This paper develops a
Real Options and Game Theory in Incomplete Markets
 Real Options and Game Theory in Incomplete Markets M. Grasselli Mathematics and Statistics McMaster University IMPA - June 28, 2006 Strategic Decision Making Suppose we want to assign monetary values to
Just a One-Trick Pony? An Analysis of CTA Risk and Return
 J.P. Morgan Center for Commodities at the University of Colorado Denver Business School Just a One-Trick Pony? An Analysis of CTA Risk and Return Jason Foran Mark Hutchinson David McCarthy John O Brien
Non-Time-Separable Utility: Habit Formation
 Finance 400 A. Penati - G. Pennacchi Non-Time-Separable Utility: Habit Formation I. Introduction Thus far, we have considered time-separable lifetime utility specifications such as E t Z T t U[C(s), s]
Optimal Allocation to Hedge Funds: An Empirical Analysis
 Optimal Allocation to Hedge Funds: An Empirical Analysis January 2003 Jaksa Cvitanic University of Southern California Ali Lazrak University of British Columbia Lionel Martellini Marshall School of Business,
Chapter 15: Jump Processes and Incomplete Markets. 1 Jumps as One Explanation of Incomplete Markets
 Chapter 5: Jump Processes and Incomplete Markets Jumps as One Explanation of Incomplete Markets It is easy to argue that Brownian motion paths cannot model actual stock price movements properly in reality,
Literature Overview Of The Hedge Fund Industry
 Literature Overview Of The Hedge Fund Industry Introduction The last 15 years witnessed a remarkable increasing investors interest in alternative investments that leads the hedge fund industry to one of
Portfolio optimization problem with default risk
 Portfolio optimization problem with default risk M.Mazidi, A. Delavarkhalafi, A.Mokhtari mazidi.3635@gmail.com delavarkh@yazduni.ac.ir ahmokhtari20@gmail.com Faculty of Mathematics, Yazd University, P.O.
The Risk Considerations Unique to Hedge Funds
 EDHEC RISK AND ASSET MANAGEMENT RESEARCH CENTRE 393-400 promenade des Anglais 06202 Nice Cedex 3 Tel.: +33 (0)4 93 18 32 53 E-mail: research@edhec-risk.com Web: www.edhec-risk.com The Risk Considerations
Martingale Pricing Theory in Discrete-Time and Discrete-Space Models
 IEOR E4707: Foundations of Financial Engineering c 206 by Martin Haugh Martingale Pricing Theory in Discrete-Time and Discrete-Space Models These notes develop the theory of martingale pricing in a discrete-time,
Utility Indifference Pricing and Dynamic Programming Algorithm
 Chapter 8 Utility Indifference ricing and Dynamic rogramming Algorithm In the Black-Scholes framework, we can perfectly replicate an option s payoff. However, it may not be true beyond the Black-Scholes
A Preference Foundation for Fehr and Schmidt s Model. of Inequity Aversion 1
 A Preference Foundation for Fehr and Schmidt s Model of Inequity Aversion 1 Kirsten I.M. Rohde 2 January 12, 2009 1 The author would like to thank Itzhak Gilboa, Ingrid M.T. Rohde, Klaus M. Schmidt, and
Global Currency Hedging
 Global Currency Hedging JOHN Y. CAMPBELL, KARINE SERFATY-DE MEDEIROS, and LUIS M. VICEIRA ABSTRACT Over the period 1975 to 2005, the U.S. dollar (particularly in relation to the Canadian dollar), the euro,
Homework 3: Asset Pricing
 Homework 3: Asset Pricing Mohammad Hossein Rahmati November 1, 2018 1. Consider an economy with a single representative consumer who maximize E β t u(c t ) 0 < β < 1, u(c t ) = ln(c t + α) t= The sole
Lifetime Portfolio Selection: A Simple Derivation
 Lifetime Portfolio Selection: A Simple Derivation Gordon Irlam (gordoni@gordoni.com) July 9, 018 Abstract Merton s portfolio problem involves finding the optimal asset allocation between a risky and a
On the economic significance of stock return predictability: Evidence from macroeconomic state variables
 On the economic significance of stock return predictability: Evidence from macroeconomic state variables Huacheng Zhang * University of Arizona This draft: 8/31/2012 First draft: 2/28/2012 Abstract We
PORTFOLIO THEORY. Master in Finance INVESTMENTS. Szabolcs Sebestyén
 PORTFOLIO THEORY Szabolcs Sebestyén szabolcs.sebestyen@iscte.pt Master in Finance INVESTMENTS Sebestyén (ISCTE-IUL) Portfolio Theory Investments 1 / 60 Outline 1 Modern Portfolio Theory Introduction Mean-Variance
Behavioral Finance and Asset Pricing
 Behavioral Finance and Asset Pricing Behavioral Finance and Asset Pricing /49 Introduction We present models of asset pricing where investors preferences are subject to psychological biases or where investors
Implementing an Agent-Based General Equilibrium Model
 Implementing an Agent-Based General Equilibrium Model 1 2 3 Pure Exchange General Equilibrium We shall take N dividend processes δ n (t) as exogenous with a distribution which is known to all agents There
Lockbox Separation. William F. Sharpe June, 2007
 Lockbox Separation William F. Sharpe June, 2007 Introduction This note develops the concept of lockbox separation for retirement financial strategies in a complete market. I show that in such a setting
Prospect Theory: A New Paradigm for Portfolio Choice
 Prospect Theory: A New Paradigm for Portfolio Choice 1 Prospect Theory Expected Utility Theory and Its Paradoxes Prospect Theory 2 Portfolio Selection Model and Solution Continuous-Time Market Setting
DIVIDEND POLICY AND THE LIFE CYCLE HYPOTHESIS: EVIDENCE FROM TAIWAN
 The International Journal of Business and Finance Research Volume 5 Number 1 2011 DIVIDEND POLICY AND THE LIFE CYCLE HYPOTHESIS: EVIDENCE FROM TAIWAN Ming-Hui Wang, Taiwan University of Science and Technology
Risk Neutral Measures
 CHPTER 4 Risk Neutral Measures Our aim in this section is to show how risk neutral measures can be used to price derivative securities. The key advantage is that under a risk neutral measure the discounted
Portfolio Selection with Randomly Time-Varying Moments: The Role of the Instantaneous Capital Market Line
 Portfolio Selection with Randomly Time-Varying Moments: The Role of the Instantaneous Capital Market Line Lars Tyge Nielsen INSEAD Maria Vassalou 1 Columbia University This Version: January 2000 1 Corresponding
Portability, salary and asset price risk: a continuous-time expected utility comparison of DB and DC pension plans
 Portability, salary and asset price risk: a continuous-time expected utility comparison of DB and DC pension plans An Chen University of Ulm joint with Filip Uzelac (University of Bonn) Seminar at SWUFE,
Prospect Theory and the Size and Value Premium Puzzles. Enrico De Giorgi, Thorsten Hens and Thierry Post
 Prospect Theory and the Size and Value Premium Puzzles Enrico De Giorgi, Thorsten Hens and Thierry Post Institute for Empirical Research in Economics Plattenstrasse 32 CH-8032 Zurich Switzerland and Norwegian
Finance & Stochastic. Contents. Rossano Giandomenico. Independent Research Scientist, Chieti, Italy.
 Finance & Stochastic Rossano Giandomenico Independent Research Scientist, Chieti, Italy Email: rossano1976@libero.it Contents Stochastic Differential Equations Interest Rate Models Option Pricing Models
Lecture 8: The Black-Scholes theory
 Lecture 8: The Black-Scholes theory Dr. Roman V Belavkin MSO4112 Contents 1 Geometric Brownian motion 1 2 The Black-Scholes pricing 2 3 The Black-Scholes equation 3 References 5 1 Geometric Brownian motion
The Returns and Risk of Dynamic Investment Strategies: A Simulation Comparison
 International Journal of Business and Economics, 2016, Vol. 15, No. 1, 79-83 The Returns and Risk of Dynamic Investment Strategies: A Simulation Comparison Richard Lu Department of Risk Management and
Subject CT8 Financial Economics Core Technical Syllabus
 Subject CT8 Financial Economics Core Technical Syllabus for the 2018 exams 1 June 2017 Aim The aim of the Financial Economics subject is to develop the necessary skills to construct asset liability models
Dynamic Replication of Non-Maturing Assets and Liabilities
 Dynamic Replication of Non-Maturing Assets and Liabilities Michael Schürle Institute for Operations Research and Computational Finance, University of St. Gallen, Bodanstr. 6, CH-9000 St. Gallen, Switzerland
Do Hedge Funds Have Enough Capital? A Value-at-Risk Approach *
 Do Hedge Funds Have Enough Capital? A Value-at-Risk Approach * Anurag Gupta Bing Liang April 2004 *We thank Stephen Brown, Sanjiv Das, Will Goetzmann, David Hseih, Kasturi Rangan, Peter Ritchken, Bill