Loan Pricing Structure and the Nature of Interest Rates
|
|
|
- Grace Dennis
- 5 years ago
- Views:
Transcription
1 Loan Pricing Structure and the Nature of Interest Rates S. Blake Scharlach Senior Vice President / Director of Capital Markets Sales TIB- The Independent BankersBank, N.A.
2 S. Blake Scharlach Blake joined TIB in January 2008 and has more than 22 years of investment and banking experience. He currently serves as Director of Capital Markets Sales, Senior Vice President and Designated Principal in the Investment Sales department of TIB, overseeing the sales and trading operations. He also serves on TIB s Internal ALCO committee. Prior to his tenure at TIB, he worked at two community banks in Texas where he worked as a lender and investment portfolio manager and served on various committees. He currently holds his Series 52 (Municipal Securities), Series 53 (Municipal Securities Principal) Series 63 (State), and Series 72 (General Securities) licenses. Bachelor of Arts, Economics Washington and Lee University, Lexington, VA Master of Business Administration Cornell University, Ithaca, NY He is a subject matter expert in: Capital markets strategies for financial institutions Advising banks on investment strategies Purchases and sales of fixed income securities US government securities Municipal securities Interest rate swaps and hedging instruments Corporate securities Asset/Liability management Portfolio management Bond math Economics S. Blake Scharlach bscharlach@tib.bank
3 Good investing is 50% psychology, 48% history, and 2% finance. - Morgan Housel Source:
4 Economist Projections Beginning Rate Economist Projections Ending Actual Rate Predicted Change Actual Change Accuracy % 5.10% 4.02% % 4.30% 2.21% % 3.20% 3.84% % 4.10% 3.29% % 3.30% 1.87% % 2.70% 1.76% % 2.10% 3.03% % 3.20% 2.17% % 3.20% 2.27% % 3.00% 2.44% % 2.80% 2.40% % 3.00% 2.68%


5 Results as of 9/30/15

6 Life Comes at You Fast

7 Dec. 30, 2017 Mar. 14, 2018

8

9
10 Paul Krugman Economics professor at MIT, Princeton, and CUNY 2008 Nobel Prize in Economics

11 John Kenneth Galbraith Harvard Economics professor 40+ years Economic Advisor to four US Presidents There are two kinds of forecasters: those who don t know, and those who don t know they don t know.
12 1988 Fed Rate Hikes March 1988 Funds Rate (start): 6.50% March 1989 Funds Rate (end): 9.75% Reasoning: Inflation above 4% Fed Funds: Year UST: 182 (elasticity to funds: 49%) 10 Year UST: 112 (elasticity to funds: 30%) Time between first raise and final raise: 261 days Time between final raise and first subsequent cut: 84 days
13 Fed Rate Cuts May 1989 Funds Rate (start): 9.75% September 1992 Funds Rate (end): 3.00% Reasoning: Inflation abated, 1990 recession Fed Funds: Year UST: 365 (elasticity to funds: 54%) 10 Year UST: 257 (elasticity to funds: 38%) Time between first cut and final cut: 1,192 days Time between final cut and first subsequent raise: 549 days
14 1994 Fed Rate Hikes January 1994 Funds Rate (start): 3.00% February 1995 Funds Rate (end): 6% Reasoning: Inflation above 3.5% Fed Funds: Year UST: 183 (elasticity to funds: 61%) 10 Year UST: 141 (elasticity to funds: 47%) Time between first raise and final raise: 364 days Time between final raise and first subsequent cut: 154 days
15 Fed Rate Cuts July 1995 Funds Rate (start): 6.00% December 1998 Funds Rate (end): 4.75% Reasoning: lower inflation, response to Asian economic crisis Average GDP: 4.1% Avg. Inflation: 2.5% Unemployment (U-3) steadily fell from 6%-4% Low oil prices Fed Funds: Year UST: 146 (elasticity to funds: 83%) 10 Year UST: 156 (elasticity to funds: 89%) Time between first cut and final cut: 1,229 days Time between final cut and first subsequent raise: 225 days Massive tech growth
 10 Year UST: 51 (elasticity to funds: 41%) Time between first raise and")
16 Fed Rate Hikes June 1999 Funds Rate (start): 4.75% May 2000 Funds Rate (end): 6.50% Reasoning: Irrational exuberance Fed Funds: Year UST: 80 (elasticity to funds: 64%) 10 Year UST: 51 (elasticity to funds: 41%) Time between first raise and final raise: 322 days Time between final raise and first subsequent cut: 226 days
 10 Year UST: 268 (elasticity to funds: 49%) Time between first cut and")
17 Fed Rate Cuts December 2000 Funds Rate (start): 6.50% June 2003 Funds Rate (end): 1.00% Reasoning: recession / dot com bubble Fed Funds: Year UST: 371 (elasticity to funds: 67%) 10 Year UST: 268 (elasticity to funds: 49%) Time between first cut and final cut: 903 days Time between final cut and first subsequent raise: 371 days
18 Fed Rate Hikes June 2004 Funds Rate (start): 1.00% July 2006 Funds Rate (end): 5.25% Reasoning: concerns over housing bubble Fed Funds: Year UST: 125 (elasticity to funds: 29%) 10 Year UST: 43 (elasticity to funds: 10%) Time between first raise and final raise: 732 days Time between final raise and first subsequent cut: 448 days
19 Fed Rate Cuts August 2007 Funds Rate (start): 5.25% December 2008 Funds Rate (end): 0.25% Reasoning: financial crisis Fed Funds: Year UST: 309 (elasticity to funds: 62%) 10 Year UST: 258 (elasticity to funds: 52%) Time between first cut and final cut: 456 days Time between final cut and first subsequent raise: 2,556 days
20 2015-current Fed Rate Hikes December 2015 Funds Rate (start): 0.25% Current Funds Rate: 2.50% Reasoning: recovery from financial crisis Fed Funds: Year UST: 93 (elasticity to funds: 41%) 10 Year UST: 56 (elasticity to funds: 25%)
21 The Tale of the Tape (elasticity) Fed Moves 5 Year Elasticity 10 Year Elasticity % 30% % 38% % 47% % 89% % 41% % 49% % 10% % 52% 15-? % 25% Average: 56% 42% Median: 61% 41%
22 The Tale of the Tape (elasticity) Fed Moves 5 Year Elasticity 10 Year Elasticity % 30% % 38% % 47% % 89% % 41% % 49% % 10% % 52% 15-? % 25% Rising Rate Average: 49% 31% Falling Rate Average: 67% 57%
23 The Tale of the Tape (timing) Fed Moves Duration Time at Extreme Total , , , , , , ,556 3, ? 225 Time will tell Time will tell 1,199 so far Average rising rate cycle (first raise to first cut): 548 days (23%) Average falling rate cycle (first cut to first raise): 1,870 days (77%)
24 So What Does All That Mean? Prime + 1% vs. 5yr swap % 16.00% 14.00% 12.00% 1) Falling Rate Environments Last Longer than Rising Rate Environments Do 10.00% 8.00% 6.00% 4.00% 2.00% 0.00% 11/1/1988 7/1/1989 3/1/ /1/1990 7/1/1991 3/1/ /1/1992 7/1/1993 3/1/ /1/1994 7/1/1995 3/1/ /1/1996 7/1/1997 3/1/ /1/1998 7/1/1999 3/1/ /1/2000 7/1/2001 3/1/ /1/2002 7/1/2003 3/1/ /1/2004 7/1/2005 3/1/ /1/2006 7/1/2007 3/1/ /1/2008 7/1/2009 3/1/ /1/2010 7/1/2011 3/1/ /1/2012 7/1/2013 3/1/ /1/2014 7/1/2015 3/1/ /1/2016 7/1/2017 3/1/ /1/2018 Prime + 1 5yr fix
25 So What Does All That Mean? Prime + 1% vs. 5yr swap % 16.00% 14.00% 12.00% 2) Longer rates lag the overnight rate when rates are falling (and with less severity) 10.00% 8.00% 6.00% 4.00% 2.00% 0.00% 11/1/1988 7/1/1989 3/1/ /1/1990 7/1/1991 3/1/ /1/1992 7/1/1993 3/1/ /1/1994 7/1/1995 3/1/ /1/1996 7/1/1997 3/1/ /1/1998 7/1/1999 3/1/ /1/2000 7/1/2001 3/1/ /1/2002 7/1/2003 3/1/ /1/2004 7/1/2005 3/1/ /1/2006 7/1/2007 3/1/ /1/2008 7/1/2009 3/1/ /1/2010 7/1/2011 3/1/ /1/2012 7/1/2013 3/1/ /1/2014 7/1/2015 3/1/ /1/2016 7/1/2017 3/1/ /1/2018 Prime + 1 5yr fix
26 So What Does All That Mean? 16.00% 14.00% 12.00% 10.00% Prime + 1% vs. 5yr swap % 3) Longer rates front-run the overnight rate when rates are rising (with varying severity based on conditions) 8.00% 6.00% 4.00% 2.00% 0.00% 11/1/1988 7/1/1989 3/1/ /1/1990 7/1/1991 3/1/ /1/1992 7/1/1993 3/1/ /1/1994 7/1/1995 3/1/ /1/1996 7/1/1997 3/1/ /1/1998 7/1/1999 3/1/ /1/2000 7/1/2001 3/1/ /1/2002 7/1/2003 3/1/ /1/2004 7/1/2005 3/1/ /1/2006 7/1/2007 3/1/ /1/2008 7/1/2009 3/1/ /1/2010 7/1/2011 3/1/ /1/2012 7/1/2013 3/1/ /1/2014 7/1/2015 3/1/ /1/2016 7/1/2017 3/1/ /1/2018 Prime + 1 5yr fix
27 5 year fix (currently 6.00%) versus P+1 floating (currently 6.5%) Average you were better off by doing the fixed rate note: 1.37% per year Percentage of the time you were better off doing the fixed rate note: 81.2%

28 Yield Curve Steepness With exception of a few outlier months during economic boom of 1990 s, the best time to book floating rate notes was when the yield curve was much steeper than normal.

29 Yield Curve Steepness Likewise, the best time to book fixed-rate notes has been when the yield curve is flat.

30 Currently, the curve is very flat
 Average you were better off by doing the fixed rate note: 2.")
31 10 year fix (currently 6.50%) versus P+1.5 floating (currently 7%) Average you were better off by doing the fixed rate note: 2.00% per year Percentage of the time you were better off doing the fixed rate note: 96.3%
32 Right now, you can book a floater at a higher rate than a fixed (~50 bps). Net Income Differential Date Prime + 1 5yr fix Opening Spread Fixed Over Floating 2/28/ % 13.34% -0.41% 3.61% 10/31/ % 11.95% -0.55% 2.93% 5/31/ % 9.59% -0.41% 0.21% 6/30/ % 9.50% -0.50% 0.12% 10/31/ % 9.35% -0.41% -0.08% 12/29/ % 8.91% -0.59% -0.55% 1/31/ % 8.75% -0.50% -0.72% 1/30/ % 9.06% -0.45% 0.65% 9/29/ % 10.02% -0.48% 3.62% 10/31/ % 10.00% -0.50% 3.64% 7/31/ % 8.67% -0.58% 2.64% 6/29/ % 8.74% -0.51% 3.63% 10/31/ % 8.07% -0.43% 3.29% There were 13 occasions when you could have booked a floating rate note between bps higher than the fixed rate option (5y swap + 325). Three of those times, all during the economic boom of the 1990 s, you d have been better off booking the floating rate note. Average win: 45 bps per year. Ten of those times, you d have been better off booking the fixed rate note. Average win: 243 bps per year.
33 Not All 5 Year Fixes are Created Equal $1,200, Principal balances on 5 year loans with varying amortizations $1,000, $800, $600, $400, $200, $0.00 Balance on 5 year full am Balance on 5 yr fix on 10 yr am Balance on 5 yr fix on 20 yr am Balance on 5 yr fix on a 30 yr am

34 We ll pick April 1993 as our case study
35 In April 1993, you could have booked a 5 year fixed rate loan at 7.04% or the floater at a 5% opening rate (very steep curve an instance where the floater performed better) Prime + 1% versus 7.04% fixed April 1993 thru March % 9.00% 8.00% 7.00% 6.00% 5.00% 4.00% 3.00% 2.00% 1.00% 0.00% Prime + 1% Fixed Rate Note
36 Principal-Weighted Loan Yields Term Fixed Rate P+1% floating 5 yr fix / 20 yr am 7.04% 7.38% 5 yr fix / 15 yr am 7.04% 7.36% 5 yr fix / 10 yr am 7.04% 7.33% 5yr fix / full am 7.04% 7.11%
37 In May 2000, you could have booked a 5 year fixed rate loan at 10.83% or the floater at a 10.50% opening rate (very flat curve an instance where the fixed rate performed better) Prime + 1% versus 10.83% fixed May 2000 thru April % 10.00% 8.00% 6.00% 4.00% 2.00% 0.00% Prime + 1% Fixed Rate Note
38 Principal-Weighted Loan Yields Term Fixed Rate P+1% floating 5 yr fix / 20 yr am 10.83% 6.73% 5 yr fix / 15 yr am 10.83% 6.76% 5 yr fix / 10 yr am 10.83% 6.86% 5yr fix / full am 10.83% 7.42%
39 Net Interest Margin 6.00% 5.00% Interest Income / Avg. Earning Assets 4.00% 3.00% 3.97% 3.97% 3.99% 4.13% 4.27% 4.42% 4.56% 2.00% 1.00% 0.00% Interest Expense / Avg. Earning Assets unch
40 So What Kind of a Bank is Your Bank? 4.80% 4.60% 4.40% Asset-Sensitive 4.20% Interest Rate Neutral 4.00% Liability-Sensitive 3.80% Negatively Convex 3.60% 3.40% 3.20% 3.00% unch
41 Given: Fed Funds and LIBOR are near-perfect proxies Given: Prime rate is Fed Funds + 3% Given: Banks may charge some risk premium in excess of Prime Rate (we ll use 1.5% in this example) Given: The history of Prime +1.5% (Fed Funds %) versus 10 year swap rate % has favored the fixed rate instrument 97% of the time. In other words, overnight money + 4.5% rarely outperforms the 10 year swap %. So what if I offered you a floater at overnight money + the spread of your choice versus 10 year swap plus that same spread?
42 Interest Rate Swaps Balance Sheet Swap ISDA agreement Hedge accounting treatment Bank must post collateral Reporting requirements Nominal amount chosen Bank s responsibility to counterparty is some fixed rate Counterparty s responsibility to bank is some variable rate Settle up each month Loan Level Swap Same requirements as Balance Sheet Swap but amount is based on loan amount Non-ISDA hedging agreement No ISDA agreement No hedge accounting treatment Bank shares first lien with counterparty Fewer reporting requirements Amount is loan amount Loan borrower pays based on some fixed rate that s passed on to counterparty Counterparty pays bank based on loan amount multiplied by some variable rate Settle up each month
43 Utilizing Swap Rates as of 1/2/19 10 yr. 2.65% 1 mo. 2.50% Sell: You give up the right to book a 10 year 10 year swap bps (4.90%) Buy: The deal goes on your books at 1 mo. LIBOR floating bps (4.75%) You re only 15 basis points upside down at the outset, and the Fed s dot plots say two more raises in And you believe the same. Why wouldn t you do it?
44 Non-ISDA Swap (current spreads applied to historical rates) The bank has effectively sold (given up the right to book a loan themselves) a 10 year fixed rate at 4.90% (10 year Swap + 225) The bank has effectively bought 10 years of 1 month LIBOR floating 14.00% 10 yr swap vs. 1m LIBOR % 10.00% 8.00% 6.00% 4.00% 2.00% 0.00% 11/1/1988 7/1/1989 3/1/ /1/1990 7/1/1991 3/1/ /1/1992 7/1/1993 3/1/ /1/1994 7/1/1995 3/1/ /1/1996 7/1/1997 3/1/ /1/1998 7/1/1999 3/1/ /1/2000 7/1/2001 3/1/ /1/2002 7/1/2003 3/1/ /1/2004 7/1/2005 3/1/ /1/2006 7/1/2007 3/1/ /1/2008 7/1/2009 3/1/ /1/2010 7/1/2011 3/1/ /1/2012 7/1/2013 3/1/ /1/2014 7/1/2015 3/1/ /1/2016 7/1/2017 3/1/ yr swap m LIBOR + 225

45 August year swap = 7.97% 1 mo. LIBOR = 5.44% Beginning spread: -2.53% CRYSTAL BALL Short rates will have a big run and within 16 months, LIBOR will rise 287 bps Rates will remain elevated for seven years
46 Zooming in in August 1993 to July 2003 Net Payments (based on $1mm loan on 25 year amortization at 7.97%) Year 1 ($20,174.75) Year 2 $ Year 3 ($1,064.12) Year 4 ($1,597.01) Year 5 ($287.22) Year 6 ($4,692.87) Year 7 $2, Year 8 ($2,150.28) Year 9 ($26,990.26) Year 10 ($30,478.48) ($84,034.32)
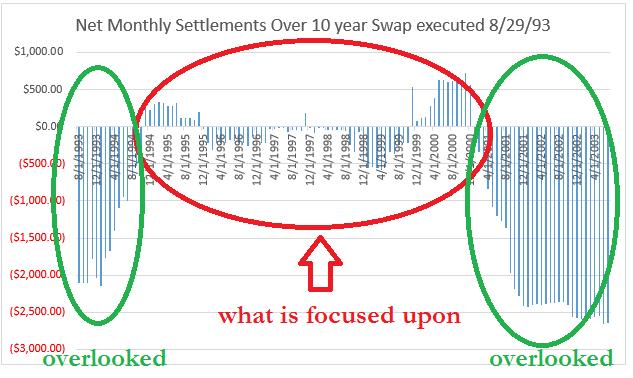
47 Monthly Settlements
48 But the opening spread was 253 basis points! That was a big hill to climb! Right now we re taking about a 15 basis point opening spread! 10yr swap mo LIBOR Opening Spread Net Settlements 8/31/ % 7.58% -0.04% ($354,731.79) 7/31/ % 10.94% -0.03% ($271,690.31) 9/29/ % 11.38% -0.01% ($316,611.74) 1/31/ % 7.57% 0.01% ($375,574.43) 10/31/ % 11.00% 0.03% ($289,886.84) 12/31/ % 6.85% 0.07% ($351,447.52) 8/31/ % 11.25% 0.08% ($310,538.72) 9/28/ % 7.37% 0.09% ($390,157.13) 11/30/ % 11.81% 0.13% ($334,461.15) 10/30/ % 7.49% 0.13% ($142,405.76) 5/31/ % 7.57% 0.14% ($399,187.41) 7/31/ % 7.64% 0.15% ($373,304.26) 8/31/ % 7.89% 0.16% ($176,711.91) 11/30/ % 8.23% 0.17% ($182,699.93) 7/31/ % 7.57% 0.17% ($408,238.03) 11/30/ % 11.00% 0.20% ($323,937.20) 10/31/ % 8.87% 0.25% ($362,828.29) 12/29/ % 7.94% 0.27% ($167,477.96) 9/29/ % 8.87% 0.30% ($362,048.89) 6/30/ % 7.91% 0.33% ($188,538.87) 1/31/ % 7.82% 0.34% ($293,289.50) 6/29/ % 7.57% 0.35% ($420,336.42) 12/29/ % 10.75% 0.35% ($300,029.87) Since the inception of the swap curve, there have been 23 months where the opening spread has been within 20 bps of current levels. Average net swap settlement outflow for each of those times: ($308,527.56)
49 What if the customer wants to prepay? Counterparty has bought a swap on the backside to hedge themselves. If a customer decides to prepay their loan for whatever reason, Counterparty still has to unwind its hedging swap. They have written in a two-way prepayment penalty into the deal based on current 1 month LIBOR pricing as of the date of payoff. It s called Symmetrical Yield Maintenance. It s pitched as bank-friendly because: 1) In a falling rate environment, it prevents prepayments because the customer has to pay a prepayment penalty. 2) In a rising rate environment, it actually pays the customer to pay you off early, and you can put that money to work in a higher interest rate environment.
50 Then why does the Counterparty need an equal priority on your lien position? They don t have a formal ISDA agreement to govern the swap and they need to protect themselves. It takes the choice of waiving or reducing the prepayment penalty out of the banker s hands it HAS to be paid. The Counterparty will not release their share of the lien until they ve been made whole. But what about a default? The structure of the deal does not have the Counterparty participating in any part of the credit risk, just the swap risk. In the event of liquidation, they will not release their lien position until they ve been made whole, and therefore you cannot liquidate until they ve been made whole.

51 1m LIBOR Forward Curve
52 LIBOR vs. Fed Funds Fed Funds isn t an exact proxy for LIBOR, but it s pretty darn close!
53 Scenario: You booked a 10 year swap on $3mm in January The Fix: 4.165% (10yr swap as of January bps) The Float : 1m LIBOR bps Settlements you paid: $273, Settlements paid to you: $5, $2, Net Settlements Each Month $1, $0.00 ($1,000.00) 1/1/2012 3/1/2012 5/1/2012 7/1/2012 9/1/ /1/2012 1/1/2013 3/1/2013 5/1/2013 7/1/2013 9/1/ /1/2013 1/1/2014 3/1/2014 5/1/2014 7/1/2014 9/1/ /1/2014 1/1/2015 3/1/2015 5/1/2015 7/1/2015 9/1/ /1/2015 1/1/2016 3/1/2016 5/1/2016 7/1/2016 9/1/ /1/2016 1/1/2017 3/1/2017 5/1/2017 7/1/2017 9/1/ /1/2017 1/1/2018 3/1/2018 5/1/2018 7/1/2018 9/1/ /1/2018 ($2,000.00) ($3,000.00) ($4,000.00) ($5,000.00)
54 Fed Funds Forward Contracts over the past four months Bloomberg command: FFF9 Comdty CT 3.50% 3.00% 2.50% 2.00% 1.50% Fed Funds Futures Fed Funds Futures Fed Funds Futures Fed Funds Futures 1.00% 0.50% 0.00% Dec-18 Jan-19 Feb-19 Mar-19 Apr-19 May-19 Jun-19 Jul-19 Aug-19 Sep-19 Oct-19 Nov-19 Dec-19 Jan-20 Feb-20 Mar-20 Apr-20 May-20 Jun-20 Jul-20 Aug-20 Sep-20 Oct-20 Nov-20 Dec-20 Jan-21 Feb-21 Mar-21 Apr-21 May-21 Jun-21 Jul-21 Aug-21 Sep-21 Oct-21 Nov-21 Dec-21
55 Fed Funds Futures Fed Funds Futures Fed Funds Futures Fed Funds Futures October 2018 November 2018 December 2018 January 2019 Dec % Jan % 2.40% Feb % 2.41% 2.40% Mar % 2.46% 2.43% 2.38% Apr % 2.52% 2.47% 2.37% May % 2.55% 2.49% 2.35% Jun % 2.58% 2.52% 2.34% Jul % 2.61% 2.55% 2.33% Aug % 2.63% 2.57% 2.31% Sep % 2.65% 2.58% 2.31% Oct % 2.67% 2.59% 2.29% Nov % 2.68% 2.60% 2.26% Dec % 2.70% 2.60% 2.24% Jan % 2.71% 2.59% 2.22% Feb % 2.70% 2.57% 2.18% Mar % 2.70% 2.55% 2.15% Apr % 2.71% 2.54% 2.13% May % 2.70% 2.53% 2.08% Jun % 2.70% 2.52% 2.05% Jul % 2.70% 2.51% 2.03% Aug % 2.69% 2.50% 2.01% Sep % 2.69% 2.50% 2.00% Oct % 2.68% 2.50% 1.99% Nov % 2.68% 2.50% 1.99% Dec % 2.68% 2.50% 1.98% Jan % 2.68% 2.50% 1.97% Feb % 2.67% 2.50% 1.97% Mar % 2.67% 2.49% 1.96% Apr % 2.66% 2.49% 1.95% May % 2.66% 2.48% 1.95% Jun % 2.66% 2.48% 1.95% Jul % 2.65% 2.48% 1.94% Aug % 2.65% 2.48% 1.94% Sep % 2.65% 2.48% 1.94% Oct % 2.48% 1.94% Nov % 1.94% Dec % Average 2.76% 2.64% 2.51% 2.10% Scenario: You have three years left on a 10 year swap booked in January $3mm Sell 10yr swap Buy 1mo LIBOR You sold a 10 year fix at 4.165%. Now there s a payoff request. Ballpark the value of your contract as of October % % = 5.01% 5.01% % = 0.845% 0.845% x $3mm x 3.25 years = $82.4K
56 Fed Funds Futures Fed Funds Futures Fed Funds Futures Fed Funds Futures October 2018 November 2018 December 2018 January 2019 Dec % Jan % 2.40% Feb % 2.41% 2.40% Mar % 2.46% 2.43% 2.38% Apr % 2.52% 2.47% 2.37% May % 2.55% 2.49% 2.35% Jun % 2.58% 2.52% 2.34% Jul % 2.61% 2.55% 2.33% Aug % 2.63% 2.57% 2.31% Sep % 2.65% 2.58% 2.31% Oct % 2.67% 2.59% 2.29% Nov % 2.68% 2.60% 2.26% Dec % 2.70% 2.60% 2.24% Jan % 2.71% 2.59% 2.22% Feb % 2.70% 2.57% 2.18% Mar % 2.70% 2.55% 2.15% Apr % 2.71% 2.54% 2.13% May % 2.70% 2.53% 2.08% Jun % 2.70% 2.52% 2.05% Jul % 2.70% 2.51% 2.03% Aug % 2.69% 2.50% 2.01% Sep % 2.69% 2.50% 2.00% Oct % 2.68% 2.50% 1.99% Nov % 2.68% 2.50% 1.99% Dec % 2.68% 2.50% 1.98% Jan % 2.68% 2.50% 1.97% Feb % 2.67% 2.50% 1.97% Mar % 2.67% 2.49% 1.96% Apr % 2.66% 2.49% 1.95% May % 2.66% 2.48% 1.95% Jun % 2.66% 2.48% 1.95% Jul % 2.65% 2.48% 1.94% Aug % 2.65% 2.48% 1.94% Sep % 2.65% 2.48% 1.94% Oct % 2.48% 1.94% Nov % 1.94% Dec % Average 2.76% 2.64% 2.51% 2.10% Scenario: You booked a 10 year swap in January $3mm Sell 10yr swap Buy 1mo LIBOR You sold a 10 year fix at 4.165%. Now there s a payoff request. Ballpark the value of your contract as of November % % = 4.89% 4.89% % = 0.725% 0.725% x $3mm x years = $68.9K
57 Fed Funds Futures Fed Funds Futures Fed Funds Futures Fed Funds Futures October 2018 November 2018 December 2018 January 2019 Dec % Jan % 2.40% Feb % 2.41% 2.40% Mar % 2.46% 2.43% 2.38% Apr % 2.52% 2.47% 2.37% May % 2.55% 2.49% 2.35% Jun % 2.58% 2.52% 2.34% Jul % 2.61% 2.55% 2.33% Aug % 2.63% 2.57% 2.31% Sep % 2.65% 2.58% 2.31% Oct % 2.67% 2.59% 2.29% Nov % 2.68% 2.60% 2.26% Dec % 2.70% 2.60% 2.24% Jan % 2.71% 2.59% 2.22% Feb % 2.70% 2.57% 2.18% Mar % 2.70% 2.55% 2.15% Apr % 2.71% 2.54% 2.13% May % 2.70% 2.53% 2.08% Jun % 2.70% 2.52% 2.05% Jul % 2.70% 2.51% 2.03% Aug % 2.69% 2.50% 2.01% Sep % 2.69% 2.50% 2.00% Oct % 2.68% 2.50% 1.99% Nov % 2.68% 2.50% 1.99% Dec % 2.68% 2.50% 1.98% Jan % 2.68% 2.50% 1.97% Feb % 2.67% 2.50% 1.97% Mar % 2.67% 2.49% 1.96% Apr % 2.66% 2.49% 1.95% May % 2.66% 2.48% 1.95% Jun % 2.66% 2.48% 1.95% Jul % 2.65% 2.48% 1.94% Aug % 2.65% 2.48% 1.94% Sep % 2.65% 2.48% 1.94% Oct % 2.48% 1.94% Nov % 1.94% Dec % Average 2.76% 2.64% 2.51% 2.10% Scenario: You booked a 10 year swap in January $3mm Sell 10yr swap Buy 1mo LIBOR You sold a 10 year fix at 4.165%. Now there s a payoff request. Ballpark the value of your contract as of December % % = 4.76% 4.76% % = 0.595% 0.595% x $3mm x years = $55.0K
58 Fed Funds Futures Fed Funds Futures Fed Funds Futures Fed Funds Futures October 2018 November 2018 December 2018 January 2019 Dec % Jan % 2.40% Feb % 2.41% 2.40% Mar % 2.46% 2.43% 2.38% Apr % 2.52% 2.47% 2.37% May % 2.55% 2.49% 2.35% Jun % 2.58% 2.52% 2.34% Jul % 2.61% 2.55% 2.33% Aug % 2.63% 2.57% 2.31% Sep % 2.65% 2.58% 2.31% Oct % 2.67% 2.59% 2.29% Nov % 2.68% 2.60% 2.26% Dec % 2.70% 2.60% 2.24% Jan % 2.71% 2.59% 2.22% Feb % 2.70% 2.57% 2.18% Mar % 2.70% 2.55% 2.15% Apr % 2.71% 2.54% 2.13% May % 2.70% 2.53% 2.08% Jun % 2.70% 2.52% 2.05% Jul % 2.70% 2.51% 2.03% Aug % 2.69% 2.50% 2.01% Sep % 2.69% 2.50% 2.00% Oct % 2.68% 2.50% 1.99% Nov % 2.68% 2.50% 1.99% Dec % 2.68% 2.50% 1.98% Jan % 2.68% 2.50% 1.97% Feb % 2.67% 2.50% 1.97% Mar % 2.67% 2.49% 1.96% Apr % 2.66% 2.49% 1.95% May % 2.66% 2.48% 1.95% Jun % 2.66% 2.48% 1.95% Jul % 2.65% 2.48% 1.94% Aug % 2.65% 2.48% 1.94% Sep % 2.65% 2.48% 1.94% Oct % 2.48% 1.94% Nov % 1.94% Dec % Average 2.76% 2.64% 2.51% 2.10% Scenario: You booked a 10 year swap in January $3mm Sell 10yr swap Buy 1mo LIBOR You sold a 10 year fix at 4.165%. Now there s a payoff request. Ballpark the value of your contract as of January % % = 4.35% 4.35% % = 0.185% 0.185% x $3mm x 3 years = $16.7K
59 Value of the Contract Today Funds Futures are 2.15% 2.25% % = % % = 0.235% 0.235% x $3mm x 2.83 years = $19.9K
60 ISDA Balance Sheet Swap (proposed to a Georgia bank week of 8/27/18) $10mm nominal swap sell 5y swap rate / buy 3m LIBOR /1/1988 7/1/1989 3/1/ /1/1990 7/1/1991 3/1/ /1/1992 7/1/1993 3/1/ /1/1994 7/1/1995 3/1/ /1/1996 7/1/1997 3/1/ /1/1998 7/1/1999 3/1/ /1/2000 7/1/2001 3/1/ /1/2002 7/1/2003 3/1/ /1/2004 7/1/2005 3/1/ /1/2006 7/1/2007 3/1/ /1/2008 7/1/2009 3/1/ /1/2010 7/1/2011 3/1/ /1/2012 7/1/2013 3/1/ /1/2014 7/1/2015 3/1/ /1/2016 7/1/2017 3/1/2018 3mL 5ySwap
61 Applying those spreads (sell 5y swap / buy 3m LIBOR) to a swap Using historical data, here s how that bank would have fared, month by month, since the advent of the swap curve. $1,000, $500, $0.00 ($500,000.00) 11/1/1988 6/1/1989 1/1/1990 8/1/1990 3/1/ /1/1991 5/1/ /1/1992 7/1/1993 2/1/1994 9/1/1994 4/1/ /1/1995 6/1/1996 1/1/1997 8/1/1997 3/1/ /1/1998 5/1/ /1/1999 7/1/2000 2/1/2001 9/1/2001 4/1/ /1/2002 6/1/2003 1/1/2004 8/1/2004 3/1/ /1/2005 5/1/ /1/2006 7/1/2007 2/1/2008 9/1/2008 4/1/ /1/2009 6/1/2010 1/1/2011 8/1/2011 3/1/ /1/2012 5/1/2013 ($1,000,000.00) ($1,500,000.00) ($2,000,000.00) ($2,500,000.00) ($3,000,000.00)

62 OK, but the Fed s raising rates now though It might be a good time to take that chance, right?

63 Late-Cycle and End-Cycle Results
64 Takeaways Falling rate environments usually last longer than rising rate environments Long rates have historically been far less elastic than rising rates, giving fixed-rate notes an advantage Historically, a flat yield curve (like today) represents a bad time to book floating rate loans Tighter amortizations remove a lot of the benefit of the floating rate when there are large opening spreads (fixed higher than float) The longer the duration of the fixed rate, the more that elasticity (or lack thereof on the long end) will hurt comparable floating rate notes. Will the next cycle follow form with previous cycles? Nobody knows.
65 Questions/Comments? S. Blake Scharlach Senior Vice President / Designated Principal Director of Capital Markets Sales TIB The Independent BankersBank, N.A. bscharlach@tib.bank (800)
After the Rate Increase, What Then?
 After the Rate Increase, What Then? Robert Eisenbeis, Ph.D. Vice Chairman & Chief Monetary Economist Bob.Eisenbeis@Cumber.com What the FOMC Did At Dec Meeting The Fed made the first step towards normalization
Advanced Asset/Liability Management
 Advanced Asset/Liability Management WBA BOLT Summer Leadership Summit June 14, 2018 Presented by: Marc Gall, Vice President mgall@bokf.com 1 Agenda Asset/Liability Management Summary Developing Assumptions
VIX Hedging September 30, 2015 Pravit Chintawongvanich, Head of Risk Strategy
 P R O V E N E X P E R T I S E. U N B I A S E D A D V I C E. F L E X I B L E S O L U T I O N S. VIX Hedging September 3, 215 Pravit Chintawongvanich, Head of Risk Strategy Hedging objectives What is the
January 25, 2017 Financial Markets & Debt Portfolio Update Contra Costa Transportation Authority Introduction Public Financial Management Inc. (PFM),
,") January 25, 2017 Introduction Public Financial Management Inc. (PFM), financial advisor to the (CCTA) has prepared the following report as an update of market conditions through December 30, 2016. The
January 25, 2017 Introduction Public Financial Management Inc. (PFM), financial advisor to the (CCTA) has prepared the following report as an update of market conditions through December 30, 2016. The
NCLGIAWC Optimizing Investment Portfolios
 NCLGIAWC Optimizing Investment Portfolios Wells Fargo Securities - Fixed Income Market & Portfolio Strategy February 2017 Garret Sloan, CFA Director WFS and its investment representatives do not act as
Course Materials STRATEGICALLY MANAGING THE INVESTMENT PORTFOLIO FOR LONG-TERM PERFORMANCE
 Course Materials STRATEGICALLY MANAGING THE INVESTMENT PORTFOLIO FOR LONG-TERM PERFORMANCE Raleigh A. Andy Trovillion Executive Vice President UMB Bank St. Louis, Missouri raleigh.trovillion@umb.com 314-612-8039
CALLABLE BONDS: FRIEND AND FOE GIOA INVESTMENT CONFERENCE George E.A. Barbar Mesirow Financial William M. Quinn, CFA FTN Financial
 CALLABLE BONDS: FRIEND AND FOE GIOA INVESTMENT CONFERENCE 2017 George E.A. Barbar Mesirow Financial William M. Quinn, CFA FTN Financial GSE Callables Market Update Quick Refresh Why? and Why Not? Friend
A Note on the Steepening Curve and Mortgage Durations
 Robert Young (212) 816-8332 robert.a.young@ssmb.com The current-coupon effective duration has reached a multi-year high of 4.6. A Note on the Steepening Curve and Mortgage Durations While effective durations
Angel Oak Capital Advisors, LLC
 Angel Oak Capital Advisors, LLC Angel Oak Multi-Strategy Income Fund Quarterly Review March 31, 2018 Quarter in Review Risk assets were weaker in the first quarter driven primarily by rising rates, expectations
STRATEGICALLY MANAGING THE INVESTMENT PORTFOLIO FOR LONG-TERM PERFORMANCE
 STRATEGICALLY MANAGING THE INVESTMENT PORTFOLIO FOR LONG-TERM PERFORMANCE Raleigh A. Trovillion Executive Vice President UMB Bank Investment Division St. Louis, MO raleigh.trovillion@umb.com 314-612-8039
Course Materials UNDERSTANDING AND MANAGING OPTION RISK
 Course Materials UNDERSTANDING AND MANAGING OPTION RISK Dan Dwyer Managing Director Bloomington, Minnesota danieldwyer@firstintegritycapital.com 952-681-7920 August 10 & 11, 2017 Understanding and Managing
Palm Beach County School District
 Palm Beach County School District Investment Performance Review Quarter Ended March 31, 2008 Investment Advisors Steven Alexander, CTP, CGFO, Managing Director 300 S. Orange Avenue, Suite 1170 Orlando,
An Introduction to the Yield Curve and What it Means. Yield vs Maturity An Inverted Curve: January Percent (%)
") CIO Educational Series SEPTEMBER 2018 Learning the Curve An Introduction to the Yield Curve and What it Means Authored by: Matthew Diczok, Fixed Income Strategist The yield curve has been a major focus
CIO Educational Series SEPTEMBER 2018 Learning the Curve An Introduction to the Yield Curve and What it Means Authored by: Matthew Diczok, Fixed Income Strategist The yield curve has been a major focus
U.S. Interest Rates Chartbook January 2018
 U.S. Interest Rates Chartbook January 2018 Takeaways In line with expectations, the FOMC left Fed funds rate unchanged. The changes to the January statement highlighted stronger growth and confidence that
SBA Securities A Strategic Addition to your Portfolio
 Objectives History & Characteristics SBA Securities A Strategic Addition to your Portfolio Fred Eisel Chief Investment Officer Investment Guidelines & Analysis Examples Other considerations & best practices
Palm Beach County School District
 Palm Beach County School District Investment Performance Review Quarter Ended March 31, 2009 Investment Advisors Steven Alexander, CTP, CGFO, Managing Director Mel Hamilton, Senior Managing Consultant
U.S. INTEREST RATES CHARTBOOK MARCH U.S. Interest Rates. Chartbook. March 2017
 U.S. Interest Rates Chartbook March 2017 Takeaways The FOMC has raised the Fed funds rate for the third time since the start of the policy rate normalization cycle in 2015. The Committee has also reinforced
Angel Oak Capital Advisors, LLC
 Angel Oak Capital Advisors, LLC Angel Oak Flexible Income Fund Quarterly Review March 31, 2018 Quarter in Review Risk assets were weaker in the first quarter driven primarily by rising rates, expectations
Course Materials STRATEGICALLY MANAGING THE INVESTMENT PORTFOLIO FOR LONG-TERM PERFORMANCE
 Course Materials STRATEGICALLY MANAGING THE INVESTMENT PORTFOLIO FOR LONG-TERM PERFORMANCE Raleigh A. Andy Trovillion Executive Vice President Investment Division UMB Bank St. Louis, Missouri raleigh.trovillion@umb.com
Building a Zero Coupon Yield Curve
 Building a Zero Coupon Yield Curve Clive Bastow, CFA, CAIA ABSTRACT Create and use a zero- coupon yield curve from quoted LIBOR, Eurodollar Futures, PAR Swap and OIS rates. www.elpitcafinancial.com Risk-
Attachment A Financial Markets & Debt Portfolio Update October 21, 2016 Introduction Public Financial Management Inc. (PFM), financial advisor to the
, financial advisor to the") Attachment A Financial Markets & Debt Portfolio Update October 21, 2016 Introduction Public Financial Management Inc. (PFM), financial advisor to the Contra Costa Transportation Authority (CCTA) has prepared
Attachment A Financial Markets & Debt Portfolio Update October 21, 2016 Introduction Public Financial Management Inc. (PFM), financial advisor to the Contra Costa Transportation Authority (CCTA) has prepared
Liquidity is Relevant Again
 Liquidity is Relevant Again April 2019 Not FDIC Insured May Lose Value No Bank Guarantee Not NCUA or NCUSIF insured. May lose value. No credit union guarantee. For institutional use only. l 2019 FMR LLC.
Thoughts on US Monetary Policy Prepared for Hutchins Center Conference, March 21, 2016
 Thoughts on US Monetary Policy Prepared for Hutchins Center Conference, March 21, 2016 Richard H. Clarida Professor of Economics and International Affairs Columbia University Global Strategic Advisor PIMCO
Bond Market Update. 112 th Annual Conference. John Hallacy. Michael Decker. Cindy Harris. Patrick Early. 10:30 12:10 May 7, 2018 Ferrara Theater
 10:30 12:10 May 7, 2018 Ferrara Theater 112 th Annual Conference May 6-9, 2018 St. Louis, Missouri Moderator/Speakers: John Hallacy Program Manager & Contributing Editor, The Bond Buyer Michael Decker
December. US Interest Rates. Chartbook
 December 2016 US Interest Rates Chartbook Takeaways The FOMC December statement has revealed a unanimous vote for a 2nd Fed funds rate increase, while economic projections reinforced the Fed s stance to
Investment Grade Fixed Income Review
 Investment Grade Fixed Income Review February 15, 2018 North Carolina Short Term Portfolio (STIF) December 31, 2017 STIF Allocation 1.40% 1.20% Monthly STIF Rate History 1.30% Repurchase Agreements 7.5%
Fidelity Investments: Cash Segmentation & An Active Approach to Liquidity Management
 Fidelity Investments: Cash Segmentation & An Active Approach to Liquidity Management December 2017 Not FDIC Insured May Lose Value No Bank Guarantee Not NCUA or NCUSIF insured. May lose value. No credit
U.S. Interest Rates Chartbook September 2017
 U.S. Interest Rates Chartbook September 2017 Takeaways The FOMC announced the start of the balance sheet normalization process to begin in October while maintained the Fed funds rate target range at 1%-1.25%
Transparency in the U.S. Repo Market
 Transparency in the U.S. Repo Market Antoine Martin Federal Reserve Bank of New York October 11, 2013 The views expressed in this presentation are my own and may not represent the views of the Federal
Virginia GFOA. May 4, Reid Andrews Government Treasury Management. Vanessa Hubbard Fixed Income Market & Portfolio Strategy
 Virginia GFOA May 4, 2016 Reid Andrews Government Treasury Management Vanessa Hubbard Fixed Income Market & Portfolio Strategy WFS and its investment representatives do not act as Municipal Advisors and
UNDERSTANDING AND MANAGING OPTION RISK
 UNDERSTANDING AND MANAGING OPTION RISK Daniel J. Dwyer Managing Principal Dwyer Capital Strategies L.L.C. Bloomington, MN dan@dwyercap.com 952-681-7920 August 9 & 10, 2018 Dwyer Capital Strategies L.L.C.
Cavanal Hill Fixed Income Insights 1 st Quarter, 2018
 Cavanal Hill Fixed Income Insights 1 st Quarter, 2018 Michael Maurer, CFA Senior Fixed Income Portfolio Manager Russell Knox, CFA Fixed Income Portfolio Manager Rich Williams Senior Tax Free Fixed Income
Moving On Up Investing in Today s Rate Environment
 Moving On Up Investing in Today s Rate Environment Presented by PFM Asset Management LLC Steve Faber, Managing Director Gray Lepley, Senior Analyst, Portfolio Strategies September 18, 2018 PFM 1 Today
Asset/Liability Management
 Asset/Liability Management FHLB System Sales and Marketing Meeting Scottsdale, AZ February 27 th, 2016 Ryan W. Hayhurst Managing Director Financial Strategies Group ryan@gobaker.com 800-962-9468 The Baker
Seeking Alpha: Opportunities vs. Risk in the US Loan Market Today
 Seeking Alpha: Opportunities vs. Risk in the US Loan Market Today Moderator: Bram Smith. LSTA Speakers: Americo Cascella, Ares Stephen Casey, Neuberger Kevin Petrovcik, Invesco Mark Senkpiel, Babson THE
Asset Liability Management Report 4 Q 2018
 Asset Liability Management Report 4 Q 2018 Performance Indicators and Key Measures Cash, Investment and Debt Balances Book Value ($M) Restricted Cash and Investments 529.8 Unrestricted Cash and Investments
WHERE DO WE GO FROM HERE? JANUARY 9 TH, 2019
 WHERE DO WE GO FROM HERE? JANUARY 9 TH, 2019 MY GOAL TODAY. AGENDA 1. Looking Back at 2018 2. Three Types of Bear Markets 3. The Economic Backdrop 4. Two Paths Forward 5. Q&A TOUGH YEAR TO MAKE MONEY #1
Market Update: Broad Market Returns and Indicators
 Market Update Eckler Ltd. collects information directly from sources believed to be reliable. Eckler Ltd. does not guarantee or warrant the accuracy, timeliness, or completeness of the information either
Financial Markets & Debt Portfolio Update August 23, 2016 Introduction Public Financial Management Inc., (PFM), financial advisor to the Contra Costa
, financial advisor to the Contra Costa") Administration and Projects Committee STAFF REPORT Meeting Date: September 1, 2016 Subject Summary of Issues Recommendations Financial Implications Options Attachments Accept Quarterly Financial Markets
Administration and Projects Committee STAFF REPORT Meeting Date: September 1, 2016 Subject Summary of Issues Recommendations Financial Implications Options Attachments Accept Quarterly Financial Markets
So Much Money What Are My Best Investment Options?
 So Much Money What Are My Best Investment Options? 2015 CSMFO Annual Conference Monterey, California o o o Deanne Woodring, CFA, Government Portfolio Advisors Michelle Durgy, CIO, City and County of San
Positioning Your Portfolio as the Fed Tightens Monetary Policy
 Positioning Your Portfolio as the Fed Tightens Monetary Policy Scott Wood Portfolio Strategist January 30, 2018 Securities offered through ProEquities, Inc., a registered Broker-Dealer and Member of FINRA
Fixed Income Portfolio Management
 Fixed Income Portfolio Management Presented By: Marty Hammond, Managing Director Samantha Myers, Senior Analyst February 2019 PFM Asset Management LLC 821 Alexander Road Suite 110 Princeton, NJ 08540 609.452.0263
What s new in LDI Expanding the toolkit
 Pensions Conference 2012 Steven Catchpole What s new in LDI Expanding the toolkit 1 June 2012 Introduction The LDI toolkit is expanding Several new tools are becoming more common: Swaptions Gilt total
Managing market ups and downs. Three tips to help you invest with confidence RETIREMENT PLAN SERVICES
 RETIREMENT PLAN SERVICES Managing market ups and downs Three tips to help you invest with confidence Insurance products issued by: The Lincoln National Life Insurance Company Lincoln Life & Annuity Company
Fourth Quarter 2015 Market Review. March 2016
 Fourth Quarter 2015 Market Review March 2016 Agenda Market Review Investment Outlook and Portfolio Positioning 2 2015 was a Challenging Year for Investment Returns Last year was the first time since 2001
QUESTION 2. QUESTION 3 Which one of the following is most indicative of a flexible short-term financial policy?
 QUESTION 1 Compute the cash cycle based on the following information: Average Collection Period = 47 Accounts Payable Period = 40 Average Age of Inventory = 55 QUESTION 2 Jan 41,700 July 39,182 Feb 18,921
Investment Strategies for 1 st Quarter 2015
 Investment Strategies for 1 st Quarter 2015 Conference Call will begin at 11:00am CT, lines open at 10:50am CT Audio: 855-749-4750 Access Code: 929 460 526 You can also listen to the conference call audio
A Compelling Case for Leveraged Loans
 A Compelling Case for Leveraged Loans EXECUTIVE SUMMARY In the current market environment, there are a number of compelling reasons to invest in leveraged loans. In a situation where most assets are trading
Pandemics, Catastrophic Trends and Capital Issues
 Pandemics, Catastrophic Trends and Capital Issues John P. Cookson, F.S.A. Milliman, Inc. -0- Tail Risk Pandemic is the prime example Other risks could combine to reach this level Pandemic combines with
Executive Summary. July 17, 2015
 Executive Summary July 17, 2015 The Revenue Estimating Conference adopted interest rates for use in the state budgeting process. The adopted interest rates take into consideration current benchmark rates
THE CPR REPORT. 7(a) Prepays Go Back Below 9% 7(a) Pooling League Tables. Small Business Fact of the Month
 Prepays Go Back Below 9% 7(a) Pooling League Tables. Small Business Fact of the Month") Coleman & GLS THE CPR REPORT Providing the most detailed monthly SBA 7(a), 504 and SBIC prepayment, default and market information available anywhere. B O B J U D G E, G L S E D I T O R V O L U M E V O
Coleman & GLS THE CPR REPORT Providing the most detailed monthly SBA 7(a), 504 and SBIC prepayment, default and market information available anywhere. B O B J U D G E, G L S E D I T O R V O L U M E V O
Dallas Independent School District
 Dallas Independent School District Municipal Market Update, Outstanding Debt Profile and Preliminary Growth Rate/Tax Rate Sensitivity Analysis for November 2015 Bond Election October 6, 2015 Disclaimer
Q MARKET PERSPECTIVES. Matthew F. Beaudry, CPA, CIMA, CMFC, CRPC, AAMS Senior Investment Director, Capital Markets
 Q1 2018 MARKET PERSPECTIVES Matthew F. Beaudry, CPA, CIMA, CMFC, CRPC, AAMS Senior Investment Director, Capital Markets Table of contents Accelerating global growth: Odds of a U.S. and global economic
Q Supplemental Materials. July 27, 2018
 8 Q2 2018 Supplemental Materials July 27, 2018 Disclaimers Forward-Looking Information This presentation contains forward-looking statements and information. Statements that are not historical facts, including
XML Publisher Balance Sheet Vision Operations (USA) Feb-02
 Feb-02") Page:1 Apr-01 May-01 Jun-01 Jul-01 ASSETS Current Assets Cash and Short Term Investments 15,862,304 51,998,607 9,198,226 Accounts Receivable - Net of Allowance 2,560,786
Page:1 Apr-01 May-01 Jun-01 Jul-01 ASSETS Current Assets Cash and Short Term Investments 15,862,304 51,998,607 9,198,226 Accounts Receivable - Net of Allowance 2,560,786
Spheria Australian Smaller Companies Fund
 29-Jun-18 $ 2.7686 $ 2.7603 $ 2.7520 28-Jun-18 $ 2.7764 $ 2.7681 $ 2.7598 27-Jun-18 $ 2.7804 $ 2.7721 $ 2.7638 26-Jun-18 $ 2.7857 $ 2.7774 $ 2.7690 25-Jun-18 $ 2.7931 $ 2.7848 $ 2.7764 22-Jun-18 $ 2.7771
HUD NSP-1 Reporting Apr 2010 Grantee Report - New Mexico State Program
 HUD NSP-1 Reporting Apr 2010 Grantee Report - State Program State Program NSP-1 Grant Amount is $19,600,000 $9,355,381 (47.7%) has been committed $4,010,874 (20.5%) has been expended Grant Number HUD Region
Introduction to Asset/Liability Management
 Introduction to Asset/Liability Management WBA BOLT Summer Leadership Summit June 14, 2018 Presented by: Marc Gall, Vice President mgall@bokf.com 1 Agenda Asset/Liability Management and ALCO Meetings Defining
Market Update: Broad Market Returns and Indicators
 Market Update Eckler Ltd. collects information directly from sources believed to be reliable. Eckler Ltd. does not guarantee or warrant the accuracy, timeliness, or completeness of the information either
Challenges to monetary policy in the EMEs
 Challenges to monetary policy in the EMEs A view into the Brazilian Case Governor of the Banco Central do Brasil Ilan Goldfajn November 18th, 2017 Outline Benign international conditions and Emerging Markets
An Introduction to Small Business Administration Floating Rate Securities
 An Introduction to Small Business Administration Floating Rate Securities March 2018 Benjamin M. Clark Portfolio Strategies Group FTN Financial Outline 1. SBA securitization programs 2. Brief history of
Irvine Pooled Investment Portfolio Rolling 12-Month Quarterly Comparison
 Page 2 of 10 at quarter end and fiscal year end to the Investment Advisory Committee, Finance Commission, and City Council. The report includes investment activity and performance for each of the City
Looking at a Variety of Municipal Valuation Metrics
 Looking at a Variety of Municipal Valuation Metrics Muni vs. Treasuries, Corporates YEAR MUNI - TREASURY RATIO YEAR MUNI - CORPORATE RATIO 200% 80% 175% 150% 75% 70% 65% 125% Average Ratio 0% 75% 50% 60%
Russell 2000 Index Options
 Interactive Brokers Webcast Russell 2000 Index Options April 20, 2016 Presented by Russell Rhoads, Senior Instructor Disclosure Options involve risks and are not suitable for all investors. Prior to buying
Investing for Small Governments
 Tuesday MAY, 23 2017 10:20AM 12PM Investing for Small Governments MODERATOR SPEAKERS Al Rolek Finance Director, River Falls, WI John Grady Managing Director, Public Trust Advisors Darrel Thomas Assistant
Trends & Long-Term Outlook for Fixed and Stable Value Funds
 Trends & Long-Term Outlook for Fixed and Stable Value Funds CPPC Conference August 2013 Cathe Tocher CFA, Senior Vice President AGENDA Introduction: Short-term noise pay attention Preparing for the future:
FHCF Investment Update
 FHCF Investment Update Financial Market Recap Historical Yield Curves Benchmark Standings Investment Summaries by Maturity & Sector Monthly Return Comparisons Summary & Forecast Richard Smith, Portfolio
The Swan Defined Risk Strategy - A Full Market Solution
 The Swan Defined Risk Strategy - A Full Market Solution Absolute, Relative, and Risk-Adjusted Performance Metrics for Swan DRS and the Index (Summary) June 30, 2018 Manager Performance July 1997 - June
U. S. Economic Projections. GDP Core PCE Price Index Unemployment Rate (YE)
") The Federal Reserve will likely hold short-term interest rates steady until late 2015. U. S. Economic Projections 2014 2015 2014 2015 2014 2015 Stifel FI Strategy Group Forecast 2.5% 3.1% 1.4% 1.7% 6.4%
The Federal Reserve will likely hold short-term interest rates steady until late 2015. U. S. Economic Projections 2014 2015 2014 2015 2014 2015 Stifel FI Strategy Group Forecast 2.5% 3.1% 1.4% 1.7% 6.4%
THE CPR REPORT. 7(a) Prepays Stay Above 9% 7(a) Pooling League Tables. Small Business Fact of the Month
 Prepays Stay Above 9% 7(a) Pooling League Tables. Small Business Fact of the Month") Coleman & GLS THE CPR REPORT Providing the most detailed monthly SBA 7(a), 504 and SBIC prepayment, default and market information available anywhere. B O B J U D G E, G L S E D I T O R V O L U M E V O
Coleman & GLS THE CPR REPORT Providing the most detailed monthly SBA 7(a), 504 and SBIC prepayment, default and market information available anywhere. B O B J U D G E, G L S E D I T O R V O L U M E V O
BEST PRACTICES IN ASSET/LIABILITY MANAGEMENT. AMIfs Institute July 18, 2016 Monday Afternoon Session
 BEST PRACTICES IN ASSET/LIABILITY MANAGEMENT AMIfs Institute July 18, 2016 Monday Afternoon Session 1 Agenda - Introduction to ALM Monday, July 18 Afternoon Best Practices in ALM Structuring the ALCO Process
Moving On Up Today s Economic Environment
 Moving On Up Today s Economic Environment Presented by PFM Asset Management LLC Gray Lepley, Senior Analyst, Portfolio Strategies November 8, 2018 PFM 1 U.S. ECONOMY Today s Agenda MONETARY POLICY GEOPOLITICAL
U.S. Interest Rates Chartbook March 2018
 U.S. Interest Rates Chartbook March 2018 Takeaways At the March meeting, the FOMC voted unanimously to raise the Fed funds rate to 1.5%-1.75%. The newly appointed Chairman is committed to maintaining continuity
Early, But Fundamentally Correct
 Early, But Fundamentally Correct Economic Update By Avery Shenfeld, Chief Economist & Managing Director June 11, 29 A Shock Heard Round the World 6 5 4 3 2 1-1 -2 y/y % chg in W orld Real GDP Forecast
Capital Markets Update
 Capital Markets Update The Forces Transforming Markets November 2007 The Past December 2006 April 2007 The Height of the Market November 2007 Changes in Risk Tolerance Spring 2007 Rating Agencies Tighten
Interest Sensitive Fixed Income Market Data
 Interest Sensitive Fixed Income Market Data NORTH AMERICA April 2014 KEVIN FLANAGAN Morgan Stanley Wealth Management Chief Fixed Income Strategist Managing Director kevin.flanagan@morganstanley.com +1
moving mortgages talk to clients about the merits of variable-rate home loans.
 moving mortgages talk to clients about the merits of variable-rate home loans. BY Moshe A. Milevsky, associate professor of finance, Schulich School of Business, York University, and executive director,
Investing Liquidity in a Total Rate of Return World
 Investing Liquidity in a Total Rate of Return World April 2016 Not FDIC insured. May lose value. No bank guarantee. Not NCUA or NCUSIF insured. May lose value. No credit union guarantee. Agenda 1. Regulatory
Investment Perspectives. From The Global Investment Committee
 Investment Perspectives From The Global Investment Committee Global Risk Aversion Reached Extreme Levels Morgan Stanley Standardized Global Risk Demand Index As of October 15, 2014 Complacent Extreme Fear
Today's jobs data: what you need to know
 Trend Macrolytics, LLC Donald Luskin, Chief Investment Officer Thomas Demas, Managing Director Michael Warren, Energy Strategist Data Insights: Jobs Friday, December 7, 2018 Today's jobs data: what you
The Importance of Breakeven Curves NISA Investment Advisors, L.L.C.
 The Importance of Breakeven Curves NISA Investment Advisors, L.L.C. May 19, 2014 1 2014 NISA Investment Advisors, L.L.C. All rights reserved. All data presented are as of May 7, 2014, unless otherwise
Today's jobs data: what you need to know
 Trend Macrolytics, LLC Donald Luskin, Chief Investment Officer Thomas Demas, Managing Director Michael Warren, Energy Strategist Data Insights: Jobs Friday, January 4, 2019 Today's jobs data: what you
Today's jobs data: what you need to know
 Trend Macrolytics, LLC Donald Luskin, Chief Investment Officer Thomas Demas, Managing Director Michael Warren, Energy Strategist Data Insights: Jobs Friday, September 7, 2018 Today's jobs data: what you
Invesco Fixed Income Investment Insights Implications of corporate repatriation on money markets
 Invesco Fixed Income Investment Insights Implications of corporate repatriation on money markets March 6, 2018 Matt Bubriski Analyst Key takeaways Invesco Global Liquidity believes the repatriation of
Today's jobs data: what you need to know
 Trend Macrolytics, LLC Donald Luskin, Chief Investment Officer Thomas Demas, Managing Director Michael Warren, Energy Strategist Data Insights: Jobs Friday, August 3, 2018 Today's jobs data: what you need
5. interest rate options: cap and floor
 5. interest rate options: cap and floor MIFID complexity IR product description An interest rate option, similarly to a foreign exchange option used for the purpose of managing foreign exchange risk, is
Commercial Cards & Payments Leo Abruzzese October 2015 New York
 US, China and emerging markets: What s next for the global economy? Commercial Cards & Payments Leo Abruzzese October 2015 New York Overview Key points for 2015-16 Global economy struggling to gain traction
Capturing equity gains whilst protecting portfolios
 Capturing equity gains whilst protecting portfolios Edward Park Q2 2018 MSCI North America Total Return in USD (2017 Discrete Calendar Months) 4.00% 3.50% 3.00% 2.50% 2.00% 1.50% 1.00% 0% 0.00% Jan-17
PIMCO: The New Neutral
 PIMCO: The New Neutral Philanthropy Summit 2015 Investing in the New Neutral world April 2015 PIMCO Australia Pty Ltd ABN 54 084 280 508 AFS Licence 246862 Level 19, 363 George St. Sydney, NSW 2000 telephone:
The School District of Brevard County Market Update and Portfolio Review May 25, 2010
 The School District of Brevard County Market Update and Portfolio Review May 25, 2010 Asset Management LLC Presented By: Steven Alexander, Managing Director 300 South Orange Avenue, Suite 1170 Orlando,
Monthly Market Update August 2016
 Monthly Market Update August 2016 Steven Alexander, CTP, CGFO, CPPT, Managing Director D. Scott Stitcher, CFA, Director Richard Pengelly, CFA, CTP, Director Khalid Yasin, CHP, Senior Managing Consultant
MANAGING INTEREST RATE RISK: SETTING THE STAGE FOR TOMORROW MIKE DELISLE, ALM ADVISORS GROUP
 MANAGING INTEREST RATE RISK: SETTING THE STAGE FOR TOMORROW MIKE DELISLE, ALM ADVISORS GROUP WVBA Convention July 29, 2014 Agenda Evaluating and Anticipating the Rate Environment Understanding Your Current
Economic Update: Fed Delay Bought Calm. But is it Calm Enough to Hike Rates? 2016 AAM Investment Conference Chris Low FTN Financial Chief Economist
 Economic Update: Fed Delay Bought Calm. But is it Calm Enough to Hike Rates? May 2016 2016 AAM Investment Conference Chris Low FTN Financial Chief Economist Executive Summary 1 FOMC recognizes global inflation
Simon Potter August 4, 2018
 Confidence in the Implementation of U.S. Monetary Policy Normalization Remarks at the 23 rd EMEAP (Executives Meeting of East Asia-Pacific Central Banks) Governors Meeting Manila, Philippines Simon Potter
Interest Sensitive Fixed Income Market Data
 Interest Sensitive Fixed Income Market Data April 2013 NORTH AMERICA KEVIN FLANAGAN Morgan Stanley Wealth Management Chief Fixed Income Strategist Managing Director kevin.flanagan@morganstanley.com +1
Using Comparative Inventory to Bet Against the Oil Market
 Using Comparative Inventory to Bet Against the Oil Market Art Berman MacroVoices Live Vancouver January 19, 2019 Slide 1 Oil-Price Collapse and Previous Collapses $220 Oil-Price Collapse Appears to be
Balance Sheet Strategies in Today's Economic Environment May 2018
 Balance Sheet Strategies in Today's Economic Environment May 2018 Scott Hildenbrand Principal/Chief Balance Sheet Strategist (212) 466-7865 shildenbrand@sandleroneill.com Current Balance Sheet Management
Maintaining Public Sector Funding Access: The Importance of Preserving Money Market Mutual Funds (MMFs)
") Maintaining Public Sector Funding Access: The Importance of Preserving Money Market Mutual Funds (MMFs) New MMF regulations that were implemented in October 2016 are having major negative consequences
Maintaining Public Sector Funding Access: The Importance of Preserving Money Market Mutual Funds (MMFs) New MMF regulations that were implemented in October 2016 are having major negative consequences
CDO Market Overview & Outlook. CDOs in the Heartland. Lang Gibson Director of Structured Credit Research March 25, 2004
 CDO Market Overview & Outlook CDOs in the Heartland Lang Gibson Director of Structured Credit Research March 25, 24 23 featured record volumes despite diminishing arbitrage Global CDO Growth: 1995-23 $
Q Economic Outlook
 Q1 Economic Outlook Presented by: Craig Dismuke Chief Economic Strategist cdismuke@viningsparks.com 1/24/ Page 1 Q1 ECONOMIC OUTLOOK A. European Drama, Weak U.S. Growth, and Central Bank Intervention B.