Exhibition Place Budget Summary OPERATING BUDGET NOTES CONTENTS Service Performance Organization Chart 27
|
|
|
- Alberta Franklin
- 5 years ago
- Views:
Transcription


1 OPERATING BUDGET NOTES CONTENTS Overview Service Overview and Plan Preliminary Operating Budget by Service Issues for Discussion 22 Appendices Service Performance Preliminary Operating Budget by Expenditure Category Organization Chart 27 Exhibition Place 2018 OPERATING BUDGET OVERVIEW Exhibition Place is a diverse venue for major trade and public exhibitions, meetings, conventions, professional sports, entertainment, green technologies, and public celebrations. It hosts more than 350 events annually and attracts over 5.3 million visitors a year Budget Summary The total cost to deliver these services to Toronto residents is $ million gross and $0.150 million net as shown below: (in $000's) 2017 Budget 2018 Preliminary Budget Change $ % Gross Expenditures 50, , , % Revenues 50, , , % Net Expenditures (124.4) (150.0) (25.6) (20.6%) Through operational efficiencies and increased revenues, the Agency is able to fully offset its operating costs. 4. Summary of 2018 Service Changes Summary of 2018 New / Enhanced Service Priorities N/A 6. Inflows/Outflows to/from Reserves & Reserve Funds User Fee Rate Changes 33 CONTACTS Program: Diane Young Chief Executive Officer Tel: (416) dyoung@explace.on.ca Corporate: Judy Skinner Manager, Financial Planning Tel: (416) Judy.Skinner@toronto.ca
2 FAST FACTS Exhibition Place is Canada's largest entertainment venue and attracts over 5.5 million visitors a year. 192-acre parkland with 3,002 trees. Host to 6 of the 10 consumer exhibitions in Canada including the Canadian National Exhibition, Royal Agricultural Winter Fair, Toronto International Boat Show, National Home Show/Canada Blooms, and One-of-a- Kind Craft Show. The Enercare Centre is the largest trade and consumer show facility in Canada and the sixth (6th) largest in North America with over 1.1 million square feet of contiguous space A leader and world-class site for advanced green energy technology that was recently awarded a LEED EB:O&M Gold designation TRENDS 95% of meetings and events at Exhibition Place occur between September and June each year. Over 88% of waste collected at Exhibition Place is recycled or reused and diverted from landfills. Building Rental - Enercare Centre (Million) $12 $10 $8 $6 $4 KEY SERVICE DELIVERABLES FOR 2018 Exhibition Place is Canada's largest entertainment venue, responsible for managing 192-acre site, for providing inclusive and accessible parkland, and for serving as a destination for entertainment, recreation and sporting events, and public celebrations, while operating as a self-sustaining and environmentally responsible entity. The 2018 Preliminary Operating Budget will fund: The Enercare Centre which hosts national and community events, and shows such as the Royal Agricultural Winter Fair, Toronto International Boat Show, the National Home Show/Canada Blooms and the One of a Kind Craft Shows. The Beanfield Centre which hosts conventions, conferences and meetings, complementing the event activities at the Enercare Centre by attracting more international conferences, consumer and trade shows, exhibits, and festivals. The development of a green promotion strategy both externally and internally; achievement of net energy self-sufficiency; and reduction of the impact of Exhibition operations on all aspects of the environment The sustainment and enhancement of public assets; integration with the surrounding urban fabric; improvement of all forms of transportation needed for the grounds; and the integration between Exhibition Place and Ontario Place. $2 $ Proj 2018 Target Figures $7.0 $7.3 $10.8 $8.2 $8.0 $8.3 toronto.ca/budget2018 2
3 Where the money goes: 2018 Budget by Service Conventions, Conferences & Meetings, $4.9, 9% Exhibition Place Asset Management, $15.0, 27% OUR KEY ISSUES & PRIORITY ACTIONS Maintaining Positive Financial Performance: Exhibition Place exists in a competitive market requiring it to operate efficiently and generate new business to maintain positive financial performance Exhibitions & Events, $32.4, 59% $55.1 Million Exhibition Place Parking Access, $2.9, 5% The 2018 Preliminary Operating Budget aims to address budget pressures such as increasing labour costs and utility rates by pursuing the redevelopment and rental of the underutilized buildings and other business opportunities, various service efficiencies and utility savings initiatives. Pursuing Green initiatives to maintain Exhibition Place's status as a leader in environmentally friendly facilities Budget by Expenditure Category Service and Rent, $17.00, 33% Equipment, $0.46, 1% Contribution to Reserves/Reserve Funds, $2.12, 4% Where the money comes from: 2018 Budget By Funding Source Sundry and Other Revenues, $12.67, 23% Contribution From Reserves/Reserve Funds, $1.73, 3% $55.1 Million $55.1 Million Salaries and Benefits, $31.72, 62% User Fees, $40.70, 74% Exhibition Place will be introducing and activating a plan to target Net "0" grid supplied electricity use. Maintaining Trade and Consumer Show Business by creating a "self-contained" conference and accommodation space. Facilitating the completion of the sky-bridge from Hotel X to Beanfield Centre. Competing for a whole new segment of conference, meeting and convention business OPERATING BUDGET HIGHLIGHTS The 2018 Preliminary Operating Budget for Exhibition Place of $ million in gross expenditures provides funding for: Conventions, Conferences & Meetings ($4.852 million). Exhibitions & Events ($ million). Exhibition Place Asset Management ($ million). Exhibition Place Parking Access ($2.928 million). The Agency will achieve the budget target of - 0% by: Sharing it's Corporate Secretary function with the City of Toronto ($0.102 million) Outsourcing Exhibitor Service ($0.235 million) Increasing revenue from Canadian National Exhibition Association ($0.483 million) toronto.ca/budget2018 3
4 Actions for Consideration Approval of the 2018 Preliminary Budget as presented in these notes requires that: 1. City Council approve the 2018 Preliminary Operating Budget for Exhibition Place of $ million gross, $0.150 million net revenue for the following services: Service Gross ($000s) Net ($000s) Exhibitions & Events 32,366.9 (7,681.0) Conventions, Conferences & Meetings 4, Exhibition Place Asset Management 14, ,131.0 Exhibition Place Parking Access 2,928.8 (4,894.5) Total Program Budget 55,110.6 (150.0) 2. City Council approve the 2018 service levels for Exhibition Place as outlined on pages 15, 17, 19, and 21 of this report, and associated staff complement of operating service delivery positions and 5.0 capital project delivery positions. 3. City Council approve the 2018 market rate user fee changes for Exhibition Place identified in Appendix 7, for inclusion in the Municipal Code Chapter 441 Fees and Charges. toronto.ca/budget2018 4
5 Part Service Overview and Plan toronto.ca/budget2018 5

6 Program Map toronto.ca/budget2018 6
7 Table Preliminary Operating Budget and Plan by Service Preliminary Operating Budget Budget Projected Base New/ Enhanc ed Total Budget 2018 Preliminary vs Budget Incremental Change (In $000s) Change Plan Plan By Service $ $ $ $ $ $ % $ % $ % Exhibitions & Events Gross Expenditures 27, , , , % % % Revenue 35, , , , % % % Net Expenditures (7,856.9) 0.0 (7,681.0) 0.0 (7,681.0) (2.2%) (113.3) 1.5% (136.4) 1.7% Conventions, Conferences & Meetings Gross Expenditures 4, , ,852.2 (136.3) (2.7%) % % Revenue 4, , ,557.5 (80.9) (1.7%) % % Net Expenditures (55.4) (15.8%) (9.0) (3.1%) (9.7) (3.4%) Exhibition Place Asset Management Gross Expenditures 15, , ,962.8 (143.4) (0.9%) % % Revenue 2, , , % % % Net Expenditures 12, , ,131.0 (339.6) (2.7%) % % Exhibition Place Parking Access Gross Expenditures 2, , , % % % Revenue 7, , , % % % Net Expenditures (5,088.0) 0.0 (4,894.5) 0.0 (4,894.5) (3.8%) (98.7) 2.0% (100.2) 2.0% Total Gross Expenditures 50, , , , % 1, % 1, % Revenue 50, , , , % 1, % 1, % Total Net Expenditures (124.4) 0.0 (150.0) 0.0 (150.0) (25.6) 20.6% (50.0) 33.3% (0.0) 0.0% Approved Positions (3.0) (0.8%) The Exhibition Place s 2018 Preliminary Operating Budget is $ million gross and $ million net, representing a 20.6% increase in net revenue above the 2017 Approved Net Operating Budget and exceeds the reduction target of 0% as set out in the 2018 Operating Budget Directions approved by Council. Base pressures are mainly attributable to salaries and benefits, inflationary cost increases, and one-time equipment expense. To offset the above pressures, the Program was able to achieve service efficiency savings through sharing of its corporate secretary service with the City of Toronto, outsourcing of Exhibitor service and additional revenue from the Canadian National Exhibition Association. Approval of the 2018 Preliminary Operating Budget will result in Exhibition Place reducing its total staff complement by 3.0 positions from to The 2019 and 2020 Plan increases are attributable to increases in salaries and benefits, event support costs and various other expenditures offset by increases in revenues from volume increases for events and conferences maintaining small net surpluses going forward toronto.ca/budget2018 7

8 The following graphs summarize the operating budget pressures for Exhibition Place and the actions taken to offset/reduce these pressures to meet the budget reduction target. Key Cost Drivers Actions to Achieve Budget Reduction Target toronto.ca/budget2018 8
9 Table 2 Key Cost Drivers Exhibitions & Events 2018 Base Operating Budget Conventions, Exhibition Conferences & Place Asset Meetings Management Exhibition Place Parking Access (In $000s) $ $ $ $ $ Position Gross Expenditure Changes Prior Year Impacts PBF Correction Salaries and Benefits COLA 88.4 (24.3) Progression Pay Salary Adjustments (Overtime Trades & Others) Benefit Adjustments Economic Factors Additional Utilities Utilities Increase (Volume and Inflationary based) Other Base Expenditure Changes Utilities Increase- Volume Based Reduction in Project Management reimbursement 43.8 (93.8) (50.0) Third Party Services - Increase Extend Amortization of Conference Centre Loan (369.7) (369.7) Total Gross Expenditure Changes 1,093.6 (76.8) ,427.0 Revenue Changes Base Revenue Changes User Fees (506.8) (232.0) (329.5) (34.0) (1,102.3) Cost Recoveries (103.5) (20.8) (1.7) (126.0) Contributions to/from Reserves Total Revenue Changes (475.2) 80.9 (325.3) (35.7) (755.3) Net Expenditure Changes 1,568.8 (157.7) Total Major cost drivers for Exhibition Place are discussed below: Gross Expenditure Changes Salaries and Benefits: Standard inflationary increases to salaries and benefits as well as increased overtime for trade persons for 2018, results in a gross expenditure increase of $0.563 million. Utilities Increase: Through the increase of events, conferences, conventions and meetings hosted by the Exhibition Place utility costs are anticipated to increase by $0.308 million. Loan Repayment: In December of 2016, Council approved an extended repayment term and amortization schedule for the Conference Centre Loan by five years ending in 2040, reducing annual payments by $0.370 million. Third Party Services: Increased third party services due to increased parking costs, paid duty police officers and services provided through third parties will result in a gross expenditure increase of $0.999 million. toronto.ca/budget2018 9
10 Revenue Changes User Fees Increases: Exhibitions and Events: Inflationary increases and additional rental income from the anticipated event mix for 2018 are expected to result in a user fee revenue increase of $0.507 million. Conventions, Conferences and Meetings: There is an anticipated increase in the number of events that will be booked at the Beanfield Centre and a consequent increase in parking revenues from the increased bookings resulting in a user fee revenue increase of $0.232 million. Exhibition Place Parking Access: Additional parking revenues (net of parking rebate) are expected from Argos games being hosted in 2018 at the BMO Field as well as a general increase in anticipated volumes for Toronto FC resulting in user fee revenue increase of $0.330 million. In order to achieve the budget reduction target, Exhibition Place achieved service efficiency savings of $0.338 million net, for a total of $0.150 million net and a revenue increase of $0.483 million for a total of $0.822 million net as detailed below. Table 3 Actions to Achieve Budget Reduction Target Description ($000s) Exhibitions & Events Conventions, Conferences & Meetings Service Changes Total Service Changes Incremental Change Exhibition Place Asset Management Exhibition Place Parking Access $ $ # 2019 Plan 2020 Plan Gross Net Gross Net Gross Net Gross Net Gross Net Pos. Net Pos. Net Pos. Service Efficiencies Outsourced Exhibitor Service (235.9) (235.9) (235.9) (235.9) (2.0) (2.9) (3.0) Shares Corporate Secretary with City (102.3) (102.3) (102.3) (102.3) (1.0) (4.0) (4.1) Sub-Total (102.3) (102.3) (235.9) (235.9) (338.2) (338.2) (3.0) (6.9) (7.1) Revenue Adjustments Additional Leases & Service Revenue from CNEA 3,336.0 (483.3) 3,336.0 (483.3) (6.0) (6.1) Sub-Total 3,336.0 (483.3) 3,336.0 (483.3) (6.0) (6.1) Total Changes 3,233.7 (585.6) (235.9) (235.9) 2,997.8 (821.5) (3.0) (13.0) (13.2) Service Efficiencies (Savings of $0.338 million gross and $0.338 million net) Outsourced Exhibitor Service In 2017, the electrical and mechanical services to exhibitors were outsourced. With these services provided by a third party, 2 positions were eliminated and savings of $0.236 million will be realized in Shares Corporate Secretary with City Corporate Secretary functions will be shared with the City to provide savings of $0.102 million in 2018 as well as the elimination of 1 position. Services will be provided by the City Clerk on a cost recovery basis with some remaining duties delivered by Exhibition staff. toronto.ca/budget
11 Revenue Adjustments ($3.336 gross & $0.483 million net) Additional Leases & Service Revenue from Canadian National Exhibition Association Additional Lease Revenue of $3.336 million gross, $0.483 million net will be received in 2018 as the CNEA will pay additional costs on the use of the Press and Food Buildings according to its agreement with Exhibition Place. Approval of the 2018 Preliminary Operating Budget for Exhibition Place will result in 2019 incremental net cost of $ million and a 2020 incremental net cost of $0.004 million to maintain 2018 service levels, as discussed in the following section. Table and 2020 Plan by Program Gross Expense Incremental Increase Incremental Increase Revenue Net Expense % Change Position Gross Expense Revenue Net Expense % Change Description ($000s) Known Impacts: Salaries and Benefits COLA (11.33) (11.3) Progression Pay (0.6) Salary Adjustments (Overtime Trades & Others) (2.3) Benefit Adjustments (1.0) Other Base Expenditure Changes Utilities Increase- Volume Based (0.5) Third Party Services - Increase (1.0) Extend Amortization of Conference Centre Loan (18.49) (18.5) 0.1 (19.41) (19.4) Sharing Corporate Secretary (4.00) (4.0) (4.10) (4.1) Outsource Exhibitor Service (2.95) (2.9) (2.99) (3.0) Reclassifcy districy energy system revenue Revenue (specify) User Fees (872.1) (872.4) Cost Recoveries (176.7) (179.9) Additional Leases & Service Revenue (6.0) (6.1) Reduction in project management (50.0) Contributions to/from Reserves (25.00) 25.0 (0.1) Sub-Total 1, ,132.5 (50.0) 1, ,721.9 (0.0) Position Total Incremental Impact 1, ,132.5 (50.0) 1, ,721.9 (0.0) Future year incremental costs are primarily attributable to the following: Known Impacts: Salaries and Benefits from anticipated inflationary increases in 2019 and 2020 of $0.772 million and $1.554 million, respectively. Revenues from anticipated volume increases for events and conferences (including inflation) contribute to increased revenues of $0.872 million. There is a corresponding increase in other expenditures relating to event support costs and third party services of $0.293 million offset by increased cost recoveries of $0.176 million. toronto.ca/budget

12 Part Preliminary Operating Budget by Service toronto.ca/budget
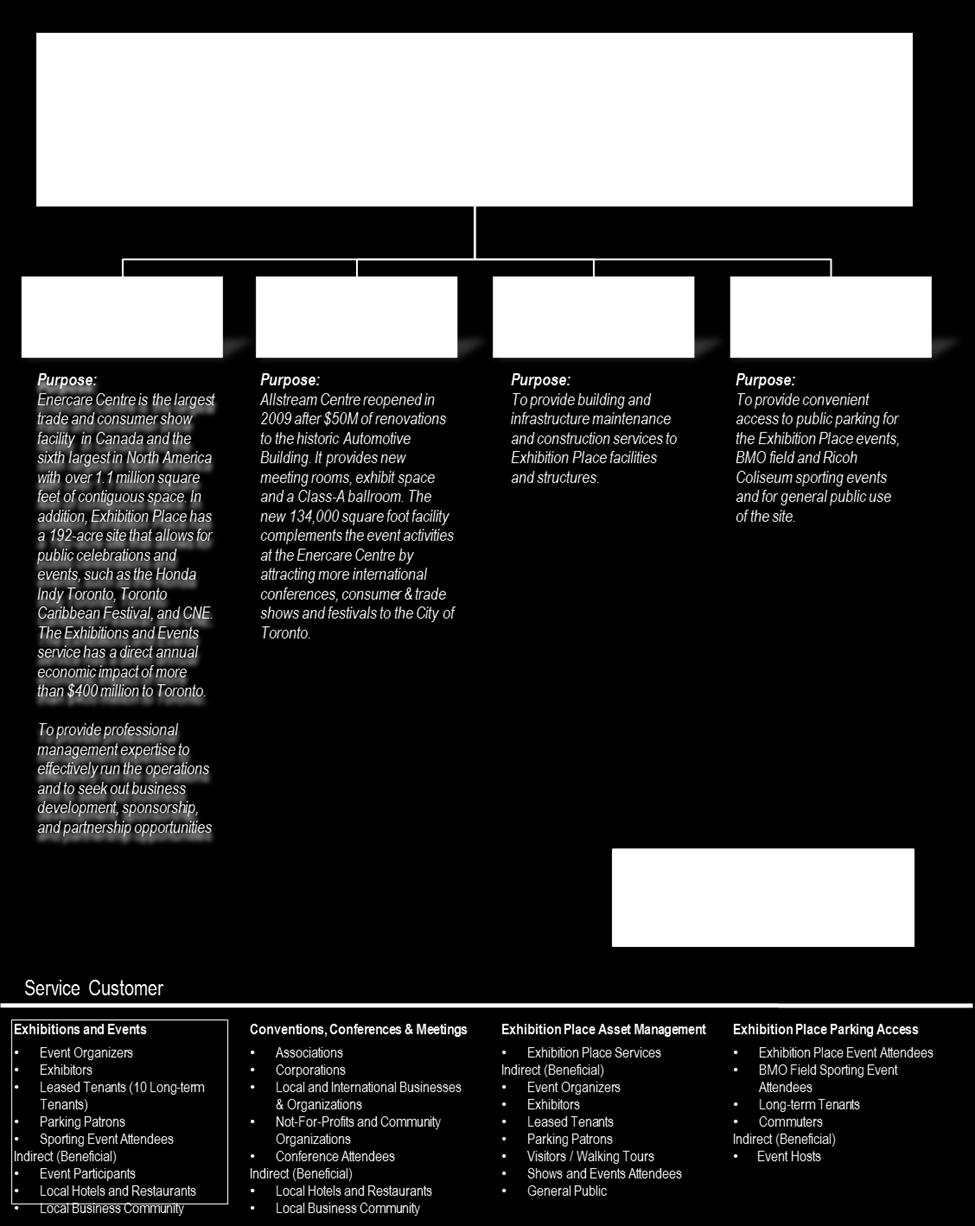
13 Exhibition & Events What We Do Exhibition & Events Event - Trade & Consumer Event - Meetings & Corporate Event - Community / Festivals / City of Toronto / Sporting / Photo & Film Event - Major Citywide celebrations & special events Enercare Centre is the largest trade and consumer show facility in Canada and the sixth largest in North America with over 1.1 million square feet of continuous space. The Exhibition Place has a 192-acre site that allows for public celebrations and events, such as the Honda Indy Toronto, Toronto Caribbean Festival and the Canadian National Exhibition. The Exhibitions & Events Service has a direct annual economic impact of more than $350 million to Toronto. Guest Services: Food & Beverage Guest Services: Facility Support Long-term Tenant Support 2018 Service Budget by Activity ($Ms) 2018 Service by Funding Source ($Ms) Exhibitions & Events, $32.37, 100% Property Tax, (7.68), -16% User Fees, 27.61, 58% $32.4 Million $32.4 Million Sundry and Other Revenues, 12.33, 26% toronto.ca/budget
14 Effectiveness Measure Tenants Rent & Net Show Services ($Millions) $3 $3 $2 experience suggests that Enercare Centre is projected to grow its occupancy rates and number of events hosted. $2 $1 $1 $ Proj 2018 Plan Rent $1.6 $2.0 $2.1 $2.5 $2.6 $2.6 Show Service $0.1 $0.1 $0.2 $0.2 $0.1 $0.1 Table Preliminary Service Budget by Activity Preliminary Operating Budget Approved Budget Base Budget Service Changes Preliminary Base Prelim. Base Budget vs Budget New/ % Change Enhanced Prelim Budget 2018 Prelim Budget Incremental Change vs Budget 2019 Plan 2020 Plan ($000s) $ $ $ $ $ % $ $ $ % $ % $ % GROSS EXP. Exhibitions & Events 27, , , , , % 32, , % % % Total Gross Exp. 27, , , , , % 32, , % % % REVENUE Exhibitions & Events 35, , , , , % 40, , % % % Total Revenues 35, , , , , % 40, , % % % NET EXP. Exhibitions & Events (7,856.9) (7,095.5) (585.6) (7,681.0) (2.2%) (7,681.0) (2.2%) (113.3) 1.5% (136.4) 1.7% Total Net Exp. (7,856.9) (7,095.5) (585.6) (7,681.0) (2.2%) (7,681.0) (2.2%) (113.3) 1.5% (136.4) 1.7% Approved Positions (1.0) (1.0) (0.4%) (1.0) (0.4%) 0.0% The Exhibitions and Events provides a number of hosted events at the Enercare centre. The Exhibitions and Events' 2018 Preliminary Operating Budget of $ million gross and $7.681 million net is $0.175 million or 2.2% under or over the 2017 Approved Net Budget. toronto.ca/budget
15 2018 Service Levels Exhibition & Events Activity Service Level Description Status Event - Trade & Consumer % compliance with negotiated terms Approved % % % % Event - Meetings & Corporate % compliance with negotiated terms Approved % % % % Event - Community / % compliance with Festivals / City of negotiated terms Toronto / Sporting / Photo & Film Approved % % % % Event - Major Citywide celebrations & special events % compliance with negotiated terms Approved % % % % Guest Services: Food & Beverage $X food & beverage sales per attendee Approved $4.67 $11.33 $4.87 $5.09 Guest Services: Facility Support $X of Service Revenue per $1 of Rent Revenue Efficiencies Outsourcing Approved $0.75 $0.53 $0.67 $0.67 Approved Approved Closing creative sign service Closing creative sign service Outsourcing Wielding Service Outsourcing Wielding Service Outsourcing Exhibitor Service Sharing Corporate Secretary Service with City Long-term Tenant Support $X per Square foot of longterm tenant space supported Approved $11.10 $11.61 $10.29 $10.39 Overall, the 2018 Service Levels are largely consistent with the approved 2017 Service Levels for Exhibition & Events with the following exceptions: Guest Services: Food & Beverage activity has been adjusted to a level consistent with pre-2016 levels. Exhibition Place anticipates increased volumes for food and beverages in 2018 at the Allstream Centre given the anticipated event mix for the year. Guest Services: Facility Support and Long-term Tenant Support have been adjusted to align with the experience in toronto.ca/budget
16 Conventions, Conference & Meetings Conventions, Conferences & Meetings Event Space Guest Services: Food & Beverage Guest Services: Facility Support Guest Services: Parking What We Do Beanfield Centre is a 160,000 square foot, LEED Silver-certified conference facility which reopened in October 2009 after a $50 million renovation to the historic Automotive Building. The Centre provides new meeting rooms, exhibit space as well as a Class A ballroom. The facility complements the exhibition and convention activities at the Enercare Centre and Exhibition Place by attracting more international conferences, consumer/trade shows, and festivals to the City of Toronto Service Budget by Activity ($Ms) $4.9 Million Conventions, Conferences & Meetings, $4.85, 100% 2018 Service by Funding Source ($Ms) Property Tax, 0.29, 6% Contribution From Reserves/Reserve Funds, 1.06, 22% $4.9 Million User Fees, 3.50, 72% Efficiency Measure - Events Building Rent Beanfield Centre ($Millions) $12 $10 $8 $6 $4 $2 $ Proj 2018 Plan Series1 $7.0 $7.3 $10.8 $8.2 $8.0 $8.3 With the successful Pan Am Games events in 2015 and the NBA All Star Jam Session in 2016, Exhbition Place has solidified its leadership position in hosting a large variety of events, complemented with excellent facility support and amenities and 2016 consist of one-time revenues from the Pan Am Games and the NBA All Star Jam Session respectively. toronto.ca/budget
17 2018 Service Levels Conventions, Conferences and Meetings Activity Service Level Description Status X% compliance with Approved 100% 100% 100% 100% Event Space negotiated terms Guest Services: Food & Beverage $X food and beverage sales per attendee Approved $90.21 $88.86 $78.40 $90.91 Guest Services: Facility Support Guest Services: Parking $X of Net Service Revenue per $1 of total rent Labour cost ratio of X% of revenue Approved $0.32 $0.30 $0.22 $0.23 Approved 9.00% 8.20% 8.00% 8.00% Overall, the 2018 Service Levels are consistent with the approved 2017 Service Levels for Conventions, Conferences and Meetings with adjustments to align to the actual experience in Table Preliminary Service Budget by Activity Preliminary Operating Budget Incremental Change Prelim. Base Approved Base Service Preliminary Budget vs New/ Enhance Prelim 2018 Prelim Budget Budget Budget Changes Base Budget % Change d Budget vs Budget 2019 Plan 2020 Plan ($000s) $ $ $ $ $ % $ $ $ % $ % $ % GROSS EXP. Conventions, Conferences & Meetings 4, , ,852.2 (136.3) (2.7%) 4,852.2 (136.3) (2.7%) % % Total Gross Exp. 4, , ,852.2 (136.3) (2.7%) 4,852.2 (136.3) (2.7%) % % REVENUE Conventions, Conferences & Meetings 4, , ,557.5 (80.9) (1.7%) 4,557.5 (80.9) (1.7%) % % Total Revenues 4, , ,557.5 (80.9) (1.7%) 4,557.5 (80.9) (1.7%) % % NET EXP. Conventions, Conferences & Meetings (55.4) (15.8%) (55.4) (15.8%) (9.0) -3.1% (9.7) (3.4%) Total Net Exp (55.4) (15.8%) (55.4) (15.8%) (9.0) -3.1% (9.7) (3.5%) Approved Positions % The Conventions, Conferences and Meetings service provides increased profitability for the Beanfield Centre and grows the number of hosted events. The Conventions, Conferences and Meetings' 2018 Preliminary Operating Budget of $4.852 million gross and $.294 million net is $0.055 million or 15.8% under the 2017 Approved Net Budget. In addition to the base budget pressures common to all services, this service is experiencing increased competition in this industry. toronto.ca/budget
18 Exhibition Place Asset Management Exhibition Place Asset Management Parking Lots, Roads & Sidewalks What We Do Provide building and infrastructure maintenance and construction services to Exhibition Place facilities and structures. Waste Management Fleet & Equipment Maintenance 2018 Service Budget by Activity ($Ms) Exhibition Place Asset Management, $14.96, 100% $15.0 Million 2018 Service by Funding Source ($Ms) Property Tax, 12.13, 81% $15.0 Million User Fees, 1.81, 12% Contribution From Reserves/Reserve Funds, 0.58, 4% Sundry and Other Revenues, 0.45, 3% Efficiency Measure Utilities Savings from ERP Projects ($000) $900 Savings in energy costs are projected $800 at a level similar to Further $700 savings are dependent on future Green $600 Energy projects. $500 Savings thus far are due to various $400 Energy Retrofit Projects: Photovoltaic at $300 the Horse Palace and East Annex, hall $200 lighting at Enercare Centre, Five $100 Exhibition Place Buildings retrofit, boiler replacements, LED Pathway lights, $ Back Pressure Steam-turbine, Press Proj Plan Building Geothermal, and underground parking lights. Series1 $783 $742 $809 $567 $542 $548 toronto.ca/budget
19 2018 Service Levels Exhibition Place Asset Management Activity Service Level Description Status Parking Lots, Roads & Sidewalks Waste Management Fleet & Equipment Maintenance Maintain Parking Lots, Roads & Sidewalks in good condition for public access; increase sustainability and reduce failure of Exhibition Place Assets; effective investment of Capital funds; ensure preservation of Historical site and area Waste diversion of % Maintain current X vehicles and X pieces of equipment and additional acquisitions Approved Maintain Parking Lots, Roads & Sidewalks in good condition for public access; increase sustainability and reduce failure of Exhibition Place Assets; effective investment of Capital funds; ensure preservation of Historical site and area Maintain Parking Lots, Roads & Sidewalks in good condition for public access; increase sustainability and reduce failure of Exhibition Place Assets; effective investment of Capital funds; ensure preservation of Historical site and area Maintain Parking Lots, Roads & Sidewalks in good condition for public access; increase sustainability and reduce failure of Exhibition Place Assets; effective investment of Capital funds; ensure preservation of Historical site and area Maintain Parking Lots, Roads & Sidewalks in good condition for public access; increase sustainability and reduce failure of Exhibition Place Assets; effective investment of Capital funds; ensure preservation of Historical site and area Approved 85.15% 85.74% 88.20% 88.20% Approved 43 Vehicles, 73 Piece of Equipment 43 Vehicles, 73 Piece of Equipment 43 Vehicles, 73 Piece of Equipment 43 Vehicles, 73 Piece of Equipment Overall, the 2018 Service Levels are consistent with the approved 2017 Service Levels for Exhibition Place Asset Management. There will be a continued focus on improving the service's waste management operations. Table Preliminary Service Budget by Activity Preliminary Operating Budget Incremental Change Prelim. Base Budget vs. Approved Base Service Preliminary 2016 New/ Prelim 2018 Prelim Budget Budget Budget Changes Base Budget % Change Enhanced Budget vs Budget 2019 Plan 2020 Plan ($000s) $ $ $ $ $ % $ $ $ % $ % $ % GROSS EXP. Exhibition Place Asset Management 15, ,198.7 (235.9) 14,962.8 (143.4) (0.9%) 14,962.8 (143.4) (0.9%) % % Total Gross Exp. 15, ,198.7 (235.9) 14,962.8 (143.4) (0.9%) 14,962.8 (143.4) (0.9%) % % REVENUE Exhibition Place Asset Management 2, , , % 2, % % % Total Revenues 2, , , % 2, % % % NET EXP. Exhibition Place Asset Management 12, ,366.9 (235.9) 12,131.0 (339.6) (2.7%) 12,131.0 (339.6) (2.7%) % % Total Net Exp. 12, ,366.9 (235.9) 12,131.0 (339.6) (2.7%) 12,131.0 (339.6) (2.7%) % % Approved Positions (2.0) 81.0 (2.0) (2.4%) 81.0 (2.0) (2.4%) 0.0% The Exhibition Place Asset Management provides increases sustainability of Exhibition Place Asset and an effective investment of Capital funds. The Exhibition Place Asset Management's 2018 Preliminary Operating Budget of $ million gross and $ million net is $0.339 million or 2.7% under the 2017 Approved Net Budget. toronto.ca/budget
20 Exhibition Place Parking Access What We Do Exhibition Place Parking Access Surface Provide convenient access to public parking for Exhibition Place events, BMO Field sporting events, and general public. Underground 2018 Service Budget by Activity ($Ms) $2.9 Million Exhibition Place Parking Access, $2.93, 100% 2018 Service by Funding Source ($Ms) Property Tax, (4.89), -37% $2.9 Million User Fees, 7.78, 61% Efficiency Measures Parking Revenue and Direct Wages ($ Millions) $9 $8 $7 $6 $5 $4 $3 $2 $1 $ Proj 2018 Plan Revenue $6.7 $7.0 $7.3 $7.6 $7.8 $7.8 Labour $0.6 $0.7 $0.9 $0.9 $0.6 $0.6 Parking revenue and direct labour costs have performed at a consistent level over the previous years. Current revenue levels are sustainable given the greater level of activity from Argos games being hosted in 2018 at the BMO Field as well as a general increase in anticipated volumes for Toronto FC. Ratio between the parking revenue and direct labour costs has improved over the previous years. toronto.ca/budget
21 2018 Service Levels Exhibition Place Parking Access Activity Service Level Description Status X% of parking spaces Approved % % % % Surface available and accessible for all major events. Variable labour cost ratio of Approved 9.00% 8.20% 8.00% 8.00% X% of revenue X% of parking spaces available and accessible for Approved % % % % all major events. Underground Variable labour cost ratio of Approved 9.00% 8.20% 8.00% 8.00% X% of revenue Overall, the 2018 Service Levels are consistent with the approved 2017 Service Levels for Exhibition Place Parking Access. Table Preliminary Service Budget by Activity Preliminary Operating Budget Incremental Change Prelim. Base Budget vs. Approved Base Service Preliminary 2016 New/ Prelim 2018 Prelim Budget Budget Budget Changes Base Budget % Change Enhanced Budget vs Budget 2019 Plan 2020 Plan ($000s) $ $ $ $ $ % $ $ $ % $ % $ % GROSS EXP. Exhibition Place Parking Access 2, , , % 2, % % % Total Gross Exp. 2, , , % 2, % % % REVENUE Exhibition Place Parking Access 7, , , % 7, % % % Total Revenues 7, , , % 7, % % % NET EXP. Exhibition Place Parking Access (5,088.0) (4,894.5) (4,894.5) (3.8%) (4,894.5) (3.8%) (98.7) 2.0% (100.2) 2.0% Total Net Exp. (5,088.0) (4,894.5) (4,894.5) (3.8%) (4,894.5) (3.8%) (98.7) 2.0% (100.2) 2.0% Approved Positions % The Exhibition Place Parking Access provides convenient access to event parking. The Exhibition Place Parking Access' 2018 Preliminary Operating Budget of $2.928 million gross and $4.894 million net is $0.193 million or 3.8% under the 2017 Approved Net Budget. toronto.ca/budget
22 Part 3 Issues for Discussion toronto.ca/budget
23 Issues Impacting the 2018 Budget Budget Target Exhibition Place has exceeded the Council adopted budget target of 0% change from the 2017 Approved Net Operating Budgets for all City Programs and Agencies through service efficiency measures and additional revenue. Exhibition Place is projecting a gross expenditure of $ million and a net revenue of $0.150 million, representing a 20.6% net revenue increase from Exhibition Place will see base pressures in 2018 of $1.648 million due to inflationary increases to salaries and benefits as well as utilities. However, the implementation of the service efficiencies and additional revenue will offset the base pressures. Maintaining Positive Financial Performance Exhibition Place operates in a very competitive market in Toronto and the surrounding Greater Toronto Area, as it continues to strive to generate new business and to maximize profitability. The budgetary objective for this Agency is to stabilize or decrease expenditures through the redevelopment and rental of the underutilized buildings and other business opportunities. This objective is actively pursued each year to accommodate annual budget pressures which include cost of living increases and utility costs. toronto.ca/budget
24 Appendices toronto.ca/budget
25 Key Service Accomplishments In 2017, Exhibition Place accomplished the following: Approved Strategic Plan Appendix Service Performance Maintained an average of 88.44% rating from client satisfaction surveys Promoted safety in the workplace, year-over-year decrease in lost time injuries Exceeded budget targets, from Surplus Transfer to the City of $20.7M Improved events attendance and occupancy Continued to promote environmental initiatives and energy conservation, incentive revenue and utilities cost savings from these projects is approximately $0.548M per year Participated in International Green Venue Survey & recognized for achievements Diversification of customer target group for shows and events to include more film shoots, religious and cultural events and private functions Consolidated parking staff to east end of grounds New tenants at Queen Elizabeth Executive Offices, Police Building and Food Building Increasing efficiency by eliminating Welding Service, outsourcing Exhibitor Service, outsourcing Welding Service, and sharing Corporate Secretary Service with City Clerk s Office Completion of CNEA master agreement for renewal term April 2017 March 2022 Successful delivery of 2017 Centennial Hockey Classic and MLS Cup events New Naming sponsorship for Beanfield Centre (formerly Allstream Centre) Concluded eight new collective agreements Secured funding and implemented equipment / asset renewal program Completed District Energy System for Hotel, Beanfield Centre & Enercare Centre Implemented outdoor Wi-Fi network Implemented new Payroll/HRIS cloud base solution Reconfigured roadways and completed 2.5km of bicycle lanes that stretches from Dufferin Gate to Princes Gate and connects to Martin Goodman Trail Planted twelves oak trees on ground to help us honour the memory of the Canadian forces who secured Vimy Ridge in April 1917 and changed the course of our Nation s history and to celebrate Canada s 150th birthday toronto.ca/budget
26 Appendix Preliminary Operating Budget by Expenditure Category Program Summary by Expenditure Category Change from Projected Preliminary 2017 Approved Plan Category of Expense Budget * Budget Budget ($000's) $ $ $ $ $ $ % $ $ Salaries And Benefits 33, , , , , % 32, ,250.2 Materials & Supplies 2, , , , , % 3, ,046.4 Equipment (315.8) (40.6%) Service And Rent 14, , , , , , % 17, ,040.4 Contribution To Reserves/Reserve Funds 1, , , , , % 2, ,116.0 Total Gross Expenditures 53, , , , , , % 56, ,915.0 User Fees & Donations 37, , , , , , % 41, ,523.5 Contribution From Reserves/Reserve Funds 1, , , , ,732.5 (767.9) (30.7%) 1, ,707.5 Sundry and Other Revenues 15, , , , , % 13, ,884.0 Total Revenues 53, , , , , , % 56, ,115.0 Total Net Expenditures (495.9) (1,862.9) (124.4) 0.00 (150.0) (25.6) 20.6% (200.0) (200.0) Approved Positions (3.0) (0.8%) * Based on the 9-month Operating Variance Report Exhibition Place is projecting an unfavourable year-end variance of $0.124 million from the 2017 Approved Net Operating Budget due to higher than expected property tax assessment. For additional information regarding the 2017 Q3 operating variances and year-end projections, please refer to the attached link for the report entitled "Operating Variance Report for the Nine-Month Period Ended September 30, 2017" considered by City Council at its meeting on November 27, There are no impacts from the 2017 Operating Variance on the 2017 Operating Budget. In accordance with the decision of City Council in December 2007, any operating surplus over the budgeted surplus will be deposited in the Exhibition Place Conference Centre Reserve Fund (CCRF) to be held by the City of Toronto to provide a source of funding for any cash shortfalls with respect to Beanfield Centre operations. toronto.ca/budget

27 Appendix Organization Chart Category 2018 Total Complement Senior Management Management with and without Direct Reports/Exempt Professional & Clerical Union Total Permanent Operating Temporary Total Operating Permanent Capital Temporary Total Capital Grand Total toronto.ca/budget
28 Appendix 4 Summary of 2018 Service Changes toronto.ca/budget
29 2018 Operating Budget - Preliminary Service Changes Summary by Service ($000's) Form ID Agencies - Cluster Program - Exhibition Place Gross Expenditure Revenue Adjustments Net Approved Positions 2019 Plan Net Change 2020 Plan Net Change 2018 Preliminary Base Budget Before Service Changes: 52, , (37.0) Sharing Corporate Secretary with City 51 No Impact Description: Exhibition Place will use Corporate Secretary service provided by City of Toronto instead of hiring one full time Corporate Secretary. This will result in estimated annual saving of $102,264 wages and benefits Service Level Impact: There is no impact on service delivery standard Equity Statement: This proposal has no equity impacts Service: Exhibitions & Events Preliminary Service Changes: (102.3) 0.0 (102.3) (1.00) (4.0) (4.1) Total Preliminary Service Changes: (102.3) 0.0 (102.3) (1.00) (4.0) (4.1) Outsource Exhibitor Service 51 No Impact Description: To budget anticipated ($235,931) wages and benefits cost saving from outsourcing exhibitor service order processing to third party service provider. Service Level Impact: There is no impact on service delivery standard Equity Statement: This proposal has no equity impacts Service: Exhibition Place Asset Management Preliminary Service Changes: (235.9) 0.0 (235.9) (2.00) (2.9) (3.0) Category: 51 - Efficiency Change 52 - Revenue Change 59 - Service Change Page 1 of 2 Run Date: 12/05/ :37:49
30 2018 Operating Budget - Preliminary Service Changes Summary by Service ($000's) Form ID Agencies - Cluster Program - Exhibition Place Gross Expenditure Revenue Adjustments Net Approved Positions 2019 Plan Net Change 2020 Plan Net Change Total Preliminary Service Changes: (235.9) 0.0 (235.9) (2.00) (2.9) (3.0) Additional Lease & Service Revenue from CNEA 52 No Impact Description: Summary: To estimate additional revenue from Press and Food buildings leases to CNEA ($83,000/annually) and cost plus 12% mark up on service ($3,335,953 labour and materials cost +12% mark up) arising from previously agreed lease renewal terms Service Level Impact: There is no change in service delivery standard Equity Statement: This proposal has no equity impacts. 7, Service: Exhibitions & Events Preliminary Service Changes: 3, ,819.3 (483.3) 0.00 (6.0) (6.1) Total Preliminary Service Changes: 3, ,819.3 (483.3) 0.00 (6.0) (6.1) Total Preliminary Service Changes: 2, ,819.3 (821.5) (3.00) (13.0) (13.2) Total Preliminary Base Budget: 55, ,260.6 (150.0) (50.0) 0.0 Category: 51 - Efficiency Change 52 - Revenue Change 59 - Service Change Page 2 of 2 Run Date: 12/05/ :37:49
31 Appendix 6 Inflows/Outflows to/from Reserves & Reserve Funds Program Specific Reserve / Reserve Funds Reserve / Reserve Projected Balance as of Withdrawals (-) / Contributions (+) Reserve / Reserve Fund Name Fund Dec. 31, 2017 * (In $000s) Number $ $ $ $ Projected Beginning Balance 2, , , ,842.7 Exhibition Place Conference Centre XR 3019 Proposed Withdrawals (-) Withdrawal for cash short fall (1,057.5) (1,057.5) (1,057.5) Contributions (+) Beanfield renaming revenue 1, , ,057.5 Total Reserve / Reserve Fund Draws / Contributions 2, , , ,842.7 Balance at Year-End 2, , , ,842.7 * Based on 9-month 2017 Reserve Fund Variance Report Reserve / Reserve Projected Balance as of Withdrawals (-) / Contributions (+) Reserve / Reserve Fund Name Fund Dec. 31, 2017 * (In $000s) Number $ $ $ $ Projected Beginning Balance Vehicle Res - Exhibition Non-Moterized Equipment XQ1902 Proposed Withdrawals (-) Scheduled replacement (200.0) (200.0) (200.0) Contributions (+) Portable equipment Total Reserve / Reserve Fund Draws / Contributions Balance at Year-End * Based on 9-month 2017 Reserve Fund Variance Report Reserve / Reserve Fund Projected Balance as of Withdrawals (-) / Contributions (+) Reserve / Reserve Fund Name Dec. 31, 2017 * (In $000s) Number $ $ $ $ Projected Beginning Balance Vehicle Reserve - Exhibition Place XQ1702 Proposed Withdrawals (-) Scheduled Replacement (350.0) (350.0) (350.0) Contributions (+) Fleet Reserve Total Reserve / Reserve Fund Draws / Contributions Balance at Year-End * Based on 9-month 2017 Reserve Fund Variance Report toronto.ca/budget
32 Corporate Reserve / Reserve Funds Reserve / Reserve Projected Balance as of Withdrawals (-) / Contributions (+) Reserve / Reserve Fund Name Dec. 31, (In $000s) Fund Number $ $ $ $ Projected Beginning Balance 28, , , ,151.5 Sick Leave Reserve Fund XR1007 Proposed Withdrawals (-) Withdrawals from fund (100.0) (100.0) (100.0) Contributions (+) Contributions to fund Total Reserve / Reserve Fund Draws / Contributions 28, , , ,101.5 Balance at Year-End 28, , , ,101.5 * Based on 9-month 2017 Reserve Fund Variance Report Reserve / Projected Withdrawals (-) / Contributions (+) Reserve / Reserve Fund Name Reserve Balance as of (In $000s) Fund Number $ $ $ $ Projected Beginning Balance 25, , , ,898.1 Insurance Reserve XR1010 Proposed Withdrawls (-) Contributions (+) Contributions to fund Total Reserve / Reserve Fund Draws / Contributions 25, , , ,356.6 Balance at Year-End 25, , , ,356.6 * Based on 9-month 2017 Reserve Fund Variance Report Reserve / Projected Withdrawals (-) / Contributions (+) Reserve / Reserve Fund Name Reserve Balance as of (In $000s) Fund Number $ $ $ $ Projected Beginning Balance Environment Protection XR1718 Proposed Withdrawals (-) Withdrawal for tree planting activities (25.0) Contributions (+) Total Reserve / Reserve Fund Draws / Contributions Balance at Year-End * Based on 9-month 2017 Reserve Fund Variance Report toronto.ca/budget
33 Appendix 7a User Fees Adjusted for Inflation and Other Rate Description Service Fee Category Fee Basis Approved Rate Inflationary Adjusted Rate Other Adjustment Budget Rate Plan Rate Plan Rate Rental of Exhibit Halls and Heritage Court Exhibitors & Events Market Based General Parking Parking Access Market Based Conventions, Rental of Ball Rooms and Conferences & Meeting Rooms Meetings Market Based Per square foot $0.095 to $0.189 $0.098 to $0.195 $0.098 to $0.195 $0.101 to $0.200 $0.104 to $0.206 Per Car park per day $11 to $30 $11 to $30 $11 to $30 $11 to $30 $11 to $30 Daily Rate per square $0.577 to $0.580 to $0.580 to $0.600 to $0.600 to foot $0.628 $0.630 $0.630 $0.650 $0.650 toronto.ca/budget
Exhibition Place. Contents 2016 OPERATING BUDGET OVERVIEW. Contacts OPERATING BUDGET NOTES
 Contents Overview OPERATING BUDGET NOTES I: 2016 2018 Service Overview and Plan 6 II: 2016 Budget by Service 12 III: Issues for Discussion 21 Appendices: 1. 2015 Performance 24 Exhibition Place 2016 OPERATING
Item No. 14. June 26, 2013 ACTION REQUIRED. The Board of Governors of Exhibition Place. Finance & Audit Committee Operating Budget.
 Item No. 14 June 26, 2013 To: From: Subject: Summary: The Board of Governors of Exhibition Place Finance & Audit Committee 2014 Operating Budget ACTION REQUIRED This report recommends the adoption of the
Toronto Zoo N/A Operating Budget Highlights. toronto.ca/budget2017 CONTENTS 2017 OPERATING BUDGET OVERVIEW Preliminary Budget.
 CONTENTS Overview PROGRAM SUMMARY 1: 2017 2018 Service Overview and Plan 5 2: 2017 Operating Budget by Service 11 3: Issues for Discussion 21 Appendices: 1. 2016 Performance 25 2. 2017 Operating Budget
Yonge-Dundas Square Budget Summary OPERATING BUDGET NOTES CONTENTS Service Performance Organization Chart 18
 OPERATING BUDGET NOTES CONTENTS Overview 1. 2018-2020 Service Overview and 5 2. 2018 Preliminary Operating Budget by Service 10 3. Issues for Discussion 14 Appendices 1. 2017 Service Performance 17 2.
Toronto Parking Authority
 OPERATING PROGRAM SUMMARY CONTENTS Overview 1: 2017 2018 Service Overview and 5 2: 2017 Operating by Service 12 3: Issues for Discussion 21 Appendices: 1. 2016 Performance 25 Toronto Parking Authority
Yonge-Dundas Square Operating Budget Highlights CONTENTS 2017 OPERATING BUDGET OVERVIEW OPERATING PROGRAM SUMMARY. Overview
 OPERATING PROGRAM SUMMARY CONTENTS Overview 1: 2017 2018 Service Overview and Plan 5 2: 2017 Operating Budget by Service 11 3: Issues for Discussion 15 Appendices: 1. 2016 Performance 19 Yonge-Dundas Square
City Council Budget Summary OPERATING BUDGET NOTES CONTENTS Service Performance N/A Organization Chart N/A
 OPERATING BUDGET NOTES CONTENTS Overview 1. 2018-2020 Service Overview and Plan 6 2. 2018 Preliminary Operating Budget by Service N/A 3. Issues for Discussion 13 Appendices 1. 2017 Service Performance
Civic Theatres Toronto
 OPERATING BUDGET NOTES CONTENTS Overview 1: 2017 2019 Service Overview and Plan 5 2: 2017 Preliminary Operating Budget by Service 12 3: Issues for Discussion 22 Appendices: 1. 2016 Performance 26 Civic
Heritage Toronto Budget Summary OPERATING BUDGET NOTES CONTENTS Service Performance 19
 OPERATING BUDGET NOTES CONTENTS Overview 1. 2018-2020 Service Overview and Plan 5 2. 2018 Preliminary Operating Budget by Service 10 3. Issues for Discussion 15 Heritage Toronto 2018 OPERATING BUDGET OVERVIEW
Toronto Parking Authority
 OPERATING BUDGET NOTES Toronto Parking Authority 2018 OPERATING BUDGET OVERVIEW The Toronto Parking Authority (TPA) exists to provide safe, attractive, self-sustaining, conveniently located and competitively
OPERATING ANALYST NOTES
 OPERATING ANALYST NOTES OPERATING PROGRAM SUMMARY Contents I: Overview 1 II: Council Approved Budget 4 III: 2014 Service Overview and Plan 5 IV: 2014 Operating Budget 9 V: Issues for Discussion N/A Heritage
Heritage Toronto Operating Budget Highlights CONTENTS 2017 OPERATING BUDGET OVERVIEW OPERATING PROGRAM SUMMARY. Overview
 OPERATING PROGRAM SUMMARY CONTENTS Overview 1: 2017 2018 Service Overview and Plan 5 2: 2017 Preliminary Operating Budget by Service 12 3: Issues for Discussion 18 Appendices: 1. 2016 Performance 21 Heritage
Heritage Toronto. Contents 2016 OPERATING BUDGET OVERVIEW OPERATING PROGRAM SUMMARY
 OPERATING PROGRAM SUMMARY Contents Overview: I: 2016 2018 Service Overview and 6 II: 2016 Budget by Service 10 III: Issues for Discussion 15 Heritage Toronto 2016 OPERATING BUDGET OVERVIEW Heritage Toronto
Policy, Planning, Finance & Administration
 OPERATING BUDGET NOTES CONTENTS Overview 1. 2018-2020 Service Overview and Plan 5 2. 2018 Preliminary Operating Budget by Service 12 3. Issues for Discussion N/A Appendices 1. 2017 Service Performance
Toronto Parking Authority
 OPERATING ANALYST NOTES OPERATING PROGRAM SUMMARY Contents I: Overview 1 II: Council Approved Budget 4 III: 2014 Service Overview and Plan 5 IV: 2014 Operating Budget 10 V: Issues for Discussion 17 Toronto
Toronto Atmospheric Fund
 OPERATING BUDGET NOTES CONTENTS Overview 1. 2018-2020 Service Overview and Plan 5 2. 2018 Preliminary Operating Budget by Service N/A 3. Issues for Discussion 10 Toronto Atmospheric Fund 2018 OPERATING
Toronto and Region Conservation Authority
 OPERATING BUDGET NOTES Toronto and Region Conservation Authority 2018 OPERATING BUDGET OVERVIEW Toronto and Region Conservation Authority (TRCA) protects, restores and celebrates the natural environment
Toronto & Region Conservation Authority (TRCA)
") OPERATING ANALYST NOTES OPERATING PROGRAM SUMMARY Contents Toronto & Region Conservation Authority (TRCA) 2014 OPERATING BUDGET OVERVIEW What We Do TRCA protects, restores and celebrates the natural environment
OPERATING ANALYST NOTES OPERATING PROGRAM SUMMARY Contents Toronto & Region Conservation Authority (TRCA) 2014 OPERATING BUDGET OVERVIEW What We Do TRCA protects, restores and celebrates the natural environment
Solid Waste Management Services
 OPERATING BUDGET NOTES CONTENTS Overview 1. 2018-2020 Service Overview and 5 2. 2018 Recommended Operating by Service 13 3. Issues for Discussion 29 Appendices 1. 2017 Service Performance 33 Solid Waste
Board of Governors of Exhibition Place
 Board of Governors of Exhibition Place Consolidated Financial Statements December 31, and December 31, @@@, 2012 Independent Auditor s Report To the Members of Board of Governors of Exhibition Place We
Toronto Employment & Social Services
 OPERATING BUDGET NOTES CONTENTS Overview 1. 2018-2020 Service Overview and 5 2. 2018 Preliminary Operating Budget by Service 14 3. Issues for Discussion 27 Appendices 1. 2017 Service Performance 34 2.
Board of Governors of Exhibition Place
 Board of Governors of Exhibition Place Consolidated Financial Statements December 31, PricewaterhouseCoopers LLP Chartered Accountants North American Centre 5700 Yonge Street, Suite 1900 North York, Ontario
Economic Development and Culture
 OPERATING BUDGET NOTES CONTENTS Overview 1. 2018-2020 Service Overview and 5 2. 2018 Preliminary Operating Budget by Service 14 3. Issues for Discussion 31 Economic Development and Culture 2018 OPERATING
Affordable Housing Office
 OPERATING BUDGET NOTES CONTENTS Overview 1. 2018-2020 Service Overview and Plan 5 2. 2018 Preliminary Operating Budget by Service 11 3. Issues for Discussion 21 Appendices 1. 2017 Service Performance 27
Toronto Employment & Social Services
 OPERATING PROGRAM SUMMARY CONTENTS Overview 1. 2018-2020 Service Overview and Plan 5 2. 2018 Operating Budget by Service 15 3. Issues for Discussion 28 Appendices 1. 2017 Service Performance 34 2. 2018
Arena Boards of Management
 OPERATING ANALYST NOTES OPERATING PROGRAM SUMMARY Contents I: Overview 1 II: Council Approved Budget 4 III: 2014 Service Overview and Plan 5 IV: 2014 Operating Budget 13 V: Issues for Discussion 20 Boards
OPERATING ANALYST NOTES
 OPERATING ANALYST NOTES OPERATING PROGRAM SUMMARY Contents I: Overview 1 II: Council Approved Budget 4 III: 2014 Service Overview and Plan 5 IV: 2014 Operating Budget 9 V: Issues for Discussion 12 Yonge-Dundas
Solid Waste Management Services
 OPERATING PROGRAM SUMMARY Contents Overview I: 2015 2017 Service Overview and Plan 6 II: 2015 Budget by Service 21 III: Issues for Discussion 39 Solid Waste Management Services 2015 OPERATING BUDGET OVERVIEW
Solid Waste Management Services
 Contents OPERATING BUDGET NOTES Overview & Recommendations I: 2016 2018 Service Overview and Plan 6 II: 2016 Recommended Budget by Service 13 III: Issues for Discussion 29 Solid Waste Management Services
City Planning Budget Summary OPERATING BUDGET NOTES CONTENTS 2018 OPERATING BUDGET OVERVIEW CONTACTS
 OPERATING BUDGET NOTES CONTENTS Overview 1. 2018-2020 Service Overview and 5 2. 2018 Preliminary Operating Budget by Service 14 3. Issues for Discussion 25 2018 OPERATING BUDGET OVERVIEW guides and manages
Children's Services Budget Summary OPERATING PROGRAM SUMMARY CONTENTS Service Performance 29
 OPERATING PROGRAM SUMMARY CONTENTS Overview 1. 2018-2020 Service Overview and Plan 5 2. 2018 Operating Budget by Service 17 3. Issues for Discussion 25 Children's Services 2018 OPERATING BUDGET OVERVIEW
Toronto Realty Agency
 OPERATING BUDGET NOTES CONTENTS Overview 1. 2018-2020 Service Overview and Plan 5 2. 2018 Preliminary Operating Budget by Service N/A 3. Issues for Discussion 11 Toronto Realty Agency 2018 OPERATING BUDGET
Association of Community Centres
 Contents Overview OPERATING BUDGET NOTES I: 2016 2018 Service Overview and 5 II: 2016 Budget 10 III: Issues for Discussion 18 Association of Community Centres 2016 OPERATING BUDGET OVERVIEW The Association
City Budget Theatres Operating Budget Analyst Notes
 City Budget 2013 Theatres Operating Budget Analyst Notes The City of Toronto's budget is presented by program and service, in Analyst Note format. The City's Operating Budget pays the day-to-day operating
Toronto Atmospheric Fund
 OPERATING PROGRAM SUMMARY Contents Overview I: 2016 2018 Service Overview and Plan 6 II: 2016 Budget by Service N/A III: Issues for Discussion 11 Toronto Atmospheric Fund 2016 OPERATING BUDGET OVERVIEW
Toronto Transit Commission
 OPERATING BUDGET NOTES CONTENTS Overview 1. 2018-2020 Service Overview and Plan 5 2. 2018 Preliminary Operating Budget by Service 14 3. Issues for Discussion 20 Toronto Transit Commission 2018 OPERATING
Solid Waste Management Services
 OPERATING PROGRAM SUMMARY Contents I: Overview 1 II: Council Approved Budget 4 III: 2014 Service Overview and Plan 6 IV: 2014 Operating Budget 18 V: Issues for Discussion 29 Appendices: Solid Waste Management
Office of the Mayor Budget Summary OPERATING PROGRAM SUMMARY CONTENTS Service Performance N/A
 OPERATING PROGRAM SUMMARY CONTENTS Overview 1. 2018-2020 Service Overview and Plan 5 2. 2018 Operating Budget by Service N/A 3. Issues for Discussion N/A Office of the Mayor 2018 OPERATING BUDGET OVERVIEW
MINISTRY OF TOURISM, CULTURE AND SPORT
 THE ESTIMATES, 1 The Ministry of Tourism, Culture and Sport provides leadership for these fast-growing sectors of the provincial economy which are fundamental to the prosperity and quality of life of Ontario
Shelter, Support Housing & Administration
 OPERATING BUDGET NOTES CONTENTS Overview 1. 2018-2020 Service Overview and Plan 5 2. 2018 Preliminary Operating Budget by Service 14 3. Issues for Discussion 22 Appendices 1. 2017 Service Performance 32
Facilities Management and Real Estate
 OPERATING ANALYST NOTES OPERATING OPERATING PROGRAM ANALYST SUMMARY NOTES Contents Facilities Management and Real Estate 2014 OPERATING BUDGET OVERVIEW What We Do Facilities Management and Real Estate
Legal Services Budget Summary OPERATING BUDGET NOTES CONTENTS Service Performance 26
 OPERATING BUDGET NOTES CONTENTS Overview 1. 2018-2020 Service Overview and 5 2. 2018 Preliminary Operating Budget by Service 13 3. Issues for Discussion 23 Appendices 1. 2017 Service Performance 26 Legal
Engineering & Construction Services
 OPERATING PROGRAM SUMMARY Contents Overview I: 2016 2018 Service Overview and Plan 6 II: 2016 Budget by Service 13 III: Issues for Discussion 23 Appendices: 1. 2015 Performance 27 Engineering & Construction
Affordable Housing Office
 OPERATING PROGRAM SUMMARY CONTENTS Overview 1. 2018-2020 Service Overview and Plan 5 2. 2018 Operating by Service 11 3. Issues for Discussion 21 Appendices 1. 2017 Service Performance 28 2. 2018 Operating
Arena Boards of Management
 OPERATING PROGRAM SUMMARY CONTENTS Overview 1: 2017 2019 Service Overview and 5 2: 2017 Operating Budget by Service 11 3: Issues for Discussion 17 Appendices: 1. 2016 Performance 21 Arena Boards of Management
MINISTRY OF TOURISM, CULTURE AND SPORT
 THE ESTIMATES, 201314 1 The Ministry of Tourism, Culture and Sport provides leadership for these fastgrowing sectors of the provincial economy which are fundamental to the prosperity and quality of life
TRUST AND CONFIDENCE
 -2019- BU1.3 Torontonians City Council TRUST AND CONFIDENCE STRATEGY Public Service 2 2.9 million 3.1 million 3.8 million people call Toronto people call Toronto people will call Toronto home each night
MINISTRY OF TOURISM, CULTURE AND SPORT
 THE ESTIMATES, 201213 1 The Ministry of Tourism, Culture and Sport provides leadership for these fastgrowing sectors of the provincial economy which are fundamental to the prosperity and quality of life
Toronto Public Library
 OPERATING ANALYST NOTES OPERATING OPERATING PROGRAM ANALYST SUMMARY NOTES Contents Toronto Public Library I: 2014 OPERATING BUDGET OVERVIEW What We Do Toronto Public Library (TPL) provides free and equitable
TRUST AND CONFIDENCE
 Torontonians City Council TRUST AND CONFIDENCE STRATEGY Public Service 2 2.9 million people call Toronto home each night 3.1 million people call Toronto home each day 3.8 million people will call Toronto
Toronto Atmospheric Fund
 OPERATING ANALYST NOTES OPERATING ANALYST NOTES Contents Toronto Atmospheric Fund 2014 OPERATING BUDGET OVERVIEW What We Do The Toronto Atmospheric Fund (TAF) provides support and funding for projects
2014 Audit Results & Consolidated Financial Statements for The Board of Governors of Exhibition Place
 6 April 29, 2015 To: From: Board of Governors of Exhibition Place Finance and Audit Committee ACTION REQUIRED Subject: 2014 Audit Results & Consolidated Financial Statements for The Board of Governors
Shelter, Support and Housing Administration
 OPERATING PROGRAM SUMMARY Contents Overview I: 2016 2018 Service Overview and Plan 5 II: 2016 Budget by Service 14 III: Issues for Discussion 24 Shelter, Support and Housing Administration 2016 OPERATING
Facilities and Property Management Business Plan and 2015 Budget
 Facilities and Property Management 2015-2018 Business Plan and 2015 Budget 2 Agenda Existing Core Services Vision and Mission Service Delivery Model Service Level Issues and Trends Service Area Information
City of Mississauga Municipal Performance Measurements Program (MPMP) Results. For the period ending December 31, 2013
 Results. For the period ending December 31, 2013") City of Mississauga Municipal Performance Measurements Program (MPMP) For the period ending December 31, Prepared by: Finance Division, Corporate Services Department City of Mississauga CITY OF MISSISSAUGA
City of Mississauga Municipal Performance Measurements Program (MPMP) For the period ending December 31, Prepared by: Finance Division, Corporate Services Department City of Mississauga CITY OF MISSISSAUGA
Theatres. Contents 2015 OPERATING BUDGET OVERVIEW OPERATING PROGRAM SUMMARY
 OPERATING PROGRAM SUMMARY Contents Overview I: 2015 2017 Service Overview and Plan 6 II: 2015 Budget by Service N/A III: Issues for Discussion 24 Appendices: Theatres 2015 OPERATING BUDGET OVERVIEW The
Gateway Center, Collinsville, Illinois Economic and Fiscal Impact Analysis
 Economic and Fiscal Impact Analysis SUBMITTED TO Gateway Center SUBMITTED BY C.H. Johnson Consulting, Inc. February 2017 TABLE OF CONTENTS SECTION I TRANSMITTAL LETTER SECTION II INTRODUCTION AND EXECUTIVE
Reserves and Reserve Funds
 Reserves and Reserve Funds Table of Contents 1 Overview... 2 2 Forecast Changes... 4 2.1 Operating Reserves and Reserve Funds... 5 3 Capital Reserve Funds... 8 3.1 Capital Highlights... 9 3.2 10 Year Forecast
Toronto Fire Services
 OPERATING PROGRAM SUMMARY CONTENTS Overview 1. 2018-2020 Service Overview and Plan 5 2. 2018 Operating Budget by Service 15 3. Issues for Discussion 28 Appendices 1. 2017 Service Performance 33 2. 2018
Addressing Harbourfront Centre's Outstanding Property Taxes and Rent Arrears
 GM26.14 REPORT FOR ACTION Addressing Harbourfront Centre's Outstanding Property Taxes and Rent Arrears Date: March 22, 2018 To: Government Management Committee From: Treasurer and General Manager, Economic
Toronto Employment and Social Services
 OPERATING PROGRAM SUMMARY CONTENTS Overview 1: 2017 2019 Service Overview and 5 2: 2017 Operating Budget by Service 14 3: Issues for Discussion 27 Appendices: 1. 2016 Performance `35 Toronto Employment
Georgia World Congress Center and Georgia Dome Economic Impact Analysis FY 2012
 Georgia World Congress Center and Georgia Dome Economic Impact Analysis FY 2012 Prepared by: Ken Heaghney State Fiscal Economist Fiscal Research Center Andrew Young School of Policy Studies Georgia State
Parks Forestry and Recreation
 CAPITAL BUDGET NOTES CONTENTS Overview 1: Preliminary 10-Year Capital 5 2: Issues for Discussion 22 Appendices: 1. 2016 Performance 37 2. Preliminary 10-Year Capital Summary 39 Parks Forestry and Recreation
Solid Waste Management Services
 CAPITAL PROGRAM SUMMARY Highlights Overview I: 1-Year Capital 5 II: 215 Capital Budget 17 III: Issues for Discussion 21 Solid Waste Management Services 215 224 CAPITAL BUDGET AND PLAN OVERVIEW Solid Waste
Toronto Public Library 2015 OPERATING BUDGET OVERVIEW
 OPERATING ANALYST NOTE Contents Overview & Recommendations I: 2015 2017 Service Overview and Plan 5 II: 2015 Budget by Service 16 III: Items for Discussion 30 Toronto Public Library 2015 OPERATING BUDGET
Georgia World Congress Center and Georgia Dome Economic Impact Analysis FY 2017
 Georgia World Congress Center and Georgia Dome Economic Impact Analysis FY 2017 Prepared by: Ken Heaghney State Fiscal Economist Fiscal Research Center Andrew Young School of Policy Studies Georgia State
Tax Supported Preliminary Operating Budget. Book 1. Budget Summary Report FCS17001
 2017 Tax Supported Preliminary Operating Budget Book 1 Budget Summary Report FCS17001 BOOK ONE: 2017 PRELIMINARY TAX SUPPORTED OPERATING BUDGET SUMMARY LIST OF APPENDICES APPENDIX DESCRIPTION PAGE Tax
Develop and implement the City s capital construction programs for parks, trails and other associated infrastructure
 Parks and Recreation The Parks and Recreation department provides inclusive, safe and enjoyable recreation, sport and passive recreation opportunities for all community members. The department strives
Georgia World Congress Center and Georgia Dome Economic Impact Analysis FY 2016
 Georgia World Congress Center and Georgia Dome Economic Impact Analysis FY 2016 Prepared by: Ken Heaghney State Fiscal Economist Fiscal Research Center Andrew Young School of Policy Studies Georgia State
Toronto Paramedic Services
 OPERATING BUDGET NOTES CONTENTS Overview 1. 2018-2020 Service Overview and 5 2. 2018 Preliminary Operating Budget by Service 13 3. Issues for Discussion 22 Appendices 1. 2017 Service Performance 29 2.
Toronto Police Service
 OPERATING PROGRAM SUMMARY CONTENTS Overview 1: 2017 2018 Service Overview and Plan 5 2: 2017 Operating Budget by Service 13 3: Issues for Discussion 16 Appendices: 1. 2016 Performance 26 2. 2017 Operating
2030 Infrastructure Plan Introduction
 2 nd Draft February 25, 2016 Infrastructure Plan Introduction 1.0 INTRODUCTION The Infrastructure Plan covers the City s infrastructure investment needs for the next 15 years (2016-) and was developed
Parks, Forestry and Recreation
 OPERATING BUDGET NOTES CONTENTS Overview 1. 2018-2020 Service Overview and 5 2. 2018 Preliminary Operating Budget by Service 17 3. Issues for Discussion 43, Forestry and 2018 OPERATING BUDGET OVERVIEW,
QUARTERLY FINANCIAL REPORT FOR TH HE PERIOD
 QUARTERLY FINANCIAL REPORT FOR THE PERIOD ENDED SEPTEMBER 30, 2017 1 TABLE OF CONTENTS Management Discussion and Analysis. 3 Year-over-Year Results Analysis. 3 Budgetary Analysis...3 Use of Parliamentary
Executive Summary Operating Budget and Forecast
 Executive Summary The 2017 Budget Discussion Document presents the proposed 2017 operating budget, 2018-2019 forecasts and the 2017 Capital Budget for the Town of Oakville. The document represents the
Arts & Culture Business Plan & 2016 Budget
 Arts & Culture 2016 2018 Business Plan & 2016 Budget Table of Contents Executive Summary of Arts & Culture... 3 Existing Core Services... 4 Vision, Mission, Service Delivery Model... 4 Service Delivery
City of Prince Albert YEAR STRATEGIC PLAN
 5 City of Prince Albert YEAR STRATEGIC PLAN 2015-2020 City of Prince Albert Introduction Members of City Council, along with Senior Administration, attended a two-day Strategic Planning Session for the
Toronto Zoo PROGRAM SUMMARY CONTENTS CAPITAL BUDGET AND PLAN OVERVIEW. Overview. 1: 10-Year Capital Plan 5. 2: Issues for Discussion 15
 PROGRAM SUMMARY CONTENTS Overview 1: 10-Year Capital Plan 5 2: Issues for Discussion 15 Appendices: 1. 2016 Performance 20 2. 10-Year Capital Plan Summary 21 Toronto Zoo 2017 2026 CAPITAL BUDGET AND PLAN
Georgia World Congress Center Authority Economic Impact Analysis FY 2018
 Georgia World Congress Center Authority Economic Impact Analysis FY 2018 Prepared by: Ken Heaghney State Fiscal Economist Peter Bluestone Sr. Research Associate Fiscal Research Center Andrew Young School
Executive Summary Operating Budget and Forecast
 The 2014 Budget Discussion Document presents the proposed 2014 operating budget, 2015-2016 forecasts and the 2014 Capital Budget for the Town of Oakville. The document represents the outcome of the 2014
Report to: General Committee Date Report Authored: February 29, Andrea Tang, Senior Manager of Financial Planning
 SUBJECT: PREPARED BY: 2015 Year-End Review of Operations Andrea Tang, Senior Manager of Financial Planning RECOMMENDATION: 1) THAT the report entitled 2015 Year-End Review of Operations be received; 2)
Toronto Paramedic Services
 OPERATING PROGRAM SUMMARY CONTENTS Overview 1. 2018-2020 Service Overview and 5 2. 2018 Operating Budget by Service 14 3. Issues for Discussion 23 Appendices 1. 2017 Service Performance 29 2. 2018 Operating
Table of Contents. Budget at a Glance Operating and Capital Revenues Community Profile Did you know? Fast Facts...
 2015 BUDGET y0 Table of Contents Budget at a Glance... 3 Operating and Capital Revenues... 4 Community Profile Did you know?... 7 Fast Facts... 8 Budget Background... 9 Financial Principles & Policies...
Toronto Employment and Social Services
 OPERATING PROGRAM SUMMARY Contents Overview & Recommendations I: 2015 2017 Service Overview and Plan 5 II: Council Budget III: Issues for Discussion 27 Toronto Employment and Social Services 2015 OPERATING
Operating Budget Overview 2019
 OPERATING BUDGET Operating Overview 2019 Introduction In planning for a vibrant, healthy and sustainable community, the Town of Halton Hills is committed to providing community leadership on issues of
Operating Variance Report for the Five Months Ended May 31, 2018
 EX36.17 REPORT FOR ACTION Operating Variance Report for the Five Months Ended May 31, 2018 Date: July 13, 2018 To: Executive Committee From: Interim Chief Financial Officer Wards: All SUMMARY The purpose
CORPORATION OF THE CITY OF CORNWALL CONSOLIDATED FINANCIAL STATEMENTS
 CONSOLIDATED FINANCIAL STATEMENTS December 31, 2014 December 31, 2014 CONTENTS Page INDEPENDENT AUDITORS' REPORT 1 FINANCIAL STATEMENTS Consolidated Statement of Financial Position 2 Consolidated Statement
DEBT SERVICE BUDGET. This section is organized in the following manner: Page. Debt Service Budget 6-1. Debt Service Budget Fund Summary 6-2
 DEBT SERVICE BUDGET Local governments traditionally issue debt to pay for capital projects for several reasons. First, the cost of these projects is normally too high to absorb into an annual budget. Second,
ROSE BOWL OPERATING COMPANY
 ROSE BOWL OPERATING COMPANY Rain or Shine THE SOCCER FIELD By Vernon Ford MISSION STATEMENT The mission of the Rose Bowl Operating Company (RBOC) is to improve the quality of life in Pasadena by providing
Golf Sustainability Work Plan Update
 2018 June 06 Page 1 of 8 EXECUTIVE SUMMARY For 100 years, municipal golf courses have been part of the recreational and cultural landscape of Calgary. The City of Calgary, through the Golf Course Operations
Independent Auditors' Report
 Independent Auditors' Report To the Members of Council, Inhabitants and Ratepayers of The Corporation of the City of Stratford We have audited the accompanying consolidated financial statements of The
City of. Rose Bowl Stadium Excavation, RoSE BoWL operating CoMPANy
 Title pages 2019 print.qnd:layout 1 8/7/18 2:22 PM Page 28 City of Rose Bowl Stadium Excavation, 1922 RoSE BoWL operating CoMPANy ROSE BOwl OPERATINg COmPANY Pasadena City Council RBOC Board of Directors
Where are your taxes going?
 BUDGET HIGHLIGHTS Building for the Future The City s 2017 proposed Budget continues to build for the future, investing in community priorities essential to Regina s continued growth. The Budget goals were
Recreation Business Plan & 2016 Budget
 Recreation 2016 2018 Business Plan & 2016 Budget Table of Contents Executive Summary of Recreation... 3 Existing Core Services... 4 Vision and Mission... 4 Service Delivery Model... 5 Business Plan Updates...
Relationship Framework
 2015 Relationship Framework For City of Toronto With Exhibition Place Board of Governors 2 Preamble RELATIONSHIP FRAMEWORK BETWEEN THE CITY OF TORONTO & THE BOARD OF GOVERNORS OF EXHIBITION PLACE WHEREAS
CITY OF VAUGHAN EXTRACT FROM COUNCIL MEETING MINUTES OF JUNE 19, 2018
 CITY OF VAUGHAN EXTRACT FROM COUNCIL MEETING MINUTES OF JUNE 19, 2018 Item 8, Report No. 6, of the Finance, Administration and Audit Committee, which was adopted without amendment by the Council of the
Report to: Council. October 26, Submitted by: Marian Simulik, City Treasurer
 2 Report to: Council October 26, 2011 Submitted by: Marian Simulik, City Treasurer Contact Person: Mona Monkman, Deputy City Treasurer, Corporate Finance Finance Department 613-580-2424 ext. 41723, Mona.Monkman@ottawa.ca
Reserves & Reserve Funds Business Plan & 2016 Budget
 Reserves & Reserve Funds 2018 Business Plan & Budget Table of Contents Executive Summary of Reserves and Reserve Funds... 3 Overview... 4 Forecast Changes... 6 Operating Reserves and Reserve Funds... 7
Shelter, Support and Housing Administration 2015 OPERATING BUDGET OVERVIEW
 OPERATING ANALYST NOTES Contents Overview & Recommendations I: 2015 2017 Service Overview and Plan 5 II: 2015 Recommended Budget by Service 19 III: Issues for Discussion 30 Shelter, Support and Housing
Audit Results for Exhibition Place December 31, 2009
 STAFF REPORT INFORMATION ONLY Audit Results for Exhibition Place December 31, 2009 Date: May 31, 2010 To: From: Wards: Audit Committee Dianne Young, Chief Executive Officer-Exhibition Place Not Applicable