FINANCIAL STRATEGY FOR THE LTP
|
|
|
- Karen Williams
- 5 years ago
- Views:
Transcription
1 FINANCIAL STRATEGY FOR THE LTP 1. PURPOSE The purpose of the Financial Strategy is to set out Council s strategic financial direction over the period and how it plans to manage its financial performance over the next ten years. In essence the financial strategy establishes a financial endpoint or destination for Council to work towards and provides some defined parameters to guide the Council in its journey. The financial strategy is an essential element of the draft Long Term Plan. Council must be financially sustainable to continue delivering services to its communities in to the future. This involves a balancing act; delivering quality services while keeping rates affordable, ensuring equity between current and future generations and sharing the costs of services across users in a fair and equitable manner. This financial strategy is designed to provide an understanding of the Council s current financial position, the main factors that influence the cost and demand for Council services, the financial challenges Council is likely to face and Council proposed financial direction. 2. GUIDING PRINCIPLES The Financial Strategy needs to consider financial health and robustness as well as the needs of the community. Both these considerations are important from a sustainability perspective. The guiding principles underpinning the Financial Strategy are that Council will strive to: a) Provide amenities, facilities and services to the District community that contribute to and align with Council s Vision b) Undertake good asset stewardship and management to ensure all community and infrastructure assets are fit for purpose and available for future generations c) Maintain affordable rates increases to deliver the services and facilities required by the community d) Ensure financial sustainability - by ensuring that our revenue is sufficient to cover an efficient operating expense base, all funding sources are being used optimally and financial management is prudent. Doc #345490
2 3. STRATEGIC CONTEXT 1. Population and Land Use Changes Planning Assumptions for the LTP show that the annualised population of Waitomo District as a whole will decline by 0.5% per year over the period 1. Projections are that the district population will decrease by 557 persons, to a population of 8,743, over the life of the pdltp. This represents a 5.9% decrease over 10 years (medium projection and median stochastic). The primary cause of the declining population is net migration loss. However, not all of the census areas within the Waitomo district showed a decline in previous years. Between the 2001 and 2006 census 5 out of 8 census units showed an increase or no change. However, this dropped off between 2006 and 2013, when only 2 areas, Taharoa and Waipa Valley, showed an increase in population. It is also projected that the current pattern of limited subdivision and building development will continue over the 10 year period placing little additional demand on Council provided services. Population and development projections are important in the context of rating and rates affordability. Whilst a static or declining population does not necessarily translate to a reduction in the number of rateable properties (the number of rateable properties in the Waitomo District has increased in spite of a declining population), it can impact on a community s ability to pay and could exacerbate affordability concerns which Council will need to carefully manage for. 2. Affordability and the provision of Public Services Council has been careful to invest in infrastructure upgrades where essential to give effect to minimum public health and environmental standards. Recent investment has been focused on meeting minimum standards for compliance reasons. Whilst a projected decline in population is of concern in terms of affordability, there is little or perhaps no scope to scale back Council s involvement in the provision of core infrastructure. The Water Supply and Sewerage Networks have been designed to what can be termed the minimal standards required for a municipal supply in New Zealand under current legislation and regulation. A planned for bi product of Council s investment in its core infrastructure over the past few years is that there is currently enough capacity in the network infrastructure for nominal growth in areas where it should occur. Asset renewals are the only areas that Council can respond to in relation to the projected decline in population and static growth forecasts. With the exception of the Piopio wastewater scheme and the Benneydale water supply scheme, the remaining networks are characterised by ageing reticulation infrastructure. It is important in that context that long term asset renewal strategies take account of actual asset condition, optimising lifecycle costs, and ratepayer affordability without compromising public health and environmental outcomes. 1 The Planning Assumptions and this Strategy use population projections developed by the National Institute of Demographic and Economic Analysis, University of Waikato (NIDEA). Doc #345490
3 The sealed and unsealed road network is currently in reasonable condition as a result of current investment in maintenance, rehabilitation and reseals. Again, current levels of service are considered to be a minimum in terms of an effective, efficient and safe local roading network. Many of the other public services provided by Council (particularly in the areas of Regulation and Safety, Resource Management and Solid Waste) are also governed by legislation, Regulation and Industry Standards and as a result there are limited options for changes to scale and scope in response to changes in population and development. The provision of community services such as Parks and Reserves, Recreation and Culture, Community Development and other Public Amenities are the very services that make communities desirable in terms of a place to work, live and play. In this 10 year period Council aims to focus on community and economic development in order to attract more residents and visitors to the District. In short, a retraction or reduction in scope of desirable public services would work against the Council s vision of Creating a better future with vibrant communities and thriving business. 3. External Influencers It is important to note that the projected population forecasts provided by NIDEA project a medium case scenario drawing on past fertility, mortality and migration trends. The projections provide one of a number of planning assumptions which attempt to gain an understanding of what the Waitomo Community might look like during the planning horizon of the LTP. The projected decline in population does not take in to account other factors that may well influence the future look and feel of the Waitomo Community like Central Government policy, global and national trends, and the effective delivery of Councils own strategies can and will influence the make-up of the Waitomo Community over time. Factors such as housing affordability in metropolitan areas, an improved national state highway network, public transport, Central Government strategies around regional development and Local Government s efforts in the provision of public services and community development could well see the smaller regions being more desirable places to live and work, in to the future. All other factors detailed in the Planning Assumptions for the LTP have been taken into account in the development of this Financial Strategy. 4. The Past When considering the future it is helpful to look back and see where we have come from. Reviewing past plans and understanding what has actually occurred provides context for understanding Council s intentions for the future, both in a financial and non-financial sense. Council s direction has been relatively consistent over the past seven years. This direction has been about the consolidation of service delivery on a financially sustainably basis. It has also been about improving the condition of its assets, where this has been essential in order to support public health outcomes and to meet its Resource Consent and other legislative requirements. In the period since , WDC has invested approximately $68 million in its capital works programme. Some key works completed during this period are: Doc #345490
4 Infrastructure Construction of raw water storage dams at Mokau Disinfection upgrades completed for Mokau and Benneydale water supplies Te Kuiti Water Treatment Plant upgrade (underway) Te Kuiti Wastewater Treatment Plant upgrade Piopio sewerage system build Critical Stormwater renewal work in Ngati Street, George Street and Duke Street 4000 metres (linear) of Stormwater reticulation system cleaned and surveyed Construction of the Transfer Station located at Waitomo District Landfill Development of an additional cell at Landfill site Structural metal placed on 42 kms of unsealed roads. Community Services Replacement of playground equipment Te Kuiti Railway Buildings (underway) Upgrades to the Waitomo Arts and Cultural Centre Toilet block upgrades Renewal and upgrade work for elderly persons housing in Te Kuiti All this has been completed within prudent financial management parameters. The following extract from Council s Summary Annual Report for the year ended 30 June 2014 demonstrates how dedicated and prudent financial management over time has resulted in Council being in a stronger financial position. Summary Statement of Financial Position as at 30 June 2014 Actual 2014 ($000 s) Budget 2014 ($000 s) Actual 2013 ($000 s) Current Assets 6,316 6,831 5,878 Current Liabilities 4,563 10,023 18,091 Net Working Capital 1,753 (3,192) (12,213) Non-Current Assets 323, , ,776 Non-Current 45,945 45,814 33,038 Liabilities Equity 279, , ,525 The public debt has been reducing over the last three years and that actual debt requirements have been considerably lower than that forecast. This is despite a significant investment programme ($32 million) having being completed over the same period (particularly on water supply and wastewater networks for the District s communities). Council has been able to fund that investment programme through subsidies and available cash whilst reducing its public debt levels at the same time. Doc #345490
5 30 June Public Debt Forecast Public Debt 53,123,000 48,086,000 49,890,000 (LTP s) Actual Public Debt 47,005,000 45,182,000 44,865,000 $ Difference from (6,118,000) (2,904,000) (5,025,000) Forecast % Reduction (since 2012) -3.9% - 4.6% 60,000,000 50,000,000 40,000,000 30,000,000 20,000,000 10,000, Forecast Public Debt (LTPs) Actual Public Debt Forecast Reserves (LTPs) Actual Reserves 4. COUNCIL S PLANNED FINANCIAL FUTURE As above Council has been on a journey towards financial sustainability and in the recent past has focused on restoring the Council organization to financial health whilst focusing on ensuring core infrastructure is in good shape to meet environmental and public health standards in to the future. The hard work of Council and the community over the last few years is now starting to pay some dividends. With a solid infrastructure platform in place, a strengthening balance sheet and income levels restored to appropriate levels Council is now in a position to turn its attention to other important needs of the District. It has been the intention of Council for some time to turn its attention to community well-being aspects once a stable and sustainable core infrastructure and financial platform was in place. This realignment does not mean a substantial overall increase in investment in financial terms, it represents the next step in Council s journey and Council intends to make incremental gains. 1. Maintaining and Delivering Services (Operating Expenditure) Doc #345490
6 As above the key focus for the plan is to ensure services delivered are affordable and that these meet the current and future needs of the District and its population whilst investing in community development and growth opportunities. Service levels for core services are not expected to change in any significant way over the life of this Long Term Plan other than in response to changing public health and environmental standards. Other service level movements are generally in support of economic and community development. The graph below shows Council s forecast levels of operating expenditure over the period. Operational Expenditure ($300.2M) Roads and Footpaths, 35.8% Governance, 10.0% Community Development, 4.6% Community Services, 14.1% Regulation, 3.1% Water Supply, 10.8% Resource Management, 0.7% Sewerage, 11.9% Solid Waste Management, 7.3% Stormwater, 1.7% 2. Capital Expenditure The inflated 10 year Capital Plan for period includes $94.1 million of capital works most of which is related to renewals. Some improvements mostly related to risk mitigation and for environmental reasons have also been planned over the 10 years. Doc #345490
7 Capital Expenditure ($94.1M) Governance, 5.6% Community Services, 4.8% Solid Waste Management, 2.0% Water Supply, 10.6% Stormwater, 2.9% Roads and Footpaths, 68.8% Sewerage, 5.3% As part of the development of the LTP, Council has developed an Infrastructure Strategy (IS) covering a planning period of 30 years ( ), which outlines how Council intends to manage its Water supply, Wastewater, Stormwater and Roads and Footpath infrastructure assets. In essence, the Strategy asserts that asset maintenance and upgrades, essential elements of prudent asset management, will continue to form a vital part of Council s future planning. 3. Revenue Streams Sources of funding for the planned services and operations in the period are shown in the graph below. Doc #345490
8 Where The Funds Come From ($394.3M) 45,000 40,000 35,000 Value in $000's 30,000 25,000 20,000 15,000 10,000 5, Loans Reserves Rates Other Revenue (incl Subsidies) 5. FINANCIAL PARAMETERS 1. Limit on Rates and Rates Increases Council recognises the need to keep rates sustainable and increases affordable over time and will endeavour to keep the income required from rates steady as well as creating predictability in the level of rates required. Council s strategies for achieving affordability of rates include: Limiting the level of rates income to a percentage of operating expenditure. Providing flexibility for individual local communities to pay more for additional projects and/or services. Managing costs through efficiency gains and increasing other revenue sources e.g. user fees and charges, subsidies. Council has set the following limits on rates revenue and rates increases for the period Total rates revenue will be limited to an average of 75% of total operating expenditure Doc #345490
9 Total rate increases will be limited to a cap of LGCI 2 + 2% (4.71% based on LGCI average over 10 years) The limit on annual rate increases (both by type and overall) will not apply where there is an increase in the existing level(s) of service (LoS) of any activity in consultation with the community. This exclusion includes unforeseen events that may occur during the period of the plan. Over the life of the LTP Council s objective is to set total operating income at a level to meet total operating expenditure. This is to ensure that there is access to enough funding to enable the services to continue to be provided long term. However, there are activities where this approach may not be practical or prudent on a year-by-year basis due to the activity s long term nature, e.g. waste water, roads and footpaths, water supplies. Over the next ten years Council intends to: a. Smooth rate increases by running activity deficits/surpluses or repaying activity deficits. b. Use operational reserves and/or activity balances to fund some specific operational expenditure where appropriate. Council considers this to be a prudent approach to financial management in that it provides for assets to be maintained and renewed, debt levels kept reasonably conservative, and rate increases limited to an affordable level now and in future. The graph below shows the proposed rate levels over the period and tests them against the self-imposed cap of 4.71%. The Graph shows that Council s forecast rate increases are substantially lower than previous forecasts. The limit on rates increases has also been reduced for the future forecast period from the 7.7% limit established in the LTP. 2 LGCI Local Government Cost Index is the forecast of price level change adjustors that are developed by Business and Economic Research Limited (BERL) specifically for local government. LGCI is based on the cost structures of Councils and is a more relevant factor for forecasting cost increases for Council activities than the CPI. Doc #345490
10 LTP Forecast Rate increases 9.0% 8.0% 7.0% Rate Increases (%) 6.0% 5.0% 4.0% 3.0% 2.0% 1.0% 0.0% 2012/ / / / / / / / / / / / /25 Year Budgeted rates increase (at or within limit) LTP Rate Increase Cap 2. Limits on Borrowing External borrowing (Public debt) is used by Council to fund assets or services that will provide benefit well into the future. This is in accordance with the principle of intergenerational equity. However, the use of borrowing has to be prudent and sustainable and limited to the ability to service and repay the debt. Council approves borrowing by resolution through the Annual Plan or the Long Term Plan (LTP) process. Council recognizes the need to manage its finances in a sustainable and affordable manner and has therefore established borrowing parameters to ensure that investment priorities are carefully managed and within the reach of the Waitomo Community. Council has set the following borrowing limits in its Treasury Policy: Total interest expense will not exceed 15% of total revenue. Total borrowings will not exceed 25% of total equity Total borrowings must not exceed 20% of total assets Net debt will not exceed 170% of total [cash] revenue Net interest will not exceed 20% of annual rates $000's Council is forecast to be well within these limits in the period. Total Rates as a %age of Total OPEX (Limited to an Average of 75%) 2015/ / / / / / / / / /25 Total OPEX 26,583 27,392 28,367 28,849 29,533 30,390 31,220 31,800 32,755 33,315 Forecast Rates 17,855 18,411 19,089 19,830 20,602 21,334 22,112 22,700 23,114 23,373 Forecast Rates as % of OPEX 67% 67% 67% 69% 70% 70% 71% 71% 71% 70% Doc #345490
11 3. Debt Reduction Reducing external debt is a key consideration of Council s Financial Strategy and Council is committed to this endeavour over the , in order to reduce the debt servicing burden on the District community and to enable deployment of resources for the development of the District and the facilities available. In the LTP, Council agreed to levy an additional and separate rate uniformly across all properties, starting in 2015, the revenue from which would be used for the repayment of debt. Since that time (in the last 3 years), Council s financial performance has progressed significantly. Retained earnings have increased from $192 million in 2011/12 to $200 million in 2013/14. Debt has been reducing over the same period despite a significant investment programme of $32 million (since 2011) having being undertaken. This has been the result of Council s multi-pronged approach of improving its Reserves balance, efficiency in spending, reducing cost of finance and a focus on increasing operating income where possible. Council s forecast for the period is to borrow minimally for essential capital works and to develop over time a strong capacity to self-fund the cost of asset renewal wherever practicable. The forecast is to grow Reserves balances over the planning period and Council will utilise these to reduce external debt requirements and to pay down debt. This is forecast to start in Year 3 of the planning period (trend analysis shows that this is already underway). Doc #345490

12 Given the trend analysis and the forecasts, Council considers that appropriate and required funding of reserves, and their redeployment is an effective Debt Reduction Strategy and that the use of a new separate debt repayment rate over and above the current liability management approach is not required and would only alter the forecast overall debt position by a minimal amount. All dividend and/or subvention income from its subsidiary company (Inframax Construction Ltd) will be used to repay debt and not used to offset rates required in any year of the LTP. Another important consideration in the first three years of the planning period will be an assessment of the existing Investment Portfolio to better accommodate risk potential and how to optimise a return on investments for the District community. Council s plans for reducing external borrowing as set out in this strategy by growing and optimising utilisation of Reserves balances shows forecast public debt to decrease $20.5 million over the period to $32.8 million in year 10. The borrowings costs per rateable property are forecast to reduce by 21% over this period. Doc #345490
13 Projected Loan Interest Cost per Rateable Property $750 $500 $250 $0 2012/ / / / / / /25 Total Interest Cost per Rateable Property 4. Council s policies on giving Securities on its Borrowing Council borrowings are secured over annual rates on every rateable property within the Waitomo District. Under the Debenture Trust Deed, the Council offers deemed rates as security for general borrowing programmes. From time to time, security may be offered over specific assets with Council approval or infrastructural assets where special rating provisions apply. Council will not borrow, underwrite or guarantee loans on behalf of any other person, association or organisation. The 2008 amendment of the Securities Act 1978 (s.5a-5d) enabled Council to issue debt securities to raise funds for Capital Investment. Any issue of debt securities must be approved by Council and will be in compliance with the Securities Act Securities are not provided for Councils own internal borrowing. 5. Financial Investments & Equity Securities Council is a risk adverse entity and therefore takes a prudent approach to managing its investments. Council seeks to achieve an acceptable rate of return on all its investments but recognises that as a responsible local authority any investments that it does hold will be low risk and that generally lower risk means lower returns. Council seeks to maintain diversity in its investment portfolio to spread and minimise risk. Prior to making new strategic or equity investments Council will, on a case-by-case basis and taking into consideration: Doc #345490
14 a. The expected financial return. b. How the investment will contribute in furthering the Waitomo District s Community Outcomes as documented in the Long Term Plan. c. The existing investment portfolio and how the proposed investment fits in terms of Council s preference to spread and minimise risk. d. Any other consideration Council deems appropriate. The Council may invest in shares and other financial instruments of the New Zealand Local Government Funding Agency Limited (LGFA), and may borrow to fund that investment. The Council s objective in making any such investment will be to: Obtain a return on investment; and Ensure that the LGFA has sufficient capital to become and remain viable, meaning that it continues as a source of debt funding for Council. Details on how Council manages its investments and liabilities are set out in Council s Treasury Policy which is publicly available. 6. FUNDING OF DEPRECIATION Depreciation cost is a substantial part of the total rates requirement over the 10 year planning period. In keeping with its focus on prudent financial management and ensuring that rates are affordable and sustainable, Council proposes the following with regard to funding of depreciation: 1. To fund depreciation for Community Halls and Housing for Elderly Fund only to the extent required for minor renewals. This is because Council considers that future renewals would be from community sources and/or grants and subsidies. These facilities are community occupied, have a life in excess of 50 years and renewals would be dependent on future choices. 2. To defer depreciation on some newly built assets for the first 4-5 years of the asset life and fully recovering that unfunded depreciation in the following years. Council has primarily considered this from an affordability perspective for the current ratepayers. Council considers this fair and equitable since the current ratepayers are carrying the debt servicing costs anyway. Council considers the risk in this approach to be low since the assets are new and the probability of failure is low. 3. Fund depreciation on some brand new assets only to the level required to meet annual loan repayments because Council does not intend to build up surplus depreciation reserves in the initial 3 years on brand new assets with extended lives and low risk of failure. In making these proposals (pursuant to Section 100(2) LGA 2002), Council has considered the overall impact of its financial management policies, levels of service and ensured the cash flow is positive over the life of the plan (excluding major projects). Doc #345490
15 ...Vibrant communities and thriving business Waitomo District Council Long Term Plan Draft Infrastructure Strategy
16 Table of Contents 1.0 Purpose Strategic Context Formation of Waitomo District Council Geography Population Projections Infrastructure Context Strategic Approach to Managing Infrastructure Assets Asset Renewal Managing Growth and Demand Levels of Service Public Health and Environmental Outcomes Risk and Resilience Significant Infrastructure Issues for Waitomo District WDC Wastewater Schemes Te Kuiti Wastewater Scheme Benneydale Wastewater Scheme Te Waitere Wastewater Scheme... 7 Waitomo Village Wastewater Scheme... 8 Mokau WDC Water Supply Schemes Te Kuiti Water Supply Scheme Piopio Water Supply Scheme Benneydale Water Supply Scheme Mokau Water Supply Scheme Waitomo Village Water Supply Stormwater Drainage Roads and Footpaths Infrastructure Investment Programme - The Most Likely Scenario Total Expenditure Operating Expenditure Forecasts Capital Expenditure Forecasts Infrastructure Strategy Specific Assumptions Appendix 1: Waitomo Village Water and Wastewater... 23
17 1.0 Purpose 1.1 The purpose of this Infrastructure Strategy (IS) is: (a) (b) To identify significant infrastructure issues for Waitomo District Council (WDC) over the period covered by the strategy, and To identify the principal options for managing those issues and the implications of those options. This draft IS addresses the above purpose by outlining how WDC intends to manage its assets for the 30 year period , in the following four groups of activities: Water Supply Sewerage and Treatment and Disposal of Sewage (Wastewater) Stormwater and Roads and Footpaths The key issues impacting on future management of WDC s infrastructure assets have been highlighted in this draft IS taking account of asset renewal or replacement needs, impacts of changes in demand for services reliant on those assets, changes to levels of service (e.g. as a result of new resource consents), consideration of public health and environmental outcomes, and managing risks impacting on the resilience of the assets to natural hazards. For the first 10 years of the planning period ( ), this strategy represents a culmination of the planning underpinning WDC s corresponding activity management plans (AMPs). 2.0 Strategic Context 2.1 Formation of Waitomo District Council The Borough of Te Kuiti was constituted in In 1922 the Awakino County was amalgamated with a newly created Waitomo County Council (in an area of the then Otorohanga County) to form a new separate local authority. Part of the Kawhia County was included with Waitomo County in 1956 while the balance of the former Kawhia County was incorporated with the neighbouring Otorohanga County. The Te Kuiti Borough and Waitomo County Councils were amalgamated to form the Waitomo District Council on 1 April 1976, and although minor changes to boundaries occurred with the 1989 re-organisation, the District remains largely unchanged today. The present Waitomo District Council (WDC) was reconstituted on 1st November Geography Waitomo District encompasses 354,649 hectares of predominantly rural land on the west coast of the Central North Island. The western boundary is the Tasman Sea. It is adjacent to the Otorohanga District to the north, Taupo District to the east and Ruapehu and New Plymouth Districts to the south DRAFT Infrastructure Strategy Doc
18 Te Kuiti is the administrative and main trading centre in the Waitomo District, with approximately 45% of the District population residing in this town. There are several other smaller settlements located throughout the District, including the popular beach settlements of Mokau, Awakino, Marokopa, Te Waitere and Taharoa. The main rural communities are Benneydale, Piopio and Waitomo Village. While the District is predominantly contained within the Waikato Region, the south-eastern corner of the District is within the Manawatu-Wanganui (Horizons) Regional Council s jurisdiction. 2.3 Population Projections The population in Waitomo District has declined over the past three decades from around 10,500 in 1986 to 8,907 in 2013, an annual decrease of -0.5%, although there have been some period of growth in between the 30 year period. A comparison between the 2006 and 2013 census show that the annual usually resident population decline has been more significant over at -0.8%. Not all of the census areas within the Waitomo district, however, showed a decline in previous years. Between the 2001 and 2006 census 5 out of 8 census units showed an increase or no change. However, this dropped off between 2006 and 2013, when only 2 areas, Taharoa and Waipa Valley, showed an increase in population. For estimated future population in the Waitomo District the draft IS uses population projections that have been carried out at territorial authority level for the Waikato region by the National Institute of Demographic and Economic Analysis, University of Waikato (NIDEA). These projections have been used for planning across all aspects of the Long Term Plan (LTP). The NIDEA projections show a continuing trend of declining population for Waitomo District with a projected population of 8,743 in 2025 (medium projection and median stochastic). These projections follow the recent trend in the District s population reasonably closely, with annualised population decline over the period of 0.5% per year (base year projection is different to actual). Further decline is projected by NIDEA with the district s population reducing to 7,239 by The population trends show that there is no demand for growth related infrastructure at the present time or in the near future. There is currently enough capacity in the infrastructure network to allow for nominal growth should it occur in an area. 2.4 Infrastructure Context Council s strategy in the last 7-8 years, for core infrastructure assets, particularly in the Water Supply and Wastewater activity areas, has been to focus on improving their condition, where this has been essential, in order to support public health outcomes and to achieve good environmental outcomes (as required by its Resource Consent and other legislative requirements); whilst at the same time taking a prudent approach to financial management. The demographic trend supports the Council s decision to adopt an approach which continues to involve upgrades and maintenance of its existing DRAFT Infrastructure Strategy Doc
19 infrastructure network as opposed to the development of new capacity driven infrastructure. In the period since , WDC has invested approximately $57 million on various capital projects in the four groups of activities covered by this IS. Some of the key projects (within the four infrastructure activities) completed in this period are: Construction of raw water storage dam at Mokau Disinfection upgrades completed for Mokau and Benneydale water supplies Te Kuiti Wastewater Treatment Plant re-build Piopio sewerage system Critical renewal work to Stormwater system (Ngati Street, George Street and Duke Street) 4000 linear metres of Stormwater reticulation system cleaned and surveyed Construction of the Transfer Station located at Waitomo District Landfill Commencement of development of an additional cell at landfill site three Rora Street Upgrades Structural metal placed on 42 kms of unsealed roads Whilst a projected decline in population is of concern in terms of affordability, there is little or perhaps no scope to scale back Council s involvement in the provision of core infrastructure as historic and future investment is aligned to complying with minimum environmental and public health standards. In short, the projected reduction in population and static development is forecast to have minimal or no impact on Council s service delivery over time in terms of core infrastructure. The trend does however highlight the need for a focus on managing core infrastructure in a manner that ensures compliance with minimum standards and early identification of future investment needs so that all options can be carefully considered DRAFT Infrastructure Strategy Doc
20 3.0 Strategic Approach to Managing Infrastructure Assets Council takes a strategic approach to managing its infrastructural assets and has planned that such assets must, at a minimum, be able to deliver existing service levels for the foreseeable future. This approach means that decisions around operation and maintenance, renewal and upgrade, demand and growth, service levels etc are taken in the context of optimising overall asset lifecycle costs and the provision of service in perpetuity. 3.1 Asset Renewal Asset renewal is a key driver in respect of all Council s Infrastructural Assets within this IS, as the majority of Council s significant infrastructure has been upgraded in recent years. Council s approach in the IS is largely based on the need for informed and consistent asset renewal over time, especially for reticulation assets. Asset renewal profiles (particularly for the three water assets) are based on theoretical useful lives, material type, length, age etc. A strictly clinical approach to developing asset renewal programmes results in projections for renewal funding fluctuating year to year as assets reach the end of their useful lives and need replacing. This long term IS takes in to account sound engineering judgment, actual asset condition, the optimization of lifecycle costs and community affordability to ensure that renewal programs are prioritized according to in-situ asset condition and failure history over theoretical asset lives. This approach results in a financial provision for asset renewal that is not only considered consistent, appropriate and affordable but that can be applied according to sound asset information as it improves over time. 3.2 Managing Growth and Demand The main drivers of growth and demand for infrastructure assets are: Land use activities Changes in population and demographics Community needs Changes in demand over the life of the draft IS are expected to be no more than minor. Possible exceptions include peak summer demand for services where capacity for certain services is marginal and where large seasonal variations in population occur. With the exception of addressing specific capacity (storage) issues it is expected that any additional demand concerns over the life of this strategy will be addressed through the reduction in usage (either voluntarily or through regulation) in the first instance. Options for demand management are however considered to have limited practical relevance for the Waitomo District. Planning assumptions for growth and demand will be monitored on a regular basis so to ensure that any changes are reflected in the IS as and when they occur DRAFT Infrastructure Strategy Doc
21 3.3 Levels of Service Levels of service in both a current and a future sense are largely dominated by regulatory and technical considerations. Generally service levels have been improved in recent times in alignment with those considerations and are expected to be maintained over the strategy period. Customer service levels are more discretionary and are considered in the context of the current planning assumptions which project a static or declining population. 3.4 Public Health and Environmental Outcomes As with service levels Public Health and Environmental Outcomes are largely dominated by National and Regional regulatory considerations. Recent upgrades of Infrastructural Assets have been to address issues regarding public health and environmental protection. Councils long term approach is to maintain and improve its infrastructural assets as required to ensure compliance with National and Regional Standards wherever possible. This also means ensuring that all infrastructural assets operate with current resource consents at all times. 3.5 Risk and Resilience The main natural hazards potentially impacting on WDC s infrastructure assets include earthquake, flooding and the effects of climate change. Critical assets are those having the highest consequence of failure. The strategy identifies mitigation actions including risk assessments, establishing the required level of resilience, programme implementation of identified risks to increase the resilience of critical assets to the required level. In general a pragmatic approach is taken to risk management in individual Asset Management Plans, identified risk events are grouped into: Natural events, where there is no real control over the timing or extent of the event, although probabilities may be understood, e.g. floods, lightning strikes, earthquakes. External impacts, where other service providers are not providing services which impact on the organisation or individuals, e.g. power supply failures, material supply failures. Physical failure risks, where condition, performance of the asset or third part damage could lead to failure. Operational risks, where maintenance and or management of the asset or asset management activities may impact adversely on the asset. Part of WDC s asset management practices includes risk management decision making tools used to prioritise long term renewal, upgrade and development expenditure for infrastructure. Of the overall risk management framework, critical assets are defined as those that must continue to operate to an acceptable level to avoid damage to community well-being that would occur if any one of the key components listed below was to fail DRAFT Infrastructure Strategy Doc
22 4.0 Significant Infrastructure Issues for Waitomo District This strategy relates to WDC s Wastewater, Water supply, Stormwater drainage and Roads and Footpaths infrastructure assets. The tables on the following pages summarise the significant infrastructure issues facing WDC, the proposed response to those issues, and the implications of taking or not taking the action proposed by the response. In many instances, the same principal response option is capable of addressing several infrastructure issues. Flood protection and control works in Waitomo District are the responsibility of Waikato Regional Council and therefore do not form part of WDC s IS. 4.1 WDC Wastewater Schemes WDC owns and manages four separate wastewater schemes in the district, at Te Kuiti, Piopio, Benneydale, and Te Waitere. The largest of these is at Te Kuiti. With the exception of Te Waitere, all schemes have been upgraded over the past six years and re-consented. The Piopio Scheme is new, commissioned in The consent for Te Waitere expires in September Scheme Consent expiry date Te Kuiti 2040 Piopio 30 June 2028 Benneydale 1 May 2025 Te Waitere 30 September Te Kuiti Wastewater Scheme Issue Description Principal options for response Implications Asset Renewal or Replacements Risk and Resilience* High infiltration rates entering pipe network indicate poor asset condition. Wastewater service continuity and community health is threatened by sections of the wastewater network. Older pipes are brittle and prone to breakages and leaks with natural ground movement or in the event of ground movement caused by a seismic event. Condition assessment of pipe network followed by prioritised repair and renewal programme Rolling replacement of wastewater pipes in poor condition and at the end of their effective life with new flexible pipe materials. The financial impacts of deferred maintenance and renewals have been balanced against levels of service, consent compliance and ratepayer affordability. Failure to complete this work will increase the risk of overloading the treatment plant during flood events, and the risk of pipe failure due to end of lifecycle or following an earthquake event. Such failures have the potential to breach the discharge consent and contaminate DRAFT Infrastructure Strategy Doc
23 Issue Description Principal options for response Implications surrounding groundwater with untreated waste. The probability of this risk occurring is considered to be low to moderate within the term of this strategy but the consequences are high Benneydale Wastewater Scheme Issue Description Principal options for response Implications Risk and Resilience* Wastewater service continuity and community health is threatened by sections of the wastewater network. Older pipes are brittle and prone to breakages and leaks with natural ground movement or in the event of ground movement caused by a seismic event. Rolling replacement of wastewater pipes in poor condition and at the end of their effective life with new plastic pipes and flexible joints. Failure to complete this work will increase the risk of overloading the treatment plant during flood events, and the risk of pipe failure due to end of lifecycle or following an earthquake event. Such failures have the potential to breach the discharge consent and contaminate surrounding groundwater with untreated waste. The probability of this risk occurring is considered to be low to moderate within the term of this strategy but the consequences are high Te Waitere Wastewater Scheme Issue Description Principal options for response Implications Asset Renewal or Replacements Response Demand Levels Service to of The scheme involves collection of septic tank effluent through a piped system which is then pumped to a community soakage field. The rising main from terminal pumping station was recently renewed. The community soakage field is showing signs of failure. While the population projection for Te Waitere is for static growth, the wastewater discharge from the current population already take up the full capacity of the existing soakage field Levels of service focus on reliability of service, Replacement or refurbishment of the soakage field with an expanded facility is required when resource consent is renewed. Replacement or refurbishment of the soakage field with an upgraded and extended facility with capacity for modest additional demand Environmental and public health protection will An amount of $25,000 has been allowed in the LTP for rehabilitating or upgraded the soakage field. While there are no growth related implications for the Benneydale wastewater scheme, current demand already take up full existing capacity. Current levels of service relating to system capacity DRAFT Infrastructure Strategy Doc
24 Issue Description Principal options for response Implications Public Health and Environment Risk and Resilience* capacity, public health and environmental protection. The extended reticulation has addressed previous public health and environmental concerns associated with the scheme. Wastewater service continuity and protection of the environment is threatened by the condition and capacity of the current soakage field. probably need to be enhanced consequent to the imminent resource consent renewal process in Replacement or refurbishment of the soakage field with an upgraded facility is required. Replacement or refurbishment of the soakage field with an upgraded facility is required. and environmental protection will probably need to be enhanced early in the strategy period. Environmental and public health protection will probably need to be enhanced consequent to the imminent resource consent renewal process in Failure to complete this work will increase the risk of overloading the soakage field during normal operating conditions. Such system failure has the potential to breach the discharge consent and contaminate the surrounding environment with treated waste. The probability of this risk occurring is high and the consequences are significant in the context of the imminent consent renewal process. Waitomo Village Wastewater Scheme The wastewater infrastructure at Waitomo Village is privately owned and operated. WDC is currently in discussion with representatives of the Village Trust and private owners of this infrastructure with the potential for WDC to acquire an interest. The potential and a possible pathway forward for transfer of the Village wastewater infrastructure to WDC s future ownership and management is unknown at the present time, due to land tenure issues. Given the level of uncertainty around the timing of resolution of these issues, this IS does not provide for any financial forecasts for these assets. However, Appendix 1 of this IS contains information with regard to the possible upgrade costs associated with this scheme, based on some investigation work that has been carried in the past. Mokau No wastewater scheme currently exists in Mokau, however the development of this IS has identified that sometime in the future, it may be necessary to consider the treatment and reticulation of wastewater in Mokau/Awakino due to increasing public health and environmental pressures. Council intends to keep a watching brief on this aspect over the next few years to ascertain if it will require intervention over time DRAFT Infrastructure Strategy Doc
25 4.2 WDC Water Supply Schemes WDC owns and manages four water supply schemes, at Te Kuiti, Piopio, Benneydale and Mokau. The largest supply is at Te Kuiti. Higher levels of service driven by Public Health (Drinking Water) Amendment Act and security of supply are the key issues impacting on all schemes. Consents to take water are critical to maintaining adequate, all year, supply quantities for domestic and commercial/industrial use. The following table summarise current consent expiry dates: Scheme Te Kuiti Consent Expiry Date 31 January 2015 (renewal process to be complete by June 2015) Piopio 1 August 2023 Benneydale 7 April 2031 Mokau September Te Kuiti Water Supply Scheme Issue Asset renewal or Replacements Levels Service of Public Health & Environment Description Large parts of reticulation near the end of its useful life. Increasing incidence of mains failure, leaks, etc Levels of service for colour, taste and odour are not met due to presence of residual iron and manganese in reticulation and algal growth on rocks during low flow stream conditions. Iron and manganese concentrations are in part due to corrosion inside old steel pipes in the reticulation. Protection of public health is a higher priority over taste and odour issues. The Te Kuiti supply does not fully meet NZ Drinking Water Standards for protection against Principal options for response Accelerated mains replacement programme based on actual pipe condition. A reduced replacement programme extending over a longer period would result in reduced levels of service and increase in maintenance cost due to increased mains failure, loss of water and supply interruptions Upgrade of treatment plant to include a flow proportional, carbon dosing system to remove taste from source water. Implement 4-stage upgrade of treatment plant sterilisation, raw water intake, clarification, Implications Replacement programme of $90,000 per year over the next 10 years. Not replacing the pipes leaves them vulnerable to breakage or complete severance in the event of earthquakes or other ground movement. The probability of this risk occurring is considered to be low to moderate within the term of this strategy but the severity of the consequences are expected to be high The costs of additional treatment to improve the taste and odour characteristics of the supply are included in the proposed, 4-stage, upgrade programme. Stage 1 and /16: $5.41M. Stage /17: $1.2 M DRAFT Infrastructure Strategy Doc
26 Issue Description potentially pathogenic giardia and protozoa. The current take represents near 25 % of stream flow during low flow conditions, with associated impacts on instream habitats. Principal options for response Implications and additional storage. Stage : $1.23 M. Total: $7.83 M (un-inflated estimates). Risk Resilience Issues * and Raw water storage is identified as a potential risk should the effects of climate change become more prominent. The four water storage reservoirs are critical assets, each approximately 40-years old. Resilience of these reservoirs to a major seismic event is key to the integrity of the supply. Investigate options for raw water storage. Assess seismic strength of reservoirs Estimated cost of investigations has been included in forecasts. Outcome of investigations need to be awaited to show how critical the matter is and what options are available to Council. Strengthening the treated water reservoirs is critical to the resilience of the water supply Piopio Water Supply Scheme Issue Asset renewal or Replacements Public Health & Environment Risk Resilience Issues * and Description Large parts of the reticulation is nearing the end of its useful life. The renewal profile suggests a longer residual life than is evidenced by actual operational experience, the latter indicative of poor pipe condition. The absence of back-flow preventers is a potential health risk for Piopio water supply consumers. In Piopio the water treatment plant, reservoir and reticulation are at risk of damage from a major seismic event Principal options for response Accelerated mains replacement programme based on actual pipe condition, using modern pipe materials with flexible joints. A reduced replacement programme extending over a longer period would result in reduced levels of service due to increased mains failure, loss of water and supply interruptions with associated higher maintenance cost Provision for back-flow prevention. Assess seismic strength of reservoirs. Using flexible pipes and joints for mains replacements will reduce the risk of pipe failure in the event of earthquakes or other ground Implications Replacement programme of $29,000 per year over the next 30 years. An extended renewal programme would result in reduced levels of service due to increased mains failure, loss of water pressure and potential loss of supply. The estimated cost of a back-flow prevention programme is $5,130 per year for the next 10 years. Provision for increased resilience of the Piopio water supply reticulation has been built into LTP replacement programmes. Further measures will be dependent on investigations into the resilience of current DRAFT Infrastructure Strategy Doc
27 Issue Description Principal options for response movement. The probability of this risk occurring is considered to be low to moderate within the term of this strategy but the severity of the consequences would be high. Implications infrastructure Benneydale Water Supply Scheme Issue Risk Resilience Issues * and Description The Benneydale water treatment plant, reservoir and reticulation are at risk of damage from a major seismic event Principal options for response Assess seismic strength of reservoir and treatment plant. Implications Further measures will be dependent on investigations into resilience of the current infrastructure Mokau Water Supply Scheme Issue Description Principal options for response Asset renewal Most of the Mokau water Accelerated mains or supply reticulation is replacement programme Replacements nearing thee end of its based on actual pipe useful life. The majority of condition, using modern the network comprises pipe materials with flexible asbestos pipes. The joints.. renewal profile suggests a longer residual life, based A reduced replacement on a nominal pipe life of 70 programme extending years, than is evident from over a longer period. actual operational experience. This is indicative of poor pipe condition. Risk Resilience Issues * and Asbestos water mains are vulnerable to breakage or complete severance in the event of earthquakes or other ground movement. Sufficient water storage is required to secure the water supply during drought conditions. Replace water mains with flexible pipe materials and pipe joints. Increased raw water storage will be completed during 2014/15. Implications Replacement programme of $47,000 per year over the next 30 years. An extended renewal programme would result in reduced levels of service due to increased mains failure, loss of water pressure and potential loss of supply with associated increase in maintenance cost. The probability of this risk occurring is considered to be low to moderate within the term of this strategy but the severity of the consequences are expected to be high. The risk of water shortage during drought conditions will be reduced. Waitomo Village Water Supply The Water Supply infrastructure at Waitomo Village is privately owned and operated. WDC is currently in discussion with representatives of the Village Trust and private owners of this infrastructure with the potential for WDC to acquire an interest. The DRAFT Infrastructure Strategy Doc
28 potential and a possible pathway forward for transfer of the Village Water Supply infrastructure to WDC s future ownership and management is unknown at the present time, due to land tenure issues. Given the level of uncertainty around the timing of resolution of these issues, this IS does not provide for any financial forecasts for these assets. However, Appendix 1 of this IS contains information with regard to the possible upgrade costs associated with this Supply, based on some investigation work that has been carried in the past. 4.3 Stormwater Drainage WDC s stormwater infrastructure comprises two components. The primary component consists of 31km of stormwater pipes, open drains and discharge structures in urban areas, predominantly Te Kuiti. The secondary component consists overland flow paths, including the roading network. The multiple Te Kuiti Stormwater discharges are consented through a district wide comprehensive consent. The consent expires in July Issue Description Principal options for response Asset renewal Implement stormwater or pipe condition Replacements Risk and Resilience Issues * Ageing pipe assets some of which are in poor condition. Information on pipe condition is mostly anecdotal. Approx. 4km of pipe has been inspected. Large section of pipe network in Te Kuiti is partially silted up. Current risks include pipe failure, flooding of property due to impaired stormwater capacity and blocked secondary flow paths. A major flood event could overtop the banks of Mangaokewa Stream with consequential flooding of property. assessment programme. Undertake renewals on a prioritised basis Identification and protection of secondary flow paths through catchment management plans. Repair and replacements of damaged stormwater pipes. Implications Continued stormwater renewal programme of $100k per year Failure to complete this work will increase the risk of flooding and damage to property DRAFT Infrastructure Strategy Doc
29 4.4 Roads and Footpaths WDC s road and footpath infrastructure assets comprise 1,014km of roads of which approximately 459km are sealed and 555 are unsealed. In addition, there are 159 bridges including large culvert structures, and 50 km of footpaths. Associated assets include pavements, small culverts, kerb and channel, carparking, road signage, retaining structures, and street lighting. Issue Asset renewal or Replacements Levels Service of Risk and Resilience * Description Bridge stock is in generally good condition. There are 31 bridges identified for renewal in next 30 year period with present value of $9million, 30 of those bridges fall in the period Levels of service include road safety, reliability and accessibility, responsiveness and smoothness of ride. Critical assets include bridges, large culverts and bluff areas where natural hazards could trigger failure and isolation of communities. Principal options for response Monitor bridge condition and programme renewal of structural components. Widening of narrow, unsealed rural roads to a minimum carriageway width of 5.0m has been identified as an aspirational goal. No other changes to current levels of service are proposed. Bridge inspections are completed every two years and structural assessments completed every 5 years. Alternative routes are maintained for Collector roads Implications With present maintenance regime the probability of this risk occurring is considered to be low, with the severity of the consequences being moderate Any widening narrow unsealed roads will be managed within the existing funding. Current levels of service will be maintained through the strategy period. Current risk mitigation will be maintained through the strategy period. Note: The risk management processes used by the Waitomo District Council are consistent with Australian/New Zealand Standard AS/NZ 4360 which defines risk assessment and management. A fuller description of the risks identified in the table below can be found in Waitomo District Council asset management plans for each activity area DRAFT Infrastructure Strategy Doc
30 5.0 Infrastructure Investment Programme - The Most Likely Scenario 5.1 Total Expenditure In addressing the issues identified in the previous sections of this strategy, the Waitomo District Council expects to spend $258 million on new or replacement infrastructure between 2015 and Over the same period, $582 million is expected to be spent on operating costs, labour, depreciation, materials and maintenance. These figures are anticipated to be spread across the four infrastructures asset activity areas as shown below. Total Operational and Capital Expenditure ($000's) 35,000 30,000 $ 1,000' s 25,000 20,000 15,000 10,000 5, Total Roads and Footpaths Total Water Supply Total Waste Water Total Stormwater Infrastructure Activity Capital Expenditure (new and replacements) Operational Expenditure Wastewater 20,478, ,680,000 Water 19,295, ,745,000 Stormwater Drainage 6,686,000 16,095,000 Roading and Footpaths 211,835, ,571,000 Total 258,294, ,091,000 The table above shows that expenditure across the four infrastructure activity areas will continue to be dominated by operational requirements (operating costs, labour, depreciation, materials and maintenance) between 2015 and DRAFT Infrastructure Strategy Doc
31 The tables below show the indicative estimates of operational and capital expenditure up to 2045, by infrastructure asset type. The estimates are shown on an annual basis for the first 10 years, followed by annual average expenditure for the next 20 years in 5 year blocks: DRAFT Infrastructure Strategy Doc
32 Operating Expenditure Forecasts Year Wastewater 3,243 3,287 3,401 3,499 3,576 3,617 3, ,752 3,854 3,854 3,854 3,854 3,854 Water Supply 2,424 2,931 3,160 3,216 3,279 3,351 3,400 3,465 3,528 3,571 3,571 3,571 3,571 3,571 Stormwater Roading Footpaths Total & 9,602 9,675 9,930 10,260 10,572 10,867 11,190 11,464 11,827 12,104 12,104 12,104 12,104 12,104 15,690 16,333 16,963 17,446 17,917 18,339 18,821 19,179 19,681 20,082 20,082 20,082 20,082 20, DRAFT Infrastructure Strategy Doc

33 As can be seen from the graph Operating and Maintenance 1 costs are forecast to be relatively static over the life of the Infrastructure Strategy given the existing planning assumptions. The only significant exception to this trend is forecast expenditure for water supply as a result of the upgrade to the Te kuiti Water Treatment Plant in the first three years of the Strategy. Capital expenditure on the Te Kuiti Water Treatment plant has a resulting impact on Forecast Operating and Maintenance costs due to increased interest and depreciation. 1 This graph uses estimates shown on an annual basis for the first 10 years, followed by annual average expenditure for the next 20 years in 5 year blocks DRAFT Infrastructure Strategy Doc
34 Capital Expenditure Forecasts Year Wastewater ,144 3,716 5,566 3,000 Water Supply 5,431 1, ,610 1,970 1,898 1,880 Stormwater ,730 Roading Footpaths and Total Forecast Capital Expenditure 5,815 5,897 6,031 6,176 6,333 6,508 6,694 6,897 7,118 7,351 36,755 36,755 36,755 36,755 12,125 8,366 7,093 7,291 7,455 7,489 7,749 8,068 8,316 8,574 44,270 43,056 45,057 43, The forecast capital expenditure profile, as indicated by the above table, is relatively static over the life of the draft Infrastructure Strategy with a focus on asset renewal, particularly after the planned upgrade of the Te Kuiti Water Treatment Plant over period. Future investment considerations include the moving of the raw water intake for Te Kuiti and the construction of a raw water storage dam for the same supply area. Financial provision has been made for further investigation in to the need for a raw water storage dam in this most likely scenario in years 2018 and 2019.This is further demonstrated by the series of graphs below that show that spread of renewal and minor improvement capital works (by activity type) over the life of the strategy. The graphs use estimates shown on an annual basis for the first 10 years, followed by annual average expenditure for the next 20 years in 5 year blocks DRAFT Infrastructure Strategy Doc

35 Waste Water Capital Expenditure ($000's) 1,200 1, $ 1,000's Waste Water Renewals Waste Water Improvements LOS DRAFT Infrastructure Strategy Doc
36 Stormwater Capital Expenditure ($000's) $1,000's Stormwater Renewals Stormwater Improvements LOS Roads and Footpaths Capital Expenditure ($000's) 8,000 7,000 6,000 5,000 4,000 3,000 2,000 1, Roads and Footpaths Renewals Roads and Footpaths Improvements LOS DRAFT Infrastructure Strategy Doc
37 6.0 Infrastructure Strategy Specific Assumptions Whilst the preliminary draft Long Term Plan provides for global planning assumptions there a number of detailed assumptions specifically relevant to the draft Infrastructure Strategy which are detailed below. Assumption Level of Uncertainty Construction costs Low No major changes relative to current cost structure. Maintenance and operational costs These are largely based on historical rates and assume similar contract rates throughout the planning period. NZ Transport Agency subsidies Subsidies will remain at current levels Depreciation Average asset lives at a project level for new works have been used to calculate depreciation. Vested Assets On average the same level of assets are gifted to the council as a result of subdivision as has occurred over the last 5 years The potential vesting/transfer of Waitomo Village water and wastewater assets to WDC ownership will not have a substantial associated costs Service Potential Service potential of the asset is maintained by the renewal programme. Asset Lives Asset lives are accurately stated. Low Medium Medium Low High Pipe networks Medium Roading & Footpaths - Low Pipe networks Low to medium. Roads & Footpaths - Low Potential Effects of Uncertainty It is possible that the price of some components will change relative to others. Budgets are reassessed each year for the AP process to mitigate this risk. BERL inflation factors applied to the LTP also incorporate an element of price changes in different activity sectors. No inflation factors have been applied. BERL inflation factors will be applied to the programmes and budgets in the LTP. Budgets for successive years of the Annual Plan are based on the corresponding year of the LTP. Reduced subsidy will impact on local affordability of WDC s contribution to road asset maintenance and renewals required to maintain current levels of service. Actual rate of asset depreciation is condition based and more accurately described as decline in service potential. Depreciation funding may be over or understated. Rate of sub divisional activity is low and static. Financial provision for increased lifecycle costs has been allowed for. The additional costs of upgrading the Waitomo Village water and wastewater infrastructure assets to mandatory and sustainable levels of service have been investigated. However, the potential costs associated with any transfer could have a material effect. Council will have to weigh up the cost/befits once the details become clearer though the process being undertaken currently. There is medium risk that the service potential of the pipe network assets will not be maintained by implementation of the renewal programme since the latter is not based on reliable asset condition information. The risk that pipe network asset lives are inaccurate is medium. Lives are based on generally accepted industry values, modified by local knowledge and condition assessment. The condition of large sections of pipe networks has yet to be confirmed. The potential effect is that, for the unconfirmed pipe sections, the effective lives of pipe assets might be overstated, with a consequential impact on depreciation funding and the respective renewals programme DRAFT Infrastructure Strategy Doc
38 Assumption Level of Uncertainty Natural Disasters Medium That there are no major natural disasters requiring additional funding for reinstatement of assets. Council Policy No significant change to Council policy that impacts on assets and services. Growth or Decline in Demand No significant change in demand. Changes to levels of service Except where specifically identified, changes to levels of service are minor. Low Low Wastewater, water and stormwater assets Low. Roading assets medium. Potential Effects of Uncertainty There is medium risk of a natural disaster occurring during the 30-year period requiring additional funds to repair or reinstate assets. Some further provision for increasing the resilience of the assets has been built into this plan but there is still further work to be undertaken to determine the desired level of resilience and the further asset improvements to achieve this. Any significant change will require a full review of the draft Infrastructure Strategy and implications identified at the time. Potential changes in demand are not expected to change significantly over the period due to the static population growth projection. Levels of service due to increased regulatory requirements for drinking water and waste water discharges have been accommodated in the strategy. Uncertainty regarding new levels of service in future resource consents is low for WDC s wastewater schemes (excluding Te Waitere) because of the recent consent renewal processes. Uncertainty regarding technical levels of service for Te Waitere wastewater is medium due to current capacity issues and imminent consent renewal process in September Changes to technical levels of service for the Te Kuiti water supply take are expected due to the consent renewal process in January NZTA s current nation-wide move towards a common roading classification, and review of roading subsidy rates, could result in reduced NZTA funding towards WDC s road maintenance and renewal programmes. The consequence would be either an increased local contribution or a reduction in levels of service DRAFT Infrastructure Strategy Doc
39 Appendix 1: Waitomo Village Water and Wastewater While an outcome from these discussions is some way off, and no financial provision has been made for managing these assets within the IS or the LTP financial forecasts, an indication of the likely issues has been made in anticipation that a decision will be reached within the term of this strategy. Wastewater Scheme Issue Description Principal options for response Asset Renewal or Replacements Reticulation system is substandard and at end of its economic life. Reticulation and treatment ponds are located on multiple, properties. private Complete replacement of the reticulation and major upgrade of the treatment ponds, is required. Land use agreements will be necessary. Implications Estimated cost of plant upgrade/renewal is $578,000, reticulation renewal is $450,000 Estimated cost of future development of reticulation is $210,000 Response Demand to The current wastewater infrastructure is a constraint to future development of the village. There is no spare capacity for growth. As above, sized for realistic growth in tourism activities, noting that most of the demand is from high numbers of visitors to the tourism attractions Implications of future demand are included in asset renewal and public health/environment considerations. Levels Service of Levels of service focus on reliability of service, capacity, public health and environmental protection. Minimum levels of service required include environmental and public health protection consequent to the imminent resource consent renewal process in Current levels of service relating to system capacity and environmental protection will need to be enhanced. Public Health and Environment The discharge from the treatment ponds often does not comply with current consent conditions. Sludge from the ponds is stored in bags on nearby private land. There is no apparent plan for its safe disposal. The current discharge consent expires in 15 April Replace existing treatment ponds with an upgraded treatment plant to meet future environmental standards and sized for future growth. Estimated cost of consent renewal is $100,000 Estimated cost of replacing and upgrading the treatment ponds with a modern wastewater treatment plant is $578,000. Risk and Resilience* Resilience to natural hazards is unknown but unlikely to be adequate. Lateral displacement failure of treatment pond embankments and adjacent stream banks in a major seismic event is a potential issue. Assess treatment plant for resilience to a major earthquake. Additional investment would be required to achieve an adequate level of resilience to natural disasters appropriate to the iconic status of the Village tourism attractions DRAFT Infrastructure Strategy Doc
40 Water Supply Issue Asset renewal or Replacements Response to Demand Levels of Service Public Health & Environment Risk and Resilience Issues * Description The water reticulation is in relatively poor condition with high levels of deferred maintenance and renewals. The current water supply infrastructure is a constraint to future development of the village. There is no spare capacity for growth. Current levels of service are unknown or very low/ad hoc. The water supply does not comply with NZ Drinking Water Standards Resilience to natural hazards unknown but unlikely to be adequate. Resilience to a water borne health outbreak is low. Principal options for response Replacement of water mains Sizing the capacity of the water supply appropriate to current and realistic growth in tourism activities, noting that most of the demand is from high numbers of visitors to the tourism attractions Levels of service would increase to a minimum of secure supply, continuous supply, responsive service and compliance with NZ Drinking water Standards. Major renewal or replacement of the water treatment plant is required. Assess reservoirs and treatment plant for resilience to a major earthquake. Implications Indicative cost of $540,000 in years Future development of mains $227,000 Implications of future demand are included in asset renewal and public health/environment considerations. Current levels of service relating to security of supply and public health protection would be enhanced. Estimated cost of $1.0M Additional investment would be required to achieve an adequate level of resilience to natural disasters appropriate to the iconic status of the Village tourism attractions DRAFT Infrastructure Strategy Doc


41 REVENUE AND FINANCING POLICY 2015 Revenue and Financing Policy - word version for changes v6: 037/020/15: JG
42 Table of contents 1.0 INTRODUCTION Background Policy Intent LEGAL REQUIREMENTS Local Government Act Section 103 Revenue and Financing Policy: Section 101(3) states: Section 14 Principles relating to Local Authorities Other Legal Requirements Local Government (Rating) Act Building Act, Sale of Alcohol, etc Resource Management Act POLICY STATEMENT Funding Of Operating Expenditure Funding Of Capital Expenditure POLICY DEVELOPMENT PROCESS Community Outcomes (COs) Distribution of Benefits Period of Benefits (Intergenerational Equity) Exacerbator Pays Costs and Benefits Overall Impact of the Funding Mechanisms Selected Benefits Allocation and Funding Mechanism Use of Funding Mechanisms Definition of SUIP ANALYSIS OF ACTIVITIES AND FUNDING CONCLUSIONS Summary of Funding Sources COMMUNITY AND CULTURAL SUSTAINABILITY Governance: Leadership and Investments COMMUNITY DEVELOPMENT REGULATION COMMUNITY SERVICE ENVIRONMENTAL SUSTAINABILITY SOLID WASTE MANAGEMENT STORMWATER DRAINAGE RESOURCE MANAGEMENT SEWERAGE AND TREATMENT AND DISPOSAL OF SEWAGE ECONOMIC SUSTAINABILITY WATER SUPPLY PROVISION OF ROADS AND FOOTPATHS Revenue and Financing Policy - word version for changes v6: 037/020/15: JG
43 1.0 INTRODUCTION 1.1 Background Under Section 102 of the Local Government Act 2002 (LGA 2002), all local authorities are required to adopt a Revenue and Financing Policy (RFP) The RFP provides details of Council s policies in respect of funding operating and capital expenditure, including how the policy was developed and what sources are used to fund the different activities. Total funding comprises a funding mix of rates, fees and charges, debt and other income The application of the Revenue and Financing Policy is reflected in the Funding Impact Statement for a particular financial year. To understand the rating impact of the policy it needs to be read in conjunction with the Funding Impact Statement. 1.2 Policy Intent The purpose of this Policy is to clearly and transparently demonstrate how and why each significant activity of Council is funded. 2.0 LEGAL REQUIREMENTS 2.1 Local Government Act Section 102(1) of the LGA 2002 requires Council to adopt a Revenue and Financing Policy. Section 103 states the requirements of the policy: 2.2 Section 103 Revenue and Financing Policy: (1) A policy adopted under section 102(1) must state (a) the local authority s policies in respect of the funding of operating expenses from the sources listed in subsection (2) (b) the local authority s policies in respect of the funding of capital expenditure from the sources listed in subsection (2). (2) The sources referred to in subsection (1) are as follows: (a) general rates, including (i) choice of valuation system (ii) differential rating (iii) uniform annual general charges; (b) targeted rates; (ba) lump sum contributions; (c) fees and charges; (d) interest and dividends from investments; (e) borrowing; (f) proceeds from asset sales; (g) development contributions; (h) financial contributions under the Resource Management Act 1991; (i) grants and subsidies; (j) any other source. (3) A policy adopted under section 102(1) must also show how the local authority has, in relation to the sources of funding identified in the policy, complied with section 101(3). 2.3 Section 101(3) states: The funding needs of the local authority must be met from those sources that the local authority determines to be appropriate, following consideration of: (a) in relation to each activity to be funded (i) the community outcomes to which the activity primarily contributes; and Revenue and Financing Policy - word version for changes v6: 037/020/15: JG
44 (b) (ii) the distribution of benefits between the community as a whole, any identifiable part of the community, and individuals; and (iii) the period in or over which those benefits are expected to occur; and (iv) the extent to which the actions or inaction of particular individuals or a group contribute to the need to undertake the activity; and (v) the costs and benefits, including consequences for transparency and accountability, of funding the activity distinctly from other activities; and the overall impact of any allocation of liability for revenue needs on the community. 2.4 Section 14 Principles relating to Local Authorities This section lists some general principles that a local authority must act in accordance with, when performing its role and conducting its business. In summary, local authorities are required to be: Open, transparent and accountable. Efficient and effective. Aware of and pay regard to the views of its communities. Focused on meeting Community outcomes. Responsive to diverse community interests including future generations. Collaborate actively with other local authorities. Inclusive of Maori. Based on sound business practices in the case of commercial transactions. Assess the expected returns of investments and assess if they are likely to outweigh the risks inherent in the investment Demonstrative of prudent stewardship of resources, including planning effectively for the future management of its assets. Based on a sustainable approach reflecting the social, economic, environmental and cultural interests of future generations. 2.5 Other Legal Requirements While the Revenue and Financing Policy is governed by the LGA 2002, there are other legislative requirements that are relevant for determining appropriate funding mechanisms such as: 2.6 Local Government (Rating) Act The Local Government Rating Act 2002 sets out all the legal requirements for rating. It covers who is liable to pay rates, what land is rateable, what kind of rates may be set and how those rates are set, the valuation systems which may be used and the various rating mechanisms available (such as targeted rates). It also sets a number of limits on local government. For example, total uniform charges (excluding any targeted fixed rate charges for water or wastewater) may not exceed 30% of total rates revenue. 2.7 Building Act, Sale of Alcohol, etc A number of Acts, such as the above, set out statutory fees for various types of regulatory services. These fees may not be exceeded. Where fee setting is up to the local authority, there is often a general legal requirement for this to be fair and reasonable. The Dog Control Act 1996 determines that revenue collected under authority of that Act may only be used to defray expenses incurred in the provision of this activity. 2.8 Resource Management Act The Resource Management Act 1991 (RMA 1991) sets out Council s responsibilities in terms of the environment. It also specifies the circumstances in which local authorities may require financial contributions from developers to meet the costs of their impact on the environment, including their impact on the demand for infrastructure. Alternatively, under the LGA 2002, local authorities are allowed to seek development contributions or a combination of development and financial contributions under the respective Acts. Revenue and Financing Policy - word version for changes v6: 037/020/15: JG
45 3.0 POLICY STATEMENT 3.1 Funding Of Operating Expenditure Where expenditure does not create a new asset for future use, or extend the lifetime or usefulness of an existing asset, it is classed as operating expenditure Council funds operating expenditure from the following sources: General Rates Uniform Annual General Charge Targeted Rates Fees and Charges Interest and Dividends from investments Grants and Subsidies towards operating expenses Other Sources Council may choose to not fully fund operating expenditure in any particular year, if the deficit can be funded from operating surpluses in the immediately preceding or subsequent years Council has determined the proportion of operating expenditure to be funded from each of the sources listed above, and the method for apportioning rates and other charges. The process used is as specified by the LGA The Funding Impact Statement produced each year (as required by Schedule 10(20) LGA 2002) shows the impact of the Revenue and Financing Policy each year. It also shows the amounts to be collected from each available source, including how various rates are to be applied. 3.2 Funding Of Capital Expenditure Capital expenditure is the spending on creation of a new asset, or extending the lifetime of an existing asset. Capital expenditure can also be incurred to improve the level of service provided by the asset The following sources are available for Council under the LGA to fund capital expenditure: Grants and Subsidies Loans Rates Proceeds from Asset Sales Depreciation Reserves Financial Contributions under the Resource Management Act Development Contributions under the Local Government Act Other Council makes use of all of the above sources of funding of capital expenditure, with the exception of Development Contributions. Population trends show that there is no demand for growth related infrastructure at the present time. There is currently enough capacity in the infrastructure network to allow for nominal growth should it occur in an area. The RFP does not include a provision for growth related capital expenditure as it has been assumed that capital outlay to cater for growth will not occur until there is evidence that the assumed growth is taking place Council makes provision for capital expenditure for renewals and capital developments which relate to improvements to levels of service. Funding sources used by Council for capital expenditure for renewals in order of priority are, subsidies and grants (when available), depreciation funding, then loan funding, and lastly rate funding. Expenditure for capital developments for improvements to levels of service are funded in the following order of priority, subsidies and grants (when available), loan funding and lastly rate funding Loan funding is an appropriate funding mechanism to enable the effect of peaks in capital expenditure to be smoothed and also to enable the costs of major developments to be borne by those who ultimately benefit from the expenditure. This is known as the intergenerational equity principle and means that the Revenue and Financing Policy - word version for changes v6: 037/020/15: JG
46 costs of any expenditure should be recovered from the community at the time or over the period the benefits of that expenditure accrue. 4.0 POLICY DEVELOPMENT PROCESS In developing the Revenue and Financing Policy and determining the appropriate funding sources for each activity, Council considered each activity against the principles laid out in LGA These are: 4.1 Community Outcomes (COs) These are the outcomes that a local authority aims to achieve in meeting the current and future needs of communities for good-quality local infrastructure, local public services, and performance of regulatory functions. Section 101(3)(a)(i) of the LGA 2002 requires that in determining the funding sources, Council identify the community outcomes to which each activity primarily contributes This Revenue and Financing Policy lists for each group of activities, the outcomes to which it primarily contributes, and states why each activity is undertaken. 4.2 Distribution of Benefits Section 101(3)(a)(ii) of LGA 2002 requires costs to be allocated where the benefits lie. Council assessed the Distribution of Benefits for each activity, whether the benefits flowed to the District as a whole, or to individuals or identifiable parts of the community In order to assess the Distribution of Benefits, it is necessary to first describe and define the different types of benefits that flow from Council activities. Definition of Terms National Benefit District Benefit Regional Benefit Commercial Benefit Community Benefit User Benefit Applicant Offender / Exacerbator Benefits the nation and is public in nature. Benefits the whole District and is public in nature. Benefits the Region and is public in nature. Benefits the commercial sector and has elements of both public and private benefit. Benefits a particular Community of Interest and is public in nature. Benefits an identifiable individual, group, or community segment. Benefits an Identifiable individual, group or community segment. The cost is the result of offenders, or ones who exacerbate a problem. 4.3 Period of Benefits (Intergenerational Equity) Section 101(3)(a)(iii) requires the consideration of intergenerational equity the principle that costs of any expenditure should be recovered over the time that the benefits of the expenditure accrue. This principle applies particularly to the allocation of capital expenditure and results in infrastructural costs being spread more evenly across the life of the asset and the different ratepayers who benefit from it These principles of funding operating and capital expenditure are as stated in the Policy Statement section of this policy. They are assumed to apply to each activity, unless otherwise stated in the individual Activity Analysis section Operational expenditure is funded annually and therefore there are no intergenerational equality issues to be considered. Intergenerational equality issues arise in relation to capital expenditure and investments and are discussed in the Policy Statement section of this policy and identified in the individual activity analysis sections where relevant. 4.4 Exacerbator Pays Revenue and Financing Policy - word version for changes v6: 037/020/15: JG
47 4.4.1 Section 101(3)(a)(iv) requires Council to assess the extent to which each activity is undertaken to remedy the negative effects of the actions or inaction of an individual or group. It is important to note that the actions themselves may not be negative or bad but they may have negative effects on the whole community. This principle (exacerbator or polluter pays principle) is particularly relevant to Council s regulatory functions and other activities undertaken to mitigate the adverse effects on the environment The Exacerbator Pays principle suggests that Council should, where it is practical; recover any costs directly from the individual or group that contributes to the deterioration of a situation or to a cost that is a direct result of their actions Most activities do not exhibit exacerbator pays characteristics. This heading is only included in the analysis of those activities which do demonstrate such characteristics. 4.5 Costs and Benefits This consideration includes transparency, accountability and some assessment of the cost efficiency and practicality of funding a particular activity separately Transparency and accountability are most evident when an activity is totally distinctly funded. This allows rate-payers, or payers of user charges as the case may be, to see exactly how much money is being raised for and spent on the activity. However, funding every activity on such a distinct basis would be extremely administratively complex. The administrative costs and lack of materiality has led Council to fund a number of activities collectively. The individual Activity Analysis section of this policy does not repeat this argument for each activity. 4.6 Overall Impact of the Funding Mechanisms Selected Following the consideration of the matters referred to in Section 101(3)(a) a picture emerges of where the benefits of engaging in activity accrue. Once this is done and indicative costs allocation compiled, the final step in Council s process of developing this policy has been to consolidate the results of the individual activity analysis and consider these results in terms of Section 101(3)(b). Section 103(b) requires Council to consider the overall impact of any allocation of liability for revenue needs on the community. The impact is assessed on the current and future interests of the community. Council agreed that for most activities where a District benefit has been identified, funding that benefit allocation equally through General Rate and UAGC would be the most efficient, equitable and transparent funding method. Both the General Rate and the UAGC are appropriate funding sources when a District wide benefit is assessed. Council s reasoning behind this decision was that for some activities UAGC would be the most appropriate method for funding the District allocation because of the equal benefit nature of the activity, but Council needs to take into account the rates affordability and ability to pay considerations within the community and also the legislative cap on the amount that can be funded through the UAGC. This reasoning by Council has not been repeated in the rest of the policy except where Council has made exceptions to it. 4.7 Benefits Allocation and Funding Mechanism Council s Revenue and Financing Policy has been developed at the functions level. The benefit allocation and funding mechanism for each function is included under the relevant activity in sections 6 to 8 of this policy. 4.8 Use of Funding Mechanisms The funding sources available to a local authority are set out under the LGA 2002 and the LGRA Presented below are descriptions of the available funding sources. (a) General Rate Revenue and Financing Policy - word version for changes v6: 037/020/15: JG
48 The General Rate is set under Section 13(2)(a) of the LGRA 2002 and has been used to part fund the activities of Leadership, Community Development, Community Services, Regulation, Resource Management, Investment and Solid Waste Management. It is set according to the Revenue and Financing Policy for these activities. The General Rate is a rate per $100 of capital value applied to all rateable properties in the District. A General Rate is used according to the Revenue and Financing Policy, when: Council considers that a capital value rate is fairer than the use of other existing rating tools for the service funded; and Council considers that the community as a whole should meet costs of the function; and Council is unable to achieve its user charge targets and must fund expenditure; or UAGC use would be a fair method but Council is constricted by the 30% cap (Section 21 LGRA 2002). (b) Uniform Annual General Charge (UAGC) The UAGC, assessed on each separately used or inhabited part of a rating unit (SUIP), is set under Section 15 of the LGRA 2002 and has been used to part-fund some activities where overall District-wide benefit has been assessed (details are contained within the relevant activity funding sections). UAGC is assessed on each separately used or inhabited part (SUIP) of a rating unit to: Ensure equity in bearing the cost liability of a service (or part of service) which is deemed equally beneficial to all Ensure that those with multiple uses pay a fair share Provide a consistent treatment between all uniform charges. In setting the UAGC, based on the Revenue and Financing Policy, Council will consider the following aspects: Adherence to the legislative cap (UAGC to be maximum of 30% of total rates excluding any fixed rate charges for water or wastewater) and; Set the amount of UAGC such that it is as fair as possible to all ratepayers and in consideration of the principles of affordability and sustainability. Council may consider capping the amount of the UAGC at a certain value or that any increase in UAGC will be limited to a maximum of the Local Government Cost Indicator (LGCI) for that year (to be determined by Council through the annual rates setting process). This consideration is primarily to maintain rates affordability and is in keeping with section 101(3) of LGA 2002 which explicitly requires that the funding needs be met by sources considered appropriate by Councils, giving consideration to, among other things, the impact of the funding allocations on the interests of the community. (c) Targeted Rates A Targeted Rate is set under Sections 16 or 19 of the LGRA 2002 and has been used to part fund the groups of activities of Community Development, Community Services, Sewerage and Treatment and Disposal of Sewage, Water Supply, Stormwater Drainage, Solid Waste Management and Provision of Roads and Footpaths. Targeted Rates are set according to the Revenue and Financing Policy for these services. A Targeted Rate is used according to the Revenue and Financing Policy, when: Council considers that a Targeted Rate would enable a higher level of transparency in funding allocation; or Revenue and Financing Policy - word version for changes v6: 037/020/15: JG
49 Council considers that a Targeted Rate is fairer than the use of other existing rating tools for the service funded, in consideration of the benefit derived from the service. The percentage of benefit is determined by Council s Revenue and Financing Policy. The LGRA 2002 allows for Targeted Rates to be assessed on land defined on the basis of use to which land is put, area of land, location of land, the value of land and the provision or availability of Council services. Targeted Rates may be imposed as a fixed rate or differentially based on property uses. Council will use location (Schedule 2(6) of LGRA) to define the land liable for a number of targeted rates based on location. The following location definitions for the respective rating areas will apply: Te Kuiti Urban Rating Area Te Kuiti Urban and Periphery Rating Area All rating units situated within the Te Kuiti Urban Ward as defined by the Basis of Election for the 2010 Triennial Elections shown as shaded grey on the map attached in Appendix One. All rating units situated within a 5km radius, all around, from the Information Centre (deemed to be the centre of town). (A map depicting the Te Kuiti Urban and Periphery Rating Area in pink and grey is attached, as Appendix One). Council considers this boundary of Te Kuiti Urban and Periphery Rating Area (for the purpose of levying assessing the Targeted Services Fixed Rate to be fair in consideration that the benefit derived from the services funded by this Targeted Fixed Rate are accrued equally by those living within the 5km radius. Rural Rating Area Piopio Township All rating units situated within the Rural Ward as defined by the Basis of Election for the 2010 Triennial Elections, which is all rating units in the district excluding those rating units shaded grey on the map attached in Appendix One. All rating units connected to the Piopio Sewerage System. Piopio Wider Benefit Rating Area/PWBRA The area shown as yellow on the map attached as Appendix Two, but excludes all SUIPs / rating units connected to the Piopio Sewerage system. Marokopa Community Centre Rating Area Any SUIP or part of a SUIP which falls within the red lines marked on the map attached in Appendix 3. (d) Targeted Services Fixed Rate A Targeted Services Fixed Rate is set under Sections 16 and 18 of the LGRA 2002 and has been used to part fund the activities of Aquatic Centre and Unsubsidised Roading. This Targeted Services Fixed Rate is set according to the Revenue and Financing Policy for these services. This rate will be assessed as a Targeted Fixed Rate differentiated by rating areas being the Te Kuiti Urban and Periphery Rating Area and Rating Units in the district not in the Te Kuiti Urban and Periphery Rating Area. (e) Piopio Targeted Rates for Sewerage and Retirement Village Piopio Wider Benefit Rating Area Council considers that there are a few communities outside of Piopio for whom Piopio Township is the main community of interest and that they receive an indirect benefit from the development and well-being of Piopio. Therefore Council considers it fair that a separate catchment of these properties be identified called the Piopio Wider Benefit Rating Area (PWBRA) and a targeted rate for Piopio Sewerage be set for these properties. Revenue and Financing Policy - word version for changes v6: 037/020/15: JG
50 Piopio Retirement Trust Inc. The wider Piopio community consider the Piopio retirement village is an asset that should be retained. In order to support the Trust in the continued delivery of elderly housing accommodation services Council will set a Targeted Fixed Rate on every rating unit within Piopio Township and the Piopio Wider Benefit Rating Area. (f) Fees and Charges Fees and Charges will be set according to Council s Revenue and Financing Policy where: It is assessed that the level of benefit to identified beneficiary/exacerbator groups justifies the seeking of user charges; and There are identifiable and distinct user groups/exacerbators identified by Council s Revenue and Financing Policy; and User fees represent the fairest method to seek a contribution from identified beneficiaries or exacerbators. The Revenue and Financing Policy includes the percentage of fees and charges Council aspires to collect for the relevant activity. The actual fees and charges collected by Council will vary dependent on a number of external factors. (g) Interest, Subventions and Dividends Council receives limited interest from cash investments. Any interest received is used to offset the rate required in the year received. Council has an investment in Inframax Construction Ltd. Any dividends and/or subventions received are used to accelerate repayment of debt. (h) Borrowing Borrowing is managed by the provisions of Council s Treasury Policy. Council s use of funding mechanisms to fund capital development is set out in the Funding of Capital Expenditure section of this policy.. (i) Proceeds from Asset Sales Funds from any asset sales are applied first to offset borrowing in the relevant activity from which the asset was sold and secondly for repayment of existing term debt (Treasury Policy). (j) Development Contributions Population trends show that there is no demand on infrastructure created by growth at the present time. Council has resolved to reconsider the applicability of a Development Contributions Policy as part the review of the District Plan. (k) Grants and Subsidies Council receives a subsidy from New Zealand Transport Agency to part-fund operations, renewal, and capital development in provision of roads and footpaths. Council pursues other Grant and Subsidy funding available from Central Government wherever it is considered appropriate. 4.9 Definition of SUIP For the purposes of the Revenue and Financing Policy, the definition of SUIP / separately used or inhabited part of a rating unit shall be as set out in the Council s Funding Impact Statement. Revenue and Financing Policy - word version for changes v6: 037/020/15: JG
51 5.0 ANALYSIS OF ACTIVITIES AND FUNDING CONCLUSIONS Council s functions are arranged under ten Groups of Activities. These ten Groups of Activities are further organised under three main Sustainability Groups. SUSTAINABIILTY GROUPS Community and Cultural Sustainability Environmental Sustainability Economic Sustainability Governance: Leadership and Investments Solid Waste Management Water Supply Community Service Stormwater Drainage Provision of Roads and Footpaths Community Development Resource Management Regulation Sewerage and Treatment and Disposal of Sewage 5.1 Summary of Funding Sources The table below summarises the funding sources to be used for different activities. Activity Fees & Charges Grants and Subsidies General Rate (GR) UAGC Targeted Fixed Rate (TFR) Targeted Rate (TR) Rate Type Assessment basis: Capital Value (CV) / Rating Unit / SUIP Governance: Leadership and Investments Leadership Representation 50% 50% GR UAGC CV SUIP Planning & Policy & Monitoring 50% 50% GR UAGC CV SUIP District and Urban Development 50% 50% GR CV Revenue and Financing Policy - word version for changes v6: 037/020/15: JG
52 Activity Fees & Charges Grants and Subsidies General Rate (GR) UAGC Targeted Fixed Rate (TFR) Targeted Rate (TR) Rate Type Assessment basis: Capital Value (CV) / Rating Unit / SUIP UAGC SUIP Investments Local Authority Shared Services GR CV 50% 50% UAGC SUIP Inframax Construction Limited GR CV 50% 50% UAGC SUIP Council Owned Quarries 100% Forestry (located at Waitomo District Landfill) 100% GR CV Parkside Subdivision GR CV 20% 40% 40% UAGC SUIP Community Development Community Support GR CV 48% 48% 4% UAGC TFR (Piopio Retirement Village) SUIP Rating Unit within Piopio Township and the Piopio Wider Benefit Rating Area District Development 60% 20% Commerci al and Industrial Businesses TR CV 20% Rural Revenue and Financing Policy - word version for changes v6: 037/020/15: JG
53 Activity Fees & Charges Grants and Subsidies General Rate (GR) UAGC Targeted Fixed Rate (TFR) Targeted Rate (TR) Rate Type Assessment basis: Capital Value (CV) / Rating Unit / SUIP Businesses Automobile Association 70% 30% UAGC SUIP Regulation Environmental Health GR CV 60% 20% 20% UAGC SUIP Animal and Dog Control GR CV 80% 10% 10% UAGC SUIP Building Control Services 60% 40% GR CV Alcohol Licensing GR CV 40% 30% 30% UAGC SUIP Community Services Parks and Reserves GR CV 50% 50% UAGC SUIP Leased Reserves 60% 20% 20% GR CV Revenue and Financing Policy - word version for changes v6: 037/020/15: JG
54 Activity Fees & Charges Grants and Subsidies General Rate (GR) UAGC Targeted Fixed Rate (TFR) Targeted Rate (TR) Rate Type Assessment basis: Capital Value (CV) / Rating Unit / SUIP UAGC SUIP Elderly Persons Housing GR CV 60% 20% 20% UAGC SUIP Community Halls 3% 47.5% 47.5% 2% TFR GR SUIP Marokopa Community Centre Rating Area CV UAGC SUIP Other Land and Buildings GR CV 25% 37.5% 37.5% UAGC SUIP District Libraries GR CV 8% 22% 70% UAGC SUIP Aquatic Centre 10% 3.5% 3.5% 58% (Te Kuiti Urban and Periphery Rating Area) 25% TFR GR SUIP CV (Rating Units in the district not in the Revenue and Financing Policy - word version for changes v6: 037/020/15: JG
55 Activity Fees & Charges Grants and Subsidies General Rate (GR) UAGC Targeted Fixed Rate (TFR) Targeted Rate (TR) Rate Type Assessment basis: Capital Value (CV) / Rating Unit / SUIP Te Kuiti Urban and Periphery Rating Area ) UAGC SUIP Arts Culture and Heritage GR CV 10% 45% 45% UAGC SUIP Aerodrome 40% 60% GR CV Cemeteries GR CV 40% 30% 30% UAGC SUIP Public Amenities GR CV 50% 50% UAGC SUIP Emergency Management GR CV 50% 50% UAGC SUIP Environmental Sustainability Solid Waste Management Kerbside Collection 45% 55% TFR SUIP Kerbside Recycling 100% TFR SUIP Landfill and Transfer Station TFR SUIP 60% 40% Management Revenue and Financing Policy - word version for changes v6: 037/020/15: JG
56 Activity Fees & Charges Grants and Subsidies General Rate (GR) UAGC Targeted Fixed Rate (TFR) Targeted Rate (TR) Rate Type Assessment basis: Capital Value (CV) / Rating Unit / SUIP Waste Minimisation GR CV 55% 22.5% 22.5% UAGC SUIP Stormwater Drainage Urban Stormwater Reticulation and Disposal 67% (urban areas) 33% TFR TR Rating Unit CV Rural Stormwater Reticulation and Disposal 100% (rural areas) TFR SUIP Resource Management Resource Management GR CV 35% 40% 25% UAGC SUIP Sewerage and Treatment and Disposal of Sewage Te Kuiti Sewage Extraction, Treatment and Disposal TFR Residential properties per SUIP connected/serviceable Te Kuiti only 25% 75% TFR - Base charge TFR Pan Charge Non-residential Per SUIP Non Residential Per Pan TFR - Trade Waste Contribution Rating Unit District Wide Te Waitere Sewage Extraction, Treatment and Disposal 100% TFR collection and disposal SUIP connected/ serviceable Te Waitere only Revenue and Financing Policy - word version for changes v6: 037/020/15: JG
57 Activity Fees & Charges Grants and Subsidies General Rate (GR) UAGC Targeted Fixed Rate (TFR) Targeted Rate (TR) Rate Type Assessment basis: Capital Value (CV) / Rating Unit / SUIP Benneydale Sewage Reticulation, Treatment & Disposal Piopio Sewage Extraction, Treatment and Disposal Revenue and Financing Policy - word version for changes v6: 037/020/15: JG 100% 100% Economic Sustainability Water Supply Te Kuiti Water Extraction, Treatment and Reticulation 75% 25% Mokau Water Extraction, Treatment and Reticulation 70% 30% Piopio Water Extraction, Treatment and Reticulation 85% 15% Benneydale Water Extraction, Treatment and Reticulation 55% 45% TFR - Te Waitere subsidy TFR collection and disposal TFR - Benneydale subsidy TFR collection and disposal TFR Rating Unit District Wide SUIP connected/serviceable Benneydale only Rating Unit District Wide SUIP connected/serviceable Piopio only Rating unit within Piopio Wider Benefit Rating Area TFR SUIP connected/serviceable Te Kuiti only TR Water meter / consumption TFR SUIP connected/serviceable Mokau only TR Water meter / consumption TFR Mokau subsidy Rating Unit District Wide TFR SUIP connected/serviceable Piopio only TR Water meter / consumption TFR SUIP connected/serviceable Benneydale only TR Water meter / consumption TFR Benneydale Rating Unit District Wide subsidy Provision of Roads and Footpaths Subsidised Roading 2% 30% 1% 67% TR CV - Rating Unit Unsubsidised Roading 25% 67% (Te Kuiti Urban TFR SUIP
58 Activity Fees & Charges Grants and Subsidies General Rate (GR) UAGC Targeted Fixed Rate (TFR) Targeted Rate (TR) Rate Type Assessment basis: Capital Value (CV) / Rating Unit / SUIP and Periphery Rating Area) 8% (Rating Units in the district not in the Te Kuiti Urban and Periphery Rating Area) Revenue and Financing Policy - word version for changes v6: 037/020/15: JG
59 6.0 COMMUNITY AND CULTURAL SUSTAINABILITY The Community and Cultural Sustainability area focuses on building and developing cohesive and functional communities in the Waitomo District. Council provides a range of services and facilities to the various communities in the Waitomo District. The groups of Significant Activities contained within this area are: 6.1 Governance: Leadership and Investments 6.2 Community Development 6.3 Regulation 6.4 Community Service 6.1 Governance: Leadership and Investments Leadership Description The Leadership Activity provides for: Council s governance at District level. Conduct of elections. Council s advocacy on issues that impact on the Waitomo District s community outcomes. Planning and policy development that provides a framework for the Community s strategic direction. Monitoring and Reporting. This Activity includes the preparation of policies guiding strategic direction and strategic financial decisions for presentation to the Community for feedback Functions There are three functions under this activity 1) Representation 2) Planning & Policy & Monitoring 3) District and Urban Development Community Outcomes The table below shows the Community Outcomes that this Activity contributes to: Vibrant Communities CO1 A place where the multicultural values of all its people and, in particular, Maori heritage and culture is recognised and valued. Vibrant Business CO6 A place that attracts more people who want to live, work and play, and raise a family. CO7 A place where wealth and employment are created through local businesses and tourism opportunities and facilities are developed, facilitated and encouraged. Revenue and Financing Policy - word version for changes v6: 037/020/15: JG
60 Effective Leadership CO8 A place where the development of partnerships for the delivery of programmes and services is encouraged and pursued. CO9 A place where the governance actively seeks to participate and take a leadership role in regional and national initiatives aimed at the development of the District. Costs and Benefits The merit of identifying and accounting for functions under this Activity separately from other functions enables: (a) (b) (c) (d) (e) More transparent disclosure and accountability of projects and funding to the Waitomo District. Greater opportunity for the Waitomo District to have input on decisions, proposals, issues and other matters through consultation. Identification of how the Activity contributes to the achievement of COs and service delivery goals through detailed understanding and planning. Improved monitoring in terms of how well Council is achieving its COs annually. Identification of costs required supporting the Activity in terms of time involved in planning, monitoring, accounting, reporting and administration. Activity analysis and funding mechanisms Representation This function involves the provision of leadership and governance of the District and includes the Mayor s Office and Council s governance, including committees. Attributable Benefit Funding Benefit Group % of Benefit % Method District Benefit 100% 50% General Rate 50% UAGC 6.1.4a Distribution of Benefits District Benefit: The benefit of the Representation activity is considered to be District wide in nature as the benefits of good governance and representation benefit the District as a whole b Funding Mechanism District Allocation: It is proposed that the most appropriate method of funding this activity is 50:50 between the UAGC and General Rate (GR). While the fairest method would be to fund this activity by UAGC, a combination of UAGC and General Rate is considered most appropriate, given the 30% legislative cap on UAGC and the affordability considerations and the District wide benefit of these activities Planning and Policy and Monitoring This function includes: Carrying out long-term and annual planning for the District and producing plans which reflect the outcomes desired by the community. Revenue and Financing Policy - word version for changes v6: 037/020/15: JG
61 Communicating and consulting with the community on projects, issues and various planning documents, as well as surveys to gauge community satisfaction with services provided. Development of policy to promote community outcomes at a local level, and to influence policy at a regional or national level. Monitoring the achievement of the levels of service Preparation of Council s Annual Report comprising public information on achievement against the financial and key performance targets of the previous year. Attributable Benefit Funding Benefit Group % of Benefit % Method District Benefit 100% 50% General Rate 50% UAGC 6.1.5a Distribution of Benefits District Benefit: The benefit of this activity is considered to be District wide in nature as the benefits of effective planning and policy development and the monitoring of Council activities and performance is of benefit to the entire District b Funding Mechanism District Allocation: It is proposed that the most appropriate method of funding this activity is 50:50 between the UAGC and General Rate (GR). While the fairest method would be to fund this activity by UAGC, a combination of UAGC and General Rate is considered most appropriate, given the 30% legislative cap on UAGC and the affordability considerations and the District wide benefit of these activities District and Urban Development Planning Involves the planning and strategy development around urban and District development with a view to promoting the principles of sustainable development. Attributable Benefit Funding Benefit Group % of Benefit % Method District Benefit 80% 50% General Rate 50% UAGC Regional Benefit 20% 0% No funding mechanism 6.1.6a Distribution of Benefits District Benefit: District and Urban Development Planning benefits the wider District as a whole. Sustainable land use and growth planning seeks to uphold and protect outcomes that are important to the entire District. Every resident and ratepayer within the Waitomo District has the opportunity to be involved in Council s District and Urban Development Planning processes. Regional Benefit: There is an element of Regional Benefit to Council s District and Urban Development Planning function in that Regional outcomes and priorities can be advanced at a local level. Further, there is a requirement in law that Council s District Plan is aligned with the regional policy statement b Funding Mechanism District Allocation: Given the District wide benefit associated with District and Urban Development Planning, a combination of General Rate and UAGC was resolved to be the most efficient, effective and transparent method for funding this allocation. Revenue and Financing Policy - word version for changes v6: 037/020/15: JG
62 Regional Allocation: As there is no lawful funding mechanism available to Council to recover from this group of beneficiaries Council resolved that the Regional Benefit be reallocated to District Benefit and funded by a combination of General Rate and UAGC. Investments Description Council has investments in land and other organisations that it manages for the benefit of the community and to generate income Functions The functions comprising this activity are 1) Local Authority Shared Services (LASS) 2) Council Owned Quarries 3) Inframax Construction Limited 4) Forestry (located at Waitomo District Landfill) 5) Parkside Subdivision Community Outcomes The table below shows the Community Outcomes that this Activity contributes to: Vibrant Business CO6 A place that attracts more people who want to live, work and play, and raise a family. CO7 A place where wealth and employment are created through local businesses and tourism opportunities and facilities are developed, facilitated and encouraged Period Of Benefit (Intergenerational Equity) The total expenditure and income of Investment Activities needs to be specified over the proposed investment period as part of intergenerational funding decisions. Costs and Benefits The merit of identifying and accounting for this Activity separately from other Activities enables: (a) More transparent disclosure and accountability of projects and funding to the Waitomo Community. (b) Greater opportunity for the Waitomo Community to have input on decisions, proposals, issues and other matters through consultation. (c) Identification of how the Activity contributes to the achievement of COs and service delivery goals through detailed understanding and planning. (d) Improved monitoring of the Activity in terms of how well Council is achieving its COs annually. (e) Identification of costs required to support the Activity in terms of time involved in planning, monitoring, accounting, reporting and administration.. Revenue and Financing Policy - word version for changes v6: 037/020/15: JG
63 Activity Analysis and Funding Mechanisms Investment in Local Authority Shared Services (LASS) This function represents Council s shareholding/ investment in Local Authority Shared Services (LASS). The principle objective for the company is to provide the most effective access to regional information of mutual value to the regional community using modern technology and processes and to be an umbrella for future development of shared services within the region. Attributable Benefit Funding Benefit Group % of Benefit % Method District Benefit 80% 50% General Rate 50% UAGC National Benefit 20% 0% No funding mechanism a Distribution of Benefits District Benefit: LASS are assessed to have a District wide benefit as they are either made to generate income or to explore opportunities for cost reduction/efficiencies, which are used for the benefit of the entire District, or Council is involved in them for a strategic reason which again is for the benefit of the District as a whole. National Benefit: Gaining the most effective access to regional information and services of mutual value to the regional community is seen as having national benefit b Funding District Allocation: The fairest method of funding this investment would be by way of UAGC. However, due to the 30% UAGC cap and rates affordability issues, Council resolved a combination of General Rate and UAGC to be the most efficient, effective and transparently lawful funding mechanism for this allocation. National Allocation: As there is no lawful funding mechanism available to Council to recover from this group of beneficiaries Council resolved that the National Benefit be reallocated to District Benefit and funded by a combination of General Rate and UAGC Investment in Inframax Construction Ltd (ICL) This function represents Council s investment in Inframax Construction Ltd (ICL). ICL is a provider of roading construction and maintenance and other civil engineering infrastructural services. Attributable Benefit Funding Benefit Group % of Benefit % Method District Benefit 100% 50% General Rate 50% UAGC 0% Dividend or Subvention Income a Distribution of Benefits District Benefit: ICL is assessed to have District wide benefit as it exists to give effect to social and economic outcomes that benefit the entire District. Council s investment in ICL is considered to be strategic in nature and for the benefit of the wider District as a whole. Revenue and Financing Policy - word version for changes v6: 037/020/15: JG
64 6.1.13b Funding Investment Income: Council resolved that as this investment has been entered into for social and economic purposes it would be equitable to fund the cost of this activity through Investment Income (i.e. dividend and/or subventions), when available. Any surplus generated through this investment will be used to accelerate the repayment of term debt which benefits the wider community by enhancing the financial sustainability of the Waitomo District Council. District Allocation: Any deficit resulting from Council s investment in ICL will be funded by way of a combination of General Rate and UAGC which reflects the public good associated with the investment. This is considered to be the most efficient, effective and transparent method for funding this allocation Council Owned Quarries This function involves the maintenance and management of Council owned quarries. Attributable Benefit Funding Benefit Group % of Benefit % Method District Benefit 100% 100% Investment Income a Distribution of Benefits District Benefit: Council owned quarries are assessed to have District wide benefit as they exist to give effect to social and economic outcomes for the benefit of the entire District. Council s investment in quarries is considered to be strategic in nature and for the benefit of the wider District as a whole b Funding Investment Income: Council resolved that as this investment has been entered into for social and economic purposes it would be most equitable to fund this activity through investment income (e.g. metal royalties/leases). Any net surplus income generated through this investment will be used to offset rates income collected from the entire District. District Allocation: Any deficit resulting from Council s investment in Quarries will be funded from the General Rate which reflects the public good associated with the investment. This is considered to be the most efficient, effective and transparent method for funding this allocation Forestry located at Waitomo District Landfill This function involves the maintenance and management of forestry located at Waitomo District Landfill. Attributable Benefit Funding Benefit Group % of Benefit % Method District Benefit 100% 100% General Rate a Distribution of Benefits District Benefit: The forestry plantation at Waitomo District Landfill is assessed to have District wide benefit as it exists to generate income which is used for the benefit of the entire District. Council s investment in forestry is considered to be strategic in nature and for the benefit of the wider District as a whole b Funding Revenue and Financing Policy - word version for changes v6: 037/020/15: JG
65 Investment Income: Council resolved that the income generated from this investment depends upon harvest plans and maturity and hence will be intergenerational and therefore it would be most appropriate and transparently lawful to fund this allocation through General Rate Parkside Subdivision This function represents Council s investment in Parkside Subdivision. If people are to live and work in Waitomo they must have choice of housing value, style and location. Parkside subdivision is an investment by WDC to provide quality sections within the township of Te Kuiti. The subdivision at time of purchase involved 32 sections for resale. Attributable Benefit Funding Benefit Group % of Benefit % Method District Benefit 100% 40% General Rate 40% UAGC 20% Sale of Sections a Distribution of Benefits District Benefit: The Parkside Subdivision is assessed to have District wide benefit as it exists to generate income which is used for the benefit of the entire District. Council s investment in Parkside is considered to be strategic in nature and for the benefit of the wider District as a whole b Funding Investment Income: Council resolved that the income generated from this investment depends upon sales of residential sections and therefore it would be most appropriate and transparently lawful to fund this allocation through Investment income as and when sections are sold. District Allocation: Council resolved that any shortfall and interim holding costs will be funded by way of a combination of General Rate and UAGC which reflects the public good associated with the investment. This is considered to be the most efficient, effective and transparent method for funding this allocation. 6.2 COMMUNITY DEVELOPMENT Description The Community Development Activity is a group of activities where the Council, in a number of diverse roles, is actively involved in helping the community to help itself. Community Development activities represent a group of collaborative and partnership approaches and initiatives involving many agencies and organisations. These activities involve a common theme of promoting a better quality of life and a better living environment within the District Functions There are three functions under this significant activity: 1) Community Support 2) District Development 3) Agencies (Automobile Association) Community Outcomes The table below shows the Community Outcomes that this Activity contributes to: Vibrant Communities Revenue and Financing Policy - word version for changes v6: 037/020/15: JG
66 CO1 A place where the multicultural values of all its people and, in particular, Maori heritage and culture is recognised and valued. CO2 A place where all age groups have the opportunity to enjoy social, cultural and sporting activities within our District CO3 A place where young people have access to education, training and work opportunities. C04 A place where young people feel valued and have opportunities for input into the decisions for the District. CO5 A place where we preserve the natural environment for future generations, ensuring that natural resources are used in a sustainable manner. Thriving Business CO6 A place that attracts more people who want to live, work and play, and raise a family. CO7 A place where wealth and employment are created through local businesses and tourism opportunities and facilities are developed, facilitated and encouraged. Effective Leadership CO8 A place where the development of partnerships for the delivery of programmes and services is encouraged and pursued. Costs and Benefits The merit of identifying and accounting for functions under this Activity separately from other functions enables: (a) More transparent disclosure and accountability of projects and funding to the Waitomo Community. (b) Greater opportunity for the Waitomo Community to have input on decisions, proposals, issues and other matters through consultation. (c) Identification of how the Activity contributes to the achievement of COs and service delivery goals through detailed understanding and planning. (d) Improved monitoring of the Activity in terms of how well Council is achieving its COs annually. (e) Identification of costs required supporting the Activity in terms of time involved in planning, monitoring, accounting, reporting and administration. Activity Analysis and Funding Mechanisms Community Support As part of this function Council seeks to improve social outcomes within Waitomo District by working closely with the District community. It includes making grants to the community, provision of service contracts, Council s Sister City relationship and Youth Initiatives. Attributable Benefit Funding Benefit Group % of Benefit % Method Revenue and Financing Policy - word version for changes v6: 037/020/15: JG
67 District Benefit 100% 50% UAGC 50% General Rate 6.2.5a Distribution of Benefits District Benefit: The benefit of this activity is considered to be District wide in nature as the benefits of the activity of supporting the community by working to create a better quality of life is beneficial to the entire District b Funding District Allocation: It is considered that the most appropriate method of funding this activity is 50:50 between the UAGC and General Rate (GR). Community support activity aims to develop a more liveable and vibrant district which will can have an effect on the prosperity of the entire District District Development This function encompasses four activities that serve to attract visitors to the District and contribute over time to the overall development of the District. 1) Economic Development - This function involves the development, support and promotion of business-related programmes and activities and new employment initiatives within the District. It also involves the maintenance of a high quality environment, input into the urban infrastructure, the need to recognise the importance of international relationships and the tourism industry and utilisation of the landscape and culture of the Waitomo District. 2) Visitor Information Centres - The Information Centre in Te Kuiti acts as a central repository of tourism related information of the District. Tourism is facilitated through the provision of this service. 3) District and Regional Promotion - This activity involves regional tourism growth at both domestic and international levels, using Waikato regional branding rather than individual District brands. It also involves coordinating local tourism products and experiences using the regional approach in partnership with Tourism NZ and other tourist organisations. 4) Event Coordination - Co-ordination of major events in the District, including the Great NZ Muster and the Christmas Parade. Attributable Benefit Funding Benefit Group % of Benefit % Method National Benefit 10% 0% No funding mechanism District Benefit 80% 60% General Rate Revenue and Financing Policy - word version for changes v6: 037/020/15: JG
68 Community Benefit 10% 20% Commercial and Industrial Businesses (Targeted Capital Value Rate) 20% Rural Businesses (Targeted Capital Value Rate) 6.2.6a Distribution of Benefits National Benefit: There is an element of national and regional benefit that results from attracting visitors to the District. New Zealand as a whole and particularly the region will benefit from services and events attracts overseas and local visitors. Increased visitor numbers to Waitomo District will have flow on effects for our neighbours and help in promoting other neighbouring Districts as well. District Benefit: The Visitor Industry is considered to have a District wide benefit as the activity gives effect to the economic development and employment within the District as a whole. There are numerous examples that demonstrate tourism can contribute immensely to the whole economy in terms of increased employment, revenue generation and the like and that benefit will accrue to the overall District. Community Benefit: The Visitor Industry provides a high degree of benefit to communities that provide meals, entertainment and accommodation b Funding National/Regional Allocation: Council resolved that this allocation should be funded through Grants when available. District/Community Allocation: Council considered that the overall District benefits to an extent from District Development Activities but also that specific beneficiaries can be identified (businesses) and therefore resolved a targeted District Development rate is the most efficient, effective and transparent method for funding this allocation. Council resolved that funding should be a rate per $100 of capital value apportioned on the basis of 60% General rate, 20% Commercial and industrial businesses (categorised as Commercial, Industrial and Utilities in the Rating Information Database) and 20% Rural Businesses (categorised as Dairy, Pastoral, Specialist, Forestry, Minerals and Horticulture in the Rating Information Database) Agencies This activity aims to facilitate community access to government services through a combination of monitoring, advocating and providing. With regard to the latter, the Council currently acts as an agency for the Automobile Association (AA), including provision of driver licensing services. Attributable Benefit Funding Benefit Group % of Benefit % Method Regional Benefit 5% 0% No funding mechanism District Benefit 15% 0% General Rate 30% UAGC User Benefit 80% 70% Fees and Charges 6.2.7a Distribution of Benefits Revenue and Financing Policy - word version for changes v6: 037/020/15: JG
69 Regional Benefit: Having an AA agency in Te Kuiti is considered to have a degree of regional benefit as the services of the agency are availed by residents of neighbouring Districts as well. District Benefit: Though it is primarily the users of this service that benefit from it, there is also an element of District wide benefit in that anyone within and around the District requiring the service has easy access to it. User Benefit: Users of the agency are the direct beneficiaries of the service b Funding Regional Benefit: No lawful funding mechanism is available for this allocation. Council resolved that it be reallocated to District Allocation. District Allocation: Council considers this service to be of equal District wide benefit and a UAGC was resolved to be the most efficient, effective and transparent method for funding this allocation. Fees and Charges: Council resolved that user fees and charges would be the most efficient, effective and transparently lawful available method for funding this allocation. 6.3 REGULATION Description The Regulation activity works towards the goal of seeking to effectively and efficiently provide a safe and sustainable environment through the administration and enforcement of Central Government Legislation Functions The functions under this activity are: 1) Environmental Health 2) Animal and Dog Control 3) Alcohol Licensing 4) Building Control Community Outcomes The table below shows the Community Outcomes that this Activity contributes to: Vibrant Business CO6 A place that attracts more people who want to live, work and play, and raise a family. CO7 A place where wealth and employment are created through local businesses and tourism opportunities and facilities are developed, facilitated and encouraged. Effective Leadership CO8 A place where the development of partnerships for the delivery of programmes and services is encouraged and pursued Costs and Benefits Revenue and Financing Policy - word version for changes v6: 037/020/15: JG
70 The merit of identifying and accounting for functions under this Activity separately from other functions enables: (a) (b) (c) (d) (e) More transparent disclosure and accountability of projects and funding to the Waitomo Community. Greater opportunity for the Waitomo Community to have input on decisions, proposals, issues and other matters through consultation. Identification of how the Activity contributes to the achievement of Community Outcomes and service delivery goals through detailed understanding and planning. Improved monitoring of the Activity in terms of how well Council is achieving its Community Outcomes annually. Identification of costs required to support the Activity in terms of time involved in planning, monitoring, accounting, reporting and administration. Activity Analysis and Funding Mechanisms Environmental Health The provision of environmental health services, including licencing and inspection of food premises and noise control. The Council has specific statutory responsibilities under each of these functions. Attributable Benefit Funding Benefit Group % of Benefit % Method District Benefit 50% 20% General Rate 20% UAGC User/Applicant Benefit 40% 60% Fees and Charges Exacerbator 10% 6.3.5a Distribution of Benefits District Benefit: Environmental Health delivers District benefits by ensuring minimum health standards, such as premises are licensed and safe, healthy and hygienic for the public to use, and providing general advice and education. Noise control services provided also contribute to healthy living. The investigation and notification of incidents of communicable diseases also provides benefit to the entire District. User/Applicant Benefit: Individuals and organisations applying for a licence to operate under specific regulations nationally and within the District and those requiring advice about the regulations are direct beneficiaries of this service. Exacerbator/Offender: These are the costs incurred in responding to the actions of offenders. This includes costs associated with investigating complaints, non-compliance with licenses and regulations and prosecution of offenders b Funding User Allocation: Council resolved user fees and charges to be the most efficient, effective and transparently lawful available method for funding this allocation. Exacerbator Allocation: User fees and charges are considered to be the most efficient, effective and transparently lawful available method for funding the Exacerbator funding this allocation. District Allocation: Council is not able to recover all the costs of this activity from fees and charges. The most appropriate method of funding the remainder of this activity is considered to be 20% UAGC and 20% General Rate (GR). Revenue and Financing Policy - word version for changes v6: 037/020/15: JG
71 6.3.6 Animal and Dog Control Provision of an animal and dog control service for the District. This activity involves the registration of dogs as well as the prevention of harm to the community in cases of menacing or dangerous behaviour by dogs and dealing with roving stock. Attributable Benefit Funding Benefit Group % of Benefit % Method District 20% 10% General Rate User/Applicant Benefit 70% 10% UAGC Exacerbator 10% 80% Fees and Charges 6.3.6a Distribution of Benefits District Benefit: The District benefit is received from general advice given to the public, education and public safety. All residents have equal access to the use of the service. User/Applicant Benefit: Individuals applying for and maintaining dog registration and receiving education are direct beneficiaries of this service. The allocation reflects the benefit to those individuals with animals. Exacerbators: These are the costs incurred in responding to the actions of offenders. This includes costs associated with investigating complaints, impounding of stock and prosecution of offenders b Funding User Allocation: Council resolved that user fees and charges would be the most efficient, effective and transparently lawful method available for funding this allocation. Exacerbator Allocation: Council resolved that education and monitoring would be the most effective method to promote good animal management and control. Council also proposes that user fees and charges would be the most efficient, effective and transparently lawful method available for funding this allocation. District Allocation: Council is not able to recover all the costs of this activity from fees and charges The most appropriate method of funding the remainder of this activity is considered to be 10% UAGC and 10% General Rate Building Control Services Provision of building control services, including issuing and monitoring of building consents. Attributable Benefit Funding Benefit Group % of Benefit % Method District Benefit 20% 40% General Rate User/Applicant Benefit 75% 60% Fees and Charges Exacerbator 5% 6.3.7a Distribution of Benefits District Benefit: The District benefit is received from general advice given to the public, education, and public safety. This activity is mandatory for Council and has a District benefit by ensuring minimum building Revenue and Financing Policy - word version for changes v6: 037/020/15: JG
72 standards are met and that buildings are safe for use. This activity is also driven by Central Government policies and there is increased focus at the national level around sustainable building development. Applicant Benefit: Individuals and groups applying for a building consent, requiring building inspection, compliance certificates and advice, are the direct beneficiaries of this service. Exacerbator: These are the costs incurred in responding to the actions of offenders. This includes costs associated with non-compliance with consents and Warrants of Fitness b Funding District Allocation: Council resolved that the most efficient, effective and transparent method for funding this allocation would be General Rate since any investment in and development of the District will have more positive economic impact on larger property owners. Applicant Allocation: Council resolved that User Fees and Charges would be the most efficient, effective and transparently lawful available method for funding this allocation. Offender Allocation: Council resolved that User Fees and Charges would be the most efficient, effective and transparently lawful available method for funding this allocation Alcohol Licensing. The Alcohol Licensing function oversees the administration of the Sale and Supply of Alcohol Act 2012 at a local level acting as the District Licensing committee on behalf of the Alcohol Regulatory and Licensing Authority which encourages the responsible sale and use of alcohol through licensing, monitoring of premises and enforcement of the Act. It also involves ensuring bylaws are enforced and complied with for public safety and well-being. Attributable Benefit Funding Benefit Group % of Benefit % Method District Benefit 35% 30% General Rate 30% UAGC User/Applicant Benefit 35% 40% Fees and Charges Exacerbator 30% 6.3.8a Distribution of Benefits District Benefit: This activity is assessed at having a medium level of District benefit which occurs from ensuring Licenses are complied with, sellers of alcohol have certain qualifications, etc, which contributes towards public safety and well-being. General advice and education is also provided. Applicant Benefit: The user benefit for this service is high. Individuals and organisations applying for a licence to operate under specific regulations nationally and within the District and those requiring advice about the regulations are direct beneficiaries of this service. Exacerbators: These are the costs incurred in responding to the actions of offenders. This includes costs associated with investigating complaints, non-compliance with licenses and regulations and prosecution of offenders b Funding Applicant Allocation: Council resolved user fees and charges to be the most equitable method for funding this portion of the benefit allocation. Offender Allocation: User fees and charges are considered to be the most efficient, effective and transparently lawful available method for funding the Exacerbator funding allocation for this activity. Revenue and Financing Policy - word version for changes v6: 037/020/15: JG
73 District Allocation: Council is not able to recover all the costs of this activity from fees and charges The most appropriate method of funding the remainder of this activity is considered to be 30% UAGC and 30% General Rate. 6.4 COMMUNITY SERVICES Description Council s Community Services activity provides recreation and community facilities with the aim of ensuring that basic ranges of recreational activities are available to meet the present and future needs of the Community, and that Council meets its statutory obligations under such acts as the Reserves Act 1977 and Burials and Cremations Act This Activity also ensures that the Community has essential community facilities such as public toilets and cemeteries. These facilities are necessary to ensure that public health and safety is maintained. Community safety is provided for by the Emergency Management and Rural Fires functions Functions The functions comprising this activity are: 1) Parks and Reserves 2) Leased Reserves 3) Elder Persons Housing 4) Community Halls 5) Other Land and Buildings 7) District Aquatic Centre 8) Arts Culture and Heritage 9) Aerodrome 10) Cemeteries 11) Public Amenities 12) Emergency Management 13) Rural Fire Community Outcomes The table below shows the Community Outcomes that this Activity contributes to: Vibrant Communities CO1 A place where the multicultural values of all its people and, in particular, Maori heritage and culture is recognised and valued. CO2 A place where all age groups have the opportunity to enjoy social, cultural and sporting activities within our District. CO3 A place where young people have access to education, training and work opportunities. CO4 A place where young people feel valued and have opportunities for input into the decisions for the District. Revenue and Financing Policy - word version for changes v6: 037/020/15: JG
74 CO5 A place where we preserve the natural environment for future generations, ensuring that natural resources are used in a sustainable manner. Vibrant Business CO6 A place that attracts more people who want to live, work and play, and raise a family. CO7 A place where wealth and employment are created through local businesses and tourism opportunities and facilities are developed, facilitated and encouraged. Effective Leadership CO8 A place where the development of partnerships for the delivery of programmes and services is encouraged and pursued. Sustainable Infrastructure CO10 A place that provides safe, reliable and well managed infrastructure which meets the District community needs and supports maintenance of public health, provision of good connectivity and development of the District. Costs and Benefits The merit of identifying and accounting for functions under this Activity separately from other functions enables: (a) More transparent disclosure and accountability of projects and funding to the Waitomo Community. (b) Greater opportunity for the Waitomo Community to have input on decisions, proposals, issues and other matters through consultation. (c) Identification of how the Activity contributes to the achievement of COs and service delivery goals through detailed understanding and planning. (d) Improved monitoring of the Activity in terms of how well Council is achieving its COs annually. (e) Identification of costs required supporting the Activity in terms of time involved in planning, monitoring, accounting, reporting and administration. Activity Analysis and Funding Mechanisms Parks and Reserves This function involves the provision of parks and reserves in order to support the health and well-being of the community by supplying and maintaining areas for sport and recreation, as well as green places and landscapes that are restful and enhance the visual amenity. This function includes: active reserves, passive reserves, esplanade reserves and play equipment. Attributable Benefit Funding Benefit Group % of Benefit % Method District Benefit 100% 50% General Rate 50% UAGC Revenue and Financing Policy - word version for changes v6: 037/020/15: JG
75 6.4.5a Distribution of Benefits District Benefit: The benefit of this activity is considered to be District wide in nature as the benefits of providing recreational spaces and facilities for the community is of benefit to the entire District b Funding District Allocation: The most appropriate method of funding this activity is 50:50 between the UAGC and General Rate given the 30% legislative cap on UAGC and the affordability considerations and the District wide benefit of these activities Leased Reserves This function involves the management and maintenance of land held, though not currently used by Council as reserves, but is land-banked for future recreational purposes should the need arise. Attributable Benefit Funding Benefit Group % of Benefit % Method District Benefit 40% 20% General Rate 20% UAGC User Benefit 60% 60% Fees and Charges 6.4.6a Distribution of Benefits District Benefit: There is a small element of District wide benefit in the provision of leased reserves in that they are still available to be used by the general public or a group, if required. User Benefit: The Lessee of the land is the user and hence the direct beneficiary of the service b Funding District Allocation: Council resolved that a combination of General Rate and UAGC would be the most effective and transparent method of funding this allocation. User Allocation: Council resolved user Fees and Charges to be the most appropriate method for funding this allocation Elderly Persons Housing This function involves the provision of affordable housing for the elderly. There are currently 20 pensioner units owned by Council. This function also involves maintenance of these units. Attributable Benefit Funding Benefit Group % of Benefit % Method District Benefit 5% 20% General Rate 20% UAGC User Benefit 95% 60% Fees and Charges Revenue and Financing Policy - word version for changes v6: 037/020/15: JG
76 6.4.7a Distribution of Benefits District Benefit: Provision and maintenance of housing for the elderly provides a level of District wide benefit as it provides for the current and future social well-being of the District. User Benefit: This service has a high degree of private benefit. The direct beneficiaries of Elder Persons Housing are the occupants, and the family and friends of the occupants b Funding District Allocation: Due to the public nature of the benefit derived, Council resolved that a combination of General Rate and UAGC would be the most effective and transparent method of funding this allocation. User Allocation: Council resolved Fees and Charges to be the most appropriate funding tool for this allocation as the users (tenants) are easily identifiable and excludable and the user charges can be easily administered Community Halls This function involves the provision and maintenance of halls through the support of Hall Committees throughout the District. Attributable Benefit Funding Benefit Group % of Benefit % Method District Benefit 100% 47.5% General Rate 47.5% UAGC 2% TFR User Benefit 0% 3% Fees and Charges 6.4.8a Distribution of Benefits District Benefit: Provision of Community halls is assessed to provide benefit to the wider District as a whole as any member of the District can use the halls directly or as guests for functions, etc. Halls serve as places for meetings or functions, particularly where other options are unavailable b Funding District Allocation: Given the element of general public benefit associated with this activity, the Council resolved a combination of General Rate and UAGC to be the most appropriate, efficient and transparent funding tool for this allocation. Council recognised that most community halls are operated and maintained by the different communities themselves and Council s expenditure on the activity was in the form of grants provided to the various hall committees towards operating costs. In the case of Council assistance given for the development of Marokopa Community Hall, the same will be recovered over time as a Targeted Fixed Rate assessed on every SUIP within the Marokopa Community Centre Rating Area Other Land and Buildings This function involves the maintenance and management of other miscellaneous Council owned properties (including two camping grounds). Revenue and Financing Policy - word version for changes v6: 037/020/15: JG
77 Attributable Benefit Funding Benefit Group % of Benefit % Method District Benefit 30% 37.5% General Rate 37.5% UAGC User Benefit 70% 25% Fees and Charges 6.4.9a Distribution of Benefits District Benefit: This activity is assessed to have a degree of District wide benefit as these land and buildings are retained and maintained by Council either with strategic intent or as investments which provide benefit to the District as a whole. User Benefits: Lessees of these properties are the direct beneficiaries of the service. They are identifiable and excludable b Funding District Allocation: Council resolved a combination of General Rate and UAGC to be the most appropriate, efficient and transparent funding tool for this allocation. User Allocation: Council resolved Fees and Charges to be the most efficient and transparently lawful method of funding this allocation District Libraries This function involves the provision of library services to support culture, education, economic and personal development in the District. The main library is located at Te Kuiti with mobile services to Mokau and Piopio. Attributable Benefit Funding Benefit Group % of Benefit % Method District Benefit 20% 22% General Rate 70% UAGC User Benefit 80% 8% Fees and Charges a Distribution of Benefits District Benefit: District libraries provide a degree of benefit to the wider District as a whole which relates to enhancing the knowledge and skills of the population and provides enjoyment. Benefits also include the promotion of knowledge building, social interaction and the provision of services to people with special needs (e.g. the visually impaired and people with disabilities). User Benefit: Borrowers, information seekers and users of other library services are direct beneficiaries of the service b Funding District Allocation: Council resolved a combination of General Rate and UAGC to be the most appropriate, efficient and transparent funding tool for this allocation. Revenue and Financing Policy - word version for changes v6: 037/020/15: JG
78 User Allocation: Council resolved that although the user benefit for this service is high, funding this allocation totally through Fees and Charges would be detrimental to usage. Since libraries provide intangible benefits of promoting social and cultural development of the general population and also contribute to increasing literacy, it would be to the advantage of the District to promote their usage. It was resolved that 10% of the allocation be funded through Fees and Charges and the remaining be reallocated to District allocation District Aquatic Centre This function involves the provision and maintenance of the Waitomo District Aquatic Centre for leisure and competitive recreation opportunities for the community. Council s current aquatic asset is the public swimming pool in Te Kuiti. Attributable Benefit Funding Benefit Group % of Benefit % Method District Benefit Community Benefit 10% 70% 3.5% General Rate 3.5% UAGC 58% TFR (Te Kuiti Urban and Periphery Rating Area) 25% TFR (Rating Units in the district not in the Te Kuiti Urban and Periphery Rating Area) User Benefit 20% 10% Fees and Charges a Distribution of Benefits District Benefit: This activity is assessed to provide a degree of benefit to the wider District as a whole in that anyone wanting to use the facility has access to it. It is a facility that can be used by all and provides for the leisure, training or health needs of the entire District. Community Benefit: Aquatic Centres have a comparatively high degree of community benefit. It is assessed that people who live within the Community will benefit more than those who have to travel a longer distance to use the facility. User Benefit: Individual users, clubs and schools are direct beneficiaries of the service b Funding District Allocation: Council resolved a combination of General Rate and UAGC to be the most appropriate, efficient and transparent funding tool for this allocation. Community Allocation: Council discussed that a large proportion of the benefit of this service lay in the urban area and resolved that the activity be funded through a Targeted Fixed Rate differentiated by rating area (Te Kuiti Urban and Periphery Rating Area/Rating units in the district not in the Te Kuiti Urban and Periphery Rating Area) assessed per SUIP. User Allocation: Council discussed that although the user benefit of this service is high, charging higher for the use of the pool would be detrimental to its usage. It would also impact on the purpose of promoting a healthy community and hence it was resolved that part of this allocation be transferred to Community Allocation Arts, Culture and Heritage Revenue and Financing Policy - word version for changes v6: 037/020/15: JG
79 This function involves the maintenance and management of Culture and Heritage Buildings in the District including the Cultural and Arts Centre and Piopio Museum Buildings. Attributable Benefit Funding Benefit Group % of Benefit % Method National/Regional Benefit 10% 0% No funding mechanism District Benefit 80% 45% General Rate 45% UAGC User Benefit 10% 10% Fees and Charges a Distribution of Benefits National/Regional Benefit: Preserving arts, culture and heritage have a small national benefit as they add benefit to the nation as a whole through stimulating preservation of local knowledge and history. They also help to add tourism value to the District. District Benefit: This activity is assessed to provide a degree of benefit to the wider District as a whole in that it contributes to the cultural well-being of the District as a whole. The facilities can also be enjoyed by all. User Benefit: Individual users are direct beneficiaries of the service b Funding National Allocation: A lawful funding method for this allocation is not available. Council resolved that this allocation be transferred to District Allocation. District Allocation: Council resolved a combination of General Rate and UAGC to be the most appropriate, efficient and transparent funding tool for this allocation. User Allocation: Council resolved user Fees and Charges to be the most appropriate funding tool for this allocation Aerodrome This function involves the provision of an Aerodrome facility in Te Kuiti to provide leisure and recreational opportunities for residents and visitors to the District. Provision of a base for commercial aerial activities. Attributable Benefit Funding Benefit Group % of Benefit % Method District Benefit User Benefit 20% 60% General Rate 80% 40% Fees and Charges a Distribution of Benefits District Benefit: This activity is assessed to provide a degree of benefit to the wider District as a whole in that it provides a facility that contributes to the District economy through commercial use. User Benefit: Individual users, clubs and commercial users are direct beneficiaries of the service. Revenue and Financing Policy - word version for changes v6: 037/020/15: JG
80 6.4.13b Funding District Allocation: Council resolved General Rate to be the most efficient, effective and transparent method to fund this allocation. User Allocation: Council resolved that user Fees and Charges would be the most appropriate funding tool for this allocation Public Amenities This function involves the provision of: Public toilet facilities in the District to ensure visitors and residents have access to safe, clean and sanitary facilities. Street furniture, bins and other structures to visually enhance the town s environment and provide facilities for people to relax and enjoy the environment. Car park areas to ensure residents and visitors to the District can access conveniently located off street parking in our towns. Attributable Benefit Funding Benefit Group % of Benefit % Method District Benefit 75% 50% General Rate 50% UAGC User Benefit 20% 0% Fees and Charges Exacerbator 5% a Distribution of Benefits District Benefit: This activity is assessed to provide a degree of benefit to the wider District as a whole in that all people from within and outside the District have the ability to come and use public toilets, car park facilities and benefit from the provision of street furniture, bins and the like. User Benefit: Individual users are the direct beneficiaries of the service. These can be visitors, as well as people from within the District. Exacerbator: These are costs associated with responding to offenders (vandals) b Funding District Allocation: As it is usually hard to identify or inefficient to prosecute offenders it is considered that the Exacerbator allocation be transferred to District Allocation and therefore a combination of UAGC and General Rate is considered the most appropriate method of funding this activity Cemeteries This function involves the provision and maintenance of cemeteries in the District as required under the provisions of the Burials and Cremations Act Attributable Benefit Funding Revenue and Financing Policy - word version for changes v6: 037/020/15: JG
81 Benefit Group % of Benefit % Method District Benefit 10% 30% General Rate 30% UAGC Community Benefit User Benefit 30% 60% 40% Fees and Charges a Distribution of Benefits District Benefit: This activity is assessed to provide a degree of benefit to the wider District as a whole. District benefit results from the promotion of public health and sanitary disposal of the deceased. It also contributes to the cultural well-being of all people in the District. Community Benefit: Cemeteries have a small degree of community benefit. The Community benefit results from the promotion of public health and sanitary disposal of the deceased. It is also assessed that those people who live within the Community will utilise the cemetery more than those outside the Community. User Benefit: Families and friends of the deceased are direct beneficiaries of the service b Funding District Allocation: Council resolved a combination of General Rate and UAGC to be the most appropriate, efficient and transparent funding tool for this allocation. Community Allocation: It was resolved that this allocation be reallocated to District Allocation as it was difficult to draw boundaries around the area serviced by a cemetery. Also, allocating the exact users of the cemeteries on a per community basis would be fraught with difficulties. User Allocation: Council resolved user Fees and Charges to be the most efficient, effective and transparently lawful available method to fund this allocation. However, as it is difficult to accurately predict the fees and charges that will be generated from this activity and it can vary quite a bit from year to year, it was resolved that 20% be reallocated to District Allocation Emergency Management Provision of emergency response capability, includes public education and administering the Civil Defence Emergency Management Act Attributable Benefit Funding Benefit Group % of Benefit % Method National and Regional Benefit 10% 0% Government Subsidy District Benefit 90% 50% UAGC 50% General Rate a Distribution of Benefits National Benefit: Emergency Management has been assessed to have a certain element of National and Regional benefit, in that this service provides safety and general well-being to the national public under a national civil defence and emergency management network. By way of example, any significant natural disaster has the potential to disrupt state highways and the rail system which might affect the Country as a whole. Revenue and Financing Policy - word version for changes v6: 037/020/15: JG
82 District Benefit: Civil Defence is considered to have a high District benefit. The benefit of this function is for the safety and well-being of all people within the District b Funding National Allocation: Council considers that given the element of national benefit provided by the service, Central Government subsidy would be the most efficient and effective method of funding this allocation. However Central Government subsidies are no longer available so it was resolved that this allocation be reallocated to District Benefit. District Allocation: A combination of UAGC and General Rate is the most appropriate method of funding this activity given the 30% legislative cap on UAGC and the affordability considerations and the District wide benefit of this activity Rural Fire Provision of rural fire fighting capability and support of Tainui Rural Fire Party. Attributable Benefit Funding Benefit Group % of Benefit % Method District Benefit 40% 100% General Rate User/Applicant Benefit 50% Exacerbator 10% a Distribution of Benefits District Benefit: The Rural Fire Service has a medium degree of public benefit in that it provides security to the entire population that the District has emergency preparedness plans in place for rural fire. Also, the District benefit accrues from the fact that any escalated rural fire not contained, can cause widespread damage to forestry or farms which will have a negative economic impact on the District as a whole. User Benefit: With regard to Rural Fire Services, both public and private rural property owners can be identified as the users and hence beneficiaries of this service. This benefit accruing to rural property owners is assessed as high because Rural Fire service is offered to all properties excluding those in urban areas, and they gain benefit through the use of Council s resources and training. Exacerbator: The offender for Rural Fire is the fire starter b Funding District Allocation: Council resolved General Rate to be the most equitable, efficient and transparent method of funding this allocation. This service is provided in the rural area but it does mitigate the negative impacts of a rural fire on the whole District. User Benefit Allocation: Council resolved that this portion of benefit be reallocated to District Allocation, because although the user benefit level for this service is assessed as high and the users can be identified as a particular group and Targeted Rate would be the most equitable method for funding this portion of the benefit, but it would not be efficient or cost effective to set a separate rate for this service. Exacerbator Allocation: It is usually not practicable or possible to identify or prosecute the offender or starter of a fire (it could be natural causes) and so it would not be effective or efficient to separately fund this part of this function. Council resolved that it be reallocated to District Allocation and be funded through General Rate. 7.0 ENVIRONMENTAL SUSTAINABILITY Revenue and Financing Policy - word version for changes v6: 037/020/15: JG
83 The Environmental Sustainability area works towards promoting and ensuring that the environment is sustainably managed. The groups of activities contained within this area are: Solid Waste Management Stormwater Drainage Resource Management Sewerage and treatment and disposal of Sewage. 7.1 SOLID WASTE MANAGEMENT Description The Solid Waste Activity manages the refuse collection, disposal and recycling services for the Waitomo District. The solid waste network involves a series of recycling and transfer stations throughout the District. Residual waste is deposited at the District Landfill in Te Kuiti. The Solid Waste Activity is made up of two sub activities: 1) Collection which includes Kerbside Collection and Recycling; and 2) Management which includes Landfill Management and Waste Minimisation. People generate un-recyclable waste each day and the current trend of increasing amounts of packaging and waste material results in an ongoing challenge for waste management. If waste is not managed in an appropriate manner it may result in serious public health and environmental concerns Functions The functions comprising this activity are: 1) Kerbside Collection 2) Landfill and Transfer Stations Management 3) Kerbside Recycling 4) Waste Minimisation Community Outcomes The table below shows the Community Outcomes that this Activity contributes to: Vibrant Communities CO5 A place where we preserve the natural environment for future generations, ensuring that natural resources are used in a sustainable manner. Effective Leadership CO8 A place where the development of partnerships for the delivery of programmes and services is encouraged and pursued. Sustainable Infrastructure CO10 A place that provides safe, reliable and well managed infrastructure which meets the District community needs and supports maintenance of public health, provision of good connectivity and development of the District Period Of Benefit (Intergenerational Equity) Capital works that are an improvement or addition to the asset are considered intergenerational in nature. Costs and Benefits Revenue and Financing Policy - word version for changes v6: 037/020/15: JG
84 The merit of identifying and accounting for this Activity separately from other Activities enables: (a) More transparent disclosure and accountability of projects and funding to the Waitomo Community. (b) Greater opportunity for the Waitomo Community to have input on decisions, proposals, issues and other matters through consultation. (c) Identification of how the Activity contributes to the achievement of COs and service delivery goals through detailed understanding and planning. (d) Improved monitoring of the Activity in terms of how well Council is achieving its COs annually. (e) Identification of costs required to support the Activity in terms of time involved in planning, monitoring, accounting, reporting and administration. Activity Analysis and Funding Mechanisms Kerbside Collection This function involves the provision of kerbside collection service to residents of Te Kuiti, Piopio, Awakino, Mokau and Waitomo ward and Village area. Attributable Benefit Funding Benefit Group % of Benefit % Method Community/User Benefit 100% 45% Fees and Charges 55% TFR Per community where service is provided a Distribution of Benefits Community Benefit/User: Communities that are provided with kerbside collection service are the beneficiaries of this service b Funding Community Allocation/User Allocation: As users can be identified as a particular group (communities that are provided with the service) and also individuals that will benefit from the service, Council resolved that Fees and Charges and a Targeted Fixed Rate per separately used or inhabited part of a rating unit differentiated by Community receiving the service would be the most effective, efficient and transparent method for funding this allocation. Fees and charges are resolved upon in order to meet the Waste Minimisation objectives in the Solid Waste Management and Minimisation Plan. The utilisation of fees and charges (including the cost of solid waste disposal in the cost of the rubbish bag) will ensure that the true cost of collection and disposal is reflected in the right place and paid for by the beneficiary. Reflecting the true cost of disposal in the price of a rubbish bag is also expected to encourage waste minimisation Kerbside Recycling This function involves the provision of kerbside recycling service to residents of Te Kuiti, Piopio, Awakino, Mokau and Waitomo ward and Village area. Attributable Benefit Funding Revenue and Financing Policy - word version for changes v6: 037/020/15: JG
85 Benefit Group % of Benefit % Method Community/User Benefit 100% 100% TFR Per community where service is provided a Distribution of Benefits Community/User Benefit: Communities that are provided with kerbside recycling are considered to be the beneficiaries of this service b Funding Community Allocation/User Allocation: Since users can be identified as a particular group (communities that are provided with the service) Council resolved that a Targeted Fixed Rate per separately used or inhabited part of a rating unit differentiated by Community receiving the service would be the most effective, efficient and transparent method for funding this allocation Landfill and Transfer Stations Management This function involves the maintenance and management of the Waitomo District Landfill in Te Kuiti and Transfer Stations across the District. Attributable Benefit Funding Benefit Group % of Benefit % Method District Benefit 45% 40% Solid Waste TFR District wide. Community/User Benefit 55% 60% Fees and Charges 7.1.8a Distribution of Benefits District Benefit: The provision of this service provides benefit to the entire District derived from the accessibility of landfill and transfer stations and in terms of maintaining public health standards within the District. User Benefit: Users of the landfill and transfer stations are the direct beneficiaries of this service b Funding District Allocation: Council resolved that a Targeted Fixed Rate assessed on the basis of separately used or inhabited part of a rating unit across the entire District would be the most efficient and transparent method for funding this allocation. User Allocation: Council resolved that user Fees and Charges would be the most efficient and transparent method to fund this allocation Waste Minimisation Preserves the environment and minimises potentially negative effects of the solid waste activity. Includes education programmes aimed at drawing attention to the benefits of waste minimisation and recovery. Revenue and Financing Policy - word version for changes v6: 037/020/15: JG
86 Attributable Benefit Funding Benefit Group % of Benefit % Method National Benefit 10% 0% No funding mechanism District Benefit 90% 22.5% General Rate 22.5% UAGC 55% Waste Minimisation Rebate 7.1.9a Distribution of Benefits National Benefit: Effective Waste Minimisation provides not only environmental, but economic benefits as well, that accrue to the nation as a whole. Effective and appropriate disposal of solid waste helps protect public health and the environment for all New Zealanders. District Benefit: All residents of the District benefit from general advice and education provided as part of this service. This activity is driven by Central Government policies and there is increased focus on waste minimisation at a national level, the benefits and costs of which accrue to the wider District as a whole b Funding National Allocation: There is no lawful funding method to fund this allocation and therefore Council resolved that it be transferred to District Allocation. District Allocation: Since all residents of the District benefit from the provision of this service, Council resolved a combination of General Rate, UAGC and Ministry of the Environment Waste Minimisation Rebates (when available) to be the most efficient, effective and transparent funding mechanism available to fund this allocation. 7.2 STORMWATER DRAINAGE Description Stormwater is rain that runs over the ground on its way to a natural watercourse. When rain falls on buildings, carparks, driveways, roads and gardens, if it doesn t soak into the ground it follows its natural flow path downhill until it reaches a water course or is collected by a pipe system. Where there is development, runoff from properties and roads flow into stormwater systems. The greater the level of development in a catchment, the greater the level of impervious surfaces (e.g. roofs, driveways, paths etc), and therefore the greater the conversion of rainfall into runoff. If this runoff is not managed well, it will cause flooding. Generally stormwater is channelled on to roads or into open watercourses, then down streams and rivers to lakes and then the sea. The stormwater system manages runoff by collecting and removing the runoff, eventually disposing of it into natural streams and rivers. The Stormwater Activity involves maintaining and extending the capacity of the existing system and advocating for the appropriate management of rivers and streams within the Waitomo District Community Outcomes The table below shows the Community Outcomes that this Activity contributes to: Vibrant Communities Revenue and Financing Policy - word version for changes v6: 037/020/15: JG
87 CO5 A place where we preserve the natural environment for future generations, ensuring that natural resources are used in a sustainable manner. Effective Leadership CO8 A place where the development of partnerships for the delivery of programmes and services is encouraged and pursued Sustainable Infrastructure C010 A place that provides safe, reliable and well managed infrastructure which meets the District community needs and supports maintenance of public health, provision of good connectivity and development of the District Period of Benefit (Intergenerational Equity) Capital works that are an improvement or addition to the asset are considered intergenerational in nature. Costs and Benefits The merit of identifying and accounting for this Activity separately from other Activities enables: (a) More transparent disclosure and accountability of projects and funding to the Waitomo Community. (b) Greater opportunity for the Waitomo Community to have input on decisions, proposals, issues and other matters through consultation. Identification of how the Activity contributes to the achievement of Cos and service delivery goals through detailed understanding and planning. (d) Improved monitoring of the Activity in terms of how well Council is achieving its Cos annually. (e) Identification of costs required to support the Activity in terms of time involved in planning, monitoring, accounting, reporting and administration Activity Analysis and Funding Mechanisms Attributable Benefit Funding Benefit Group % of Benefit % Method Urban Areas Community Benefit 90% 67% TFR 33% Targeted Rate (rate per $100 of capital value) User Benefit 10% 0% Fees and Charges Attributable Benefit Funding Benefit Group % of Benefit % Method Rural Areas Community Benefit 90% 100% TFR Revenue and Financing Policy - word version for changes v6: 037/020/15: JG
88 User Benefit 10% 0% Fees and Charges Distribution of Benefits Community Benefit: Communities that are provided with this service are the direct beneficiaries as it is their land and buildings that are protected from potential flooding. There are general public health benefits in providing a Stormwater system. A further significant community benefit from the Stormwater system is that roads remain passable during times of heavy rain and flooding. User/Applicant Benefit: Individual land or property owners who can connect or are connected to the Stormwater network are the direct beneficiaries of the service Funding Community Allocation Council resolved that the most effective, equitable and transparent methods to fund this allocation is: a) Te Kuiti Urban Rating Area A combination of (a) a Targeted Fixed Rate assessed on a per rating unit basis (which will fund the standing charges associated with the provision of the service). This charge will be increased no more than annually to a maximum of the Local Government Cost Index for that year. (b) the residual funding requirement will be met from a targeted rate assessed on a rate per $100 of capital value per rating unit in the Te Kuiti Urban Rating Area. Urban properties in the Te Kuiti Urban Rating Area that hold current resource consents to discharge stormwater directly into the Mangaokewa Stream, and which are not utilising any part of the urban reticulated Stormwater or drainage network, will not be assessed for the targeted rate based on property value. However, the TFR is associated with the overall provision of an urban Stormwater service. As such this component is deemed to relate to the public good element of an urban Stormwater service. Therefore, the TFR will be assessed on all properties in the Te Kuiti Urban Rating Area. b) Rural Rating Area A Targeted Fixed Rate will be assessed on the basis of every separately used or inhabited part of a rating unit within the Rural Rating Area. In deciding the funding split between the Urban and Rural rating areas, Council recognised that most of the Stormwater network exists in the urban rating area and urban properties benefited most from the service. User/Applicant Allocation: Council resolved that the Targeted Rate and the Targeted Fixed Rate differentiated by urban and rural areas is the most efficient and transparently lawful available method for funding this allocation. 7.3 RESOURCE MANAGEMENT Description The Resource Management activity works towards the goal of seeking to effectively and efficiently provide a safe and sustainable environment through the administration and enforcement of the Resource Management Act 1991 (RMA 1991). This activity involves the administration, application and enforcement of the Waitomo District Plan provisions including: Issuing of resource consents for land use and subdivisions Monitoring consents for compliance with conditions Revenue and Financing Policy - word version for changes v6: 037/020/15: JG
89 Making amendments to the District Plan Community Outcomes The table below shows the Community Outcomes that this Activity contributes to: Vibrant Communities CO5 A place where we preserve the natural environment for future generations, ensuring that natural resources are used in a sustainable manner. Vibrant Business CO6 A place that attracts more people who want to live, work and play, and raise a family. Effective Leadership CO8 A place where the development of partnerships for the delivery of programmes and services is encouraged and pursued. Costs and Benefits The merit of identifying and accounting for functions under this Activity separately from other functions enables: (a) More transparent disclosure and accountability of projects and funding to the Waitomo Community. (b) Greater opportunity for the Waitomo Community to have input on decisions, proposals, issues and other matters through consultation. (c) Identification of how the Activity contributes to the achievement of COs and service delivery goals through detailed understanding and planning. (d) Improved monitoring of the Activity in terms of how well Council is achieving its COs annually. (e) Identification of costs required supporting the Activity in terms of time involved in planning, monitoring, accounting, reporting and administration. Activity Analysis and Funding Mechanisms Attributable Benefit Funding Benefit Group % of Benefit % Method District Benefit 60% 40% General Rate 25% UAGC User / Applicant Benefit 35% 35% Fees & Charges Exacerbator 5% 7.3.3a Distribution of Benefits Revenue and Financing Policy - word version for changes v6: 037/020/15: JG
90 District Benefit: There is a district wide benefit to this activity as ensuring that the sustainable management of physical and natural resources in the District are developed in a planned and orderly matter is beneficial to the entire District. User/Applicant Benefit: Individuals and groups applying for Resource Consents requiring monitoring are direct beneficiaries of this service. Exacerbators: These are costs incurred in responding to the actions of offenders. This includes costs associated with non-compliance with consent conditions, and can result in expensive legal action and/or hearings b Funding User/Applicant Allocation: Council resolved that user fees and charges would be the most efficient, effective and transparently lawful method available for funding this allocation. Exacerbator Allocation: Council resolved user fees and charges to be the most efficient and effective method to fund this allocation. District Allocation: The most appropriate method of funding the remainder of this activity is considered to be 25% UAGC and 40% General Rate given the 30% legislative cap on UAGC and the affordability considerations and the District wide benefit of these activities. 7.4 SEWERAGE AND TREATMENT AND DISPOSAL OF SEWAGE Description The purpose of the Sewerage Activity is to collect, treat and dispose of sewage in an effective and environmentally friendly manner. Effective and efficient sewage collection, treatment and disposal is essential to protect the environment, maintain public health and to facilitate further economic development Schemes Council provides sewerage (or wastewater) schemes in the following communities, in order to ensure the effective treatment and disposal of sewage in an environmentally sustainable manner and to promote and protect public health. 1) Te Kuiti 2) Piopio 3) Benneydale 4) Te Waitere Community Outcomes The table below shows the Community Outcomes that this Activity contributes to: Vibrant Communities C05 A place where we preserve the natural environment for future generations, ensuring that natural resources are used in a sustainable manner. Effective Leadership CO8 A place where the development of partnerships for the delivery of programmes and services is encouraged and pursued Revenue and Financing Policy - word version for changes v6: 037/020/15: JG
91 Sustainable Infrastructure CO10 A place that provides safe, reliable and well managed infrastructure which meets the District community needs and supports maintenance of public health, provision of good connectivity and development of the District Period of Benefit (Intergenerational Equity) Capital works that are an improvement or addition to the asset are considered intergenerational. Costs and Benefits The merit of identifying and accounting for functions under this Activity separately from other functions enables: (a) More transparent disclosure and accountability of projects and funding to the Waitomo Community. (b) Greater opportunity for the Waitomo Community to have input on decisions, proposals, issues and other matters through consultation. (c) Identification of how the Activity contributes to the achievement of COs and service delivery goals through detailed understanding and planning. (d) Improved monitoring of the Activity in terms of how well Council is achieving its COs annually. (e) Identification of costs required supporting the Activity in terms of time involved in planning, monitoring, accounting, reporting and administration Revenue and Financing Policy - word version for changes v6: 037/020/15: JG
92 Activity Analysis and Funding Mechanisms Attributable Benefit Funding Benefit Group % of Benefit % Method Te Kuiti Community Benefit User/Applicant Benefit 75% 75% TFR 25% 25% Fees and Charges Attributable Benefit Funding Benefit Group % of Benefit % Method Te Waitere and Benneydale Community Benefit User/Applicant Benefit 75% 100% TFR 25% 0% Fees and Charges Attributable Benefit Funding Benefit Group % of Benefit % Method Piopio Community Benefit User/Applicant Benefit 75% 100% TFR 25% 0% Fees and Charges Distribution of Benefits Community Benefit: Sewer Collection and Treatment reduces the possibility of health problems like spread of communicable diseases resulting from open sewer or inadequate septic tank facilities the benefits of which can be attributed to the community as a whole. Inadequate sewer disposal facilities can also detract from the aesthetic nature of the community and impact on receiving waterways. The Community benefit can vary depending upon the amount of demand present. High users include premises with multiple pans. User Benefit: Individual users in the particular sewer scheme who want to and are able to use the service can be identified as beneficiaries of the service Funding Community Allocation: Council resolved that a Targeted Fixed Rate differentiated by scheme and assessed on each separately used or inhabited part of a rating unit, would be the most efficient, effective and transparently lawful method for funding this allocation. Within a scheme area, the charge will be differentiated for properties that are connected or have the ability to connect (serviceable). Any SUIP will be considered to have the ability to connect (serviceable) if in the opinion of Council it is practicably serviceable and its boundary is situated within 30 metres of Council s sewerage drain, to which it is able to be connected but is not so connected. Revenue and Financing Policy - word version for changes v6: 037/020/15: JG
93 In Te Kuiti, sewer charges will be assessed as per the following considerations: Sewer charges will be further differentiated on the basis of residential and non-residential properties. For all residential properties, Council will assess a Targeted Fixed Rate per SUIP that is connected or has the ability to connect (within 30 meters of a Council main) to the Council sewerage network. For all non-residential properties, Council will assess a Targeted Fixed Rate per SUIP set on a differential basis based on the following Categories (differentiated by the use to which land is put): Category 1 - All Businesses Category 2 - Education & Community Childcare, Places of Worship, Marae, Clubs and Societies and Emergency Services. This category consists of organisations that are generally deemed not for profit. For avoidance of doubt, Category 2 only covers properties with uses listed within this category and no others. Category 3 - Government Department use, Rest Homes and Hospitals. All non-residential SUIPs will be charged one base charge for up to four pans and per pan (Pan Charge) for every pan over and above this threshold. The base charge and per pan charge is calculated as follows: Category Base Charge Pan Charge (per pan) Category 1 50% of Te Kuiti residential connected rate (for up to 4 pans) 70% of Te Kuiti residential connected rate (for 5 th pan and over) Category 2 50% of Te Kuiti residential connected rate (for up to 4 pans) 30% of Te Kuiti residential connected rate (for 5 10 pans) 20% of Te Kuiti residential connected rate (for over 10 pans) Category 3 100% of Te Kuiti residential connected rate (for up to 4 pans) 70% of Te Kuiti residential connected rate (for 5 th pan and over). Council has identified peri-urban beneficiaries to determine the catchment area for the Piopio wastewater system for the application of the targeted rates. The area of particular benefit is the Piopio Wider Benefit Rating Area (as identified under section 4.8) A Targeted Fixed Rate will be charged to all rating units with the PWBRA. * The amount paid by properties within the Piopio Wider Benefit Rating Area is determined annually on the following basis: Piopio properties connected to the Piopio sewerage system will pay a Targeted Fixed Rate. Any funding required over and above the amount raised by those properties within Piopio Township is then allocated to the Piopio Wider Benefit Rating Area as a Targeted Fixed Rate on a per rateable property basis Assistance for Smaller Communities Wastewater services are provided by Council in communities where environmental, public health/safety and/or economic outcomes require it as an imperative. Council recognises that there are smaller, comparatively under populated, communities in the Waitomo District that may require assistance in funding the sustainable operation of such a service. Council resolved that a contribution be made by all rating units in the District towards the funding of existing Wastewater services in smaller communities that are eligible so that appropriate and affordable services can be provided on a sustainable basis in response to community outcomes. Council notes that the social, economic and environmental benefits of smaller communities in the District having sustainable wastewater services accrue to the entire District and not just to those communities or the Rural Ward alone. Council will consider applying this Assistance for Smaller Communities policy to Revenue and Financing Policy - word version for changes v6: 037/020/15: JG
94 eligible rural communities when the cost per connection to an existing wastewater service exceeds a trigger level of a dollar value to be determined by Council from time to time. Council could increase this trigger level by a maximum of the Local Government Cost Index, through the annual rate setting process. In future, Council might consider capping the total level of assistance that will be provided to eligible communities, making allowance only for annual Consumer Price Index (CPI) or Local Government Cost Index (LGCI) adjustments. User Allocation: Council resolved user Fees and Charges to be the most efficient method for funding this allocation. Revenue is received from connection fees and Trade Waste charges Trade Waste Charges The Trade Waste Bylaw regulates the discharge of Trade Waste to a sewage system operated by Council and sets out the mechanism for implementing trade waste charges. Larger industrial meat processing industries (namely Te Kuiti Meats and Universal Beef Packers), who discharge trade waste into Council s sewerage system, play a major role in the local community. The very nature of their presence means that they contribute to economic and social well-being. They do that by virtue of the fact that they employ a large number of local people. There are a range of positive downstream impacts for the community as a result. There is an economic benefit in that the related employment results in economic activity with people living locally and investing in the local property market, sending their children to local schools and spending their earnings within the local economy. Social benefits also accrue with families becoming integrated within the local community, joining clubs and societies and reduced crime. Council will continue with the exacerbator pays principle for the large industrial meat processing companies as users of the Sewerage Network in Te Kuiti through the continued implementation of the Trade Waste Bylaw as it relates to Trade Waste Charges. However, Council will recognise the public good attached to the contribution these industries make to the Social and Economic Well-being of the District Wide Community. This public good component is considered to be enjoyed by all in the community. By having such a large combined demand for a labour force means that these industries attract people to our community for work and lifestyle reasons. Having these people living and working in the community provides economies of scale for infrastructure and services that are then enjoyed by all in the District. Further, these industries not only provide employment opportunities but also largely exist to add value to products produced by primary industry within the Waitomo District. Council has decided that the cost of receiving and treating Trade Waste via the Te Kuiti Sewerage Network will be funded 80% by way of Trade Waste Charges (Exacerbator Pays) and 20% by way of Targeted Fixed Rate (Public Good) on a per rating unit basis across every rateable property in the District. The continuation of the cap on Trade Waste Charges at 80% of full cost recovery is dependant on Te Kuiti Meats Limited and Universal Beef Packers providing a demonstrable commitment to an agreed level of on-site treatment of their Trade Waste prior to releasing it to the Te Kuiti Sewerage Reticulation Network. 8.0 ECONOMIC SUSTAINABILITY Environmental Sustainability area works to promote a growing and sustainable economy in the Waitomo District. The groups of activities contained within this group are: Water Supply Provision of Roads and Footpaths. 8.1 WATER SUPPLY Description The water supply activity provides for the environmentally safe collection, treatment and reticulation of Council s public water supplies. Water supply is essential to run households, maintain public health and sustain economic development. Council is committed to providing a water supply service that meets the diverse needs of the Waitomo District. Revenue and Financing Policy - word version for changes v6: 037/020/15: JG
95 8.1.2 Supply Areas Council provides water supply in the following communities: 1) Te Kuiti 2) Benneydale 3) Mokau 4) Piopio Community Outcomes The table below shows the Community Outcomes that this Activity contributes to: Vibrant Communities CO5 A place where we preserve the natural environment for future generations, ensuring that natural resources are used in a sustainable manner. Effective Leadership CO8 A place where the development of partnerships for the delivery of programmes and services is encouraged and pursued. Sustainable Infrastructure C010 A place that provides safe, reliable and well managed infrastructure which meets the District community needs and supports maintenance of public health, provision of good connectivity and development of the District Period of Benefit (Intergenerational Equity) Capital works that are an improvement or addition to the asset are considered intergenerational in nature. Costs and Benefits The merit of identifying and accounting for this Activity separately from other Activities enables: (a) (b) (c) (d) More transparent disclosure and accountability of projects and funding to the Waitomo Community. Greater opportunity for the Waitomo Community to have input on decisions, proposals, issues and other matters through consultation. Identification of how the Activity contributes to the achievement of COs and service delivery goals through detailed understanding and planning. Improved monitoring of the Activity in terms of how well Council is achieving its COs annually. (e) Identification of costs required to support the Activity in terms of time involved in planning, monitoring, accounting, reporting and administration. Activity Analysis and Funding Mechanisms Attributable Benefit Funding Revenue and Financing Policy - word version for changes v6: 037/020/15: JG
96 Benefit Group % of Benefit % Method Te Kuiti Community Benefit User/Applicant Benefit 75% 75% TFR 25% 25% Targeted Rate Water Consumption Attributable Benefit Funding Benefit Group % of Benefit % Method Mokau Community Benefit User/Applicant Benefit 75% 70% TFR 25% 30% Targeted Rate - Water Consumption Attributable Benefit Funding Benefit Group % of Benefit % Method Piopio Community Benefit 75% 85% TFR User/Applicant Benefit 25% 15% Targeted Rate - Water Consumption Attributable Benefit Funding Benefit Group % of Benefit % Method Benneydale Community Benefit 75% 55% TFR User/Applicant Benefit 25% 45% Targeted Rate Water Consumption Distribution of Benefits Community Benefit: Water treatment and supply contributes to providing a safe and healthy lifestyle and reduces the possibility of health problems resulting from contaminated water and inadequate supply. These benefits are attributable to the community (where the services are provided) as a whole. Provision of water supply ensures the maintenance of fire fighting capability, the benefits of which accrue to the entire community. All residents and properties in the area serviced by a particular water supply scheme can be identified as direct beneficiaries of the service Funding Revenue and Financing Policy - word version for changes v6: 037/020/15: JG
97 Community Allocation: Council resolved that a Targeted Fixed Rate differentiated by supply area and assessed on each separately used or inhabited part of a rating unit, would be the most efficient, effective and transparently lawful method for funding this allocation. Within a water supply area, the charge will be differentiated for properties that are connected or have the ability to connect (serviceable). Any rating unit will be considered to have the ability to connect (serviceable) if in the opinion of Council it is practicably serviceable and its boundary is situated within 100 metres of a water main, to which it is able to be connected but is not so connected. Any rating unit situated in Te Kuiti, Piopio, Benneydale or Mokau that has been fitted with a water meter and/or is defined as having an extraordinary supply (in accordance with Council s Water Services Bylaw) will be charged a fixed rate per cubic metre of water consumed over and above an annual consumption of 292m² per SUIP Assistance for Smaller Communities Water Supply services are provided by Council in communities where environmental, public health/safety and/or economic outcomes require it as an imperative. Council recognises that there are smaller, comparatively under populated, communities in the Waitomo District that may require assistance in funding the sustainable operation of such a service. Council resolved that a contribution be made by all rating units in the District towards the funding of existing Water Supply services in smaller communities that are eligible, so that appropriate and affordable services can be provided on a sustainable basis in response to community outcomes. Council notes that the social, economic and environmental benefits of smaller communities in the District having sustainable Water Supply services accrue to the entire District and not just to those communities or the rural ward alone. Council will consider applying this Assistance for Smaller Communities policy to eligible rural communities when the cost per connection to an existing water supply service exceeds a trigger level of a dollar value to be determined by Council from time to time. Council could increase this trigger level by a maximum of the Local Government Cost Index, through the annual rate setting process. In future, Council might consider capping the total level of assistance that will be provided to eligible communities, making allowance only for annual Consumer Price Index (CPI) or Local Government Cost Index (LGCI) adjustments. 8.2 PROVISION OF ROADS AND FOOTPATHS Description The Provision of Roads and Footpaths activity involves the maintenance and development of roads, kerbs and channels, bridges, street lighting, footpaths and street cleaning for all of the Waitomo District, with the exception of the State Highways, which are managed by New Zealand Transport Agency (NZTA). Council maintains its roads under contract to a standard that provides safe and comfortable driving within the limitations of available funding Functions The functions comprising this activity are: 1) Subsidised Roading 2) Unsubsidised Roading Community Outcomes The table below shows the Community Outcomes that this Activity contributes to: Vibrant Business CO7 A place where wealth and employment are created through local businesses and tourism opportunities and facilities are developed, facilitated and encouraged. Revenue and Financing Policy - word version for changes v6: 037/020/15: JG
98 Effective Leadership CO8 A place where the development of partnerships for the delivery of programmes and services is encouraged and pursued Sustainable Infrastructure CO10 A place that provides safe, reliable and well managed infrastructure which meets the District community needs and supports maintenance of public health, provision of good connectivity and development of the District Period Of Benefit (Intergenerational Equity) Capital works that are an improvement or addition to the asset are considered intergenerational in nature. Costs and Benefits The merit of identifying and accounting for functions under this Activity separately from other functions enables: (a) More transparent disclosure and accountability of projects and funding to the Waitomo Community. (b) Greater opportunity for the Waitomo Community to have input on decisions, proposals, issues and other matters through consultation. (c) Identification of how the Activity contributes to the achievement of COs and service delivery goals through detailed understanding and planning. (d) Improved monitoring of an Activity in terms of how well Council is achieving its COs annually. (e) Identification of costs required supporting the Activity in terms of time involved in planning, monitoring, accounting, reporting and administration. Activity Analysis and Funding Mechanisms Subsidised Roading New Zealand Transport Agency (NZTA), the national road funding authority, provides a subsidy for works that meet the criteria for subsidy. The Activities currently subsidised by NZTA are: 1) Sealed Pavement Maintenance 2) Unsealed Pavement Maintenance 3) Routine Drainage Maintenance 4) Structures Maintenance 5) Environmental Maintenance 6) Traffic Services Maintenance 7) Level Crossing Warning Devices 8) Emergency Reinstatement 9) Network and Asset Management 10) Professional Services. Attributable Benefit Funding Benefit Group % of Benefit % Method Revenue and Financing Policy - word version for changes v6: 037/020/15: JG
99 National Benefit 58% 30% Subsidy District Benefit 42% 67% Targeted Rate (rate per $100 of capital value) 1% UAGC 2% Petroleum Tax Rebates and Contributions 8.2.6a Distribution of Benefits National Benefit: The District s roading network is part of the national and regional transport network. Efficient and sustainable development of the network within the District contributes to the economic and social well-being of the entire nation as it is used by travellers, goods transporters and others who may or may not live in the District. Transport facilities are maintained and developed to provide safe and comfortable travel within and through the District. District Benefit: All residents and properties within the District can be identified as direct beneficiaries of the service as provision of roads enables access and transport to people and organisations within the District. The economic benefits of maintaining efficient transport facilities accrue to all residents of the District in one way or another b Funding National Allocation: The National benefit portion is funded through NZTA subsidy. The amount of subsidy is decided by NZTA and is based on assessing costs and benefits. District Allocation: Council resolved that a combination of a Targeted Rate (rate per $100 of capital value) assessed on all rating units, a UAGC, Petroleum Tax Rebates and contributions to works would be the most efficient and transparently lawful method of funding this allocation. Council resolved that funding a small portion of the allocation through UAGC would ensure equity in the funding sources by recognising the fact that the entire community has equal access to the roading network Unsubsidised Roading These are activities carried out to ensure the safe and efficient travel within and through the District and are necessary for road or pedestrian safety and convenience, but are not subsidised by NZTA and for which Council has sole financial responsibility. These include: 1) Footpath Maintenance 2) Footpath Renewals 3) Amenity Lights 4) Unsubsidised Miscellaneous work 5) Street Cleaning 6) Carpark maintenance (other than kerbside parking). Attributable Benefit Funding Benefit Group % of Benefit % Method District 100% 67% TFR (Te Kuiti Urban and Periphery Rating Area) 8% Targeted Fixed Rate (Rating Units in the District not in the Te Kuiti Revenue and Financing Policy - word version for changes v6: 037/020/15: JG
100 Urban and Periphery Rating Area) 25% Fees and Charges 8.2.7a Distribution of Benefits District Benefit: Maintenance of transport services to provide for pedestrian safety and convenience has a District wide benefit in that all residents use or visit the urban centres b Funding District Allocation: Council resolved that it would be most equitable to ring fence the costs of the activity as they fall in terms of Wards, and therefore a Targeted Fixed Rate differentiated by rating area set per SUIP would be the most efficient method of funding this allocation. Fees and charges include receipts from road closures, overweight permits, etc. together with a long standing contribution from McDonald s Lime towards maintenance of the District s roads based on annual production. Revenue and Financing Policy - word version for changes v6: 037/020/15: JG
101 Revenue and Financing Policy - word version for changes : 037/020/15: JG APPENDIX ONE: TE KUITI URBAN AND PERIPHERY RATING AREA
102 Revenue and Financing Policy - word version for changes : 037/020/15: JG APPENDIX TWO: PIOPIO WIDER BENEFIT AREA


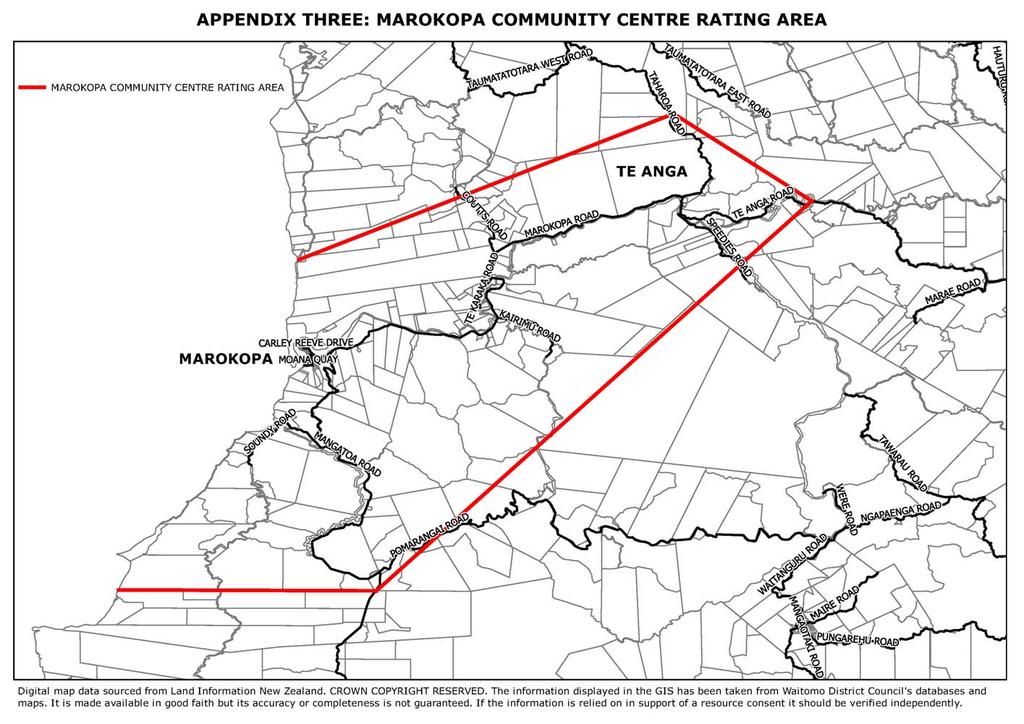
103 Revenue and Financing Policy - word version for changes : 037/020/15: JG APPENDIX THREE: MAROKOPA COMMUNITY CENTRE RATING AREA
104 Parks and Reserves Activity Management Plan
105 Prepared by: John De Luca, Group Manager - Community Services Waitomo District Council Desktop Review: Hollier Consultants Ltd 2008 Date of Review: August 2008 Adoption by Waitomo District Council: 24 March 2009 Review by Waitomo District Council February 2012 Waitomo District Council: 29 June 2012 Review by Waitomo District Council November 2014
106
107
108 TABLE OF CONTENTS EXECUTIVE SUMMARY: PARKS AND RESERVES...1 Purpose...1 Link to Community Outcomes...1 Rationale for Service Delivery...2 Strategic Goals...2 Effects of the Service...2 Levels of Service...2 Future Demand...7 Parks and Reserves Identified Risks...7 Existing Situation Described...8 Maintenance and Operations...8 Renewals...9 Current Asset Management Practice...9 Financial Summary Key Assumptions Specific Improvement Projects INTRODUCTION Waitomo District Council's Commitment to its Community Why WDC Provides the Service Rationale for Service Delivery The Role of WDC in the Provision of the Parks and Reserves Activity The Role of Other Parties Significant Effects of the Service About this AMP LEVELS OF SERVICE - WHAT OUR CUSTOMERS WANT AND HOW WELL WE ARE DOING TO ACHIEVE IT How Our Services Contribute to Community Outcomes Strategic Goals Legislative Framework Our Customers Other Stakeholders Service Delivery Options Considered Levels of Service Key Performance Indicators Trends Impacting on Level of Service (Possible Future Changes/Service Level Review) Key Programmes to Achieve Levels of Service GROWTH: PLANNING FOR THE FUTURE AND DEMAND FOR THE SERVICES Population Growth and Structure Demand Projections Ability of the Activity to Respond Demand Management Key Programmes to Meet Growth and Demand Confidence Levels and Assumptions Risk Management THE ASSETS WE USE Description of Asset Base How Assets Work Asset Condition/Remaining Life What the Assets are Worth Confidence in our Data HOW WE MANAGE THE SERVICE (LIFECYCLE MANAGEMENT) Operations and Maintenance Renewal Disposal and Rationalisation Assessments Undertaken (Cemeteries/Public Toilets) Managing Risk Critical Asset Identification WHAT IT COSTS AND HOW WE WILL PAY FOR IT (FINANCIAL SUMMARY) Summary of Financial Policies... 70
109 6.2 Capital Works Framework Development of Financial Contributions Financial Forecasts Confidence Levels and Key Assumptions OUR COMMITMENT TO EXCELLENCE (MANAGEMENT PRACTICE AND IMPROVEMENT PROGRAMME) Assessment of Current Practice Planned Improvements... 84
110 Executive Summary: Parks and Reserves This Activity Management Plan (AMP) for Parks and Reserves has been prepared by Waitomo District Council (WDC) staff. Asset data capture has been undertaken during 2008 and 2011 and the analysis of this information is an ongoing task. This AMP will provide the basis for the Parks and Reserves Activity in WDC s LTP following reviews and adoption of this AMP by Council in Vision WDC s vision for the Long Term Plan is: Creating a better future with vibrant communities and thriving business WDC s Community Service Group, is committed through the provision of adequate areas of open space, to ensure that opportunities for recreation and cultural activities are provided. The WDC presently maintains by various methods 65 reserves and 10 playground sites as part of its commitment in this area. Purpose WDC provides a number of parks, reserves and play areas. Grouped according to their primary purpose, these are: Active Reserves Provide areas for organised sport and other recreational activity for residents and visitors. Passive Reserves Provide open space to enhance the visual amenity and provide places for informal and more impromptu recreation activities. Esplanade Reserves Located along primary waterways and control or reduce risk from natural hazards, protect conservation values and promote or improve recreation opportunities, often shown as road reserve. Leased Reserves Provide a land bank for future recreation should the need arise. Play Equipment Located on active and passive reserves and provide opportunities for recreation and physical development of children. WDC provides Parks and Reserves in order to support the health and well-being of the community by supplying and maintaining areas for sport and recreation, as well as green places and landscapes that are restful and enhance the visual amenity. Link to Community Outcomes WDC s considers in its Long Term Plan that the Community Services Group contributes, through its Parks and Reserves function, to the following community outcomes: Primary Contribution Vibrant Communities CO2 A place where all age groups have the opportunity to enjoy social, cultural and sporting activities within our District Secondary Contributions Vibrant Communities CO1 A place where the multicultural values of all its people and, in particular, Maori heritage and culture is recognised and valued. CO3. A place where young people have access to education, training and work opportunities CO4. A place where young people feel valued and have opportunities for input into the decisions for the District CO5. A place where we preserve the natural environment for future generations, ensuring that natural resources are used in a sustainable manner. Effective Leadership CO8 A place where the development of partnerships of the delivery of programmes and services is encouraged and pursued Sustainable Infrastructure 1 Draft Parks and Reserves Activity Management Plan Doc
111 CO10. A place that provides safe, reliable and well managed infrastructure which meets the District Community needs and supports maintenance of public health, provision of good connectivity and development of the District Rationale for Service Delivery The Community Service Group, through its Parks and Reserves activity, provides areas to protect the health and well-being of the community by supplying and maintaining areas for sport and recreation, as well as green places and landscapes that are restful and enhance the visual amenity through the protection of our natural environment. Strategic Goals The strategic goals for the Parks and Reserves Activity are to: Strategic Goal 1: To ensure that WDC s parks and reserve facilities are maintained to an affordable high standard for the residents and visitors to the District. Strategic Goal 2: To provide community-agreed Levels of Service in the most cost effective way through the creation, operation, maintenance, renewal and disposal of assets to provide for existing and future users. Strategic Goal 3: To encourage community involvement in the future use of WDC s Parks and Reserves. The Parks and Reserves AMP has been developed to: a) Meet WDC s obligations under the Local Government Act 2002 and amendments. b) Provide the linkage between WDC s strategic goals for Parks and Reserves and the current Levels of Service. c) Provide a detailed description of Parks and Reserves assets that WDC owns and manages. d) Estimate the financial expenditure requirements for the next ten years including operation, maintenance, renewals and capital expenditure. e) Describe the current valuation of Parks and Reserves assets. f) Identify opportunities for improvement and subsequent implications of those improvements. g) Show how assets will be managed in order to achieve Levels of Service and meet demand for services. Effects of the Service The Parks and Reserves Activity has a number of effects on the Social, Environmental, Economic and Cultural well-beings of the community. Positively it: Negatively it: a) Allows for physical activity and development b) Assists with improving health from provision of open space c) Provides areas for community events d) Increases variety of activities e) Increases visitors due to District s attractions resulting in increased spending f) Protects natural areas/resources g) Increases aesthetic value h) Improves amenity values a) Increases demand on infrastructure with visitor numbers b) Increases demand on maintenance standards with visitor numbers. Levels of Service Levels of Service (LOS) are determined by WDC s understanding of customer needs as established through regular interaction with users. 2 Draft Parks and Reserves Activity Management Plan Doc
112 The Parks and Reserves Activity has set LoS with the aim to provide and maintain a network of Parks and Reserves throughout the District in a manner appropriate to the respective social, sporting or cultural needs and use. Some LoS, mainly those dealing with health and safety considerations, are driven by legislative requirements while others are based on the community s expectation of the services provided or WDC s corporate goals. 3 Draft Parks and Reserves Activity Management Plan Doc
113 Figure S.1: Levels of Service for Parks and Reserves Performance Measurement and Targets Key Service Criteria Link to Community Outcomes LOS Statement Type of Measure Measure Performance Measurement Procedure (Current) Satisfaction Quality Vibrant Communities High quality Parks and Reserves will be provided KPI Percentage of community satisfied with the quality of Parks and Reserves in annual and research surveys = > 80% (Actual 77%) = > 80% = > 80% = > 80% Annual Internal Resident survey results Responsiveness Vibrant Communities Public enquiries will be responded to in a timely manner AMP Performance Measure Number of service requests not actioned within three days = < 15 = < 15 = < 15 = < 15 Analysis of response records established through Request for Service records for numbers not resolved by three working days Health and Safety Vibrant Communities Play equipment and under surfacing will comply with NZSS 5828 (2004) AMP Performance Measure Percentage of play equipment compliant with NZSS % (actual) =>89% =>90% =>90% Independent annual audit of play equipment Quality Vibrant Communities Maintenance standards and specifications are complied with Management Tool Number of non compliance notices issued per contract = < 5 = < 5 = < 5 = < 5 Analysis of contract documentation for non performance notices per contract per year 4 Draft Parks and Reserves Activity Management Plan Doc
114 Technical Levels of Service for Parks and Reserves Performance Measurement and Targets Key Service Criteria Link to Community Outcomes LOS Statement Type of Measure Measure Performance Measurement Procedure (Current) Cost Sustainable Infrastructure Services for Parks and Reserves will be delivered within budget Management Tool Variation of actual expenditure against yearly budget Variance +or 5% Variance +or 5% Variance +or 5% Variance +or 5% Analysis of Budgets Legislative Requirements Vibrant Communities Sustainable Infrastructure Reserve Management Plans will be prepared and adopted in compliance with the Reserves Act requirements AMP Performance Measure Completion of identified Reserve Management Plans Reserve Management Plans in place for 11 Parks and Reserves throughout the District Completion of draft Passive Reserve Managemen t Plan completed by Audit of Management Plans Active RMP completed by Draft Parks and Reserves Activity Management Plan Doc
115 The above LOS are the key customer/community related Levels of Service. Additional technical LOS are included in the main body of the AMP. Figure S.2: Key Programmes to Maintain or Achieve Levels of Service Social Trend Project Play equipment replacement programme (based on independent audit) Key Service Criteria Health and Safety Satisfaction Quality Forecasted Total Cost $30, $30, Confidence Level in projections Estimated Timeline for Project Completion B Refer renewals table Other Proposed track maintenance contract $30, Satisfaction $175,000 (10yrs) $17,500 when full contract C On going operational budget In operations budget Key Programmes to Achieve Levels of Service Other investigatory/strategy type programmes have been identified that, while not impacting on LOS initially, the outcomes may. Where these items fit in the budget is yet to be confirmed at the time of writing this AMP. These are listed below: Figure S.3: Other Key Strategies to Maintain or Achieve Levels of Service Trend Project Key Service Criteria Social Leisure Strategy Satisfaction Responsiveness Forecasted Total Cost Confidence Level In projections Estimated Timeline for Project Completion $64,878 A Social Track Strategy Legislative Health and Safety Quality $31,335 over two financial years A Social Environment Passive Reserves Management Plan Satisfaction Responsiveness $53,650 Over two financial years A Social Environment Active Reserves Management Plan Satisfaction Responsiveness $65,000 C Social Open Space Strategy Satisfaction $65,000 C Social Environment Esplanade Reserve Strategy Satisfaction $69,885 Over two financial years C Social Environment Investigation / Redefinition of key Road Reserves to Esplanade Reserves scoping study Legislative $15,000 C Noted but outside planning period 6 Draft Parks and Reserves Activity Management Plan Doc
116 Other Programmes That May Effect Levels of Service Future Demand Waitomo District population is expected to remain static over the life of this AMP. The main factors influencing the future demand for Parks and Reserves are: a) An aging population will determine the type of leisure programmes being provided and also drive the demand to provide improved access to facilities, e.g. to accommodate mobility scooters. b) Similarly, a population in Waitomo of a high percentage of young children under the age of 15 years is driving a demand for playgrounds. c) Tourism growth has seen the development of higher standards of accommodation and a greater diversity of other leisure activities such as mountain biking, trekking. d) An escalating rate of obesity and type-2 diabetes due to inactivity and poor diet, have seen an increasing focus in strategies to improve health through physical activity. District Health Boards and Sport Waikato have developed and are implementing an Active Community Programme which is focussed on increasing physical activity levels. It is expected that this programme will increase utilisation of WDC s parks and other leisure facilities. e) The need to develop assets relevant to community needs. A trend away from structured recreation will possibly impact on the relevance of our current assets and drive the development of new ones. f) User pays as a means of funding and addressing equity issues. g) An increase in public awareness and expectations of higher standards. h) Pressure to maintain and enhance environmental values. i) The need to rationalise reserves assets in some areas of the District to keep pace with property development, especially in the areas of our foreshores and small communities. Through community involvement in policy and facility development, the development of effective partnerships with community groups, community education, and the possible introduction of user charges, the Parks and Reserves Activity will meet these future demand changes. Figure S.4: Capital Programmes to Meet Growth Trend Project Key Service Criteria Forecasted Total Cost Confidence Level In Projections Estimated Timeline for Project Completion Social Development of Coastal Reserves Quality Satisfaction $290,000 (10yrs) $29,000 annually A Set budget Annually Leisure Development of Brook Park Quality Satisfaction $160,000 $16,000 annually A Set budget Annually Other Footpath linkage to skatepark / overbridge Safety satisfaction $9,500 A Set budget Parks and Reserves Identified Risks High risks are shown in this abbreviated summary table. A full assessment is available and will be included in the appendix. 7 Draft Parks and Reserves Activity Management Plan Doc
117 Figure S.5: Parks and Reserves Identified Risks Asset affected Failure Mode Description Risk Rating Current Mitigation Managed Risk Rating Trees Tree branches or the whole tree falling Vandalism Lightening strikes Accidents Aged and mis-shapen trees High Tree condition and safety reports completed on a case by case basis Arboriculture works completed as required Moderate Playground Equipment Playground equipment asset deterioration Play equipment is no longer functional due to age, impact of vandalism Change in NZ Playground equipment standards High Monthly playground equipment safety audits Maintenance carried out as a consequence of these audits Moderate No critical assets have been identified in the Parks and Reserves AMP. Existing Situation Described The Parks and Reserves Activity covers the following assets: Figure S.6: Summary of Parks and Reserves Asset Type Quantity Area (Ha) Active Reserves Passive Reserves (4) Esplanade Reserves Leased Reserves Play Equipment 10 (1)(3) 45 components (1) Play areas (3) Includes two skate parks (4) Includes ha of DOC land administered by WDC of which 16.33ha is grazed by a local farmer Different types of reserves are provided and maintained on behalf of our community. Reserve types range from: The provision of sport fields for organised sporting activities (active reserves); The supply of open space to enhance the visual amenity of the locality and provide informal/impromptu recreational activities (passive reserves); The control of risk from natural hazards, protection of conservation values and the promotion of recreation opportunities along the District's principal waterways (esplanade reserves); Land banked reserves are leased (Leased Reserves); Many items of play equipment are located on reserves and because of the specialist nature of this equipment it is included separately. Currently, WDC provides 7.29 ha of active reserves, ha of passive reserves and 5.50 ha of esplanade reserves for every 1,000 people. This compares favourably with an average taken from Yardstick comparatives of hectares of reserve per 1,000 residents in Maintenance and Operations No extraordinary decreases/increase in maintenance costs are envisaged over the first three years of the life of this AMP WDC s policy regarding the management of Parks and Reserves is to encourage community involvement. Community-based administering groups have a direct role in the management of many of their respective Parks and Reserves. Their management responsibilities can include organising works and programmes in conjunction with WDC and its contractors, or alternatively carrying it out themselves. 8 Draft Parks and Reserves Activity Management Plan Doc
118 There is a risk to WDC that works undertaken may not be to the appropriate standards required for WDC s reserves Independent contractors are responsible for much of the maintenance and renewal of reserves assets with the exception being grass mowing and garden maintenance. Maintenance standards, set by WDC, apply to all asset components identified in contract specifications regardless of their location or profile. WDC s intention is to bringing some of these operations in-house due to difficulties in obtaining competitive tenders in small communities and to enable WDC to be more responsive to the community. Several specialist maintenance services will always be provided by external providers on a competitive basis: these include tree maintenance, weed control, yearly playground audit and turf maintenance procedures. In-house operations are already undertaken in some areas such as playground inspections, playground maintenance and minor park maintenance and have recently been extended into grass mowing and garden maintenance to provide competitive rates of operation and responsiveness to the community. The playground inspections are enhanced through an independent annual audit of play equipment against the standard requirements Regular inspections are completed to assess the condition of Parks and Reserves assets, identify future risks and maintenance needs or repair work that is required. The frequencies of inspections is based on the potential outcomes of any asset failure for Levels of Service, costs, environmental impacts or corporate image and are reviewed as part of this document. Renewals Inspections and asset gathering/condition grading has identified the following renewals works for inclusion in the AMP for park furniture, playgrounds, and an anticipated amount to allow for works identified in the assessment of water features undertaken in 2008 and amended Figure S.7: Renewal Programmes Project Key Service Criteria Forecasted Total Cost Confidence Level In Projections Estimated Timeline for Project Completion Park Renewals Quality $160,000 (10 yrs) C - D Annually Satisfaction $16,000 annually replaces bins/tables Playground Renewals Quality Satisfaction Legislative (Refer LoS) B Bridge/ Pontoon, Jetty renewals (DMC report) Quality Safety $325,000 (10yrs) $32,500per annum D Annually Groyne developed Marokopa Esplanade Safety Satisfaction Quality Community Cost D Community Cost Te Kuiti Skate Park Fencing Safety $20,000 B Te Kuiti Overbridge Renewals Safety $60, $80, Refer to Public amenities AMP C Current Asset Management Practice The following is a snapshot of the current status of asset management practices within the Parks and Reserves Activity area: Some operational processes are documented in service contracts which are occasionally audited Risk assessments have been undertaken but no forward plan developed 9 Draft Parks and Reserves Activity Management Plan Doc
119 Knowledge of assets is limited but improving daily Condition assessments are currently being worked through for parks assets Limited asset utilisation information Spreadsheets are used to store data with no link between expenditure and asset Request for service utilised for complaints and enquiries Financial Summary For the purpose of WDC s overall financial budgeting, investigatory and strategy type works have been included as operational expenditure. For some activities this treatment leads to minor variations between budgets contained in the Long Term Plan from that shown in the Activity Management Plan. All investigatory and strategy type works will lead to future development projects which will be depreciated. The following summary (S8) outlines the financial implications the Parks and Reserves Activity has on the overall Community Services portfolio. For this specific summary of the Parks and Reserves Activity Management Plan financials refer to (S9): 10 Draft Parks and Reserves Activity Management Plan Doc
120 Figure S.8: Overall Financial Summary for Community Services Community Services EAP 2014/ 15 LTP 2016 LTP 2017 LTP 2018 LTP 2019 LTP 2020 LTP 2021 LTP 2022 LTP 2023 LTP 2024 LTP 2025 Operating Income Parks and Reserves Housing and Other Property Recreation and Culture Public Amenities Total Operating Income Operating Expenditure Parks and Reserves Housing and Other Property 1,079 1,212 1,238 1,093 1,112 1,127 1,127 1,148 1,168 1,188 1,204 Recreation and Culture 1,058 1,115 1,125 1,123 1,139 1,135 1,128 1,174 1,215 1,258 1,303 Public Amenities ,018 1,043 1,073 Safety Total Operating Expenditure 3,728 3,964 3,981 3,940 4,053 4,141 4,210 4,359 4,443 4,522 4,649 Net Operating Cost/(Surplus) 2,924 3,480 3,529 3,452 3,550 3,625 3,678 3,810 3,877 3,937 4,043 Capital Expenditure Parks and Reserves Housing and Other Property Recreation and Culture Public Amenities Total Capital Expenditure 1,364 1, Net Expenditure 4,288 4,544 4,500 3,921 3,881 3,885 3,973 4,064 4,147 4,206 4,366 Funded By Internal Loans Reserves General Rates 1,541 1,435 1,455 1,415 1,423 1,459 1,556 1,610 1,697 1,719 1,741 UAGC 1,430 1,659 1,683 1,636 1,649 1,692 1,797 1,861 1,961 1,994 2,029 Target Rate - Marokopa Hall Target Services Rate - Rural Target Services Rate - Urban Total Funding 4,291 4,545 4,499 3,925 3,880 3,883 3,973 4,067 4,143 4,206 4, Draft Parks and Reserves Activity Management Plan Doc
121 Figure S.9: Parks and Reserves Financial Summary To be Inserted 12 Draft Parks and Reserves Activity Management Plan Doc
122 The valuation of WDC s Parks and Reserves assets is assessed at $7,524,466 based on the 2012 rating valuation. As the infrastructure is individually identified and valued, this overall valuation will become more accurate. Depreciation is currently based on the rating valuation and splits will be calculated on an individual asset basis as the valuation is improved. The development of Depreciated Replacement Cost (DRC) Valuation to component level is included as part of the key improvement program but is yet to be scheduled. Key Assumptions In preparing this AMP, some key assumptions have been made as detailed below: It is assumed that the population data from the current census is correct. The AMPs for WDC s Parks and Reserves assets, which form part of Community Services Activity Plan, will be progressively updated as more complete information becomes available over time. Best practice and current knowledge has been used in formulating information regarding the assets in this AMP. This information is not well supported by solid historical data. It is assumed that this information is correct. The annual cost of the contract maintenance of the network will not increase above CPI when it is re-tendered. The valuations using rating values is an accurate assessment of the true valuation of the Parks and Reserves Assets. That this AMP will be adopted by WDC used to guide the maintenance and development of the Parks and Reserves assets. Specific Improvement Projects The following are the priority improvements to this AMP for the planning period and is based on $7,600 being available annually to improved asset management functions and data Figure S.9: Specific Improvement Projects (year ending) SPECIFIC IMPROVEMENT PROJECTS PROJECT YEAR WDC STAFF RESOURCE EXTERNAL ESTIMATED COST Total $22,800 over 3 years Underground services investigations and roading data collection Include Building data in a designed asset management programme such as SPM or into WDC s GIS programme/ncs programme Review AMP 2017 Yes Yes $7, Yes Yes $7, Yes No In-house Purchase of data logger and development for in field inspection recording 2016 Yes Yes $7,600 Continual Review of Leases and Licences when necessary including building lease data base in NCS 2015 Yes No In-house 13 Draft Parks and Reserves Activity Management Plan Doc
123 Introduction 1.1 Waitomo District Council's Commitment to its Community WDC s new Vision for the Long Term Plan is: Creating a better future with vibrant communities and thriving business WDC s Community Service Group, is committed through the provision of adequate areas of open space, to ensure that opportunities for recreation and cultural activities are provided. The WDC presently maintains by various methods 65 reserves and 10 playground sites as part of its commitment in this area. 1.2 Why WDC Provides the Service Rationale for Service Delivery The Community Service Group, through its Parks and Reserves Activity, provides areas to protect the health and well-being of the community by supplying and maintaining areas for sport and recreation, as well as green places and landscapes that are restful and enhance the visual amenity through the protection of our natural environment. The provision of Parks and Reserves are grouped according to their primary purpose, these groups being: Active Reserves: these provide for organised sports and other recreational activity for residents and visitors. Passive Reserves: these provide open space and leisure areas that allow for informal and impromptu recreational activities as well as protection of natural landscapes. Esplanade Reserves: these are located along primary waterways and foreshores and reduce the risk of natural hazards, protect the existing landscape and conservation values and allow for future recreational opportunities. Often these reserves are shown as road reserve. Leased Reserves: these provide a land bank for future recreation should the need arise. Play Equipment: this is located on active, passive and esplanade reserves. Play equipment provides for recreational and physical development opportunities for children. 1.3 The Role of WDC in the Provision of the Parks and Reserves Activity Territorial Authorities have numerous responsibilities relating to the provision of Parks and Reserves. One such responsibility is the duty under the Reserves Act 1977 to control and manage reserves in accordance with the appropriate provisions of the Reserves Act so as to ensure the use, enjoyment, development, maintenance, protection and preservation of the reserve for the purpose for which it is classified. WDC s considers in its Long Term Plan that the Community Service Group contributes, through its Parks and Reserves activity, to the following community outcomes: Primary Contribution CO2 - Recreation and Social Amenities A place where all age groups have the opportunity to enjoy social, cultural and sporting activities within our District. The fabric of any community is not complete without the ability to enjoy personal and communal recreation and to pursue spiritual and cultural fulfillment. That ability to enjoy requires facilities for and access to sports, arts, hobbies, community services, spiritual services, and events of any nature, both personal and public. More than half of Waitomo's population lives in urban settlements. Towns, especially Te Kuiti and Waitomo are the image of the District despite the economy being mostly based on farming. It is the urban image and the commercial and social energy of the towns that will attract new business, new investment and new people. Personal and social health (well-being) is mostly dependent on matters such as socio-economic status, housing, good water and sanitary conditions, working environment, self-image, exercise, diet etc. Provision of Parks and Reserves along with playgrounds provides our population and visitors a healthy environment to live in as well as areas for relaxation and exercise through the provision of active and passive reserves and playgrounds 14 Draft Parks and Reserves Activity Management Plan Doc
124 Secondary Contributions Vibrant Communities C05 - A place where we preserve the natural environment for future generations, ensuring that natural resources are used in a sustainable manner. Effective Leadership C08 - A place where the development of partnerships for the delivery of programmes and services is encouraged and pursued. Waitomo's clean-green (Waitomo Green) conservational characteristics are one of the District's greatest assets. They are an integral part of living in Waitomo, a key attraction and a vital component of the way the District is seen, i.e. the external image. Through the Reserves Act 1977 and Resource Management Act 1991, WDC has the ability to create reserves for the protection of areas for generations to come. Sustainable Infrastructure C010 - A place that provides safe, reliable well managed infrastructure which meets the District community needs and supports maintenance of public health, provision of good connectivity and development of the District. A vibrant community needs parks and reserves to enable participation in sport, to enable the ability to enjoy the outdoors and to allow the community to thrive and be healthy. Well managed parks and reserves, maintained to a level to meet community needs and in a sustainable manner allow WDC to meet the needs of the community in a sustainable manner. 1.4 The Role of Other Parties There are several agencies that also provide Parks and Reserves. These are mainly minor providers or operate in different areas to those covered by the WDC under this activity with the exception of the Department of Conservation who provide a number of passive reserves in the Waitomo area. These agencies include: Department of Conservation with the provision of passive reserves and foreshore protection. Department of Conservation land will be included in the base information QE 11 Trust with the conservation of natural areas and passive reserves. Land is included in the base information Waikato Regional Council with the protection of foreshores and river margins The privately owned areas of open space/recreational areas that are available to the public include: a. Golf Courses: Waitomo Golf Course, Piopio/Aria Golf Course b. Privately owned sports grounds: Waitete Rugby Club grounds, Te Kuiti, and Waitomo Rugby Club Ground, Waitomo c. School grounds d. School play equipment e. Tennis/Netball Courts: Piopio f. Waitomo Caves complex There are WDC owned areas of open space (active reserves) that are administered/leased to sports clubs or community based administering groups such as: a. Tainui Wetere Domain, Mokau b. St Helens Domain, Aria 15 Draft Parks and Reserves Activity Management Plan Doc
125 c. Benneydale Domain, Benneydale d. Rukuhia Domain, Piopio e. Marokopa Reserve, Marokopa 1.5 Significant Effects of the Service Significant effects of the service: Figure 1.1: Significant Effects of the Service SOCIAL POSITIVE EFFECTS Allows for physical activity and development Assists with improving health from provision of open space Provides facilities for community connection with our youth NEGATIVE EFFECTS None identified CULTURAL POSITIVE EFFECTS Provides areas for community events Increased variety of activities Provides protection in some cases for culturally sensitive areas NEGATIVE EFFECTS None identified ECONOMIC POSITIVE EFFECTS NEGATIVE EFFECTS Increased visitors due District s attractions results in increased spending Increased visitors due District s ability to provide for regional and out of District sports events provision of tracks within the district enhancing the trend for outdoor recreation Visitors demand on increased standards of facility Increased subdivision activity leads to increased maintenance requirements through increased usage. Increased demand on other infrastructure (e.g. roads) and amenities (e.g. public toilets) ENVIRONMENTAL POSITIVE EFFECTS Protecting natural areas/resources Increased aesthetic value due to landscaping Preserving native flora and fauna Improved amenity values NEGATIVE EFFECTS None identified 1.6 About this AMP Document Structure This document follows the following structure to enable WDC to meet its legislative requirements by preparing Asset Management/Activity Management plans for each of its activities. The pattern being: What our customers want and how well we are doing to achieve it The assets we use (LoS Lifecycles) How we manage the service ( lifecycle management) Planning for the future demand for the service ( growth) What it costs and how we will pay for it (Financial Summary) 16 Draft Parks and Reserves Activity Management Plan Doc
126 Our commitment to excellence (Management practice & Improvement Program) Appendices Links to Other Plans Activity Management Plans (AMPs) are a key component of WDC s planning process that link to the following documents: Long Term Plan: Defines the strategic direction for the next 10 years. AMPs supplement the information in the LTP and confirm WDC s role in achieving Community Outcomes. Annual Plan: The works identified in the AMP provide the basis on which future annual plans are prepared and identify services to be provided in a particular financial year. Contracts: The Levels of Service, strategies and information requirements contained in AMPs are translated into contract specifications and reporting requirements. Bylaws, Standards and Policies: Bylaws are used as a tool for demand management, standards and policies are used to guide asset creation and subsequent management to support AM tactics. Reserve Management Plans: Policy document that detail objectives and policies for the management of reserves and identify future developments. See diagram below: Figure 1.2: Link to Other Plans Legislation Local Government Act 2010 Resource Management Act 1991 Building Act 2004 Reserves Act 1977 MSC Act 1992 Other Acts Government Initiatives Statutory Plans District Plan Reserve Management Plans Services Assessments Sanitary Services Assessments Long Term Plan Strategy Documents Leisure Strategy Track Strategy Open Space Strategy Esplanade Reserve Strategy Policy Statements Funding Development Contributions Significance Activity Management Plans Bylaws Annual Plan Annual Report Operations / Maint Plans and Contracts 17 Draft Parks and Reserves Activity Management Plan Doc
127 Levels of Service - What Our Customers Want and How Well We Are Doing To Achieve It 2.1 How Our Services Contribute to Community Outcomes - The Community Service Group, through its Parks and Reserves Activity, provides areas to protect the health and well-being of the community by supplying and maintaining areas for sport and recreation, as well as green places and landscapes that are restful and enhance the visual amenity through the protection of our natural environment. The Parks and Reserves Activity directly contributes to WDC s Community Outcomes by: Figure 2.1: Relevant Community Outcomes for Parks and Reserves Primary Outcome Activity Contributes to: CO2 - Vibrant Communities A place where all age groups have the opportunity to enjoy social, cultural and sporting activities within our District. How the Parks and Reserves Activity Can Contribute By providing each town and rural areas within our District with a multitude of reserves which provide opportunities/settings for physical activity such as venues for organized sport or walking tracks in passive reserves By ensuring that all significant developments or subdivisions require an approved landscape plan By providing each town and rural areas within our District with reserves which allow for the playing of both organized and informal recreation Outcome Effect Indicator Public Health Statistics will improve for the District All significant developments aesthetically landscaped The public will have access to good quality / quantity facilities with provision equaling or better than the Yardstick averages, i.e minimum 2.13ha active reserves /1,000 population, minimum 17.51ha passive reserves/1,000 population Secondary Outcome Activity Contributes to: CO1 Vibrant Communities A place where the multicultural values of all its people and, in particular, Maori heritage and culture is recognised and valued CO3 Vibrant Communities A place where young people have access to education, training and work opportunities How the Parks and Reserves Activity Can Contribute By actively taking historic areas as reserves during the subdivision process By actively allowing use of reserves for education relating to the environment Outcome Effect Indicator Significant historic areas become reserves under WDC when available through the subdivision process School groups have access to utilize the reserves for educational purposes and the playing of sport Employment of trained staff to maintain and develop the reserves 18 Draft Parks and Reserves Activity Management Plan Doc
128 CO4 Vibrant Communities A place where young people feel valued and have opportunities for input into the decisions for the District CO5 Vibrant Communities A place where we preserve the natural environment for future generations, ensuring that natural resources are used in a sustainable manner. CO10 Sustainable Infrastructure A place that provides safe, reliable and well managed infrastructure which meets the District community needs and supports maintenance of public health, provision of good connectivity and development of the District. By including the young people who utilize our reserves into the decision making process in relation to parks and reserves administration. By actively controlling noxious weeds and animal pests on Parks and preserving the environment for future generations. By actively taking esplanade reserves for the Category A rivers identified in the District Plan By utilising (where appropriate) native species in WDC s planting programmes By actively securing coastal margins as reserves through the District Plan subdivision process By providing areas within our parks for playgrounds and sports fields User groups established Incorporated Societies for administering key reserves (Brook Park) Mangaokewa Reserve Committee (Project Manu) Minimal complaints regarding weed and pest problems on WDC s Parks and Reserves All category A river esplanades are acquired by WDC through the subdivision process Native species utilised where appropriate Coastal margins secured as reserves when available through the subdivision process The public have access to safe and compliant playgrounds within our parks LoS for the sports grounds are adequate to allow the designated activity for that ground to be performed at the standard required 19 Draft Parks and Reserves Activity Management Plan Doc
129 In addition to these, WDC has indicated in this document support for initiatives to: Ensure that there is long-term planning in the provision of facilities to attract new residents Enhance and promote water quality in our waterways Improve opportunities for people to enjoy wetlands and rivers (e.g. walkways, viewing platforms etc) Create a plan that provides sports and recreation facilities including Parks and Reserves to meet the needs of the District for the next 20 years. Work with reserve user committees to enhance the opportunities to develop the reserves that are leased for active or leisure sports 2.2 Strategic Goals The strategic goals for the Parks and Reserves Activity are to: Strategic Goal 1: To ensure that WDC s parks and reserve facilities are maintained to an affordable high standard for the residents and visitors to the District. Strategic Goal 2: To provide community-agreed Levels of Service in the most cost effective way through the creation, operation, maintenance, renewal and disposal of assets to provide for existing and future users. Strategic Goal 3: To encourage community involvement in the future use of WDC s Parks and Reserves. 2.3 Legislative Framework The following legislation impacts on the management of Parks and Reserves (includes associated amendments): Local Government Act (2002) and Amendments This Act gives WDC power of general competence to undertaken any business or activity. Provided the activity is consistent with the object of the Act and the community has been consulted in a meaningful way, this can include the protection of reserves and the provision of recreation facilities. Resource Management Act (1991) and Amendments This Act requires WDC to manage the use, development and protection of natural and physical resources in a way, or at a rate, which enables people and communities to implement and review objectives, policies, and methods to achieve integrated management of the effect of the use, development, or protection of land and associated natural and physical resources of the district. Reserves Act (1977) The purpose of this Act is to provide the regulatory framework for the management of Parks and Reserves. It requires Waitomo to classify the different types of reserves and to specify their purpose. The Act also requires Waitomo to protect, to an extent compatible with the principal or primary purpose of each reserve, the scenic, historical, archaeological, biological, geological or other scientific features and indigenous flora and fauna and wildlife. In addition, the Act specifies the statutory procedures for managing each reserve as well as the preparation and development of management plans for each reserve subject to the Minister's approval. Biosecurity Act (1993) The purpose of this Act is to control the methods for exclusion, eradication and effective management of pests and unwanted organisms in New Zealand. Waitomo is responsible for overseeing and approving any major pest eradication programme in its District in accordance with its policies for this issue. Building Act (2004) and Amendments The purpose of this Act is to ensure that any building work undertaken within the area of a Local Authority complies with the building code. Waitomo currently administer the powers of this Act and its regulations to ensure that buildings in the District meet the code of compliance. 20 Draft Parks and Reserves Activity Management Plan Doc
130 Health and Safety in Employment Act (1992) and Amendments The purpose of this Act is to ensure that employers provide safe working conditions for their employees in the workplace. Waitomo has taken steps to ensure that its employees are provided with safe working conditions and that other persons are protected in workplaces. Other WDC Plans and Bylaws The Waitomo District Plan, Reserve Management Plans and Bylaws also impact on the management of Parks and Reserves. 2.4 Our Customers Who Our Customers Are In order to provide an efficient Level of Service the WDC needs to identify their potential customers / users of reserves. For Parks and Reserves, the customers include: Figure 2.2: Potential Customers External Customers Internal Customers Sports Clubs WDC staff and contractors Administering body of each sporting code Elected representatives Reserve administering bodies Team members Spectators Dog owners Walkers/Joggers Circus/Gypsy Fair Community Groups, i.e. craft markets Families Environmentalists General public Customer Expectations Waitomo has historically commissioned Versus Research Ltd (now internal survey sent to all ratepayers in the district) in order to identify how well Waitomo is performing in terms of its services offered to the community. This survey provides satisfaction information which enables comparisons within the activity over a period of time. Unfortunately changes occur in the survey over time, and the chronological order is incomplete. This survey utilises various telephone interviews or direct user interviews and the random telephone surveys are structured to be representative of the various wards in the District. Results showing the percentage of survey recipients who consider that their satisfaction is either good or excellent for the various activities from are shown below. Note figures have been adjusted to remove the don t know component. This measure is used as the KPI for the Parks and Reserves activity. Parks and Reserves The percentage of satisfaction is the combination of those surveyed who ranked the Parks and Reserves excellent and good. Figure 2.3 shows that the level of satisfaction with Parks and Reserves has improved to a constant satisfaction rating between 80-90% during the six years of the and LTP s with the exception being the 2014 year where a different methodology has been used to conduct the survey. The 2008 survey shows a significant increase in satisfaction levels and it is believed that this result has been influenced by the corresponding drop in people who answered the question don t know in 2008, 21 Draft Parks and Reserves Activity Management Plan Doc
131 going from over 30% to 3%. The 2008 survey also highlights an almost doubling of the average satisfaction level showing a commitment from don t knows to making a decision. Customer expectations may vary between the different communities, customers and stakeholders groups. Care will be taken to ensure the consultative process involves a fair cross-section of users. The 2014 survey enabled WDC to identify the key reasons for any dissatisfaction and these were in order of dissatisfaction stray cat colony ( being addressed by SPCA), insufficient rubbish receptacles ( on going replacement programme), need for playground upgrades (refer to renewals programme), additional seating / signage (on going replacement programme) Figure 2.3: Percentage Satisfied Users/Visitors with the District s Parks and Reserves Percentage (%) l Year Note change in methodology for the survey in 2014 to more clarify / identify issues. Other Activities Information regarding satisfaction of specific reserves is available from WDC s one off participation in the 2008 /2009 Parkcheck survey. Parkcheck is based around the establishment of a series of core questions where the questions are designed to identify the importance of specific park services and amenities then measures the degree of satisfaction for these services and amenities of the park in question. WDC undertook such a user survey for Brook Park, Mangaokewa Reserve, Centennial Park, Redwood Park and Te Kuiti Domain Figure 2.4: Parkcheck Satisfaction Percentage by Park Type Percentage (%) l Total Sports Park Neighbourhood Park Destination Park Year 22 Draft Parks and Reserves Activity Management Plan Doc
132 This chart reconfirms the overall satisfaction figures as obtained from the Versus Research Ltd satisfaction survey. Although at the time Waitomo s parks fell below the averages for all participants in Parkcheck, as shown by the table following. Figure 2.5: Comparative Parkcheck Satisfaction Percentage Authority Percentage (%) l Average Waitomo Thames DC MPDC Wanganui DC Taupo DC Year Part of the Parkcheck survey looks at the difference between the importance people and users put on the facilities within the park and the satisfaction with the facilities, to give a gap analysis. In each of the ten categories for Destination Parks, Neighbourhood Parks and Sports Grounds the satisfaction relating to an item fell below the importance put on that item by users of the reserve. The key gap areas where importance and satisfaction had the greatest gap were signage, security, park furniture, playgrounds and shade provision. Historically, WDC has used a removal policy rather than a renewal / replacement policy which has resulted in many areas being depleted of seats, signs, bins, tables, bbq s and modern play equipment etc. This trend has been reversed through the utilization of the parks renewals money for minor park items and the playground upgrades that have been undertaken which should show when the Parkcheck study is undertaken again. Considerable work has been undertaken in WDC s key reserves and it is important for WDC to undertake another Parkcheck survey to gauge progress and effects of these improvements. This is yet to be scheduled. 2.5 Other Stakeholders In order to provide efficient Levels of Service, WDC also needs to identify its potential associated external stakeholders. For Parks and Reserves assets, the stakeholders include: Figure 2.6: Potential Stakeholders External ACTIVE RESERVES PASSIVE/ESPLANADE RESERVES LEASED RESERVES DOC Sports Ground Management Committees Sports Groups buildings on reserves Other Community Groups Scouts, Guides etc. Neighbours Lessees Schools Conservation Groups Youth Groups Service Clubs DOC Lessees Neighbours / adjacent landowners Campers Mangaokewa Committee Brook Park Inc Society Schools Lessees Neighbours Utility/service providers pump stations 23 Draft Parks and Reserves Activity Management Plan Doc
133 2.6 Service Delivery Options Considered Levels of Service in the Activity Management Plan are determined by WDC s understanding of customer needs as determined through regular interaction with facility users and historical provision. The 2008/09 Parkcheck Survey identified two main issues relating to satisfaction and service provision The overall satisfaction rating is below that of the other participants who undertook the survey by at least 5%, noting that WDC s Versus survey suggests that this gap has closed The satisfaction of all categories fell below the importance people placed on that category, suggesting that improvements need to be made to the levels of service provision within each category. A second survey will confirm whether WDC has improved this result since the 2008/09 survey As yet, the WDC has not carried out any formal consultation with customers on Levels of Service options. This is partly offset by monitoring public enquiries/complaints relating to the standards in the maintenance contract as well as following up on the comments related to the satisfaction survey Kara Park Piopio 24 Draft Parks and Reserves Activity Management Plan Doc
134 2.7 Levels of Service Key Criteria Indicators The Parks and Reserves activity strategic goals are to: a. To ensure that WDC s Parks and Reserves facilities are maintained to an affordable high standard for the residents and visitors to the District. b. To provide community-agreed Levels of Service in the most cost effective way through the creation, operation, maintenance, renewal and disposal of assets to provide for existing and future users. c. To encourage community involvement in the future use of WDC s Parks and Reserves. It is to be noted that indicators shown below as AMP performance measure or Management Tools are for internal management use only. They are not designed to be reported publicly as part of the performance of the Community Service Group. They are not designed to be audited to any of the standards and requirements which pertain to performance measures which are used to report to WDC and the community. WDC considers that these indicators are valuable for internal management purposes, but for various reasons they are not suitable for reporting at WDC nor community level. Reasons for this may include concerns (sometimes marginal) around: Relevance Realism / ability of WDC to control performance Verifiability Neutrality Robustness Perverse incentives or Metadata issues, including Collection methods Monitoring frequency Data storage Quality assurance systems Intended use. These internal management indicators are reviewed, and appropriate remedial action is undertaken, on an ongoing basis. 25 Draft Parks and Reserves Activity Management Plan Doc
135 Strategic Goal 1: To ensure that WDC s Parks and Reserve facilities are maintained to an affordable high standard for the residents and visitors to the District. Figure2.7: Levels of Service for Parks and Reserves Key Service Criteria Link to Community Outcomes LOS Statement Type of Measure Measure Performance Measurement and Targets Performance Measurement Procedure Satisfaction Quality Responsiveness Health and Safety Quality Vibrant Communities Vibrant Communities Vibrant Communities Vibrant Communities High quality Parks and Reserves will be provided Public enquiries will be responded to in a timely manner Play equipment and under surfacing will comply with NZSS 5828 (2004) Maintenance standards and specifications are complied with KPI AMP Performance Measure AMP Performance Measure Management Tool Percentage of community satisfied with the quality of Parks and Reserves in annual and research surveys Note : new survey methodology since 2013 Number of service requests not actioned within three days Percentage of play equipment compliant with NZSS5828 Number of non compliance notices issued per contract = > 80% (actual 77%) = > 80% = > 80% = > 80% Annual Internal Research survey results = < 15 = < 15 = < 15 = < 15 Analysis of response records established through Request for Service records for numbers not resolved by three working days 88% =>85% =>87% =>89% Independent annual audit of play equipment = < 5 = < 5 = < 5 = < 5 Analysis of contract documentation for non performance notices per contract per year 26 Draft Parks and Reserves Activity Management Plan Doc
136 Strategic Goal 2: To provide community-agreed Levels of Service in the most cost effective way through the creation, operation, maintenance, renewal and disposal of assets to provide for existing and future users. Figure2.8: Technical Levels of Service for Parks and Reserves Key Service Criteria Link to Community Outcomes LOS Statement Type of Measure Measure Performance Measurement and Targets Performance Measurement Procedure Cost Recreation and Social Amenities Services for Parks and Reserves will be delivered within budget Management Tool Variation of actual expenditure against yearly budget Variance +or 5% Variance +or 5% Variance +or 5% Variance +or 5% Analysis of Budgets Strategic Goal 3: To encourage community involvement in the future use of WDC s Parks and Reserves. Figure 2.9: Technical Levels of Service for Parks and Reserves Key Service Criteria Link to Community Outcomes LOS Statement Type of Measure Measure Performance Measurement and Targets Performance Measurement Procedure Legislative Requirements Preserving the Environment Cultural Heritage Youth Recreation and Social Amenities Reserve Management Plans will be prepared and adopted in compliance with the Reserves Act requirements AMP Performance Measure Completion of identified Reserve Management Plans. Reserve Management Plans in place for 11 Parks and Reserves throughout the District Initiate draft Passive Reserve Mgt Plan by Initiate Track Strategy by Completion of draft Passive Reserve Mgt Plan completed by Completion Track Strategy by Audit of Management Plans 27 Draft Parks and Reserves Activity Management Plan Doc
137 2.8 Key Performance Indicators In order to gauge how well we are achieving our Levels of Service and Key Service Criteria Indicators, Waitomo s Community Services staff supervise the day to day administration of all works and contracts. Confirmation of achievement is signalled through the Parks and Reserves KPI. Presently inspections tend to be on an informal basis, although new contracts will allow for programmed monthly inspections. WDC will analyse results from these monthly inspections to ascertain percentages over a 12 month period which can then be compared on an annual basis. The Level of Service Indicators/Key Performance Indicators directly relate to meeting the target Levels of Service as measured using the Performance Measures identified. The achievement of the Target Levels of Service is linked to the successful completion of the programmes and projects identified in 2.11 below. 2.9 Trends Impacting on Level of Service (Possible Future Changes/Service Level Review) Environmental Possible future growth in subdivision activity and farming activity leads to removal of more mature trees from the landscape to allow for increased development, providing sterile subdivision developments and farmland. This has a detrimental impact on the satisfaction of the Waitomo Community and visitors to our region through the degradation of the aesthetics of the District and will impact on the call to protect aesthetic and historical areas. In recent times subdivision has been a minimal influence but could in the future be a major trend impacting on coastal regions Economic Increases in the amount of tree work being requested as the public become aware of their value and WDC s responsibility, creating pressures on budgets and staff ability to manage the activity within the costs allocated. Requests are initiated by the public as well as other utility providers. Rural communities unable to sustain recreational facilities, reducing the ability of WDC s provision of services to all of Waitomo s Community. Rural community withdrawal from the administration of rural active reserves would create expectations that WDC will step in to provide the service, but within the existing budget structure. Many of the administration groups have facilities that the community could expect WDC to take over, creating a burden on WDC s ability to maintain its assets. This trend was highlighted by the notification that the Piopio Domain Board wished to disband and WDC successfully establishing a new group (2012/2013) Social Rising rates of Obesity and Diabetes due to inactivity and poor diet have seen an increased focus on improving health through physical activity. It is expected that this increased focus will increase utilisation of WDC parks and other leisure facilities which could impact on WDC s provision and availability of reserves. There is a trend away from more structured recreation and towards more informal or impromptu types of recreation, such as rock climbing, increasing the utilisation of more isolated reserves and the corresponding demands for maintenance and corresponding links to cost. Degradation of the aesthetics of isolated reserves can happen without WDC being aware of the activity Cultural Higher than average Maori population, 35.5%, in the community could lead to demand for a different mix of activities than those currently provided and may reflect in some of the dissatisfaction with WDC s reserves Other The introduction of NZS HB: 8630:2004 Track and Outdoor Visitor Structures has required an assessment of our track network scheduled for the 2015/16 and 2016/17 years. Public awareness of these gradings will increase customer expectations for the gradings to be met. While meeting grading requirements will impact on cost, customer satisfaction should be enhanced Confidence Levels and Assumptions for Stated Trends Refer to Section 6.5 for grading definitions. 28 Draft Parks and Reserves Activity Management Plan Doc
138 Figure 2.10: Data Confidence Levels Trend National Demographic trends sourced from National Institute of Demographic and Economic Analysis (Waikato University) Maintenance and renewal workload trends sourced from WDC and contractors records Confidence Level A D 2.10 Key Programmes to Achieve Levels of Service WDC will need to implement a number of projects to maintain or achieve the target Levels of Service and maintain / enhance the satisfaction results. These range from facilities/equipment works to process improvement projects and therefore cross over to other AMPs in the Community Service Group. The projects are split into two categories: 1. Key Programmes to achieve Levels of Service, and 2. Key Strategies impacting on Future Levels of Service. The table below summarises these projects, their forecasted total cost to WDC and an assessment of the confidence in the projections Key Programmes to Maintain or Achieve Levels of Service Figure 2.11: Key Programmes to Maintain or Achieve Levels of Service Trend Social Other Project Play equipment replacement programme (based on independent audit) Proposed track maintenance contract Key Service Criteria Health and Safety Satisfaction Quality Satisfaction Forecasted Total Cost $30, $30, $30, $175,000 (10yrs) $17,500 when full contract Confidence Level in projections Estimated Timeline for Project Completion B Refer renewals table C On going operational budget In operations budget Play Equipment Replacement Programme Over the past six years WDC has improved its compliance for playground equipment from a low 37% in 2008 to 88% in This is a direct result of renewals and maintenance programme of works undertaken during this period Many Council s get compliance within this range but to achieve higher percentages, often a rigorous replacement programme to introduce modern equipment is required. To achieve compliance above 90% must be balanced with the priorities placed on funding for other projects, although WDC have confirmed an ongoing replacement programme for the next three years. WDC s independent auditor has supplied costs to undertake replacements to equipment that is believed to be beyond its economic life and priority 1 and 2 are included in the programme. 29 Draft Parks and Reserves Activity Management Plan Doc
139 Proposed Track Maintenance Contract Walking has become a significant activity for all residents of New Zealand as well as tourists visiting our region, and track provision is actively promoted by Central Government. The Government recognises the importance of providing a consistent, well managed network of tracks through all districts. Currently the track maintenance is undertaken in an adhoc manner by WDCs in house services team but with a WDC s track strategy being developed in 2015/2017 years, a more defined contract can be created. Once the strategy is completed it will identify two outcomes: Necessary work to meet the Department of Conservation standards for tracks. Track upgrades identified in the strategy will be included in the next review of this plan and the 2018 LTP development. Ongoing routine maintenance requirements. The track maintenance contract will concentrate on ongoing routine maintenance Key Strategies Impacting on Future Levels of Service Figure 2.12: Key Strategies to Maintain or Achieve Levels of Service Trend Project Key Service Criteria Social Leisure Strategy Satisfaction Responsiveness Forecasted Total Cost Confidence Level In projections Estimated Timeline for Project Completion $63,045 A Social Track Strategy Legislative Health and Safety Quality $31,335 over two financial years A Social Environment Passive Reserves Management Plan Satisfaction Responsiveness $53,650 Over two financial years A Social Environment Active Reserves Management Plan Satisfaction Responsiveness $65,000 C Social Open Space Strategy Satisfaction $65,000 C Social Environment Esplanade Reserve Strategy Satisfaction $69,885 Over two financial years C Social Environment Investigation / Redefinition of key Road Reserves to Esplanade Reserves scoping study Legislative $15,000 C Noted but outside planning period Description of Key Programmes Several projects have been identified as being essential over the life of this plan to enable WDC to maintain and or enhance the Level of Service expected by the community and to improve satisfaction to those levels experienced by other WDC s partaking in the Parkcheck Survey. A brief description of these is below. Leisure Strategy WDC needs to develop a strategy for recreation and leisure activities within the District. This will assess whether or not the assets we currently have are adequate or not, what types of leisure activities the community undertakes at present and what they would like to be able to do in the future. This strategy will provide us with direction with regards to the trend away from formal or structured recreation and will 30 Draft Parks and Reserves Activity Management Plan Doc
140 identify any new land opportunities or surplus land that may be disposed of to enable development of other areas. Track Strategy WDC needs to measure and assess the tracks (including structures) we currently maintain. Once we know what we have and what condition it is in then we can develop a strategy for how best we are to develop and maintain these tracks though a contractual basis, based on the NZS HB 8630:2004 Track and Outdoor Visitor Structures. Passive Reserves Management Plan WDC needs to develop an omnibus management plan for all passive reserves. This is a requirement under the Reserves Act Community consultation and feedback will provide the WDC with what activities and facilities the community want on their passive reserves. Some existing reserves currently have outdated management plans which will need to be incorporated in the Omnibus Passive Reserves Plan. Because of its special significance, WDC has prepared an individual Reserve Management Plan for Brook Park in Te Kuiti. Reserve Management Plans identify future development requirements, of which funding will form an integral part of any future Contributions Policy under the Resource Management Act when developed by WDC. Active Reserves Management Plan WDC needs to develop an Omnibus management plan for all active reserves. This is a requirement under the Reserves Act Community consultation and feedback will provide the WDC with what activities and facilities the community want on their active reserves. This will be a natural progression from the Leisure Strategy. Some existing reserves currently have outdated management plans will be incorporated in the Omnibus Active Reserves Plan. Reserve Management Plans identify future development requirements, of which funding will form an integral part of a Contributions Policy under the Resource Management Act if and when developed by WDC. Open Space Strategy An Open Space Strategy, distinct from the Leisure Strategy, determines the standards for the provision of different types of open space, though consultation with the community. This will assist WDC in determining community needs; especially passive reserves in the future and will influence the Surplus Property Review. Esplanade Reserve Strategy The Esplanade Reserve Strategy will identify key areas of land WDC should be looking to acquire as it becomes available, along with development philosophies to enable long term use of these reserves for walkways and conservation. This will identify future land requirements and development requirements; funding for these will form an integral part of a WDC Contributions Policy under the Resource Management Act. Scoping Study -Investigation/Redefinition of Key Road Reserves to Esplanade Reserves It is believed, but unconfirmed, there are many esplanade areas that are being treated as reserves that are actually road reserve, e.g. the large esplanade reserves through the Te Kuiti Township. A scoping study is required to identify these key areas with recommendations as to whether some or all would best be suited as Esplanade Reserves held by WDC. For the purposes of this AMP known areas are included in the Esplanade section. 31 Draft Parks and Reserves Activity Management Plan Doc
141 Growth: Planning for the Future and Demand for the Services The key issues potentially impacting on demand forecasts for Parks & Reserves are: a. An aging population and a higher proportion of under 15 year olds in the population b. The need to develop assets relevant to community needs c. User pays as a means of funding and addressing equity issues d. the low socio-economic demographics for our region e. Pressure to maintain and enhance environmental values f. An increase in public awareness and expectations of higher standards g. An increase in diversity of recreational opportunities h. Apparent stabilisation / minor decrease in District population i. Governmental emphasis on fitness 3.1 Population Growth and Structure The following information has been sourced from a paper prepared by the National Institute of Demographic and Economic Analysis (Waikato University) for the Waikato Regional Council in August Council has chosen to use these population forecasts for the LTP as Statistics New Zealand Forecasts for the planning period are not available until The graph below presents the 2013-base medium population projection for Waitomo District to 2063, along with historical population estimates from Statistics New Zealand back to The 2006-base Statistics New Zealand (SNZ) high, medium and low projections (October 2012 update) are also included for comparison. The NIDEA projections show a continuing trend of declining population for Waitomo District with a projected population of 8,743 in These projections follow the recent trend in the District s population reasonably closely, with annualised population decline over the period of 0.5% per year (base year projection is different to actual). Figure 3.1: Baseline Medium Population Projections for Waitomo District and Comparison with Statistics NZ (2012) Subnational Projections 32 Draft Parks and Reserves Activity Management Plan Doc
142 Current Pattern of Building and Subdivisional Development As in the previous section the population growth for the District is projected to be static and/or in decline. Historic trends of pockets of sub divisional and building activity in the form of modest lifestyle development around Te Kuiti, Waitomo Village, Mokau, and Awakino are also slowing. The sub divisional activity that was occurring in and around the Te Waitere area has slowed in recent years. Over the last five years there has been an average of 12 new dwellings constructed per year. In terms of subdivisions the average number of lots created over the same period has been 3. Whilst 151 new lots were consented over the last five years only 63 new dwellings were actually consented. While this is partly due to the delay between subdivision approval and building construction, there is also a backlog of undeveloped lots in the District which need to be factored into planning considerations. Future Subdivisional Activity From a recent, informal, desktop planning exercise, drawing from development proposals which are known to officers and/or are in the early stages of consent processing, it has been identified that further growth is unlikely to place pressure on the provision of Council services. Indications are the recent trends of relatively slow development are likely to continue in to the foreseeable future. The demographic and development trends show that there is no demand for growth related infrastructure at the present time or in the foreseeable future. For the past few years Council has been working on improving the condition of its core infrastructure assets, particularly in the Water Supply and Sewerage activity areas, in order to support public health outcomes and to meet its Resource consent and other legislative requirements. The growth and development trends support an approach which continues to upgrade and maintain existing assets as opposed to the development of new capacity driven infrastructure. There is currently enough capacity in the infrastructure network to allow for minimal growth should it occur. Council does not anticipate any significant land-use changes during the period of this LTP. Potential Societal Change Factors The age structure of the Waitomo District is among the more youthful in the Waikato Region (fourthyoungest in 2013) and experiences the least degree of population ageing. In 2013, 14.2 percent of the population is aged 65 years and over, and this is projected to increase to 19.4 percent by The proportion of the population under 65 years of age is relatively high at 85.8 percent in 2013, 82.8 percent in 2033 and 68.7 by The ratio of elderly persons to children increases slightly from 0.61 in 2013 to 0.98 in 2033, before increasing markedly to 2.71 in Figure 3.2: Age-Sex structure for Waitomo District, 2013 and 2013 (medium projection) 33 Draft Parks and Reserves Activity Management Plan Doc
143 The District s population characteristics, which include a high proportion of Maori, can be expected to translate into demand for compatible services, e.g. community infrastructure in the form of increased recreational and cultural facilities. Council considers these changes have been adequately catered for in its LTP. Any departure from this assumption can be addressed during the 3-yearly review of the Plan. 3.2 Demand Projections Economic Trends Some of the economic trends expected to impact on the long-term provision of recreational services include the increase in part-time employment. People in this group will have the time but limited means to access recreational facilities and services. the provision of private leisure services. These will provide for a group of people who are willing and able to pay for private leisure services The likely impact of these trends will see WDC respond by providing cost relevant leisure facilities and services to the community in order to ensure the entire public have access to services that enable them to enjoy the benefits of leisure participation. In addition, WDC may be seen as competitors in the leisure market for the leisure consumer if areas of provision are expanded into new areas, a matter which private leisure service providers may be concerned about. WDC s role as a leisure provider is to provide services and facilities to improve the community s well-being Social Trends Social trends expected to impact on the long-term provision of recreational services include: an increasing public awareness of environmental issues. More people want access to leisure activities that allow them the opportunity to participate in, preserve and appreciate the environment in which they live. the preservation of open space. Currently communities want open space areas left for the enjoyment of impromptu leisure activity. changing lifestyles, some people work longer hours and want access to invigorating leisure activity, whereas some people do not work and want access to affordable and convenient leisure services. The likely impact of these trends will see WDC respond to their social responsibility by ensuring that all members of the community have access to alternative type leisure facilities and services, such as ecotourism and intellectually challenging leisure activity to suit their particular needs. Coupled with this response is the need to protect our natural environment and heritage from depletion Leisure Trends Some of the leisure trends expected to impact on the long-term provision of recreational services include: a shift from traditional sports to an increased range of alternative sports, and a shift from team sports to individual participation sports. In general, sports like rugby, netball, rugby league and soccer in the older age group are experiencing a decline in participation rates (this is not so for younger participants in many cases), whereas sports like indoor / outdoor rock climbing, athletics, biking, mountain biking, tramping, walking are experiencing an increase in participation rates. the reluctance of people to participate in physical contact sports who are now choosing passive sports the growth in sports tourism which has an emphasis on entertainment and risk Anecdotal evidence tends to suggests that organised children and junior sports are experiencing a revival. This, however, does not seem to flow on to the senior grades The likely impact of these trends will see WDC respond by providing facilities and services that enable people to participate in individual sports and open space for passive sports. 34 Draft Parks and Reserves Activity Management Plan Doc
144 3.2.4 Age Structure An aging population will influence the type of leisure programmes being provided. Increasing demand for youth activities with a higher than average youth population, 26.1% under the age of 15, (based on 2006 census) will impact on type of provision, especially play grounds and equipment Tourism A draft Tourism Feasibility Study of the King Country Region was prepared by Stafford & Associates Pty Ltd for Maraeroa C Incorporation. This study concluded that forecast visitor numbers to the region will increase between 139,000 and 153,000 in the 2006 and In percentage terms this is an increase of between 22% and 25% although the global economic downturn will have had an effect on these projections, but it is believed the projected increases will occur over the coming years Implication of Trends Leisure services need to be more relevant to the recreational needs of various groups in the community including the elderly, unemployed, women, low wage income earners and ethnic groups. The possible increase in conflict between different park users needs to be addressed due to the diversity of leisure preferences for: Informal recreation Different sporting codes wishing to use the same land Active and passive recreation users of Park land Environmental protection and activities which damage the environment Recognition of the decline in formal sports club activities An increase in the range of active and passive recreational activities conducted in the natural environment Communities want more input into the development of plans for leisure facilities and activities Increasing public expectations for leisure facilities and services Recreation facilities and services that are accessible to the entire community 3.3 Ability of the Activity to Respond An expected impact identified is an increase in the demand for alternative, as opposed to traditional, Parks and Reserves facilities and assets, especially in the eco-tourism area e.g. rock climbing. To manage this demand WDC will provide a more diverse range of facilities taking into consideration social, environmental and economic trends in order to meet the changing needs of the community as determined though the consultation process involved in the reserve planning process. However, the expected stabilisation in the District population, in conjunction with the impact of social and economic trends, could possibly lead to less demand on current Parks and Reserves assets. 3.4 Demand Management The objective of demand management is to modify customer demands for services in order to maximise utilisation of existing assets. This can be achieved by focusing planning on maximising benefits to customers rather than on maximising the outputs from assets. The following strategies enable this objective to be met: a) Involving the community in policy (reserve management planning) and facility development, and where practical, devolving accountability for operating recreation services back to the community through user committees b) Developing effective partnerships with community groups such as schools and the private sector organisations for the provision of recreation services. c) Recovering costs by charging users, taking into account their ability to pay and noting the socioeconomic status of the district, assessing public and private benefit, as well as WDC s objectives for community participation in leisure. An ongoing review of all leases is required to achieve this. d) Encouraging participation in a range of recreational experiences by actively promoting opportunities for all levels of age and ability. e) Regulating the use of reserves to ensure the community has access to quality facilities by adopting and enforcing the appropriate Bylaws and policies developed during the Reserves Management Planning process. 35 Draft Parks and Reserves Activity Management Plan Doc
145 3.5 Key Programmes to Meet Growth and Demand Strategy WDC has a landbank facility available in the form of leased reserves and undeveloped or partially developed active reserves which can be used to meet future growth in the Parks and Reserves activity should this arise. Where land is required in a location where there is no land an existing leased reserve in another area could be sold to fund the acquisition / development by strategically reviewing WDC s property holdings (Leisure Strategy). WDC s proposed Open Space Strategy will identify where these needs are likely to be focussed in the future Tactics To practise good demand management in order to maximise utilisation of existing assets and therefore minimise operational / development costs so as to meet the different types of growth Costs Capital expenditure is generally Level of Service related rather than growth related due to the static / slowly declining population and the only minor influence from other potential growth related factors. WDC proposes to fund growth related capital expenditure primarily by internal loans. Completion of WDC s various strategies and AMPs will assist in identifying future capital expenditure models and when these strategies and plans are complete, the outcomes will be included in this AMP. Figure 3.5: Capital Programmes to Meet Growth Trend Project Key Service Criteria Forecasted Total Cost Confidence Level In Projections Estimated Timeline for Project Completion Social Development of Coastal Reserves Quality Satisfaction $290,000 (10yrs) $29,000 annually A Set budget Annually Leisure Development of Brook Park Quality Satisfaction $160,000 $16,000 Annually A Set budget Annually Other Footpath linkage to skatepark / overbridge Safety Satisfaction $9,500 A Set budget Development of Coastal Reserves Over the first seven years of the planning period of this Activity Plan, the most likely reserve areas which will be affected by increased use by our community and visitors will be our coastal and esplanade strips. The most likely subdivision areas will also be adjacent to these areas. These areas are fragile environments and WDC needs to provide for works such as steps, planting, seating, retaining, and track development to protect its existing assets and areas where development pressures exist. No assessment has been undertaken within this area, but it is considered essential that a nominal sum is budgeted within this area each year with a review at the time of the development of the 2015 LTP. The development of the esplanade strategy in year and of this plan will assist in clarifying the issues and provide WDC with direction. Development of Brook Park Brook Park is one of the most significant reserves within WDC s land holdings. Effectively it is a farm park for our community and visitors alike, providing for informal passive leisure as well as protection of the community s heritage. Council adopted a management plan for this reserve in Draft Parks and Reserves Activity Management Plan Doc
146 The management plan provides for the administration and development of the reserve through the establishment of a Friends of Brook Park group. The establishment of this group will have its inaugural meeting in March 2012 A key role of the group would be to identify projects from the management plan and develop them over time, raising funds where necessary. An allowance of $30,000 has been included in years 2017, 2019, 2021, 2023 and 2025 for use a seed funding for projects undertaken. The allowance that was included in the 2010 budget was used to undertake emergency fencing and clearing on the reserve. Footpath linkage to Skatepark / Over Bridge The skate park adjacent to the railway corridor is an integral part of the play structures available to our community. Historically this structure has been under utilized because of the secluded nature of its location. The youth of Te Kuiti sought to improve the facility and applied for external funding to improve visibility, provide addition concrete surfacing and a drinking fountain and the opening up of the area to improve visibility As part of this on going improvement a path is proposed from the State highway crossing point to the skate park and the adjacent over bridge, thus encouraging the safety of users of the facility and over bridge. 3.6 Confidence Levels and Assumptions The population trends born out of the statistical analysis of the 2014 Waikato University Study are, inherently, inexact results and approximations. They rely on the robustness of the original collection methodology and base data, as well as that of the statistical manipulation. This analysis assumes that the base information is accurate. The two programmes under the banner of Growth Programmes are set amounts and therefore expenditure is limited to that amount. The data used in this section has been graded B as per the Confidence Grading scale explained in 6.5 below. 3.7 Risk Management Risk management is all about limiting the consequences of failure in our assets and limiting the likelihood of this failure. See Section 5.5 Risk is also about WDC s ability to meet future demand and changes. WDC has undeveloped reserve land to meet any provision, needs in the future as well as a planning policy in place to protect and acquire future esplanade reserves. The area of possible concern is the effects of future subdivision of the coastal land increasing the usage of the fragile coastal reserves. There is also an increasing usage of our coastal reserves by holiday makers. An esplanade strategy has been included in the forward work programme along with development money to improve our coastal reserves. 37 Draft Parks and Reserves Activity Management Plan Doc
147 The Assets We Use 4.1 Description of Asset Base Figure 4.1 identifies the scope of assets covered by the Parks and Reserves Activity within the Waitomo District. Figure 4.1: Summary of Parks and Reserves Asset Type Quantity Area (Ha) Active Reserves Passive Reserves Esplanade Reserves Leased Reserves *** Play Equipment components ** * * One area included (Waitomo/Marokopa Rest Area) in this total is considered as miscellaneous due the activity, i.e. rest areas etc. This is road reserve rather than recreational reserve ** Based on independent Audit grouping of components *** Bulk of leased reserve land part of active reserves Active Reserves The purpose of Active Reserves is to provide sports fields for organised sporting activities and other recreational activities for residents and visitors in the District. Active Reserves must possess at least one sports field. In addition, asset components such as park furniture and fittings, horticultural amenities, services and structures are located on Active Reserves to enhance the reserve user s experience. The following Figure 4.2 identifies the total number and area of Active Reserves located in the District. Figure 4.2: District Active Reserves Ward Number Active Hectares Ratio Equivalent of Ha Reserves per 1,000 Residents (1) Te Kuiti Township Piopio Township Waitomo Township (2) Balance of Rural Ward TOTAL (1) Based on population of individual areas, total based on District population (2) Active reserve privately owned by local Iwi A more detailed breakdown of assets found in Active Reserves is found in the base information for this Activity Plan. It is to be noted that much of the Active Reserve land in the rural areas is leased but included in the Active Reserves as there is at least one sports field. See figure 4.3 below. 38 Draft Parks and Reserves Activity Management Plan Doc
148 Figure 4.3: Active Reserves Area/Leased Area Identified Ward Active Area Estimated Leased Area Te Kuiti Township Piopio Township Waitomo Township 0 0 Balance of Rural Ward TOTAL Within the Active Reserves individual assets exist. Note that only those amenity assets maintained by WDC are included in these figures. A summary of these assets is included below which is based on the information gathered for the 2009 and 2012 reviews of this Activity Plan. A comprehensive review of the collection and storage of this data is underway and as the information comes to hand the tables below will be progressively updated. A detailed list along with condition grading of the historic data is included in the base information for this Activity Plan. Figure 4.4: Active Reserve Assets Description Ha. Km No Horticultural Amenities - Grassed Areas (maintained by WDC) Now includes Marokopa Infrastructure Services - Wall Car parks Dressage Area Edging Judder Bars 3 - Kerb and Channel Concrete Pads Hard surface paths/playing areas Road Surfaces sumps 2 - Camping power points 2 Taps 1 Furniture & Fittings - Bins 10 - Seats 21 - Signs 2 - Tables 10 - Lights 6 - Artificial surface Draft Parks and Reserves Activity Management Plan Doc


149 Structures - Miscellaneous Structures 8 - Fencing/Barriers Bollards/Posts Barriers Cattle Stops 4 - Fencing/handrails Gates 13 - Vehicular bridges Passive Reserves The purpose of Passive Reserves is to provide open space to enhance the visual amenity of the locality, establish conservation area, protection of historic areas and provide for informal and impromptu recreational activities. Passive Reserves are located in areas that enable convenient access for nearby residents. Assets such as park furniture and fittings, horticultural amenities and, services and structures along with in many cases play equipment are located on Passive Reserves to enhance the reserve user s experience. Figure 4.5 identifies the total number and area of Passive Reserves located in the District. Figure 4.5: District Passive Reserves Ward Number Passive Hectares Ratio Equivalent of Ha per 1000 Residents (2) Te Kuiti Township Piopio Township Waitomo Township Balance of Rural Ward (1) TOTAL (1) Includes Mangaokewa DOC land administered by WDC. (2) Based on population of individual areas, total based on District population Passive Reserves in Te Kuiti are predominately made up of Brook Park, with an area of approximately 59ha, directly on the north edge of the township. Within the balance area Mangaokewa Reserve, east of the township, has a large area of Department of Conservation land adjacent to it, making a total area of approximately 179 ha. Within the Passive Reserves individual assets exist. Note that only those amenity assets maintained by WDC are included in these figures. A summary of these assets is included below except for play equipment which is included in the separate category. A detailed list along with condition grading is included in the base information for this Activity Plan.. M a M Mangaokewa Reserve Bridge 40 Draft Parks and Reserves Activity Management Plan Doc
150 Figure 4.6: Passive Reserve Major Assets Description Ha Km No Horticultural Amenities - Grassed area Amenity gardens Infrastructure Services - Car parks Edging Judder Bars 33 - Kerb & Channel Concrete pads Pathways Culvert Playing surfaces road Sumps 8 - Taps 1 -Water tanks 3 Furniture & Fittings - BBQs 11 - Bins 21 - Handrails 2 - Information kiosks 4 - Lights 15 - Seats 22 - Signs 18 - Tables 38 Structures - Bollards miscellaneous Barriers Bridges pedestrian 5 - Cattle stops 2 - Fences Fountains 2 - Gates 14 - Monuments/Plaques 6 - Pergola structures 4 - Pond Shelters 2 - Stiles 4 - Retaining walls Draft Parks and Reserves Activity Management Plan Doc
151 4.1.3 Esplanade Reserves The purpose of Esplanade Reserves is to control or reduce the risk from natural hazards, protect conservation values and promote and improve recreation opportunities to or along the District's principal waterways and coastland. Waitomo acquires esplanade reserve land following the subdivision of land adjacent to the District s principal waterways. Landowners are required under the District Plan to provide a strip of land 20 metres wide along the bank of the waterway. Under certain circumstances the width of the reserve may be reduced. Alternatively, more land may be required where the area possesses significant conservation or natural heritage values that need protection or the topography requires it to be more effective. Figure 4.7 identifies the total number and size of Esplanade Reserves located in the District. Figure 4.7: District Esplanade Reserves Ward Number Hectares Ratio Equivalent of Ha per 1000 Residents Te Kuiti Township Piopio Township Waitomo Township Balance of Rural Ward TOTAL Historically, the method of protection of marginal strips and esplanade areas was to create them as road reserve at the time of subdivision and are therefore road. Areas within this category that are developed. e.g. the river banks through Te Kuiti, have been counted as esplanade reserves. WDC in the future needs to establish the extent of road that is actually esplanade reserve. Should WDC in the future decide to close these areas of road, they automatically revert upon closure to Local Purpose Reserve (Esplanade). A fund is needed to allow for these purchases to be made of strategic esplanade reserves. Once strategic areas are identified WDC could implement a contributions policy under the Resource Management Act 1991 to provide funding for these purchases. Within the Esplanade Reserves individual assets exist. Note that only those amenity assets maintained by WDC are included in these figures. A summary of these assets is included below. A detailed list along with condition grading is included in the base information for this Activity Plan. Figure 4.8: Esplanade Reserve Assets Description Ha Km No Horticultural Amenities - Grassed areas Amenity garden areas Infrastructure Services - Car parks Edging Concrete pads Paths Roading Sumps 2 42 Draft Parks and Reserves Activity Management Plan Doc
152 Description Ha Km No Furniture & Fittings - Flagpole 1 - BBQs 3 - Bins 11 - Seats 9 - Signs 16 - Tables 8 Structures - Fencing Bridges pedestrian 3 - Erosion structures Jetties/Pontoons/Wharves 3 - Boat ramps Bollards 27 - Walls Handrails Monuments/Plaques 7 - Compost bin 1 - Pergolas 9 The most dominant individual features that exist on Esplanade Reserve are bridges, jetties and water structures. These are identified individually from WDCs 2008 assessment (updated 2011) as they are generally the most valuable asset and are shown below: Figure 4.9: Esplanade Reserve Bridges, Jetties and Water Structure Assets Esplanade Reserve Bridges, Jetties and Water Structure Assets Location Asset Type Comment Condition Comment 2011 Te Kuiti Esplanade Pedestrian Bridge Adjacent to Bowling Club Embankment erosion, corrosion of structure Te Kuiti Esplanade Pedestrian Bridge Adjacent to Campground Embankment erosion, corrosion of structure Handrails / guardrails replaced 2011 Mangaokewa Reserve Suspension Bridge Located at top of track Minor Mangaokewa Reserve Suspension Bridge Located at car park Abutment erosion Rebuilt 2009 Mangaokewa Footbridge 1 500m from start Minor 43 Draft Parks and Reserves Activity Management Plan Doc
153 Esplanade Reserve Bridges, Jetties and Water Structure Assets Location Asset Type Comment Condition 2011 Comment Mangaokewa Reserve Mangaokewa Reserve Mangaokewa Reserve Mangaokewa Reserve Mangaokewa Reserve Footbridge m from start Minor Footbridge m from start Minor Footbridge m from start Abutment erosion Footbridge m from start Minor Footbridge m from start Handrail replacement Benneydale Playground Footbridge Providing access to playground Issues with width and decking quality to be replaced Kiwi Place Benneydale Footbridge Access from SH 30 Severe corrosion of main steel Te Kauri Road, Mokau Jetty Minor Te Kauri Road, Mokau Boat Ramp Repairs to cracking SH 3 Mokau Boat Ramp Repairs to cracking Te Waitere Road Jetty Rebuilt by WDC 2010/2011 Grade 1 Built 2010/2011 Finish repairs to pile corrosion Te Waitere Road Boat Ramp Protect erosion points Te Maika Jetty Emergency repairs undertaken in 2009/2010 replacement platform Corrosion repairs, oiling and cracked platform 2013 replacement steps Leased Reserves One of the primary purposes of Leased Reserves is to provide a landbank for future recreation purposes should the need arise. If a need is demonstrated in a location where there is no land available for recreation purposes a Leased Reserve in another area could be sold to fund the acquisition. These reserves are generally leased for grazing purposes only and, should they be required for recreation, reserves improvements will be necessary to provide a suitable facility. There are 4 Leased Reserves scattered throughout the District. Figure 4.9 identifies the total number and area of Leased Reserves and where they are located. Almost all the area of leased reserve land is associated with active reserves and is shown in that table. 44 Draft Parks and Reserves Activity Management Plan Doc
154 Figure 4.10: District Leased Reserves Ward Number Hectares Ratio Equivalent of Ha per 1000 Residents Te Kuiti Township Piopio Township Waitomo Township Balance of Rural Ward TOTAL Within the Leased Reserves individual assets exist, primarily related to fencing. This asset has not been measured as the responsibility for ongoing maintenance lies with the leaseholder. A detailed list of reserves is included in the base information for this Activity Plan Play Equipment The purpose of Playground Equipment is to provide opportunities for recreation and physical development for children in the District. To enhance these opportunities Waitomo has embarked on a renewal and maintenance programme to bring equipment up to the levels required to meet New Zealand Safety Standards NZS 5828 for playgrounds/equipment and undersurfacing. This work to date has been based on an independent yearly audit, the first of which was completed in All Play Equipment is located on designated play areas situated on active, passive and esplanade reserves to enable all children access to Play Equipment throughout the District with the exception of road reserve in Waitomo village. The following figure shows the level of compliance of WDCs play equipment and undersurfacing with the New Zealand standards Figure 4.11: Playground Compliance % Compliance Percentage Compliance 2007/ / / / / / /14 Year WDC recognised in the 2007/2008 financial year that it had allowed its playground equipment to progressively reach a state of disrepair. A renewals and realistic maintenance budget were implemented at that time which has seen WDCs compliance to New Zealand Safety Standards NZS 5828 for playgrounds/equipment and under surfacing rise from 37% to 88% as recorded by independent audit.. The level of compliance rated highly in comparison to other areas throughout New Zealand No Council s audited by WDC s independent auditor have reached 100% compliance, with most sitting around 75-85%. On a day to day basis the compliance figure can change depending on breakages, vandalism, poor maintenance etc. For WDC to move above its figure of 88% will require renewed emphasis on renewals of equipment which has reached the end of its economic life especially those with renewals priority 1 and 2. WDC s independent auditor has provided budgeted costs for this work and these renewals are included in the first two years of the activity plan. Figure 4.12 identifies the number of play areas located in the District and the number of Play Equipment components located in the various towns/rural areas. Note that modular equipment is counted as one piece. 45 Draft Parks and Reserves Activity Management Plan Doc
155 Figure 4.12: District Play Equipment (Audit Schedule) Ward Play Areas Components (No.) Te Kuiti Township 4 (1) 29 Piopio Township 2 (2) 4 Waitomo Township 1 5 Balance of Rural Ward 3 8 TOTAL (1) Includes Skate Park and fitness trail (2) Includes Skate Park A summary of these assets which make up the playgrounds is included below. A detailed list along with condition grading is included in the base information for this Activity Plan. Currently 88 % of the equipment and surfacing is compliant with the standards independent audit. While the equipment is safe and useable, sometimes it does not comply because it never complied i.e. the equipment or undersurfacing would have to be replaced to become compliant. The audit recommendation is that unless the item has a capital renewal priority of 1 or 2 then it is not essential to replace it. Only those items carrying a capital renewal priority of 1 or 2 have been included in the playground renewal list to maintain satisfaction. Figure 4.13: Play Equipment Assets Description Ha Km No Furniture & Fittings - Modular systems 8 - Undersurfacing Edging Seesaws 4 - Skateparks 2 - Slides 1 - Spinnners 4 - Swings 7 - fitness Trail items 6 - Turnstyle 1 - Wooden forts 1 - Climber 1 These figures exclude playground equipment associated with the aquatic facility which is included in Recreation and Culture AMP. WDC considers that all of the Play Equipment is critical as it is extensively used and should it fall into further disrepair a serious accident could occur. 46 Draft Parks and Reserves Activity Management Plan Doc
156 4.1.6 Other Assets Within the Parks and Reserves Activity there are specialist asset areas, such as the formal Japanese Garden and the Conifer collections, equestrian Ring, motorcross facility. Figure 4.14: Significant One-Off Assets Miscellaneous Assets Number Japanese Garden Rora Street (Railway land) 1 Conifer collections Brook Park and Redwood Park 2 Equestrian Ring Piopio Domain 1 Motorcross Facility St Helens Domain How Assets Work Performance Active Reserves Provision The current provision of Active Reserves throughout the District is expected to meet the recreation needs of organised sporting activities. This takes into consideration the relative stabilisation or minor decrease of the population as shown in the 2014 Waikato University Population forecasts used in this Activity Plan. These reserves are located in the major towns as well as various rural communities and cater for a number of different sporting groups. In light of a projected relative stabilisation or minor decrease of the population and considering leisure trends that indicate a decrease in team sports participation, it may be necessary in the future to consider the rationalisation of certain active reserves. This would be done to ensure appropriate facilities and services are provided District-wide to meet current and future demands and expectations of customers. The Leisure Strategy would address these types of issues. Furthermore, some issues need to be addressed in order to satisfy user expectations. For example, in some cases there sometimes is conflict between users wanting to use a particular playing field/surface. The Leisure Strategy will review the user/field requirements. Another issue is the maintenance and operation of buildings such as changing rooms, toilet blocks and clubrooms located on some reserves that have been provided by their respective users instead of Council. WDC has no control over the maintenance of these club assets and should the club fold, WDC may become the principal owner responsible for the asset. Refer to Figure 4.15 for buildings on Active Reserves that have been provided by users. The long term outcomes of the various lease agreements relating to these buildings is provided where the information is available. Rukuhia Domain in Piopio is an active reserve catering for various horse clubs, rugby and other miscellaneous uses. The Domain Board has disbanded and a Governance Board utilising the rugby clubrooms as a joint clubroom facility for all users (established February 2012). 47 Draft Parks and Reserves Activity Management Plan Doc
157 Figure 4.15: Building Ownership and Lease Effects Reserve Building type Owner Outcome if abandoned by Club Centennial Park Band Hall BMX Container / Shed TK & District Highland Band Te Kuiti BMX Club Reverts to WDC Restored to flat grassed area if requested by WDC Hot Rod Clubrooms Te Kuiti Hot Rod Club Unknown Soccer Clubrooms King Country Junior Football Unknown Squash Clubrooms Te Kuiti Squash Club Unknown Netball Clubrooms Maniapoto Netball Association Unknown Pistol Shooting Clubrooms Waitomo Small Arms Society Unknown Croquet Clubrooms Te Kuiti Croquet Club Unknown Rukuhia Domain Clubhouse Change Rooms Piopio Rugby Club Piopio Rugby Club Reverts to WDC Reverts to WDC Mapiu Reserve Clubhouse / Pavilion Mapiu Domain Board Reverts to WDC Marokopa Recreation Reserve St Helens Domain Benneydale Domain Clubhouse Marokopa Social Club Reverts to WDC Squash Club pavilion Aria Squash Club Reverts to WDC Clubhouse Bush United Rugby Club Removed by Club Tainui Wetere Domain Clubhouse Tainui Rugby Club Reverts to WDC no records Ward Street Reserve Toilets/ Change Kindergarten Tainui Wetere Domain Board King Country Playcentre Association Reverts to WDC no records Removed by Owner Te Kuiti Airport (refer Recreation & culture Activity Plan) Various sheds Super Air Wanganui Aero Works Unknown Unknown Towns and the rural areas are well catered for in terms of Active Reserves for organised sporting activity. Provision is not expected to be a major issue. The status quo will remain with some residents having to travel a short distance into towns to participate in their chosen organised sporting activity. The management of Active Reserves located in rural settlements will remain with the user committees but as they are considered an important asset, that arrangement may need to be managed to ensure the entire local community benefits from access. WDC needs to become involved by committee representation to ensure that facilities remain available to the public. This is also an issue for private active reserve provision where the provider struggles financially to maintain the facility such as the rugby grounds in Te Kuiti and Waitomo. 48 Draft Parks and Reserves Activity Management Plan Doc
158 With all sporting organisations there are less people volunteering for administration and maintenance of the rural reserves and in the future WDC may need to revise its lack of involvement in these reserves. WDC currently provides approx 4.83 hectares of developed active reserves per 1,000 people, and in total 7.49 hectares, throughout the District. When this figure is included as part of the total usable open space available for leisure and recreation activity, which includes passive and Esplanade Reserves, the combined amount totals approx hectares per 1,000 people. These provision figures compare with ha as an average from Yardstick information. An Open Space Strategy would review provision and distribution of all types of reserve. It is to be noted though, that Active Reserves effectively are a District facility rather than a town facility. Note -Two large active sports areas in Te Kuiti (Waitete Rugby Club) and Waitomo (Waitomo Rugby Club) are privately owned. A request to assist with maintenance of the Waitomo ground has been made to WDC although this to date has not been followed through but this may be a trend in the future as discussed above. Quality The use of sports fields during periods of prolonged wet weather is an issue that needs to be addressed as it can detrimentally affect the quality of these assets for some time. In particular the booking of reserves for one off events, such as circuses can be troublesome. This also prevents other users from utilising these assets and the costs of repairs are expensive and time consuming. WDC has recently had its major sports fields inspected by the New Zealand Turf Institute on a twice yearly basis for advice on improving the playing surface of the fields. The extremely poor drainage of Centennial park and Te Kuiti Domain has been highlighted in these reports and remedial works for Centennial Park was been completed in Safety Some maintenance contracts include a requirement for regular inspections to ensure that assets are maintained in a safe condition however these are undertaken on a casual basis. As contracts are rewritten detailed inspection/reporting sections will be included. Contract response times ensure that defects are rectified promptly by either disabling the asset to prevent use or its repair. Analysis of response times from WDC s request for service programme can be undertaken from the closing times of requests to ensure the response times are consistently achieved. Some assets such as footpaths, access roads and car parks located on active reserves are showing wear and tear with the emergence of potholes and cracking. There has been minor historic funding for the maintenance of these assets with the exception of some maintenance under the roading contract which has now been extremely limited. In 2012 LTP a line item within the budgets was included to ensure a budget was made available for this maintenance item. This has been continued through the 2015 LTP Provision in the 10 year financial forecasts allows for footpaths, car parks and road maintenance in order to reduce the possibility of accidents. A full asset condition grading, ageing and renewals assessments is required for these assets. Passive Reserves Provision This AMP assumes all towns and rural communities in the District have an adequate number and area of Passive Reserves to meet community needs, and the provision figure of 38.12ha per 1000 residents (includes Esplanades) compare well with the average of from historic Yardstick analysis. Note provision includes all of Mangaokewa Reserve. However, there may well be an increased demand for more facilities to be located upon existing reserves or there may need to be an increase in the size of certain reserves in the future to meet local needs and provide for the changes from team sport orientation to individual recreation. No information is available as to whether rural settlements in the District have adequate passive reserves. In many cases these needs are met by School grounds, large sections and Department of Conservation/QE II land. 49 Draft Parks and Reserves Activity Management Plan Doc


159 B Brook Park Te Kuiti However, this issue still needs to be addressed as to whether these alternatives are satisfying local needs for casual individual recreation. Consideration will be given to developing an Open Space Strategy that determines standards for the provision of different types of open space. This will involve research and community consultation to identify how much reserve land will be needed for different leisure and recreation purposes and identify areas with surplus passive reserves and those with a deficiency. Proceeds from the sale of surplus land can then be used to rectify deficiencies. Because of the size of the Waitomo District, such an Open Space Strategy could be included within the proposed Leisure Strategy although shown separately in the budgets. Waitomo currently provides hectares of passive reserves per 1,000 people throughout the District. When this figure is included as part of the total usable open space available for leisure and recreation activity there is a total of hectares per 1,000 people. Figure 4.6 above identifies the number of passive reserves located in the major towns and rural area within the District and the population that they serve. Safety As with the Active Reserves, assets such as footpaths, access roads and car parks located on passive reserves are showing wear and tear with the emergence of potholes and cracking. Provision in the 20 year financial forecasts allows for footpaths, car parks and road maintenance in order to reduce the possibility of accidents. A full asset condition grading, ageing and renewals assessments is required for these assets. Esplanade Reserves Provision Mangaokewa Reserve Te Kuiti Esplanade Reserves need development to enhance the future reserve user s experience, control activities detrimental to the environment and to protect sensitive conservation areas. A primary objective is to increase the value of Esplanade Reserves by extending and developing these areas to provide an extensive walkway system along coast lines and rivers in the District. The development of an extensive walkway system for Esplanade Reserves will involve the development and implementation of an Esplanade Reserves Strategy. A strategy would include recommendations on location, plantings, and construction of walking tracks, fences, stiles and signs to enhance reserve usage. With the increase in tourism within the District, demand for outdoor experiences will increase. Walkways can provide for these experiences. The Te Araroa Trust has constructed an overall walkway through the District which forms part of a nationwide walkway. Some of WDC s reserves form part of this walk and an Esplanade Strategy would look at how other potential walkways could link to this nationwide network. One possible source of funding for an esplanade reserves strategy would be through the sale of any future identified surplus reserve land, with the proceeds going into esplanade reserve development. Ideally, this would consider key criteria such as cost, location, conservation value, and distance of links to other reserves. A current listing of Esplanade Reserves is included in the base information for this Activity Plan. An alternative source of funding is through financial contributions under the Resource Management Act 1991 should WDC develop such a policy. 50 Draft Parks and Reserves Activity Management Plan Doc
160 Safety Several structures exist on Esplanade Reserves, such as wharves, jetties and boat ramps. A full engineering assessment of these has been undertaken during 2009 to assess the impacts of these assets and their safety with budgets being updated in Necessary scheduled works are included in the renewals funded programme. Maintainability Coastal Erosion Coastal erosion of WDC land adjacent to the ocean is an ongoing threat to reserves and communities. Generally this erosion is a natural environmental process of secretion and erosion which seems to being expediated by global warming and sea level changes. WDC generally considers this to be a natural process and does not interfere. However to protect iwi burials at Marokopa wall has been built at the end of Marokopa Road in WDC s roading department has also undertaken emergency retaining in Mokau where a road was eroded so that a strategic withdrawal from the area can be managed by the community.. Play Equipment Provision At present the type and quantity of Play Equipment available is expected to provide the required Levels of Service to meet public expectations for safety, play, variety and challenge. In addition, this level is anticipated to meet future demands for play equipment provision taking into account an expected stabilization or slight decline in the population. However with the higher than average number of younger population this will need to be monitored. Provision of playground equipment can be monitored through the WDC resident inhouse survey and by WDC taking part in Park Check surveys. Safety WDC is working towards meeting safety standard NZS 5828 (2004) for Play Equipment and under surfacing and the New Zealand Building code for any other structures. To meet this ongoing commitment to compliance WDC will need to provide an allowance for renewal and capital expenditure for Play Equipment throughout the District. This allowance is estimated to be $30,000 per annum for the next three years. Any further monies can be included in the next review of this activity plan as the current allowance provides for the replacement of Priority 1 and 2 renewals. Safety in our playgrounds is not only about the physical safety of the equipment provided. The community is becoming more aware of the need for healthy living and the issues related to this. Of particular note is the effect of passive smoking. WDC intends to encourage a non smoking policy around the children s playgrounds. This will be incorporated into the renewals and upgrade works by providing signage. Safety in relation to the location of the skate park and the adjacent rail corridor has been bought to the attention of WDC due to the recent tragic accidents that have happened. The security fencing established at the time of the skatepark has been extensively vandalised and requires complete replacement, which is included in the park renewals Quality Some under-surfacing, such as sand, has high maintenance needs and does not retain its impact resistance qualities as well as some modern products such as cushion fall (processed bark product) and rubber safety matting products (recycled rubber matting). Eventually WDC will upgrade to meet the standards for all under-surfacing to either cushion fall or rubber safety matting through the utilisation of future monies provided for playground upgrades. The annual audit will identify equipment and under-surfacing that needs to be upgraded to the standard or replaced in its entirety. Maintainability 51 Draft Parks and Reserves Activity Management Plan Doc

161 Under-surfacing such as bark and sand have high maintenance needs, whereas rubber and safety matting requires lower levels of maintenance but higher initial cost. This is sometimes offset by removal, burning or other physical damage to rubber matting. WDC s policy is to use cushion fall or rubber matting in all new and upgraded play areas or bark where it is currently used. Rukuhia Domain Reserve - Piopio Utilisation Active Reserves In general, utilisation of sports fields is visually assessed as adequate depending on location although no information is available to confirm this assessment. These rates will be detailed in future versions of this AMP through analysis of a user group's survey that identifies the number of hours and frequency of use. Sports fields in towns as opposed to rural areas have more frequent use by various sporting and recreational activity user groups during the summer and winter months. However, the opportunity to increase multiple uses of these reserves exists. The multiple use of sports fields would result in better utilisation of these assets and may be an outcome of WDC s Leisure Strategy. A factor that may limit the multiple uses of sports fields is use during periods of prolonged wet weather that causes long-term damage to playing fields and the very poor drainage of the main fields in Te Kuiti. To overcome this, enforcement of Reserve Management Plan Policy relating to the protection of the quality of sports fields will be necessary. The figure 4.16 identifies Active Reserve User Groups and Level of Service provided by Waitomo. Figure 4.16: Active Reserve User Groups Reserve Location User Group Centennial Park Te Kuiti TK & District Highland Pipe Band Te Kuiti BMX Club Te Kuiti Rod and Custom Club King Country Junior Football Te Kuiti Junior Rugby League Te Kuiti Squash Club Maniapoto Netball / Tennis Association Waitomo Small Arms Society Te Kuiti Croquet Club Level of Service by WDC High Te Kuiti Domain Te Kuiti Te Kuiti Primary School High Rukuhia Domain Piopio Piopio Rugby Club Low 52 Draft Parks and Reserves Activity Management Plan Doc


162 Reserve Location User Group Piopio Pony Club Light Horse Club Hunt Club Sports and Athletics Club (club is currently in recess) Piopio Schools Level of Service by WDC Mapiu Recreation Reserve Marokopa Recreation Reserve Mapiu Casual use Low Marokopa Casual use Low St Helens Domain Aria Aria Squash club Aria Tennis Club Aria Sports Club Aria Motor Bike Club Taumarunui Horse Endurance Club Aria Primary School Low Benneydale Domain Benneydale Bush United Rugby club Low Tainui Wetere Domain Mokau Mokau Community Golf Club (in recess) Low Tainui Rugby Club Camper van stopover No information is currently available on the level of sports field use. A programme of establishing this information is to be implemented, especially for the main sports ground in Te Kuiti- Centennial Park. Passive Reserves It is very difficult to accurately measure the extent of use of reserves; however it is believed that Passive Reserves experience meets the current use rates, depending on the location of the reserve and the time of year. No data is available to verify this belief. Information gathered in 2008/2009 ParkCheck survey showed quite a considerable use during the survey period. Passive Reserves with such assets as walkways appear to best meet the expectations and needs of users. Leased Reserves These reserves are generally undeveloped land banked land and used for grazing and are generally unavailable for public use Esplanade Reserves Esplanade Reserves are generally either leased to adjacent land users (mostly grazing) or undeveloped and generally not utilised by the public with the exception of those in the Te Kuiti township and some coastal areas. Leased Reserve, Kiritehere Play Equipment 53 Draft Parks and Reserves Activity Management Plan Doc
163 During the summer months playgrounds and play areas located upon District reserves experience high use rates. The location of playgrounds is the determining major factor in the use rate. Those playgrounds conveniently located attract high levels of use. In general, these assets are well used. In particular some of the larger playgrounds experience high use levels because of the variety of equipment available. The prominent location of the larger playgrounds in the central area of the towns also contributes to this factor. In contrast, some reserves have only one piece of equipment and use is low, therefore in these locations the removal of equipment could be considered Distribution of playgrounds would be investigated and addressed as part of the Open Space Strategy. 4.3 Asset Condition/Remaining Life Details of asset condition for the different groups of assets are included in the base information for this Activity Plan. All condition assessments have been undertaken in 2008 and updated where equipment has been replaced in the last three years. A regime will be based on general park assessments every five years, with the exception of play equipment which will be assessed annually and structures every two to three years A summary of asset condition for each park type is included below Active Reserves Most of the assets in the Active Reserves category are in average to poor condition. Split by asset type they are. The following graphs are based on asset assessments undertaken information gathered for the 2012 update of this plan: Figure 4.17: Condition of Active Reserve Assets 20 Infrastructure 30 Furniture & Fittings 40 Structures Number Condition Grade Number Condition Grade Number Condition Grade our and five in infrastructure generally relate r and five in structures generally relate areas of fencing Passive Reserves The majority of assets in the Passive Reserves category are reported as being in good to average condition. Items reported as being in poor condition include access roads, hard surfaces and a small number of litter bins, picnic tables and bench seats. Note that the number of bollards distorts the graphs in structures Figure 4.18: Condition of Passive Reserve Assets Number Infrastructure Condition Grade Number Furniture & Fittings Condition Grade Number Structures Condition Grade Esplanade Reserves Some development of Esplanade Reserves has been undertaken to date, especially through the township of Te Kuiti. Outlying Esplanade Reserves have been little developed. The majority of assets on the Esplanade Reserves are graded average to poor. 54 Draft Parks and Reserves Activity Management Plan Doc
164 Figure 4.19: Condition of Esplanade Number Infrastructure Condition Grade Number Furniture & Fittings Condition Grade Number Structures Condition Grade the condition grades four and five in furniture and fittings generally relate areas of bins, tables, and BBQ s te Leased Reserves A minor amount of development of Leased Reserves has been undertaken to date, but mainly to do with the ability to lease them. These assets have not been condition graded as the lessee is responsible in most cases for the maintenance and replacement. Play Equipment Most of the assets associated with the playgrounds are in average to good condition with the exception of many of the Furniture and fittings that are in a very poor condition. Figure 4.20: Condition of Play Equipment Assets Number Furniture & Fittings Condition Grade 1= Excellent 2 = Good 3 = Average 4 = Poor 5 = Very Poor Note the above graph does not include Centennial park playground which has been upgraded in In all of the park assessments for asset condition, the area of neglect around renewals of bins, BBQ s, tables, seats, fencing etc is the dominant contributor of conditions four and five. This was also borne out in the Parkcheck survey. An allowance of $15,000 for miscellaneous renewals has been included for each year of the budget to allow the gradual upgrading / replacement of these poor performing assets. 55 Draft Parks and Reserves Activity Management Plan Doc
165 4.4 What the Assets are Worth Parks and Reserves assets are classified as infrastructure assets, defined as fixed assets that provide a continuing service to the community and are generally not regarded as tradable. The valuation of assets associated with Parks and Reserves Activity is made up of the following: Figure 4.21: Valuation of Parks & Reserve Assets Asset Value Land Value: (1) Active Reserves Passive Reserves Leased Esplanade Play / Skate Parks Improvement Value (1) Active Reserves Passive Reserves Leased Esplanade Play / Skate parks $ 1,464,000* $ 1,699,700 $ 37,000 $ 299,350 $ 49,000 $ 3,056,000 $ 227,650 $ 53,000 $ 144,000 $ 0 Play Equipment: (replacement value by Auditor Equipment New Equipment 2014 Under-surfacing Horticultural Amenities $ 425,766 $ 69,000 Included Included Miscellaneous Improvements e.g. furniture Included Hard Surfaces Roading Carparks Footpaths Included Included Included Park Furniture Included Utility Services Included (1) Based on the rating value which was reassessed in 2012 * Includes Te Kuiti Domain Land (DOC land) land value The total value of the Parks and Reserves Activity is $7,524,466 and is based on the improved rating value of Since the 2009 valuation the total value has dropped by $496,610, mainly a reflection of the drop in land values in Waitomo District. A componentised fair value was established at the time of the rating value but needs to be updated and correlated with the updated asset register. This value will be systematically amended as the information is gathered to allow the above table to be completed based in actual assets on site and Discounted Replacement Value. The improvement value will be decreased as improved information relating to detailed asset values is obtained and included in the table above. 56 Draft Parks and Reserves Activity Management Plan Doc
166 4.5 Confidence in our Data The data used in the asset summaries above has been graded as per the Confidence Grading scale explained in Section 6.5. The condition, utilisation and performance information is graded between Element Confidence Comment Grade Asset type B Data structure in use but gaps in information held. Installation Date C Installation date assumed for majority of assets. Location C Location only extends to park asset located in and in some cases descriptive location. Quantity B Most assets captured with exception of underground utilities Size/number B Good information most assets Materials C Information on materials accurate as to assumptions from asset gathering Condition B Individual assets graded Performance D Very little performance information held. Useful Life B Useful lives assessed. Unit Cost D Valuation not componentized (outdated). 57 Draft Parks and Reserves Activity Management Plan Doc
167 How We Manage the Service (Lifecycle Management) 5.1 Operations and Maintenance Strategies/Tactics WDC policy regarding the management of Parks and Reserves is to encourage community involvement. This is in accordance with the objectives for this AMP noted in Section One. These administering groups have a direct role in the management of their respective Parks and Reserves. This can entail organising works and programmes in conjunction with the Waitomo District Council or its contractors, or alternatively carrying it out themselves. The following figure 5.1 details Parks and Reserves administered in part or in full by other groups. Figure 5.1: Parks and Reserves Advisory Groups Facility Administering Group Activities Mangaokewa Reserve Kopaki Reserve St Helens Domain Mapiu Recreation Ground Tainui Wetere Domain Marokopa Recreation Reserve Rukuhia Domain Brook Park Project Manu Kopaki Rural Hall Committee (disbanded awaiting revocation of rights to manage) St Helens Domain Board Mapiu Domain Board Tainui Wetere Domain Board Marokopa Social Committee Piopio Community Sports Inc Brook Park Incorporated Society Planting, weed spraying track clearing Grazing Grass cutting, weed spraying, leasing Grass cutting, weed spraying Grass cutting, weed spraying, golf course preparation Grass maintenance by Council All administration functions All administration functions WDC is directly responsible for maintenance and renewal of reserves assets except where administration is 100% with the administering body. Maintenance standards set by WDC noted in specification contracts (Figure 5.2) which are undertaken by WDC Internal Services unit,, apply to all asset components identified in contract specifications regardless of their location or profile. These in house rates can be reviewed against those obtained through Yardstick (parks benchmark project) to ascertain the validity of costs obtained. Other market comparisons are utilised where available. WDC s intention is to competitively tender for specialist maintenance services rather than on a casual basis as present. These include, tree maintenance, weed control and specialist turf renovation procedures utilizing the NZ Turf Institute. It may however, due to difficulties with obtaining competitive tenders, be required to bring further of these contract works in-house to meet our management Levels of Service as has been the case with the garden maintenance. The mowing procurement option affects all Community Services Group Activity Plans. The total mowing across all activities is in the vicinity of $462,043 in the current year ( ) 58 Draft Parks and Reserves Activity Management Plan Doc
168 Figure 5.2: Current Maintenance Contract Details Contract District Mowing Term On Going Expiry Date Contractor Cost for 2014/2015 (**) WDC In House Services Unit $462,043** Reserves Spraying Tree Maintenance Park Furniture Maintenance District Garden Maintenance Bins/Litter Maintenance Cleaning contract Toilets 3yrs October 2017 Turf/Weed Control Playground Maintenance Casual Basis Specialist contractor Casual Basis Specialist contractor WDC In House Services Unit WDC In House Services Unit Several Contracts OCS Ltd Casual Basis Specialist contractor WDC In House Services Unit To be developed To be developed $11,000 $16,100** Part of Solid waste Contracts Refer Public Amenities AMP for costs To be developed $15,000 Based on audit report General asset maintenance Casual basis Maintenance rates to be established (**) Related to those assets included in this Activity Management Plan These contracts specify the Levels of Service, performance criteria, standards and reporting details for the activities. Any work carried out will be in accordance with industry 'best' practice. For Playground Equipment any maintenance, repair or replacement will comply with the manufacturer's recommendations and NZS 5828 (2004). In some cases different standards apply to different facilities; where standards change it is usually in response to community demands or financial constraints. However, the primary objective is to provide a consistent standard of management for similar facilities. In general the management standards set for Parks and Reserves relate to one or more of the following characteristics: Public safety National or local significance Location Specialised use Value to community Community use Capital investment New Zealand Standard In the case of mowing, different standards apply to turf mowing specifications where all active and high profile passive reserves are maintained to higher standards than other passive and less prominent reserves. Specifically, this standard relates to the height at which turf areas are cut and is expressed as grades one to three in order to provide optimum playing surfaces for sporting or leisure activity. Grade one applies to active and high profile passive reserves, whereas grades two and three apply to the remaining passive and less prominent reserves. Figure 5.3 identifies grades, Levels of Service and reserves mowing specifications for turf heights. The current grass mowing contract also has several areas that are mowed on a frequency basis. Figure 5.3: Mowing Specifications 59 Draft Parks and Reserves Activity Management Plan Doc
169 Grade LOS Turf Height Range 1 High 15-40mm 2 Medium 30 75mm 3 Low mm Planned Inspections Regular inspections to assess the condition of Parks and Reserves assets identify future risks and maintenance needs or repair work that is required. The frequency of inspections is based on the outcomes of any asset failure for Levels of Service, costs, environmental impacts or corporate image. The inspection programme will be regularly reviewed and modified in response to unplanned maintenance and risks. The following figure 5.4 identifies the required actions for carrying out planned inspections. Figure 5.4: Inspection Details Asset Frequency Inspector Checks Active/Passive Reserves - Esplanade Reserves (developed) Random monthly inspection for mowing, structures and paths Community Services Officer General condition of reserves Contractor performance Play Equipment - Park Furniture and Miscellaneous Park Structures Fortnightly inspections of Play equipment and Bi-monthly inspections of Park furniture Playground inspections are increased to weekly during high use periods, e.g. school holidays (currently being developed) Community Services Officer /in-house staff- general condition of play equipment and Contractor performance. Vandalism, graffiti, damage, obstructions, safety, security and compliance Annual audit of Play Equipment Independent Playground auditor Compliance and maintenance Street Trees Reactive Inspections generally based around service requests Inspection regimes to be developed and will be noted in Future versions of this AMP Community Services Officer Appearance, health, clearance from o/head lines and safety Reserve Structures - Services Reactive Inspections Inspection regimes to be developed and will be noted in Future versions of this AMP Community Services Officer Structural condition, safety and appearance Planned Maintenance Planned non-critical maintenance is estimated to account for approximately 80% of the total maintenance budget. This work usually involves routine maintenance, e.g. garden and lawn maintenance, litter removal, shrub pruning and spraying according to Contract specifications. The scheduling of works is the responsibility of the Contractor who optimises work activities in order to meet specified minimum service standards as identified by the contractor and the Community Facilities Manager. Planned maintenance of higher value or critical works specified in maintenance contracts ensures that assets remain in satisfactory condition as well managing the risk of potential asset failure. Such works 60 Draft Parks and Reserves Activity Management Plan Doc
170 can include preventative maintenance of playground equipment. These are dependent upon assessment factors such as: a) Impact of failure b) Rate of asset decay c) Economic deficiency d) New Zealand Safety Standards Unplanned Maintenance Unplanned maintenance is estimated to account for approximately 20% of the total maintenance budget. This work usually involves extraordinary maintenance, e.g. example, contingency works, emergency repairs, removal of storm damage, roading repairs, utilities repairs and requests by WDC. The unplanned maintenance priorities are: a) Concern for the safety of reserve users and adjacent property owners b) The likelihood that if repairs are left unattended the final cost could increase c) Secondary works may be dependent upon primary works Future versions of this AMP will identify those reserves that are leased and whether they have access for the public. Contract works will be developed for the maintenance of any future District walkway system. 5.2 Renewal Renewal Strategies The general renewal strategy is to rehabilitate or replace assets based on four factors, being asset performance, economics, risk and asset condition. These are discussed below. It is assumed no new development will be undertaken unless specifically identified and budgeted for. The emphasis is renewal of existing assets. Currently some renewals work is undertaken utilising a general repairs and maintenance allowance included in most budgets. As asset information is improved, budgeting for renewals will become more accurate. Where a significant renewal expanse is undertaken utilizing maintenance monies this is reallocated through account journals. Historically the minor parks assets such as bins, tables, BBQ s, seats have been allowed to deteriorate and in many cases removed to save repair / replacement costs. This is indicated by the large number of concrete pads in the reserves and was noted as an issue during the Parkcheck satisfaction survey. An annual renewals sum has been included in the budget to allow the gradual upgrade and or replacement of these assets. Asset Performance Failures in the performance of an asset to the required Levels of Service are identified by measuring the asset's condition, performance during inspections and investigation of customer complaints. Indicators of non-performing assets include: a) Repeated asset failure b) Poor appearance c) Low customer satisfaction d) Frequent vandalism e) Unsafe f) Low use rates Economics The objective for renewals is to achieve: a) The optimum lifecycle costs for the asset ( currently being established ) b) Savings by incorporating renewal works with other works Risk The objective in reducing risk is to prioritise and programme work according to the following criteria: 61 Draft Parks and Reserves Activity Management Plan Doc
171 a) Public safety b) Legislative requirements c) Environmental risk d) Financial risk of deferring work e) Importance of asset location f) Intensity of use Condition Asset condition is an integral part of performance, rehabilitation, cost and risk and is further discussed below Condition Assessment The assessment of asset condition is essential for AM planning and the initial survey for parks assets was completed in 2009 with updates as equipment is replaced or removed. A graphical summary is shown in Section 4.3. Further development of this survey information will increase the confidence and reliability. The data collected from regular inspections is used to determine: a) What stage an asset is in its lifecycle b) The remaining effective life of an asset c) The deterioration rate of an asset d) When rehabilitation or replacement of the asset is required e) Financial forecasts f) The risk of asset failure g) The frequency of inspection required to manage risk of failure The condition of assets is rated according to the New Zealand Parks and Recreation Asset Condition Grading Standards Manual (PRAMS). This defines specific rating standards and definitions for various asset groups based on the following general condition rating standards. WDC does not currently have an asset programme for this information so it is kept as Excel spreadsheets and will be used to identify maintenance, development and renewal or disposal works. For playground equipment, undersurfacing and minor assets the confidence level relating to the assets is high, but low for assets such as underground services and roading Renewal Standards The standards and specifications for renewal works are generally the same as new works Key Renewal Programmes Several parks assets have been identified as less than average in condition and will require assessing for renewal or removal. An allowance to continue this ongoing process has been made in the 2011/2012 financial year and will continue through the life of WDC s Long Term Plan. Playgrounds require a high standard of maintenance and compliance. Many of WDC s items of play equipment have been identified as non compliant (current independent audit puts compliance at 88%) and require refurbishment. This has been estimated in Figure 5.5 below and further analysis of the asset data is required to confirm this amount. In the 2008/2009 budget an allowance for undertaking engineering assessments of all park bridges, wharf and jetty structures and general esplanade structures, has been allowed for. This figure for renewals has been updated in 2014/15 and carried into this version of the AMP. A renewal figure has been included below to allow identified renewal work to be undertaken. 62 Draft Parks and Reserves Activity Management Plan Doc
172 Figure 5.5: Renewal Programmes Project Key Service Criteria Forecasted Total Cost Confidence Level In Projections Estimated Timeline for Project Completion Park Renewals Quality $160,000 (10 yrs) C - D Annually Satisfaction $16,000 annually replaces bins/tables Playground Renewals Quality Satisfaction Legislative (Refer LOS) B Bridge/ Pontoon, Jetty renewals (DMC report) Quality Safety $325,000 (10yrs) $32,500per annum D Annually Groyne developed Marokopa Esplanade Safety Satisfaction Quality Community Cost D Community Cost Te Kuiti Skate Park Fencing Safety $20,000 B Te Kuiti Overbridge Renewals Safety $60, $80, Refer to Public Amenities AMP C Deferred Renewals In the context of WDC affordability and sustainability, works identified in terms of renewal strategies may be deferred where costs are beyond WDC s current ability to fund them. This may occur where higher priority works are needed for other infrastructure assets, or there are short-term peaks in expenditure or inadequate funds exist. The asset lifecycle management sections detail any deferred renewals for that category of assets. 5.3 Disposal and Rationalisation Disposal The primary asset considered for disposal within this activity is Reserve Land. The Leisure Strategy will allow WDC to assess needs, trends and use and assist in identifying surplus property if any. The decision to sell surplus property is made by the Surplus Property Review Committee (to be established) using the disposal process adopted by. However, at any point along this process the Committee may decide to withdraw any property from sale. The Group Manager - Community Services oversees the process of the sale of property identified as surplus to requirements. The proceeds from the sale of reserves' assets (if any) may be refunded to the Crown, but exception may be sought to use the monies for the further development or acquisition of reserves. Furthermore, disposal processes apply to 'all' Parks and Reserves assets and must comply with the following legal obligations: Local Government Act 2002 a) Consult before it sells or agrees to sell a park or part of it. Reserves Act 1977 a) Observe the process for revoking the status of reserves b) Notifying the public prior to sale or revocation c) Offer land acquired under the Public Works Act back to the original owners No reserves have been previously identified as surplus to requirements. 63 Draft Parks and Reserves Activity Management Plan Doc
173 5.3.2 Asset Rationalisation The asset rationalisation process is an opportunity to review configurations, type and location of assets and the service delivery processes relevant to the activity. It involves two parts. The first part consists of regular and close monitoring of Parks and Reserves assets data identified from the following processes: a) Monitoring use rates of Parks and Reserves assets (surveys, Parkcheck- scheduled for 2008/2009). This has been completed but requires follow up survey. b) Monitoring complaints received about assets Levels of Service (analyse WDC s Request for Services System) c) Monitoring use rates of playgrounds/play areas (surveys) d) Monitoring use rates of sports fields e) Monitoring condition of assets (planned inspections) The preparation of the Leisure Strategy, Open Space Strategy and Esplanade Strategy over the life of this Activity Management Plan will enable WDC to make informed decisions regarding rationalisation. The second part of the asset rationalisation process involves the identification and investigation of alternative uses for existing assets or other courses of action prior to disposal being considered. It may be that user expectations may be better met or user numbers increased; this may involve one or more of the following processes: i. Upgrading of facilities (feasibility study) ii. Alternative uses for facilities (feasibility study) iii. Refitting of facilities (feasibility study and engineers report) iv. Entering into partnership with private enterprise (feasibility study) 5.4 Assessments Undertaken (Cemeteries/Public Toilets) Services assessments as specified under the Local Government Act 2002 are not applicable to Parks and Reserves. There may however, be assets sited on Parks and Reserves which will need to be assessed e.g. public toilets. These assets are included in the Public Amenities Activity Management Plan. 5.5 Managing Risk While WDC has identified the risks associated with Parks and Reserves, WDC to date has not undertaken a risk management plan and this is a key issue to be addressed. It is to include a Public Health Risk Management Plan and investigations to establish as built information. It has been deemed in establishing this AMP that the risks associated with Parks and Reserves are low. Risk management is all about limiting the consequences of failure in our assets and limiting the likelihood of this failure Risk Approach Risk = (failure consequence X likelihood of failure) A pragmatic approach has been taken to risk management in identifying risk events they have been grouped into: Natural events, where there is no real control over the timing or extent of the event, although probabilities may be understood, e.g. floods, lightning strikes, earthquakes. External impacts, where other service providers are not providing services which impact on the organization or individuals, e.g. power supply failures, material supply failures. Physical failure risks, where condition or performance of the asset could lead to failure. Operational risks, where management of the asset or asset management activities may impact adversely on the asset. These risk events, while impacting directly on the assets, have other consequences on such things as: Repair costs - financial Loss of income Loss of service Loss of life, or injury Health impacts Damage to property 64 Draft Parks and Reserves Activity Management Plan Doc
174 Failure to meet statutory requirements Third party loss Loss of image Risk Management Process Risk identification - In the identification stage all risks should be noted, however further work is required to further identify more specific risks to parks asset area Risk evaluation Evaluation requires that all risks are measured as to the likelihood of them occurring, and then scored allowing a monetary conversion Risk management Management of the risks to parks assets requires that Staff exercise judgement regarding avoidance, reduction or transfer. It is proposed that risk will be avoided, mitigated, reduced or transferred by the following means: Avoid risk by - Changing location, procedures, materials, or equipment and/or no longer provide the service or asset that presents the risk; Reduce the risk by - The Installation of security devices such as lighting; Formulating procedural safeguards, such as condition assessments, security patrols and performance evaluations; and further training to educate Staff and Contractors in safe working conditions and emergency procedures; Transferring the risk - Legal methods to assign the risk of potential losses to a third party by Insurance or altering the terms or conditions of contracts or adding this risk to new contracts. Retention of risk WDC can take on the risk as increasing insurance premiums and insurance excesses are also forcing the retention of further risks onto WDC. The probability of physical failure of an asset is related directly to the current condition of the asset, hence the importance of realistic and accurate condition assessment. The effort put into assessing and managing risk needs to be proportional to the risk exposure. Within the parks area the key risks centre around failure of structural assets on reserves or associated with playgrounds. Natural events e.g. flooding are mitigated by closing the reserve Measures of Likelihood of Risks Measures of likelihood or probability are explained in the table below: Figure 5.6: Probability Table LIKELIHOOD DESCRIPTOR DESCRIPTION 9-10 Almost certain The event is expected to occur in most circumstances 7-8 Likely The event will probably occur in most circumstances 5-6 Possible The event should occur at some time 3-4 Unlikely The event could occur at some times 100% PROBABILITY OF FAILURE PROBABILITY Within 1 year 0.9 Within 2 years 0.5 Within 3 10 years 0.15 Within years Rare The event may occur but only in exceptional circumstances After more than 20 years Draft Parks and Reserves Activity Management Plan Doc
175 5.5.4 Measures of Consequence Figure 5.7: Measures of Consequence or Impacts CONSEQUENCE DESCRIPTION FINANCIAL TECHNICAL PERSONNEL INCIDENT OR ACCIDENT SOCIAL POLITICAL COMMERCIAL 1 Negligible <$10,000 Minimal impact to production First aid treatment. Limited lost time Minimal impact disruption or Minimal interest Minimal impact 2 Minor >$10,000 <$50,000 Limited disruption and some loss of production Medical treatment required. time injury Lost Some disruption to normal access or community systems Minor impact or interest. Questions raised in local forums, local media reports Claims from business or repairs to other services. Customers inconvenienced 3 Moderate >$50,000 <$500,000 Significant impact, production reduced or stopped for up to two weeks Serious injury. Extended medical treatment required Disruption to public access and other systems. Increased potential for accidents Community discussion. Broad media cover over a regional basis Significant claims. Customers forced to other options. Questions from regulator 4 Major >$500,000 Disruption and damage to system or incident involving other infrastructure Serious injury or loss of life Extensive disruption. Incidents / accidents involving the public Loss of confidence in facility management. Corporate credibility affected Loss of substantial business opportunity. Rebuke or threat from regulator 5 Catastrophic Very high. Extensive losses within and beyond the system Extensive disruption and damage with broad impact on other infrastructure Loss of more than one life and or extensive injuries Broad impact on community health or the environment Public furore and investigations. Management changes demanded Loss of substantial part of business. Loss of licence for a large area or region 66 Draft Parks and Reserves Activity Management Plan Doc
176 5.5.5 Risk Matrix Risks are aligned to: Public Health, Environment, Security of Service, Quality, Asset Protection and Capacity. The following table explains the risk rating matrix used to assess the risks tabulated below for the parks assets. Risk is assessed as the product of Consequence and Probability, thus a high likelihood of the event occurring with a major consequence leads to an extreme risk that requires immediate action. Figure 5.8: Risk Rating EVENT Consequence Likelihood Rating 1 Negligible 2 Minor 3 Moderate 4 Major 5 Catastrophic 9-10 Almost Certain Moderate High High Extreme Extreme 7-8 Likely Moderate Moderate High Extreme Extreme 5-6 Moderate Low Moderate Moderate High Extreme 3-4 Unlikely Low Low Moderate High Extreme 0-2 Rare Low Low Moderate High High Parks and Reserves Identified Risks High risks are shown in this abbreviated summary table. A full assessment is included in the base information for this Activity Plan. Figure 5.9: Parks and Reserves Identified Risks Asset Affected Trees Failure Mode Tree branches or the whole tree falling Vandalism Description Lightening strikes Accidents Risk Rating High Current Mitigation Tree condition and safety reports completed on a case by case basis Managed Risk Rating Moderate Aged and mis-shapen trees Arboriculture works completed as required by trained professionals Playground Equipment Playground equipment asset deterioration Play equipment is no longer functional due to age, impact of vandalism Change in NZ Playground equipment standards High Monthly playground equipment safety audits Maintenance carried out as a consequence of these audits Independent yearly audit Moderate Mitigation Measures Mitigation measures typically include design and engineering measures to strengthen the ability of the asset to withstand the hazard event. When an asset has failed or is expected to fail in the future, strategies can then be developed to avoid or react to the failure. If the failure mode of an asset is critical to the organisation, failure avoidance is likely to be more effective than reactive activities. Depending on the failure mode, the strategies may include changed maintenance activities, rehabilitation works, replacement works or abandonment of the asset. 67 Draft Parks and Reserves Activity Management Plan Doc
177 These Strategies can provide a list of works, which may be further broken down into: Should Do Complete within 5 years; Could Do Works which may possibly be deferred for 5 years; Defer Works which can be deferred for 5 years. Based on the risk rating matrix above, the table below gives guidance on mitigation measures. Figure 5.10: Mitigation Matrix Extreme Immediate action required to reduce risk. High Risk Treatment options must be reviewed and action taken to manage risk. Moderate Risk Treatment options reviewed and action taken dependant on treatment cost. Low Risk Managed by routine procedures. 5.6 Critical Asset Identification A critical asset is one that if it fails to provide the required service it will result in a significant impact on the community. (Significant impact can be viewed as loss of a major amenity, disruption to many businesses or people, harm to WDC's image, inability for WDC to function). Identification of critical assets involves assessing the asset against a series of criteria and allocating a grade. The process involves Listing the main asset group Assessing and scoring the impact of an event using 0-3 grade Summing the scores Assets deemed to have a total of 10 or more, then the asset is a critical asset Park assets are assessed below. 68 Draft Parks and Reserves Activity Management Plan Doc
178 Figure 5.11: Critical Asset Assessment and Identification Asset matrix 0= No impact 1= Low impact 2= Moderate impact 3= Severe impact Direct Costs (Repair, lost revenue,3 rd damaged, legal costs Effect on Community (loss of supply) Effect on public safety Environmental damage Image / Public support Other Total (sum) Active Reserves Passive Reserves Esplanade Reserves Leased Reserves Play Equipment Mangaokewa Reserve Brook Park By this method it can be seen that no asset groups within the Parks and Reserves Activity area score the required 10 points to be classified as critical. The two key areas being WDC s legal obligations regarding Play Equipment and the structures on Esplanade Reserves 69 Draft Parks and Reserves Activity Management Plan Doc
179 What It Costs and How We Will Pay For It (Financial Summary) 6.1 Summary of Financial Policies The focus of this AMP is to provide agreed Levels of Service at the optimum or lowest lifecycle cost to the community. The acquisition of funds required to achieve this focus are noted below. General rates, UAGC and user charges fund the net costs of this function. Capital development is funded by loans or depreciation funded reserve accounts with interest charged in accordance with WDC funding policy. This interest is then allocated to rates funded activities. 6.2 Capital Works Framework Project Identification and Prioritisation The identification of capital works is guided by the Parks and Reserves Activity goals which are to: a) Provide quality sports fields for local groups and clubs b) Provide quality open space areas that allow for a multitude of impromptu and informal leisure activities c) Provide quality and challenging play equipment in compliance with NZS 5828 (2004): Playground Equipment and under surfacing d) Provide a land bank of reserve land to be available for future recreational development Project Identification and Prioritisation Projects are identified from: a) Reserve Management Plans - many are outdated and require redevelopment. b) Changes to Levels of Service, i.e. demand for higher Levels of Service. c) Service requests d) New subdivisions or developments especially in coastal areas. e) Community groups/organisations. f) Open Space Strategy to be undertaken. g) Esplanade Strategy to be undertaken. h) Leisure Strategy to be undertaken. i) Track Strategy - to be undertaken. Projects are identified from the above sources as well as community requests, WDC resolutions and through inspections. These projects are collated throughout the year and funding sought through the Exceptions Annual Plan process where they have not been allowed for in this AMP. An adopted by WDC process is required to allow prioritisation of all projects, with prioritisation based on a ranking system. Once the various strategies and plans are developed, a detailed project list can be developed and included in the AMP. At the moment this is not possible and inclusion of individual projects is presented through the Annual Plan process. Any funding available should at this time be prioritised towards completing the planning and strategy documents. 6.3 Development of Financial Contributions The overall premise on which contributions are based is that development should pay the cost for providing services and facilities required to accommodate growth and effects. Waitomo District has a declining population but growth can present itself in many forms e.g. growth in an ageing population resulting in more leisure time. Section 102 of the Local Government Act 2002 (LGA 2002) requires WDC to have a policy on development contributions or financial contributions. A financial contributions policy prepared under the Resource Management Act 1991 forms part of WDC s operative District Plan. It provides for the protection of the natural and physical environment, retention and possible enhancement of public access to the sea and along the margins of the District s significant lakes, rivers and streams in the form of access strips and esplanade reserves, and the equitable sharing of the costs of the provision and maintenance of infrastructure for development. Financial contributions are effects based. 70 Draft Parks and Reserves Activity Management Plan Doc
180 Full details of WDC s Financial Contributions Policy can be found in Part 3, Section 25, of WDC s Operative District Plan. WDC has currently not implemented its above mentioned Financial Contributions Policy, but needs to investigate this option in the future as a way of funding enhancements to the Community Service Assets. Contributions will provide the appropriate balance of funding between the community, WDC and those undertaking the development. There are risks associated with contributions as a funding source and mainly these risks relate to formulating projections and other trend information on which the calculations are based. WDC intends to review its development contributions policy during the term of its Long Term Plan. 6.4 Financial Forecasts The following budgets have been prepared assuming that all investigatory and strategy type works will lead to future development projects The overall costs of service in this AMP is limited to direct expenditure, revenue and capital / renewals works. The balance of the cost of service statement will be included by treasury when available. The following figure 6.1 summarises the financial forecast for Parks and Reserves assets from (existing Exceptions Annual Plan) to financial year. For the purposes of this initial AMP, financial forecasts are made up of: a) Operations/Maintenance b) Revenue c) Renewals d) Capital Development Over the next three years, the predominant emphasis is based on undertaking the tasks included in the Improvement Plan and undertaking the various strategies/management plans identified. The net result is that the renewals are shown bulk funded for reserves and are estimates and very little capital works are included. Detailed renewals and capital works, based on the improvement plan, strategies and management plans will be included in this plan as they are completed and the impact assessed as part of the 2015 LTP review. The management costs include administrative overheads, rates, cost of capital, will be included by treasury as an addendum to this plan. 71 Draft Parks and Reserves Activity Management Plan Doc
181 Figure 6.1: Summary for Parks and Reserves Activity To be finalised 72 Draft Parks and Reserves Activity Management Plan Doc
182 Figure 6.2: Detailed Summary of Parks and Reserves - 10-Year Expenditure Forecast To be finalised 73 Draft Parks and Reserves Activity Management Plan Doc
183 Figure 6.3: 10-Year Expenditure Forecast Active Reserves To be finalised 74 Draft Parks and Reserves Activity Management Plan Doc
184 Figure 6.4: 10-Year Expenditure Forecast Passive Reserves To be finalised 75 Draft Parks and Reserves Activity Management Plan Doc
185 Figure 6.5: 10-Year Expenditure Forecast Esplanade Reserves To be finalised 76 Draft Parks and Reserves Activity Management Plan Doc
186 Figure 6.6: 10-Year Expenditure Forecast Leased Reserves To be finalised 77 Draft Parks and Reserves Activity Management Plan Doc
187 Figure 6.7: 10-Year Expenditure Forecast Playgrounds To be finalised 78 Draft Parks and Reserves Activity Management Plan Doc
188 6.5 Confidence Levels and Key Assumptions The confidence in the asset data used as a basis for the financial forecasts has been assessed using the following grading system shown in Figure 6.8, from the NZWWA NZ Guidelines for Infrastructure Asset Grading Standards, final draft, August Figure 6.8: Confidence Grading Scale Confidence Grade A B C D General Meaning Highly Reliable Data based on sound records, procedures, investigations and analysis which is properly documented and recognised as the best method of assessment Reliable Data based on sound records, procedures, investigations, and analysis which is properly documented but has minor shortcomings for example the data is old, some documentation is missing and reliance is placed on unconfirmed reports or some extrapolation Uncertain Data based on sound records, procedures, investigations or analysis which is incomplete or unsupported, or extrapolation from a limited sample for which grade A or B data is available Very Uncertain Data is based on unconfirmed verbal reports and/or cursory inspection and analysis The confidence level is B overall. The asset data is B. Key Assumptions It is assumed that the population data from the 2014 Waikato University population projects is correct and will remain relatively static over the life of the plan with some minor downside movement and will have minimum impact on the integrity of this Activity Plan. Low impact on WDC s financial projection within the Community Services area moving forward The Activity Management Plan for WDC s Parks and Reserves assets, which forms part of the overall Community Service Activity, will be progressively updated as more complete information becomes available over time. Best practice and current knowledge has been used in formulating information regarding the assets in this AMP. This information is not well supported by solid historical data. It is assumed that this information is correct. The annual cost of the contract maintenance of the assets will not increase above CPI as a result of any re-tendering process. The valuations using rating values is an accurate assessment of the true valuation of the Parks and Reserves Assets Growth related capital expenditure will be minimal of the life of this Activity Plan. WDC will review its Contributions policy over the life of this Activity plan 79 Draft Parks and Reserves Activity Management Plan Doc
189 Our Commitment to Excellence (Management Practice and Improvement Programme) This section of the plan firstly describes the current asset management practices under the headings of processes, systems and data. The gap between current and desired asset management practices in particular is described. The improvements required to close this gap are set out in the improvement programme. The programme also identifies priorities, timetables, resources and estimated costs for achieving the desired management practices. Finally the methodology for the monitoring and review of asset management activities is described. Note that selective improvement items are scheduled for the three years leading up to the scheduled 2015 LTP review. These are costed into the improvement programme and included in the overall Asset Management budgets. This will lead to further improvement of WDCs Parks and Reserves Activity Plan leading up to the development of the 2015 LTP. 7.1 Assessment of Current Practice This section outlines the decision-making practices that WDC currently use to determine long-term maintenance, Levels of Service, renewal and capital expenditure requirements for Parks and Reserves. Current practice is summarised in four broad areas of activity: a) Processes: The processes, analysis and evaluation techniques needed for life cycle asset management. b) Information Systems: The information support systems used to store and manipulate the data. c) Data: Information available for manipulation by the systems to produce the required outputs. d) This Plan The following sections detail current management practices and describe the desired management practices WDC intends to develop over time Asset Processes Figure 7.1: Asset Management Processes Current and Desired Practice Current Management Practices Desired Management Practices Operations Operational processes documented in service contracts where required Ongoing monitoring of contractors performance by contract supervisor (5-10% of work is randomly audited per month in some cases) Operational activities identified and documented in 'controlled' manuals Operational activities contestably priced where appropriate. Note this can be difficult to achieve in some isolated areas Operational activities optimised to minimise lifecycle costs Contractor performance monitored using specific key performance indicators. Performance Monitoring Performance measures and Levels of Service linked Monthly unplanned surveys of contractors work performance, and participation in Parkcheck Performance standards documented in contracts Performance reported to customers through Key Performance Indicators Performance reported to customers and contractors regularly Continuous monitoring and reporting of performance against measures Current Management Practices Desired Management Practices 80 Draft Parks and Reserves Activity Management Plan Doc
190 Current Management Practices Desired Management Practices Optimised Lifecycle Strategy Developing a 10 year forward works programme Risk Assessments undertaken Failure works predicted Risk assessments carried out and treatment options, plans identified Lifecycle costs determined and optimised using NPV analysis 10 year plus forward works programme available Current Management Practices Desired Management Practices Knowledge of Assets Plans and records are incomplete especially for underground services and hard surfaces which are recorded in many cases in the roading asset base Updating process is not documented One off attribute information relating to assets undertaken Results of playground inspections recorded. Asset information relating to buildings available Independent playground audit undertaken Full 'as built' recording process in place to continually update data Process documented for updating of asset information. Process documented for collecting attribute information via maintenance activities. Ability to access asset register for all relevant staff. Condition Assessments Condition assessment of park structures and park furniture and other park assets by Waitomo staff and consultants No Contract reporting on condition of park structures/park furniture Condition assessment of critical assets carried out on an agreed frequency Maintenance feedback processes established and documented Assessment interval optimised Project Management Contract management reporting processes Designs undertaken to best practice Overseer appointed to ensure project is carried out to specifications Designers required to consider lifecycle costs Asset Utilisation Incomplete knowledge of asset utilisation Some minor information available from annual Versus surveys Parkcheck undertaken in 2009 Disposal process for land assets adopted All asset utilisation identified (via enhanced customer surveys Versus and Parkcheck) Non-performing assets investigated and correction options assessed Disposal/rationalisation policy clearly identified 81 Draft Parks and Reserves Activity Management Plan Doc
191 Current Management Practices Desired Management Practices Quality Assurance Deloittes annually audits performance measures reported in Annual Plan Continuous improvement evident in all AM processes Quality assurance inspections for maintenance contracts Continuous QA of maintenance contracts Accounting and Economics NCS financial system for cost records In-house spread sheets to monitor overall departmental expenditure Asset values based on rating valuations NCS property database for leases / licences partly developed Process in place for recording costs against assets where appropriate FRS-3 valuation complete for Parks and Reserves assets Current Management Practices Desired Management Practices Levels of Service Levels of Service are noted in the contract documents Annual In House survey results and Parkcheck LOS based on customer research and reviewed regularly Information Systems Figure 7.2: Asset Management Information Systems Current and Desired Practice Current Management Practices Desired Management Practices Asset Register Basic asset registers of parks assets kept in excel spreadsheet Spreadsheets are used to store data for all reserve and some community assets Database for all park assets excluding buildings Integration of Database and GIS databases Integration of Database to Financial system Financial System Flexible job costing system ( NCS) Financial system is not currently linked to any proprietary AMS Spreadsheets used to hold valuation information NCS database used to record maintenance costs against assets as a total Database used to record maintenance costs against individual assets Asset valuation generated from database Maintenance Management Maintenance work on assets not recorded and not linked to the asset System links maintenance details to significant assets and asset groups to enables tracking of work history Critical and non-critical assets flagged in databases 82 Draft Parks and Reserves Activity Management Plan Doc
192 Current Management Practices Desired Management Practices Condition/Performance Monitoring Hard copy records available and digital spreadsheet Information also recorded in databases Condition, performance and utilisation data stored in system Customer Enquiries Request for Service: customer service complaint and enquiry register and response tracking software that features: complaint location, type and frequency response time to query resolution times for faults Customer enquiry records recorded against individual assets Customer enquiry tracking system in place Risk Management Risk assessment undertaken Risk register developed to record identified high risk assets Current Management Practices Desired Management Practices Optimised Renewal Strategy Non existent No change Systems Integration Non existent The benefits and costs of an asset management system integration with GIS and Financial system analyzed and integrated if appropriate Plans and Records As built plans; maintenance contract files; general files; CAPEX contract files; inspection reports and property register available in some cases Electronic plans and records linked to GIS database Asset Management Data Figure 7.3: Asset Management Data Current and Desired Practice Current Management Practices Desired Management Practices Asset Classification Asset classification system in place for assets stored in spreadsheet form Formalised asset classification system for all assets and documented Asset Identification Unique asset identification system in place for assets stored in spreadsheet along with photos No change 83 Draft Parks and Reserves Activity Management Plan Doc
193 Current Management Practices Desired Management Practices Asset Attributes Inventories established for services and structures, horticultural amenities, and furniture and fittings complete Condition ratings for playgrounds and furniture and fittings approximately complete and updated annually Base information for buildings available at this time Relevant and up to date attributes recorded for all assets Location of land assets identified on GIS Maintenance Data Regular maintenance activity and costs available from contracts Unscheduled maintenance work records available in hard copy form in small number of cases Maintenance data collected against significant assets or groups of assets Lifecycle Costs Renewal and capital costs for common items are available from recent works Good database of complete lifecycle costs, which can be used for decision making Current Management Practices Desired Management Practices Future Prediction Data Limited current future prediction data available Census results used to predict future demand Actual versus predicted growth monitored Levels of Service LOS recorded in AM plan Regularly monitor and recorded current Level of Service against performance measures Asset Management Plans First AMP completed 2008 Review 2011 Up to date AMPs available for all asset groups and used as basis for forward planning Activity Management Plan The original Activity Management Plan has been prepared with the assistance of Hollier Consultants Ltd and Prophet IAM Consultants. A desktop peer review by Hollier Consultants was also undertaken in 2009 to gauge compliance 7.2 Planned Improvements The development of this third AMP is based on current Levels of Service, asset information and the knowledge of WDC staff. The AMP will be regularly reviewed, regularly monitored and updated to improve the quality of AM planning and accuracy of financial projections. This process is dependent upon improved knowledge of customer expectations, further developed AM practices, data to optimise decision making, review of outputs, development of strategies and further planning. Reviews will be dependent on the availability of resources to undertake the review. 84 Draft Parks and Reserves Activity Management Plan Doc
194 7.2.1 Improvement Programme The purpose of an AM improvement programme is to improve the current management practices for AM processes, information systems and data, by implementing an improvement programme that brings current management practices into line with desired management practices. Success of improvement programmes lies in concentrating on specific one off sections of work. The improvement plan will provide for the staged improvement of AM practices to an appropriate level for AMP preparation, process improvements, information system development, and data collection and recording. The overall improvement programme tasks to be completed over time are shown in Figure 7.4 below. Specific one off tasks are identified for the next three years before the 2015 review. Figure 7.4: Improvement Programme over the Lifecycle of this AMP Task AMP PREPARATION Review AMP every three years Review Levels of Service by testing options within the community Confirm corporate AM objectives Refine current Levels of Service/performance measures Conduct external audit of AMP initial audit undertaken 2008 and included in this plan Identify and include any assets that are not included in this AMP Identify development, renewal, maintenance strategies where required Link financial forecasts to the lifecycle management strategies Include valuation results by independent valuer for key assets of building, play equipment AM DATA IMPROVEMENTS Asset attributes Continue to collect asset attribute information Maintenance tasks/data Collect maintenance data against significant assets or asset groups Lifecycle costs Collect lifecycle costs for significant assets or asset groups Future prediction data Monitor actual versus predicted growth Levels of Service Measure performance in Levels of Service against targets 85 Draft Parks and Reserves Activity Management Plan Doc
195 Task AM PROCESSES Operations: Ensure operations and maintenance are competitively tendered where possible Optimise operations to minimise lifecycle costs Documentation of operations and maintenance activities Performance monitoring: Process in place for monitoring, analysing and reporting of performance against Levels of Service and performance measures Optimised lifecycle strategy: Predict failure works Assess risks and identify treatment options Determine and optimise lifecycle costs using NPV analysis for major new works Knowledge of assets: Develop process for updating asset data with new assets and data collected via the maintenance contract Asset register available to all relevant staff Compile up to date information on leased reserves Complete reserves management plan Condition Assessments: Process in place for the condition assessment of assets including assets to be assessed, frequency and ranking procedures Project management: Designers to consider lifecycle costs and risk Audit CAPEX development plans Asset utilisation: Processes in place to ensure identify current asset utilisation of significant assets Develop and assess options for non performing assets Develop disposal/rationalisation policy Accounting and economics: Process in place for collecting costs against assets where appropriate FRS-3 compliant valuation complete for public amenities assets Levels of Service: Process developed for the review of Levels of Service (inc. customer consultation procedures) 86 Draft Parks and Reserves Activity Management Plan Doc
196 Task AM SYSTEMS IMPROVEMENTS Asset register Further develop database for all community facilities Financial system System available to allocate maintenance costs against individual assets Maintenance management Link maintenance history to significant assets or asset groups Condition/performance monitoring Use AMS to store asset condition, performance and utilisation data where appropriate Customer enquiries Record all customer enquiries against individual assets Risk management Develop a risk register Systems integration Investigate the integration of AMS with GIS and the financial system, integrate if appropriate Plans and records Link electronic plans and records to GIS database Monitoring and Review To ensure the effective development and implementation of this AMP the following tasks will be carried out: a) WDC Adoption of AMP b) Review/Adopt Levels of Service WDC will review service levels, via public consultation, to ascertain an accurate understanding of current and future needs and expectations of customers. The resulting redefined Levels of Service and performance measures will be adopted by WDC. c) AMP Revision The AMP will be revised and updated on a three yearly basis to incorporate the outcome of service levels review and any new knowledge resulting from the AM improvement programme. d) Quality Assurance Audit Audits will be undertaken to ensure that the integrity and cost effectiveness of data collected for use in the AMP is maintained. e) Peer Review Internal audits will be undertaken to assess the effectiveness of AM processes, information systems and data, whereas, external audits will be undertaken to measure AM performance against best practice Review of AMP against the OAG Requirements A review was undertaken by Hollier Consultants on the instruction of WDC s Group Manager - Community Services in 2008 as part of the initial development of this activity plan. As a result of that review minor changes were made to the plan including the addition of financials and additional asset information that WDC believes makes this AMP comply with the core requirements of the OAG with the exception of the completion of a componentised Depreciated Replacement Cost (DRC) Specific Improvement Projects Specific improvement projects are recorded below for the periods that relate to the Parks and Reserves Activity Management Plan and based $7,600 being made available each year to fund these 87 Draft Parks and Reserves Activity Management Plan Doc
197 improvements. Timeframes, resource requirements and estimated costs are recorded. The confidence level of the estimated resources and costs is graded as C D. Figure 7.5: Specific Improvement Projects (year ending) SPECIFIC IMPROVEMENT PROJECTS RESOURCE ESTIMATED COST PROJECT YEAR WDC STAFF EXTERNAL Total Budget 3 Years $22,800 Underground services investigations and roading data collection Include Building data in a designed asset management programme such as SPM or into WDC s GIS program/ncs program Review AMP 2017 Yes Yes $7, Yes Yes $7, Yes No In-house Purchase of data logger and development for in field inspection recording Continual Review of Leases and Licences when necessary including building lease data base in NCS 2016 Yes Yes $7, Yes No In-house 88 Draft Parks and Reserves Activity Management Plan Doc
198 Recreation and Culture Activity Management Plan
199 Prepared by: John De Luca Group Manager - Community Services Desktop review by: Hollier Consultants 2008 Date of Review: September 2009 Adoption by Waitomo District Council: 24 March 2009 Review by Waitomo District Council February 2011 Adoption by Waitomo district Council: 29 June 2012 Review by Waitomo District Council November 2014
200
201 TABLE OF CONTENTS EXECUTIVE SUMMARY: RECREATION AND CULTURE... 1 Vision 1 Purpose...1 Link to Community Outcomes...1 Effects of Service...2 Levels of Service...3 Future Demand...7 Recreation and Culture Identified Risks...8 Existing Situation Described...9 Maintenance and Operations...9 Renewals...10 Current Asset Management Practice...11 Financial Summary...11 Specific Improvement Projects Key Assumptions...14 INTRODUCTION WDC s Commitment to its Community Why Council Provides the Service Rationale for Service Delivery The Role of WDC in the Provision of Recreation and Culture Activity The Role of Other Parties Significant Effects of the Service About This Plan...17 LEVELS OF SERVICE - WHAT OUR CUSTOMERS WANT AND HOW WELL WE ARE DOING TO ACHIEVE IT How our Services Contribute to Community Outcomes Strategic Goals Legislative Framework Our Customers Other Stakeholders Service Delivery Options Considered Current/Target Levels of Service Key Performance Indicators Trends Impacting on Level of Service (possible future changes/service level review) Key Programmes to Maintain and Achieve Levels of Service...32 GROWTH PLANNING FOR THE FUTURE AND DEMAND FOR THE SERVICE Population Growth and Structure Demand Projections Ability of the Recreation and Culture Activity to Respond Demand Management Key Programmes to Meet Growth and Demand Confidence Levels and Assumptions Risk Management...40 THE ASSETS WE USE Description of Asset Base How Assets Work Asset Condition/Remaining Life...51
202 4.4 What the Assets are Worth Confidence in our data...53 HOW WE MANAGE THE SERVICE (LIFECYCLE MANAGEMENT) Operations and Maintenance Renewal Disposal and Rationalisation Assessments Undertaken (Cemeteries/Public Toilets) Managing Risk Critical Asset Identification...67 FINANCIAL SUMMARY - WHAT IT COSTS AND HOW WE WILL PAY FOR IT Summary of Financial Policies Capital Works Framework Development and Financial Contributions Financial Forecasts Confidence Levels...75 OUR COMMITMENT TO EXCELLENCE (MANAGEMENT PRACTICE & IMPROVEMENT PROGRAMME) Assessment of Current Practice Planned Improvements...81
203 Executive Summary: Recreation and Culture This Activity Management Plan (AMP) for Recreation and Culture has been prepared by Waitomo District Council staff with outside assistance. Preliminary asset data capture has been undertaken in 2008 and 2011 and the analysis of this data and further capture is an ongoing task. The AMP will provide the basis for the Recreation and Culture Activity in Council s LTP following reviews and adoption of this AMP by Council in June The total value of the Recreation and Culture Activity assets is approximately $10,493,500 Vision Council s vision for the Long Term Plan is: Creating a better future with vibrant communities and thriving business Councils Community Service Group, through its Recreation and Culture Activity ensures that facilities for recreation and Culture are provided as detailed below. Purpose Council provides a range of facilities that are grouped according to their primary purpose. The different groups of recreation and culture assets that provide leisure and recreation opportunities for residents and visitors to the District and are included in this plan are: Waitomo District Aquatics Centre provide high quality leisure, therapeutic and competitive recreation in an aquatic environment. Aerodrome provides leisure, business and recreation opportunities with an aviation focus. Reserve and Community Facilities provides leisure and sport opportunities with an indoor focus. In leased facilities recreation centre, museum facility. Camp Grounds provides additional low cost visitor accommodation within the District. Waitomo Cultural and Arts Centre provides a large multipurpose Hall in the centre of Te Kuiti. Note Library Services are covered in Community Development Activity Plan. The provision of the library building is covered under Housing and Other Property Activity Plan Link to Community Outcomes Council considers in its Long Term Plan that the Community Service Group contributes through its Recreation and Culture activity to the following community outcomes: Primary Contribution Vibrant Communities CO2 A place where all age groups have the opportunity to enjoy social, cultural and sporting activities within our District Secondary Contribution Vibrant Communities CO1 A place where the multicultural values of all its people and, in particular, Maori heritage and culture is recognised and valued. CO3. A place where young people have access to education, training and work opportunities Prosperous District CO6. A place that attracts more people who want to live, work and play, and raise a family CO7. A place where wealth and employment are created through local businesses and tourism opportunities and facilities are developed, facilitated and encouraged 1 Draft Recreation and Culture Activity Management Plan Doc
204 Effective Leadership CO8 A place where the development of partnerships for the delivery of programmes and services is encouraged and pursued. Sustainable Infrastructure C10 - A place that provides safe, reliable and well managed infrastructure which meets the District community needs and supported maintenance of public health, provision of good connectivity and development of the District. Rationale for Service Delivery The Community Service Group, through its Recreation and Culture activity, provides recreation and cultural facilities and opportunities in order to support the health, well-being and social interaction of the community. Facilities are provided for sport and recreation, events, key historic features are protected and low cost visitor accommodation is provided. Strategic Goals The strategic goals for the Recreation and Culture activity are: Strategic Goal 1: To ensure that adequate recreation and culture facilities are provided for (by either private or public means) for the residents within, and visitors to, the district. Strategic Goal 2: To provide community agreed levels of service in the most cost effective way through the creation, operation, maintenance, renewal and disposal of assets to provide for existing and future users. Strategic Goal 3: To ensure that the long-term operation and maintenance of the Recreation & Culture asset portfolio provides compliant public facilities. Strategic Goal 4: To demonstrate responsible management in the operation, maintenance and renewal of Council owned Recreation and Culture asset portfolio. The Recreation and Culture AMP has been developed to: a) Meet Council s obligations under the Local Government Act 2002 and amendments. b) Provide the linkage between Council s strategic goals for recreation and culture and the current levels of service. c) Provide a detailed description of recreation and culture assets that Council owns and manages. d) Estimate the financial expenditure requirements for the next 10 years including operation, maintenance, renewals and capital expenditure. e) Describe the current valuation of recreation and culture assets. f) Show how assets will be managed in order to achieve levels of service and meet demand for services. g) Identify opportunities for improvement and subsequent implications of those improvements. Effects of Service The Recreation and Culture activity has a number of effects on the local community. Figure S.1: Significant effects of the Service Social Environmental POSITIVE EFFECTS Health and well-being Venues for activity Education Enhancement of individuals self pride POSITIVE EFFECTS Improved amenity values 2 Draft Recreation and Culture Activity Management Plan Doc
205 NEGATIVE EFFECTS NEGATIVE EFFECTS None identified Contamination of Aquatics Centre water need for use of pool chemicals Noise of the activity e.g. the aerodrome Increased activity pressure on natural areas Discharge of Pool water to environment Economic Cultural POSITIVE EFFECTS POSITIVE EFFECTS Draw card to area e.g. aerodrome, Cultural and Arts Centre Events and general attractions e.g. Sheep muster / shears More direct/indirect spending within the District Increased tourism from events/facilities Heritage education Preservation of history Increased variety of activities Promote retention of District character/uniqueness Maintaining heritage landscapes NEGATIVE EFFECTS Not self-funding (Council cost) Ability of users to fund activity NEGATIVE EFFECTS None identified Levels of Service Levels of Service (LoS) are determined by Council s understanding of customer needs as established through regular interaction with facility users including some more formal processes such as exit interviews. This activity includes a diverse range of facilities and therefore considerable effort is required to determine customer expectations, a necessary process in the development of the LoS. Current knowledge of customer expectations is based largely on structured and unstructured surveys which tend to focus on determining overall customer satisfaction rather than gathering qualitative data on the aspects of the service that are important to them and that they value highly. The current LoS have been set with the overarching objectives of ensuring that adequate recreation and cultural facilities are provided for the residents in the District; meeting the required LoS in the most cost effective way, and encouraging community involvement. That said, some LoS, mainly those dealing with health and safety considerations, are driven by legislative requirements. As yet, Council has not carried out any formal consultation with customers on LoS options other than through previous AMP development and previous LTP s. Until tested it is assumed that the current service levels in the maintenance and operational contracts is what is expected by the community. This action is included in the improvement programme and will be greatly reinforced by the information gained from the Leisure Strategy. 3 Draft Recreation and Culture Activity Management Plan Doc
206 Figure S.2: Levels of Service for Recreation and Culture Key Service Criteria Satisfaction Link to Community Outcomes Vibrant Communities Sustainable Infrastructure Prosperous District LOS Statement Provision of effective pool facilities for the community KPI Type of Measure Measure Percentage of community satisfied with the quality of the pool facilities and service in the annual satisfaction survey and research survey results Performance Measurement and Targets Current = > 70% (Actual 64% )) Performance Measurement Procedure = > 70% = > 70% = > 75% Annual resident satisfaction survey results Satisfaction Vibrant Communities Sustainable Infrastructure Prosperous District Provision of effective Arts and Culture facilities for the community KPI Percentage of community satisfied with the quality of the Arts and Culture facilities and service in the annual satisfaction survey and research survey results = > 75% (actual 77% ) = > 75% = > 75% = > 75% Annual resident satisfaction survey results Note: Council reduced the Levels of Service for the Aquatics Centre in 2009 in reaction to financial restraints. The KPI s still reflect the higher LoS and has therefore been reduced. 4 Draft Recreation and Culture Activity Management Plan Doc
207 Key Service Criteria Satisfaction Legal Requirement Legislative Requirements Health and Safety Link to Community Outcomes Vibrant Communities Sustainable Infrastructure Sustainable Infrastructure LOS Statement Public enquiries will be responded to in a timely manner Council s public facilities are provided to standards of fitness for use Pool is safe for use of pool patrons at all times Type of Measure AMP Performance Measure KPI AMP Performance Measure Measure Number of service requests not actioned within three days Current BWOF for facilities with compliance schedules Percentage of staff holding Pool life guard certification Current Performance Measurement and Targets Performance Measurement Procedure Customer service services requests log 100% 100% 100% 100% BWOF log books 100% 100% 100% 100% Percentage of staff holding National Pool Life Guard certification KPI Pool accreditation in place 100% achieved 100% achieved 100% achieved 100% achieved Pool achieves ACC Pool Safe accreditation KPI Number of noncomplying pool water quality readings per year < 5 < 5 < 5 < 5 Analysis of microbiological testing noncompliance with NZS 5826:2 5 Draft Recreation and Culture Activity Management Plan Doc
208 Figure S.3: Key Programmes to Achieve Levels of Service Trend Project Key Service Criteria Forecasted Total Cost Confidence Level in Projections Estimated Timeline for Project Completion Economic Upgrade and Modernise Cultural and Arts Centre First stage completed Satisfaction Sustainability Economic $130,000 ( )) $150,000 ( ) B Additional stages planned for and to completed the upgrade Social Assessment and Improvement of disabled access to all facilities Health and Safety $25,000 D Economic Investigation into provision of joint Community Service services from a common location On Going and included in the Community Development AMP Sustainability Economic $75,000 $37,500 per year C Carry forward Funded over two years and Refer Community Development AMP Economic Waitomo District Aquatics Centre Service Provision contract Satisfaction Sustainability Economic Operational Direct Cost $186,730 less income A Initial establishment for one year to test the outcomes ( ) Ability to continue subsequent years Economic Te Kuiti Aerodrome monitoring Satisfaction Sustainability Economic Percentage cost of income A Completed as part of Management Planning process Draft Recreation and Culture Activity Management Plan Doc
209 Key Programmes to Achieve Levels of Service Other investigatory/strategy type programmes have been identified that, while not impacting on levels of service initially, the outcomes may. These are listed below: Figure S.4: Key Programmes that May Affect Levels of Service Trend Economic Project Reserve Management plan for the Aerodrome Key Service Criteria Legislative Forecasted Total Cost $26,450 funded over two financial years Confidence Level in Projections Estimated Timeline for Project Completion C And Environment Economic Upgrade works associated with the Campground assessments Legislative Quality Satisfaction $151,800 over 3 years Budget actually included in HOP Financials as the facilities are leased. C Carry forward monies available Environment Economic Development of motorhome area and campground at Brook Park to replace existing TK Domain facility Legislative Quality Satisfaction Refer budget above for campgrounds Budget developed and included in EAP process once planning complete C To be programmed Other Promotional material for Councils facilities Quality Satisfaction $20,000 funded over two years $10,00 per year C Funded over two years Carry forward Future Demand The key issues impacting on demand forecasts for Recreation and Culture facilities are: a) An aging population will determine the type of programmes being provided and also drive the demand to provide improved access to facilities, e.g. to accommodate mobility scooters. b) Growth in tourism, particularly in Waitomo and Pureora which has lead to increasing expectations relating to quality. c) The need to develop assets relevant to community needs. An ever-changing ethnic profile and pressure from the community to provide programmes to meet the needs of youth will impact on the relevance of our current assets and drive the development of new ones. d) User pays as a means of funding and addressing equity issues. e) Pressure to maintain and enhance environmental values. f) An increase in public awareness and expectations of higher standards. g) An increase in diversity of recreational opportunities. h) A decrease in District population. i) Increased emphasis on ICT and the poor connectivity within our District. j) A movement from cities and the increasing expectation of services in smaller communities. Through community involvement in policy and facility development, the development of effective partnerships with community groups, community education, and the possible introduction of user charges and continued dialogue with private operators, the Recreation and Culture activity will meet these future demand changes. Capital works projects being planned to meet the growth in demand and enhance facilities include: 7 Draft Recreation and Culture Activity Management Plan Doc
210 Figure S.5: Other Capital Programmes to Meet Growth and Enhance Facilities Trend Project Key Service Criteria Forecasted Total Cost Confidence Level in Projections Estimated Timeline for Project Completion Social Continue implementation of the alarm system at Cultural and Arts Centre Economic Included as part of upgrade programme C Included as part of upgrade programme Strategy Cost Implementation of provision of joint community service services from a common location Economic Unknown Depended on study outcome and included in next AMP and LTP development D From Refer Community Development AMP Recreation and Culture Identified Risks Figure S.6: Identified Risks Asset Affected Recreation and Culture Assets Failure Mode Description Risk Rating Current Mitigation Accidental harm Death High Check for safety issues on a programmed basis Managed Risk Rating Low Recreation and Culture Assets Decline in amenity value deterioration of asset - building, chattels, fixtures and fittings Building décor and assets provided are outdated, and /or insufficient for customer needs High Condition assessments and renewals Low Recreation and Culture Assets Arson Fire High Alarm monitoring and security measures in place will protect commercial buildings but not other building assets Installation of smoke alarms Moderate Three critical assets, where the assessed score is 10 or above, have been identified in the Recreation and Culture Activity Management Plan as detailed below: 8 Draft Recreation and Culture Activity Management Plan Doc
211 Figure S.7 Critical Asset Assessment and Identification Asset matrix 0= No impact 1= Low impact 2= Moderate impact 3= Severe impact Direct Costs (Repair, lost revenue,3 rd damaged, legal costs Effect on Community (loss of supply) Effect on public safety Environmental damage Image / Public support Other Total (sum) Cultural and Arts Centre Waitomo District Aquatics Centre Council to date has not undertaken a risk management plan for Recreation and Culture assets and this is a key issue to be addressed. Existing Situation Described The Recreation and Culture activity covers the following assets: Figure S.8: Summary of Recreation and Culture Facilities Asset Type Quantity Waitomo District Aquatics Centre 1 Reserve and Community Facilities 23 Aerodromes 1 Camping Grounds 6 Cultural & Arts Centre 1 Maintenance and Operations No significant increase in maintenance operations is envisaged within this AMP Independent contractors are responsible for much of the maintenance and renewal of reserves assets although building maintenance is unplanned and on a casual basis and is generally driven by customer complaint or asset failure. Maintenance standards set by Council apply to all asset components identified in contract specifications regardless of their location or profile. Council has reviewed these operations due to difficulties in obtaining competitive tenders in small communities. Several specialist maintenance services will always be provided by external providers on a competitive basis; these include tree maintenance, yearly playground audit and turf maintenance procedures. Councils Internal Services Unit undertakes the maintenance associated with the gardens and lawns and minor maintenance associated with the Recreation & Culture Activity. The Provision of Service agreement with Community Leisure Management for the operation of the Waitomo District Aquatics Centre has some minor maintenance features within the agreement. Regular inspections to assess the condition of Recreation and Culture assets identify future risks and maintenance needs or repair work that is required. The frequency of inspections would be based on the outcomes of any asset failure on levels of service, costs, environmental impacts or corporate image. 9 Draft Recreation and Culture Activity Management Plan Doc
212 Renewals Preliminary assessments indicate that the majority of the assets managed under this activity have been reported as being in an average state of repair, although the condition assessment has highlighted that some assets are reaching the end of their life and require replacement. Some of these more urgent renewals are included in the renewals and refurbishments below. Full asset inventories and condition grading of specialist components, such as the filtration system at the pool, are yet to be undertaken and are included in the improvement plan. Figure S.9: Renewal Programmes Project Key Service Criteria Forecasted Total Cost Confidence Level In Projections Estimated Timeline for Project Completion Waitomo District Aquatics Centre Repaint Cultural and Arts Centre Upgrade Quality Satisfaction $10,000 C Refer to LOS project Miscellaneous renewals at Waitomo District Aquatics Centre (hatch covers, shade sails, fencing, painting Quality Satisfaction Economic $80,000 (4yrs) $15,000 biannually D to From Entrance Footpath / Accessway upgrade to Waitomo District Aquatics Centre Quality Satisfaction $33,000 D Improvements to the taxiways at Aerodrome to improve drainage Quality $10,580 $11,000 $11,000 D (Current) Aerodrome runway resurfacing Quality Satisfaction Economic $20,000 D Replacement pool covers Waitomo District Aquatics Centre Economic $17,000 $17,000 $17,000 B Grandstand Roof Renewal Waitomo District Aquatics Centre Quality $30,000 D Cultural and Arts Centre courtyard redevelopment Quality Satisfaction Refer project LOS D Currently funded 10 Draft Recreation and Culture Activity Management Plan Doc
213 Current Asset Management Practice The following is a snapshot of the current status of Recreation and Culture asset management practices: Some operational processes are documented in service contracts which are casually audited Risk assessments have been undertaken but no forward plan developed Knowledge of assets is limited but improving daily Condition assessments are currently being worked through for Recreation and Culture assets Limited asset utilization information Spreadsheets are used to store data with no link between expenditure and asset Request for service utilised for complaints and enquiries Financial Summary The following budgets have been prepared assuming that all investigatory and strategy type works will lead to future development projects which will be depreciated. For this reason, this AMP has included these works in the Capital/Renewals section of the budgets, noting that the funding source needs to be confirmed in the future, i.e. either capital, renewal or operational. The following summary (S10) outlines the financial implications for the Recreation and Culture Activity has on the overall Community Services Potrfolio. For this specific summary of the Recreation and Culture Activity management Plan financials refer to (S11): 11 Draft Recreation and Culture Activity Management Plan Doc
214 Figure S.10: Financial Summary for Community Services Community Services EAP 2014/15 LTP 2016 LTP 2017 LTP 2018 LTP 2019 LTP 2020 LTP 2021 LTP 2022 LTP 2023 LTP 2024 LTP 2025 Operating Income Parks and Reserves Housing and Other Property Recreation and Culture Public Amenities Total Operating Income Operating Expenditure Parks and Reserves Housing and Other Property 1,079 1,212 1,238 1,093 1,112 1,127 1,127 1,148 1,168 1,188 1,204 Recreation and Culture 1,058 1,115 1,125 1,123 1,139 1,135 1,128 1,174 1,215 1,258 1,303 Public Amenities ,018 1,043 1,073 Safety Total Operating Expenditure 3,728 3,964 3,981 3,940 4,053 4,141 4,210 4,359 4,443 4,522 4,649 Net Operating Cost/(Surplus) 2,924 3,480 3,529 3,452 3,550 3,625 3,678 3,810 3,877 3,937 4,043 Capital Expenditure Parks and Reserves Housing and Other Property Recreation and Culture Public Amenities Total Capital Expenditure 1,364 1, Net Expenditure 4,288 4,544 4,500 3,921 3,881 3,885 3,973 4,064 4,147 4,206 4,366 Funded By Internal Loans Reserves General Rates 1,541 1,435 1,455 1,415 1,423 1,459 1,556 1,610 1,697 1,719 1,741 UAGC 1,430 1,659 1,683 1,636 1,649 1,692 1,797 1,861 1,961 1,994 2,029 Target Rate - Marokopa Hall Target Services Rate - Rural Target Services Rate - Urban Total Funding 4,291 4,545 4,499 3,925 3,880 3,883 3,973 4,067 4,143 4,206 4, Draft Recreation and Culture Activity Management Plan Doc
215 Figure S.11: Recreation and Culture Financial Summary To be inserted 13 Draft Recreation and Culture Activity Management Plan Doc
216 Specific Improvement Projects The following are the priority improvements to this AMP for the planning period: Figure S.10: Specific Improvement Projects SPECIFIC IMPROVEMENT PROJECTS PROJECT YEAR WDC STAFF RESOURCE EXTERNAL ESTIMATED COST Underground services investigations and other data gathering Yes Yes $3,000 in Review operational manuals for Arts & Culture Centre and print booklets Expand recovery plans to sit with risk Analysis Yes No $2, Yes Yes $5,000 Review of Activity Plan Yes No In-House Adoption of funding for three year improvement plan 2015 Yes No Nil Develop detailed asset data associated with Recreation & Culture Assets Yes Unknown $3, $2, Underground services investigations and other data gathering Yes Yes $3,000 in Key Assumptions The following key assumptions relate to the Recreation and Culture AMP: The AMP for Council s Recreation and Culture assets, which form part of the overall Community Service Activity, will be progressively updated as more complete information becomes available over time. Best practice and current knowledge has been used in formulating information regarding the assets in this AMP. This information is not well supported by solid historical data. It is assumed that this information is correct. The annual cost of the contract maintenance of the network will not increase above CPI when it is re-tendered. It is assumed that the population data from the current census is correct. The valuations using rating values are an accurate assessment of the true valuation of the Recreation and Cultural assets. 14 Draft Recreation and Culture Activity Management Plan Doc
217 Introduction 1.1 WDC s Commitment to its Community Council is committed to ensuring that opportunities for recreation and cultural activities are provided within the District. Council currently provides an aquatic facility, a Cultural and Arts Centre, other recreation buildings, Aerodrome and Camping Grounds as part of its commitment in this area. Halls, included in the Housing and Other Property Activity Management Plan also provide facilities for recreation and culture. Council also leases land to others for museum activities and land / buildings for an indoor stadium. It is to be noted that while the library building forms part of the provision of the housing & Other Property Activity Plan with the activities and budgets for the library included in the Community Development Activity Plan 1.2 Why Council Provides the Service Rationale for Service Delivery The Community Service Group, through its Recreation and Culture activity, provides recreation and cultural facilities and opportunities in order to support the health, well-being and social interaction of the community. Facilities are provided for sport and recreation, events, key historic features are protected and low cost visitor accommodation is provided. Council provides a range of facilities that are grouped according to their primary purpose. The different groups of recreation and culture assets that provide leisure and recreation opportunities for residents and visitors to the District and included in this AMP are: Waitomo District Aquatics Centre provide affordable high quality leisure, therapeutic and competitive recreation in an aquatic environment. Aerodrome provides leisure, business and recreation opportunities with an aviation focus. Reserve and Community Facilities provides leisure and sport opportunities with an indoor focus. In leased facilities recreation centre, museum facility. Camp Grounds provides additional low cost visitor accommodation within the District. Waitomo Cultural and Arts Centre provides a large multipurpose Hall in the centre of Te Kuiti. The leased assets form part of the Housing and Other Property Activity Plan cost centres 1.3 The Role of WDC in the Provision of Recreation and Culture Activity Territorial Authorities have numerous responsibilities relating to the provision of recreation and cultural activity. Under the Local Government Act 2002 Council is required to develop community outcomes to meet the current and future needs of communities for good-quality local infrastructure, and local public service. The Recreation and Culture activity directly contributes to the following Community Outcomes: Primary Contribution Vibrant Communities C02 - A place where all age groups have the opportunity to enjoy social, cultural and sporting activities within our district The fabric of any community is not complete without the ability to enjoy personal and communal recreation and to pursue spiritual and cultural fulfillment. That ability to enjoy requires facilities for and access to sports, arts, hobbies, community services, spiritual services, and events of any nature, both personal and public. If Waitomo is to be seen as an attractive place to live and work, the community must enjoy and offer the places and the means, to play, meet or to relax. Secondary Contribution Vibrant Communities C01 - A place where the multicultural values of all its people and, in particular, Maori heritage and culture is recognised and valued. Regardless of history or origin, the people who live in Waitomo seek peace and harmony in their daily lives and the community seeks to maximise use of its collective resources for the benefit of all which is best achieved when all aspects are working in harmony. 15 Draft Recreation and Culture Activity Management Plan Doc
218 Vibrant Communities C03 A place where young people have access to education, training and work opportunities. The youth of today are the future leaders of our District tomorrow. Provision of facilities for education, health and sport assist in developing our youth to enable them to be challenged to become our leaders in the future. Prosperous District C06 - A place that attracts more people who want to live, work and play, and raise a family The provision of a balance of well resourced recreational and cultural facilities attracts families to Waitomo and provides the opportunity to raise their families in a well balanced society Prosperous District C07 - A place where wealth and employment are created through local businesses and tourism opportunities and facilities are developed, facilitated and encouraged Waitomo District actively develops and provides recreational and cultural facilities to support the local business and tourism opportunities developed by the private sector. Well resourced facilities encourage employment opportunities for business and tourism operators. Effective Leadership CO8 A place where the development of partnerships for the delivery of programmes and services is encouraged and pursued. Sustainable Infrastructure C10 - A place that provides safe, reliable and well managed infrastructure which meets the District community needs and supported maintenance of public health, provision of good connectivity and development of the District. Waitomo District seeks to ensure through its budgetary processes and decision making to provide will managed and maintained recreational and cultural facilities. Through these facilities, opportunities and programs are provided and developed that benefit the healthy lifestyle of the residents of the district. How outsiders see Waitomo is vital to individuals making a judgment on whether to invest or live in the District. How Waitomo people see themselves is key to what they show to the world and the perception outsiders have of life in the District. Tourist activity and visitors are a major part of the District's front window to the world outside and as such, a key means of attracting people and investment permanently to the area. Council can promote tourism by providing good facilities for events to be programmed in. 1.4 The Role of Other Parties There are several agencies that also provide recreation and culture which complement the provision of Recreation and Culture by Council. Commercial facilities include: a. Golf courses Piopio, Waitomo b. Tourism adventure facilities - Waitomo Village c. Council s leased indoor recreation centre (basketball and Little Theatre), museum site d. Cycle and walkway providers Non-commercial/community facilities include: a. School pools b. Tennis/netball complexes Piopio tennis complex c. Museums - Mokau 16 Draft Recreation and Culture Activity Management Plan Doc
219 d. Halls indoor recreation and culture e. Marae 1.5 Significant Effects of the Service Significant effects of the Activity are outlined below: Figure 1.1: Significant Effects of the Service Social Environmental POSITIVE EFFECTS Health and well-being Venues for activity Education Enhancement of individuals self pride NEGATIVE EFFECTS POSITIVE EFFECTS Improved amenity values NEGATIVE EFFECTS None identified Contamination of Aquatics Centre water need for use of pool chemicals Noise of the activity e.g. the aerodrome Increased activity pressure on natural areas Discharge of pool water to environment Economic Cultural POSITIVE EFFECTS Draw card to area e.g. aerodrome, Cultural and Arts Centre Facilities for Events and general attractions e.g. sheep muster / shears More direct/indirect spending within the District Increased tourism from events/facilities NEGATIVE EFFECTS Not self-funding (Council cost) Ability of users to fund activity POSITIVE EFFECTS Heritage education Preservation of history Increased variety of activities Promote retention of District character/uniqueness Maintaining heritage landscapes NEGATIVE EFFECTS None identified 1.6 About This Plan Document Structure This document follows the following structure to enable Council to meet its legislative requirements by preparing Asset Management/Activity Management Plans for each of its activities. The pattern being: What our customers want and how well we are doing to achieve it The assets we use (LoS Lifecycles) How we manage the service (Lifecycle Management) Planning for the future demand for the service (Growth) What it costs and how we will pay for it (Financial Summary) Our commitment to excellence (Management Practice and Improvement Programme) Links to Other Plans Activity Management Plans (AMPs) are a key component of WDC planning process that link to the following documents: Long Term Plan (LTP): Defines the strategic direction for the next 10 years. AMPs are prepared to supplement the information in the LTP and confirm the Council s role in achieving Community Outcomes. 17 Draft Recreation and Culture Activity Management Plan Doc
220 Annual Plan (AP): The works identified in the AMP should become the basis on which future Annual Plans are prepared and identify services to be provided in a particular financial year. Contracts: The LOS, strategies and information requirements contained in AMPs are translated into contract specifications and reporting requirements. Bylaws, Standards and Policies: These tools for asset creation and subsequent management are needed to support AM tactics. Reserve Management Plans: Identify the policies and objectives for the management of a reserve or group of reserves and set parameters for development. The links to other plans is shown in the schematic below. Legislation Local Government Act 2010 Resource Management Act 1991 Building Act 2004 Reserves Act 1977 MSC Act 1992 Other Acts Government initiatives Statutory Plans District Plan Reserve Management Plans Services Assessments Sanitary Services Assessments Long Term Plan Strategy Documents Leisure Strategy Track Strategy Open Space Strategy Esplanade Reserve Strategy Library Strategy Te Kuiti Pool Strategy Policy Statements Funding Development Contributions Significance Activity Management Plans Bylaws Annual Plan Annual Report Operations/Maint Plans and Contracts 18 Draft Recreation and Culture Activity Management Plan Doc
221 Levels of Service - What Our Customers Want and How Well We Are Doing To Achieve It 2.1 How our Services Contribute to Community Outcomes The Community Service Group, through its Recreation and Culture activity, provides recreation and cultural facilities to meet the current and future needs of communities for good quality local infrastructure, local public service and social interaction of the community. Facilities are provided for sport and recreation, events, key historic features are protected and low cost visitor accommodation is provided. The Recreation and Culture Activity contributes to the Community Outcomes by: Figure 2.1: Relevant Community Outcomes for Recreation and Culture Primary Activity to: Outcome Contributes How the Recreation and Culture activity contributes Outcome Indicator Effect CO 2 Vibrant Communities A place where all age groups have the opportunity to enjoy social, cultural and sporting activities within our District. By ensuring that we have good Recreation and Culture facilities in our District that will suit tourists, businesses, shoppers, event organisers, and people passing through and the general community. By undertaking a District wide assessment of Council s facilities and producing an adopted Leisure Strategy. People will have good facilities to stage events and undertake recreation. Implementation of Council s adopted Leisure Strategy. 19 Draft Recreation and Culture Activity Management Plan Doc
222 Secondary Outcome Activity Contributes to: How the Recreation and Culture activity contributes Outcome Effect Indicator CO 1 Vibrant communities A place where the multicultural values of all its people and, in particular, Maori heritage and culture is recognised and valued. By promoting Heritage Trails within the District. By actively preserving Heritage Buildings / Sites and promoting partnerships with DOC, Historic Places Trust, Historic Society and the Genealogy Society. People will be aware of our history. Strong partnerships with external parties focussed on sustainability of our Heritage. CO 3 Vibrant Communities A place where young people have access to education, training and work opportunities. By providing modern Recreation & Culture facilities that supports the education, training and recreation of young people. Young people have access to modern Facilities CO 6 Prosperous District A place that attracts more people who want to live, work and play, and raise a family local businesses and development of tourism opportunities By providing adequate and modern recreation and event facilities to attract visitors and residents to our District. By promoting Council s recreational facilities and providing education programmes where required. There will be sufficient modern public facilities to cater for residents and visitors alike. People will be informed about Council s facilities and programmes. 20 Draft Recreation and Culture Activity Management Plan Doc
223 Secondary Outcome Activity Contributes to: How the Recreation and Culture activity contributes Outcome Effect Indicator C0 7 Prosperous District A place where wealth and enjoyment are created through local businesses and tourism opportunities and facilities are developed, facilitated and encouraged By ensuring that we have good Recreation and Culture facilities in our District that will suit tourists, businesses, shoppers, event organisers, and people passing through and the general community. People will have good facilities to stage events and undertake recreation. C10 Sustainable Infrastructure A place that provides safe, reliable and well managed infrastructure which meets the District community needs and supports maintenance of public health, provision of good connectivity and development of the District. By partaking in the Mayoral Forum / Sport Waikato assessment of recreational and cultural facilities for the Waikato Region will ensure a balance of infrastructure readily available to the community Full participation in the Mayoral Forum project and its outcomes 21 Draft Recreation and Culture Activity Management Plan Doc
224 In addition to the outcomes above and through AMPs and other structured documents such as this, Council will ensure that there is long-term planning in the provision of our community facilities and social services to attract new residents, visitors and event promoters to our District and enhance Recreation and Culture in our community. Council has indicated its support of the following activities: Continue proposals to upgrade Council s Cultural and Arts Centre Ongoing development for Brook Park using Brook Park Inc - a major unstructured recreational area included in Parks and Reserves AMP Prepare a Reserve Management Plan for Te Kuiti Aerodrome Enhance the experience and usage of Waitomo District Aquatic Centre Continue with minor upgrades to the Marokopa Campground Investigate and implement a new motor home and campground for Te Kuiti at Brook Park Enhanced monitoring of usage Te Kuiti Aerodrome 2.2 Strategic Goals The strategic goals for the Recreation and Culture activity are: Strategic Goal 1 : To ensure that adequate recreation and culture facilities are provided for (by either private or public means) for the residents within, and visitors to, the district. Strategic Goal 2 : To provide community agreed levels of service in the most cost effective way through the creation, operation, maintenance, renewal and disposal of assets to provide for existing and future users. Strategic Goal 3 : To ensure that the long-term operation and maintenance of the Recreation & Culture asset portfolio provides compliant public facilities. Strategic Goal 4 : To demonstrate responsible management in the operation, maintenance and renewal of Council owned Recreation and Culture asset portfolio. 2.3 Legislative Framework The following legislation impacts on the management of the Recreation and Culture activity: Local Government Act (2010) and Amendments This Act gives Council power of general competence to undertake any business or activity. Provided the activity is consistent with the object of the Act and the community has been consulted in a meaningful way, this can include the protection of reserves and the provision of recreation facilities. Resource Management Act (1991) and Amendments This Act requires WDC to manage the use, development and protection of natural and physical resources in a way, or at a rate, which enables people and communities to implement and review objectives, policies, and methods to achieve integrated management of the effect of the use, development, or protection of land and associated natural and physical resources of the district. Reserves Act (1977) and Amendments The purpose of this Act is to provide the regulatory framework for the management of parks and reserves. It requires Council to classify the different types of reserves and to specify their purpose. The Act also requires Council to protect, to an extent compatible with the principal or primary purpose of each reserve, the scenic, historical, archaeological, biological, geological or other scientific features and indigenous flora and fauna and wildlife. In addition, the Act specifies the statutory procedures for managing each reserve as well as the preparation and development of management plans for each reserve subject to the Minister's approval. Building Act (2004) and Amendments The purpose of this Act is to ensure that any building work undertaken within the area of a Local Authority complies with the building code. Council currently administer the powers of this Act and its regulations to ensure that buildings in the District meet the code of compliance. Health and Safety in Employment Act (1992) and Amendments The purpose of this Act is to ensure that employers provide safe working conditions for their employees in the workplace. Council has taken steps to ensure that its employees are provided with safe working conditions and that other persons are protected in workplaces. Airport Authorities Act (1966) The purpose of this Act is to provide the regulatory framework for the ownership, operation and management of airports. 22 Draft Recreation and Culture Activity Management Plan Doc
225 Civil Aviation Act (1990) The purpose of this act is to establish rules of operation and divisions of responsibility within the New Zealand civil aviation system in order to promote aviation safety; to ensure that New Zealand s obligations under international aviation agreements are implemented; and to consolidate and amend the law relating to civil aviation in New Zealand. Health Act (1956) and Amendments The purpose of this Act is to ensure that every territorial authority is responsible for the improvement, promotion and protection of public health within its District. This includes the regulation of recreation and cultural facilities such as camping-grounds. Camping-Ground Regulations (1985) Regulations promulgated under the provisions of the Health Act 1956 prescribe standards of campingground amenities and facilities and guide the management of camping-grounds. Other Waitomo DC Plans and Bylaws The Waitomo District Plan, Reserve Management Plans and Bylaws also impact on the management of recreation and culture facilities. 2.4 Our Customers Who Our Customers Are In order to provide an efficient level of service, Council needs to identify its potential customers. For recreation and cultural assets, the key customer groups include: Figure 2.2: Potential Customers External Internal District community at large Council staff and Contractors Cultural groups Elected representatives Incorporated societies, e.g. Genealogical, Historical Society Lessees and license holders Users of facilities Museum bodies Department of Conservation Community groups, e.g., Schools, Wintec, childcare org. Sporting groups, i.e. swimming clubs Schools Event Organisers Tourists and other visitors Sport Waikato Local Iwi Customer Expectations This activity includes a diverse range of facilities and therefore considerable effort is required to determine customer expectations. Current knowledge of customer expectations is based largely on structured and unstructured surveys which tend to focus on determining overall customer satisfaction rather than gathering qualitative data on the aspects of the service that are important to them and that they value highly. Council has historically commissioned the Versus survey intermittently over the last ten years (now an internal survey sent to all ratepayers in the District) in order to identify how well Council is performing in terms of the services offered to the community for the major facilities in this AMP. The survey provides satisfaction information which enables comparisons within the activity over a period of time. Unfortunately gaps appear in the survey and the chronological order is incomplete. Also some areas of this activity are incomplete and it is the Community Service Group s intention in the future, to undertake yearly direct user satisfaction surveys for those activities. This Versus survey utilises various telephone interviews or direct user interviews and the random telephone surveys are structured to be representative of the various wards in the District. The new ratepayer survey is paper based. Results showing the percentage of the two survey recipients who consider that their satisfaction is either good or excellent for the various activities from are shown below: 23 Draft Recreation and Culture Activity Management Plan Doc
226 Cultural and Arts Centre Figure 2.4 below also shows a decline in satisfaction for the Cultural and Arts Centre in the period up to Over this period four issues have impacted on satisfaction. Firstly the roof replacement programme to fix several leaks that were affecting the use of the facility which left some of the internal finishing in a poor state of repair, the poor condition of the airconditioning that has now gone through a renewal programme, the inadequate sound system for the type of facility which has been replaced as part of the upgrade and the general tired condition of the internal fitout. While the roof and airconditioning and sound system has been renewed, the internal fitout renewal is an ongoing process and is continued in the renewals programme of this plan over the first two years. These renewals programmes appear to be arresting the decline in satisfaction, although results are variable partly due to an increase in dissatisfaction during upgrade periods. Samples of users in 2004 and 2006 (12 and 16 respectively) are not considered large enough to give reliable data. The sample in are community samples and not just users so they are a much better gauge of community satisfaction. For the 2014 year WDC embarked on an internal ratepayer survey giving all ratepayers the opportuniry to respond Figure 2.4: Percentage Satisfied with the Cultural and Arts Centre Percentage (%) l Year Note: no surveys were underetaken 2005 and 2007, user survey only except for 2008 Note Don t know votes have been deleted for the purposes of calculating the percentages Aquatics Centre Figure 2.5 gives satisfaction data for the district swimmming pool. The 2003, 2004 and 2006 samples were again very small and based around users only with the samples being large district wide surveys. These are the most accurate and show a low satisfaction level between 50-63%. During 2007 and 2008 a well publicised issue relating to opening hours and running costs was aired publically and it is believed that this is still influencing the satisfaction outcome. Council in 2009/2010, during the annual plan process, resolved to fund the pool for a seven month a year operation to reduce the burden of cost on the ratepayers. Satisfaction is anticipated to slowly improve as a result of the new filtration system constructed at the pool in the seasons and a new management structure. While this has transformed into an improved satisfaction there is still considerable room for improvement. Beginning with the 2014/2015 season an Operational contract has been negotiated with Community Leisure Management and it is believed that their expertise in pool administration, management and provision of activities will influence further the upward trend. 24 Draft Recreation and Culture Activity Management Plan Doc
227 Figure 2.5: Percentage Satisfied with the Aquatics Centre Facilities Percentage (%) l Year Note: no surveys were undertaken 2002, 2005 and 2007, user survey only except for 2008 Overall Overall, in the mid 2000 s, each trend measured in Recreation and Culture was trending down, but has appeared to either be stabilised or reversed the trend. Some of the original downward trend could be resulting from switching between user surveys and District surveys, noting that the surveys are totally district wide. Controversy over the expenditure and the level of funding for the Aquatics Centre facility will have directly impacted on the 2008 figure. Further internal user surveys by Council staff are required to gauge the impact of decisions directly on users. No satisfaction survey information is available for other areas of this AMP. 2.5 Other Stakeholders In order to provide an efficient Level of Service (LoS), Council needs to identify its potential stakeholders and work with them to provide an efficient, well resourced and well used activity. For recreation and culture assets, the stakeholders include: Figure 2.6: Potential Stakeholders Aquatics Centre Swimming Club Sport Waikato Ministry of Health Schools Fitness Groups General Public Cultural and Arts Centre Aerodrome Camp Grounds Event Promoters Funeral Director Tourist Operators Arts/ Drama Societies Individual hirers Civil Aviation Environment Waikato Te Kuiti Aero Club Commercial Fertilizer Companies Other Aero Clubs Visitor Information Network Campground Lessees Tourist Operators Ministry of Health Tourists 2.6 Service Delivery Options Considered Private plane operators Pilot training schools Potential business operators Levels of Service (LoS) are determined by Council s understanding of customer needs as determined through regular interaction with facility users including (to be established) more formal processes such as exit interviews (especially for the Aquatics Centre and Arts & Cultural Centre). As yet, Council has not carried out any formal consultation with customers on LoS options with the exception of Annual Plan consultation documents and feedback related to the hours of operation for the Aquatics Centre. 25 Draft Recreation and Culture Activity Management Plan Doc
228 Feed back is however gathered through the annual satisfaction survey that directly relates to the level of Service provided at the individual facility being surveyed. Council s role in the provision of services in the Recreation and Culture activity is largely historical. Council will need to enter into agreements with community groups for the provision of services in the future. Some examples of these are, or could be: Council, in conjunction with the development of a Reserve Management Plan for the Te Kuiti Aerodrome, develop a procedure for the administration of the aerodrome in conjunction with a user committee. Sports Centre building lease. Investigate partnerships for the provision of services in a more cost effective manner through the sharing of facilities with other community groups. Partnership with an aerodrome monitoring company for the provision of monitoring to assist with user charges 26 Draft Recreation and Culture Activity Management Plan Doc
229 2.7 Current/Target Levels of Service Strategic Goal 1: To ensure that adequate recreation and culture facilities are provided for (by either private or public means) for the residents within, and visitors to, the district. Figure 2.7: Customer Levels of Service for Recreation and Culture Key Service Criteria Link to Community Outcomes LOS Statement Type of Measure Measure Current Performance Measurement and Targets Performance Measurement Procedure Satisfaction Vibrant Communities Sustainable Infrastructure Prosperous District Provision of effective pool facilities for the community KPI Percentage of community satisfied with the quality of the pool facilities and service in the annual satisfaction survey and research survey results Note : new survey methodology since 2013 = > 70% (Actual 64% ) = > 70% = > 75% = > 77% Annual customer satisfaction survey results Satisfaction Vibrant Communities Sustainable Infrastructure Prosperous District Provision of effective Arts and Culture facilities for the community KPI Percentage of community satisfied with the quality of the Arts and Culture facilities and service in the annual satisfaction survey and research survey results Note : new survey methodology since 2013 = > 75% (actual 77% ) = > 77% = > 79% = > 80% Annual customer satisfaction survey results Note: Council reduced the Levels of Service for the Aquatics Centre in and there the LoS satisfaction started from a very low base. With the filter improvements and now the operational; contract in place a gradual improvement is anticipated. Note : satisfaction surveys are currently undertaken internally by providing all ratepayers with the opportunity to complete the survey 27 Draft Recreation and Culture Activity Management Plan Doc
230 Strategic Goal 2: To provide community agreed levels of service in the most cost effective way through the creation, operation, maintenance, renewal and disposal of assets to provide for existing and future users. Figure 2.8: Technical Levels of Service for Recreation and Culture Key Service Criteria Satisfaction Link to Community Outcomes Vibrant Communities LOS Statement Public enquiries will be responded to in a timely manner Type of Measure AMP Performance Measure Measure Number of service requests not actioned within three days Current Performance Measurement and Targets Performance Measurement Procedure = < 16 = < 15 = < 14 = < 14 Customer service services requests log Strategic Goal 3 : To ensure that the long-term operation and maintenance of the Recreation & Culture asset portfolio provides compliant public facilities. Key Service Criteria Legal Requirement Link to Community Outcomes Sustainable Infrastructure LOS Statement Council s public facilities are provided to standards of fitness for use KPI Type of Measure Measure Current BWOF for facilities with compliance schedules Performance Measurement and Targets Performance Measurement Current Procedure 100% 100% 100% 100% BWOF log books 28 Draft Recreation and Culture Activity Management Plan Doc
231 Strategic Goal 4 : To demonstrate responsible management in the operation, maintenance and renewal of Council owned Recreation and Culture asset portfolio. Key Service Criteria Legislative Requirements Health and Safety Link to Community Outcomes Sustainable Infrastructure LOS Statement Pool is safe for use of pool patrons at all times Type of Measure AMP Performance Measure Measure Percentage of staff holding Pool life guard certification Performance Measurement and Targets Performance Measurement Current Procedure 100% 100% 100% 100% Percentage of staff holding National Pool Life Guard certification KPI KPI Pool accreditation in place Number of noncomplying pool water quality readings per year 100% achieved 100% achieved 100% achieved 100% achieved Pool achieves ACC Pool Safe accreditation <5 < 5 < 5 <5 Analysis of microbiological testing noncompliance with NZS 5826:2 29 Draft Recreation and Culture Activity Management Plan Doc
232 It is to be noted that indicators shown as AMP performance measure or Management Tools are for internal management use only. They are not designed to be reported publicly as part of the performance of the Community Service Group. They are not designed to be audited to any of the standards and requirements which pertain to performance measures which are used to report to Council and the community. Council considers that these indicators are valuable for internal management purposes, but for various reasons they are not suitable for reporting at Council nor at a community level. Reasons for this may include concerns (sometimes marginal) around: Relevance Realism / ability of Council to control performance Verifiability Neutrality Robustness Perverse incentives; or Metadata issues, including Collection methods Monitoring frequency Data storage Quality assurance systems Intended use. These internal management indicators are reviewed, and appropriate remedial action is undertaken, on an ongoing basis. 2.8 Key Performance Indicators Council monitors the achievement in the Key Service Criteria identified above, through the analysis of the data produced by the different inspections, surveys and audits as they relate to the specific activities. The Key Performance Indicators directly relate to meeting the target Levels of Service as measured using the Performance Measures identified. The achievement of the Target Levels of Service is linked to the successful completion of the programmes and projects identified in 2.10 below. 2.9 Trends Impacting on Level of Service (possible future changes/service level review) Environmental There is a trend for the public to be more quality conscious in relation to the environment. Standards for water quality and discharges at the pools will always be under review by Government agencies Economic Future growth in tourism and events will lead to increasing expectations relating to quality of facilities provided. An aging population will determine the type of leisure programmes being provided and also drive the demand to provide improved access to facilities, e.g. to accommodate mobility scooters/disabled access There is an increasing pressure to provide programmes to meet the needs of youth whose numbers in the District are above the national average. It is recognised that young people living in small towns do not have access to a wide range of leisure activities. Changing work patterns mean that people have to regularly retrain and seek alternative employment opportunities, increasing the pressure on services and resources which support career development or retraining. (E.g. computers for job searching and Curriculum Vitae (CV) development) An expectation by the public, that Council will provide services in a more cost effective manner, which may mean the need to combine different Council and community activities to provide efficiencies of scale Social Escalating rates of obesity and type two diabetes, due to inactivity and poor diet, has seen an increasing focus in strategies to improve health through physical activity. District Health Boards and Sport Waikato have developed and are implementing Active Community Programmes which are focussed on increasing 30 Draft Recreation and Culture Activity Management Plan Doc
233 physical activity levels. It is expected that these programme will further increase utilisation of Council parks and other leisure facilities (pool). There is a trend away from structured recreation (e.g. from lane swimming to informal casual leisure activities) which could lead to further utilisation of Council s facilities. Affordability and sustainability are key principles for WDC and will be drivers in WDC s investigations into provision of services from a joint facility. Other peripheral organisations such as Te Kuiti Community House have formed part of these on going investigations and have benefitted from space being available from vacated Council buildings Cultural Higher than average Maori population (32.5%) ( based on 2013 census) in the community could lead to demand for a different mix of activities to those currently provided and may reflect in some of the dissatisfaction with Council s facilities Confidence Levels and Assumptions for Stated Trends Refer to Section 6.5 for Grading Definitions. Figure 2.9: Data Confidence Levels Trend National Demographic trends sourced from National Institute of Demographic and Economic Analysis (Waikato University) Maintenance and renewal workload trends sourced from Council and contractors records Leisure trend information source from SPARC, older Hillary Commission documentation, New Zealand Recreation association, Mayoral Forum Sports Initiative Confidence Level A C A 31 Draft Recreation and Culture Activity Management Plan Doc
234 2.10 Key Programmes to Maintain and Achieve Levels of Service Council is implementing a number of projects to achieve the LoS. These range from facilities/equipment works to process improvement projects. The projects are split into two categories: Key Programmes to achieve LoS, and Key Strategies impacting on future LoS. The table below summarises the major projects, their forecasted total cost to Council and an assessment of the confidence in the projections: Key Programmes Figure 2.10: Key Programmes to Achieve Levels of Service Trend Project Key Service Criteria Forecasted Total Cost Confidence Level in Projections Estimated Timeline for Project Completion Economic Upgrade and Modernise Cultural and Arts Centre First stage completed Satisfaction Sustainability Economic $130,000 ( ) $150,000 ( ) B Additional stages planned for and to completed the upgrade Social Assessment and Improvement of disabled access to all facilities Health and Safety $25,000 D Economic Investigation into provision of joint Community Service services from a common location Sustainability Economic $75,000 $37,500 per year C Funded over two years and On Going and included in the Community Development AMP Refer Community Development AMP Economic Waitomo District Aquatics Centre Service Provision contract Satisfaction Sustainability Economic Operational Direct Cost $186,730 less income A Initial establishment for one year to test the outcomes ( ) Ability to continue subsequent years Economic Te Kuiti Aerodrome monitoring Satisfaction Sustainability Economic Percentage cost of income A Completed as part of Management Planning process Draft Recreation and Culture Activity Management Plan Doc
235 Key Strategies Impacting on Future Levels of Service Figure 2.11: Key Programmes that May Affect Levels of Service Trend Economic Project Reserve Management plan for the Aerodrome Key Service Criteria Legislative Forecasted Total Cost $26,450 funded over two financial years Confidence Level in Projections Estimated Timeline for Project Completion C And Environment Economic Upgrade works associated with the Campground assessments Legislative Quality Satisfaction $151,800 over 3 years Budget actually included in HOP Financials as the facilities are leased. C Carry forward monies available Environment Economic Development of motorhome area and campground at Brook Park to replace existing TK Domain facility Legislative Quality Satisfaction Refer budget above for campgrounds Budget developed and included in EAP process once planning complete C To be programmed Other Promotional material for Councils facilities Quality Satisfaction $20,000 funded over two years $10,00 per year C Funded over two years Carry forward Description of Key Programmes Cultural and Arts Centre Upgrade Council has taken the opportunity to review the interior décor and functionality of the Cultural and Arts Centre as a result of the flooding problems that occurred in Minimal maintenance had been undertaken internally since the buildings construction in the early 1980 s and the internal fit-out is showing signs of deterioration. An architectural scheme has been prepared and budget costs established. Stage one of this upgrade was undertaken in the 2010/2011 financial year and stage two 2013/2014 year, three and four is funded and completed in subsequent years. Balance of the funding included and should improve user satisfaction of the facility. Improvement of Disabled Access to All Facilities Council has a statutory obligation to ensure its facilities meet current standards in relation to disabled access and each building needs reviewing and a programme of upgrades implemented. No assessment has been undertaken in relation to requirements for this work. Investigation into provision of joint community facilities services from a common location Council has expressed an interest in the investigation of the provision of multiple services from a single location to take advantage of economies of scale and a better service to the public. This project allows for the full investigation into options so that informed decision making can be undertaken leading into the 2015 review of the Long Term Plan if required. This project has however been delayed during the Exceptions to annual planning process. Waitomo District Aquatics Centre Service Provision Contract It is well documented that when WDC adopted a seven month operation for the Aquatics Centre that difficulties would and have occurred in relation to the provision of a well resourced, trained work force for the operations of the pool. Due to the geographic location of Te Kuiti, the seasonal nature of the positions available and the skill levels required for effective and legal operation of the aquatics centre WDC has been unable to satisfactorily been able to provide the required service level. WDC entered into a provision of service contract with Community Leisure Management (CML) for the season and if successful will be continued with several rights of renewal. As a specialist provider of such services, CLM have access to staff and training. 33 Draft Recreation and Culture Activity Management Plan Doc
236 Te Kuiti Aerodrome monitoring In 2009 WDC sought advice for the provision of a monitoring system for the Te Kuiti Aerodrome to assist in the revenue collection from users of the aerodrome. However, WDC were poorly advised on the ability of the camera system as were other minor aerodromes in the region. It is recommended that a system based on radio calls be established as part of the development of the Reserve Management plan. Aerodrome Reserve Management Plan Council is statutorily obliged to prepare a Reserve Management Plans for all of its reserves. This will give direction for the future development of the aerodrome and provide guidance as to how this reserve should best be managed for the benefit of the community. This project is currently scheduled in the existing AMP fop completion Campground Compliance Assessments Campground regulations set standards for the provision of campground facilities and are managed under the Health Act. Council leases three campgrounds to private operators and has obligations relating to the facilities that are leased, when assessed against the regulations. Council has undertaken a preliminary assessment of these campgrounds in 2010/2011 which has identified works in three categories immediate, essential and low priority. Works associated with the provision of a new water tank and ablution facilities have been addressed in earlier years and as well some building improvements are scheduled at the Marokopa Campground, no work has been undertaken at TK Campground. Due to the condition and location of the Te Kuiti Location, and the need to cater for motor homes, WDC has embarked on a development facility at Brook Park The parking are at Piopio has been upgraded and drainage installed. Development of Motorhome Area and Campground at Brook Park WDC considered as part of the 2009LTP the requirements for the upgrade works required for the Te Kuiti campground which is currently located on road reserve (effectively esplanade) and Te Kuiti Domain. The identified poor condition of the existing facility and the need to provide for other users (eg motorhomes) meant that WDC left the budget requirement intact while alternatives for this development were investigated. The new facility is to be developed with Brook Park but as yet to be scoped. While no specific budget has yet been established, the existing budgets approved in the 2009 LTP are available for this work. Promotional material for Councils facilities Council owns four key assets in the Recreation and Culture Activity. No promotion is undertaken in relation to these facilities and little promotional material is available to the District and surrounding region. Council needs to produce good quality promotional material so as to maximize usage and consequently income from these assets. 34 Draft Recreation and Culture Activity Management Plan Doc
237 Growth Planning for the Future and Demand for the Service The key issues potentially impacting on demand forecasts for Recreation and Culture are: a. An aging population and a higher proportion of under 15 year olds in the population b. The need to develop assets relevant to community needs c. User pays as a means of funding and addressing equity issues d. the low socio-economic demographics for our region e. Pressure to maintain and enhance environmental values f. An increase in public awareness and expectations of higher standards g. An increase in diversity of recreational opportunities h. Apparent stabilisation / minor decrease in District population i. Governmental emphasis on fitness j, Increasing tourism to our District k. The need to provide services in a more efficient manner 3.1 Population Growth and Structure The following information has been sourced from a paper prepared by the National Institute of Demographic and Economic Analysis (Waikato University) for the Waikato Regional Council in August Council has chosen to use these population forecasts for the LTP as Statistics New Zealand Forecasts for the planning period are not available until The graph below presents the 2013-base medium population projection for Waitomo District to 2063, along with historical population estimates from Statistics New Zealand back to The 2006-base Statistics New Zealand (SNZ) high, medium and low projections (October 2012 update) are also included for comparison. The NIDEA projections show a continuing trend of declining population for Waitomo District with a projected population of 8,743 in These projections follow the recent trend in the District s population reasonably closely, with annualised population decline over the period of 0.5% per year (base year projection is different to actual). 35 Draft Recreation and Culture Activity Management Plan Doc
238 Figure 3.1: Baseline Medium Population Projections for Waitomo District and Comparison with Statistics NZ (2012) Subnational Projections Current Pattern of Building and Subdivisional Development As in the previous section the population growth for the District is projected to be static and/or in decline. Historic trends of pockets of sub divisional and building activity in the form of modest lifestyle development around Te Kuiti, Waitomo Village, Mokau, and Awakino are also slowing. The sub divisional activity that was occurring in and around the Te Waitere area has slowed in recent years. Over the last five years there has been an average of 12 new dwellings constructed per year. In terms of subdivisions the average number of lots created over the same period has been 3. Whilst 151 new lots were consented over the last five years only 63 new dwellings were actually consented. While this is partly due to the delay between subdivision approval and building construction, there is also a backlog of undeveloped lots in the District which need to be factored into planning considerations. Future Subdivisional Activity From a recent, informal, desktop planning exercise, drawing from development proposals which are known to officers and/or are in the early stages of consent processing, it has been identified that further growth is unlikely to place pressure on the provision of Council services. Indications are the recent trends of relatively slow development are likely to continue in to the foreseeable future. The demographic and development trends show that there is no demand for growth related infrastructure at the present time or in the foreseeable future. For the past few years Council has been working on improving the condition of its core infrastructure assets, particularly in the Water Supply and Sewerage activity areas, in order to support public health outcomes and to meet its Resource consent and other legislative requirements. The growth and development trends support an approach which continues to upgrade and maintain existing assets as opposed to the development of new capacity driven infrastructure. There is currently enough capacity in the infrastructure network to allow for minimal growth should it occur 36 Draft Recreation and Culture Activity Management Plan Doc
239 Council does not anticipate any significant land-use changes during the period of this LTP. Potential societal change factors The age structure of the Waitomo District is among the more youthful in the Waikato Region (fourthyoungest in 2013) and experiences the least degree of population ageing. In 2013, 14.2 percent of the population is aged 65 years and over, and this is projected to increase to 19.4 percent by The proportion of the population under 65 years of age is relatively high at 85.8 percent in 2013, 82.8 percent in 2033 and 68.7 by The ratio of elderly persons to children increases slightly from 0.61 in 2013 to 0.98 in 2033, before increasing markedly to 2.71 in Igure 3.2 : Age-Sex structure for Waitomo District, 2013 and 2013 (medium projection) The District s population characteristics, which include a high proportion of Maori, can be expected to translate into demand for compatible services, e.g. community infrastructure in the form of increased recreational and cultural facilities. Council considers these changes have been adequately catered for in its LTP. Any departure from this assumption can be addressed during the 3-yearly review of the Plan. 3.2 Demand Projections Economic Trends Some of the economic trends expected to impact on the long-term provision of recreational and cultural services include the continual increase in part-time, shared position employment. People in this group will have the time but limited means to access recreational facilities and services. A further trend is the provision of private leisure services, especially associated with the tourism industry. These will provide for a group of people who are willing and able to pay for private leisure services. The likely impact of these trends will see Council respond by providing cost relevant leisure facilities and services to the community in order to ensure the entire public have access to services that enable them to enjoy the benefits of leisure participation. In addition, Council may be seen as competitors in the leisure market for the leisure consumer, a matter which private leisure service providers may be concerned about. Council s role as a leisure provider is to provide services and facilities to improve the community s well-being Social Trends The most important social trend is the effect of the aging population for Waitomo where recreational and cultural facilities will need to adapt to cater for this increasing age group. Also, Waitomo has a higher than average population under the age of 15 years, again potentially affecting provision of such things as activities at the Aquatics Centre. 37 Draft Recreation and Culture Activity Management Plan Doc
240 Another trend is changing lifestyles, unemployment and the issues created and some people work longer hours and want access to invigorating leisure activity, whereas some people do not work and want access to affordable and convenient leisure services. Hours that the Recreation and Culture facilities operate may need to be reviewed over time to cater for this trend The likely impact of these trends will see Council respond to its social responsibility by ensuring that all members of the community have access to alternative type leisure facilities and services, such as ecotourism and intellectually challenging leisure activities to suit their particular needs Leisure Trends Some of the leisure trends expected to impact on the long-term provision of recreational services include a shift from traditional sports to alternative sports, and a shift from team sports to individual participation sports. In general, especially in the older age group, team sports like rugby, netball, rugby league and soccer are experiencing a decline in participation rates, whereas individual sports and recreation like indoor rock climbing, athletics, swimming, recreational flying, reading and mountain biking are experiencing an increase in participation rates. A further trend is the reluctance of people to participate in physical contact sports who are now choosing passive sports. Yet a further trend is the growth in sports tourism which has an emphasis on entertainment. Anecdotal evidence suggests that organised children s and junior sports are experiencing a revival, especially with soccer and some cricket. This, however, does not seem to flow on to the senior grades. The likely impact of these trends will see Council respond by providing facilities and services that enable people to participate in individual sports by amending programmes within our facilities Age Structure An aging population will influence the type of leisure programmes being provided and may require an adjustment to programmes provided, e.g. Aquasize at the pool, as well as the ability of Council s facilities to cater for the elderly. Increasing demand for youth activities with a higher than average youth population, 26.1% under the age of 15, will impact on type of provision, especially physical activities associated with the pool complex and catering for the increasing numbers joining the swim clubs Implication of Trends Leisure services need to be more relevant to the recreational needs of various groups in the community including the elderly, the young, unemployed, women, low wage income earners and ethnic groups. The possible increase in conflict between different facility users needs to be addressed due to the diversity of leisure preferences for: a) Informal recreation b) Recognition of the decline in formal team sports club activities, c) Communities want more input into the development of plans for leisure facilities and activities d) Increasing public expectations for high quality leisure facilities and services e) Recreational facilities and services that are accessible to the entire community including disabled access f) Passive leisure 3.3 Ability of the Recreation and Culture Activity to Respond An expected impact identified is an increase in the demand for alternative services/programmes, as opposed to traditional facilities and assets. To manage this demand Council will provide a more diverse range of activities/facilities taking into consideration social and economic trends in order to meet the changing needs of the community. Eg the use of a specialist provider at the Waitomo District Aquatics Centre enables the provision loaf a more diverse range of activities. This will be investigated as part of Council s Leisure Strategy but it is believed that any requirements can be met by potential reallocation of existing facilities and resources and amending the delivery programs to meet the requirements of the day. Another impact is the expected stabilisation in the District population, which, in conjunction with the impact of social and economic trends could possibly lead to less demand on current recreation and cultural assets. 3.4 Demand Management The objective of demand management is to modify customer demands for services in order to maximise utilisation of existing assets. This can be achieved by focusing planning on maximising benefits to customers rather than on maximising the outputs from assets. The following strategies enable this objective to be met: 38 Draft Recreation and Culture Activity Management Plan Doc
241 a) Involving the community in policy and facility development, and where practical devolving accountability for operating recreation services back to the community. Eg Brook Park Inc in the campground development. b) Developing effective partnerships with community groups such as schools, user groups and the private sector organisations for the provision of recreation services. c) Recovering costs by charging users, taking into account their ability to pay, assessing public and private benefit, as well as Council objectives for community participation in leisure. d) Investigating the feasibility of establishing a system of differential charges to encourage use outside of peak utilisation periods. e) Encouraging participation in a range of recreational experiences by actively promoting opportunities for all levels of age and ability. f) Regulating the use of facilities to ensure the community has access to quality facilities by adopting and enforcing appropriate bylaws. 3.5 Key Programmes to Meet Growth and Demand Strategy Council s proposed Leisure Strategy (included in Parks and Reserves budget) will assess trends and look at the impacts on existing facilities and identify opportunities for rationalisation of services. Council will however, primarily adopt the strategy of reallocation of resources rather than development of new resources. It is believed this will be possible due to changing demands and the expected stabilisation in the population Tactics Council s intention is to practise good demand management in order to maximise utilisation of existing assets to meet the different types of growth, primarily related to an aging population and increasing young people. Promotional material is required for all of Council s facilities to make the community aware of their assets as well as promoting them to promoters of events. This is included as a LOS project funded over three year period Costs Most capital expenditure is Level of Service/renewal expenditure related, rather than growth related. Council proposes to fund growth related capital expenditure primarily by internal loans plus funding from future development contributions when and if established. Completion of Council s various strategies and Activity Management Plans will assist in identifying future capital expenditure models. Capital works projects being planned to meet the growth in demand and enhance facilities include: Figure 3.6: Other Capital Programmes to Meet Growth and Enhance Facilities Trend Project Key Service Criteria Forecasted Total Cost Confidence Level in Projections Estimated Timeline for Project Completion Social Continue implementation of the alarm system at Cultural and Arts Centre Economic Included as part of upgrade programme C Included as part of upgrade programme Strategy Cost Implementation of provision of joint community service services from a common location Economic Unknown Depended on study outcome and included in next AMP and LTP development D From Refer Community Development AMP Continue implementation of the Alarm System at Cultural and Arts Centre Historically the Civic Centre, one of Council s most valuable assets has not had an alarm system with the exception of fire. As each upgrade stage is undertaken a full monitored alarm system is installed. While 39 Draft Recreation and Culture Activity Management Plan Doc
242 this is a new capital item, the monetary allowance has been included in the LOS upgrade monies for the Cultural and Arts Centre. Implementation of Provision of Joint Community Service Services from a common location Noted, but dependent on investigation outcome and Council s decision-making process leading in to the 2015 Long Term Plan development. It is anticipated that no major facilities will be constructed as a result of growth with the exception of the possible development of community facilities from a common location which would be dependent on the investigatory phase. 3.6 Confidence Levels and Assumptions The population trends born out of the statistical analysis of the 2006 census are inherently inexact results and approximations. They rely on the robustness of the original collection methodology and base data, as well as that of the statistical manipulation. This analysis assumes that the base information is accurate. The data used in the section has been grade C as per the confidence grading scale explained in 6.5 below. 3.7 Risk Management Risk management is all about limiting the consequences of failure in our assets and limiting the likelihood of this failure through a robust renewals programme. See Section 5.5. Risk is also about Council s ability to meet future demand and changes. Council believes that the existing Recreation and Culture facilities are more than adequate to meet the demands of a stabilised population and that any minor changes required can be met through reallocation of resources with amendments to existing programs. This philosophy will be confirmed through the Leisure Strategy. 40 Draft Recreation and Culture Activity Management Plan Doc
243 The Assets We Use 4.1 Description of Asset Base Figure 4.1 identifies the scope of assets covered by the Recreation and Culture activity within the Waitomo District. (A detailed breakdown asset list for reserve and community facilities is in the base information for this Activity Plan. Figure 4.1: Summary of Recreation and Culture Facilities Asset Type Quantity Aquatic Facilities 1 Reserve and Community Facilities 23 Aerodromes 1 Camping Grounds 6 Cultural & Arts Centre Critical Assets Aquatic Facilities Aquatic facilities provide high quality leisure and competitive recreation opportunities in a water-oriented environment and enhance the community s leisure experience. Council s Aquatic complex is located in Te Kuiti. There are two rectangular pools constructed around 1939 and include a toddlers facility of 42m 2 (31m 3 ) and the main pool of 330m 2 (520m 3 ) as well as other facilities such as shade areas, grandstand, furniture and fittings, and services and structures to enhance the visitor s/users experience. It is believed the buildings were constructed around An upgrade of the facility in recent times has seen a new entrance / office constructed in 2007, heating efficiency upgrade in 2010 and a renewal of the filtration plant and building in These were available for the 2010/2011 season. Cultural and Arts Centre The Cultural and Arts Centre is located in Te Kuiti. This facility was built utilising funds raised by the community and Council and is used extensively for community events as well as for private hire. It was constructed in 1980 and is showing signs of a need for refurbishment. The outdoor garden area also needs refurbishment / redevelopment and is included in the LoS projects The centre is 1,308m 2 in total area and has a registered capacity of 1,267 people at any one time. The area consists of the following facilities: The main foyer, suitable for weddings, seminars or functions for up to 50 people or indoor wedding area for up to 200 guests. This area has been completely refurbished as stage one of Councils refurbishment programme in the 2010/2011 financial year. Supper room for weddings, seminars, birthdays for up to 150 guests and has been completely refurbished in year. This area has a fully serviced commercial kitchen which will form a future stage. Main hall for major events for up to 720 participants. The main hall includes a raised stage of approximately 140m 2 and upstairs dressing rooms. The ceiling and walls have been refurbished Outdoor garden courtyard area used in conjunction with the supper room and is available for weddings and birthdays and is currently scheduled for refurbishment Each refurbishment to date has included the provision of sound system and security features All areas are fully air-conditioned and heated with the exception of the foyer where heating overhead heaters exists. Furnishings, including tables and chairs, are available for use as well as two pianos. Reserve and Community Facilities Reserve and community facilities provide leisure and recreation opportunities for residents and visitors in the District. A reserve facility is any structure or building located upon a reserve, whereas, a community facility is any building or structure not located upon a reserve. 41 Draft Recreation and Culture Activity Management Plan Doc
244 Reserve facilities include clubrooms, sheds, grandstands, information centres and Kindergartens. Community facilities include the Waitomo Indoor Sports Centre. Figure 4.2 identifies the total number of reserve and community facilities located in the District. Most reserve facilities, such as clubrooms are owned by the clubs but in many cases would revert back to Council as the land owner should the club cease to function. Investigations into future liability/ownership need to be further developed as leases and licences are reviewed. Figure 4.2: Reserve and Community Facilities Ward Number Te Kuiti 14 Piopio 3 Waitomo 0 Balance of Rural Ward 6 TOTAL 23 Refer table 4.8 and 4.9 Aerodrome The Aerodrome provides further leisure and recreation opportunities for residents and visitors to the District. Aerodrome facilities enable various community organisations to have regular interaction for the purpose of leisure, cultural and educational activities. The aerodrome also acts as a hub for the farming community as a base for commercial fertilizer spreading as well as an emergency landing area for the rescue helicopter. The aerodrome is located on the northern side of Te Kuiti Township. Assets such as horticultural amenities, services and structures, furniture and fittings, plant and buildings are located on Te Kuiti airfield. Figure 4.3 identifies the total area of aerodrome facilities located in the District. Much of the aerodrome area is leased for horse training / grazing, cattle grazing, grass harvesting and cropping. As these leases expire they are reviewed and a new lease value negotiated with the lessee based on current market value where these leases relate to commercial operations. Council needs to undertake a comprehensive review of the aerodrome through the reserve management plan process. Figure 4.3: Aerodrome Ward Te Kuiti Hectares ha Camp Grounds (Note Budgets included in Housing and Other Property AMP) The purpose of the camp grounds which are located on the Te Kuiti Recreation Ground, Marokopa old school site, Piopio campervan site, Mangaokewa Reserve etc is to provide additional public camping facilities within the District. Figure 4.4 identifies the number and size of campgrounds provided by Council in the District. Figure 4.4: Camp Grounds Ward Number Area No. of sites (Power Points) Status Te Kuiti Recreation Ground 1 4,000m 2 18 Official site Marokopa School Site 1 8,000m 2 To be confirmed Official site Brook Park 1 1,500m 2 0 Freedom camping Piopio Campground 1 2,500m 2 0 Official site Mangaokewa Reserve 1 1,000m 2 0 Freedom camping Waikawau 1 750m 2 0 Freedom camping TOTAL 6 17,750m Draft Recreation and Culture Activity Management Plan Doc
245 Mangaokewa reserve is quite isolated, which has historically led to extensive vandalism. It is Council s intention to prohibit freedom camping in this reserve in the future and to channel these campers and motor home operators to the official Te Kuiti Campground to be redeveloped within Brook Park Gates to Mangaokewa reserve available should the extent of vandalism become excessive. The three main camping areas being Te Kuiti, Marokopa and Piopio are leased campgrounds, historically for $1, with the leases expired as at One off leases have been negotiated for the 2011 /2012 year and carried with one off renewals for Marokopa and Te Kuiti Campgrounds A new lease will be developed when the Te Kuiti Campground is redeveloped which will provide a return to Council. 4.2 How Assets Work Performance Aquatic Facilities Provision There is one Council Aquatics Centre complex in the District, located in Te Kuiti consisting of a toddler s facility of 42m 2 and the main pool of 330m 2. This is a gas heated pool and until operating on a yearly basis with different times for winter and summer months. Following the budget process and LTP process the operations of the pool were reviewed and the pool hours now operate over a 7 month period from October May inclusive Figure 4.5 relates the population to the square metre age of pools available. Note population relates to 2006 census Figure 4.5: Square Metre of Pools per Population Location Population Pool Area m 2 Pop/m 2 As a Te Kuiti Pool As a District Pool 4, , The pool complex is made up of a 30m lane pool (volume 520m 3 ) used for casual leisure and lane swimming as well and a toddlers pool of 30m 3 volume. Associated facilities include picnic areas, shade areas and grandstand along with change facilities and office complex. Seven month a year operation can mean difficulty in the provision of adequate trained staffing. While there is potential to investigate the operation of the pool in conjunction with neighbouring Councils to overcome this staffing issue WDC have embarked on a provision of service contract with Community Leisure Management. This first year of the operation is and if successful will be extended into future years. Council also assists through its grant system the opening of the school pools in Piopio and Mokau to the community. Quality In 2010 Council undertook the replacement of the filter and filter housing and installed a new sand filter system to meet the requirements of NZS This has solved the historical water quality issues. Some minor OSH work relating to covers and safety rails is currently being undertaken. Council has (in 2008) refurbished the office and entrance area to make the area more functional, comply with regulatory requirements in relation to disable access and evacuation, and to make the area more attractive. This refurbishment included the provision of disabled toilet and shower facilities and was partly funded by grants. Council s identified Leisure Strategy Study will include a comprehensive review of the usage, condition and future requirements of the pool facility. An operations manual was prepared in draft form by MWH Consultants in September This manual identifies the main areas of plant and reticulation. In house finalisation of this document has been undertaken now that the new filtration system has been commissioned. A 10-year maintenance and renewals plan is to be prepared with a review annually, to cover all buildings including the pool complex buildings but does not include the pool tank or specialist Aquatics Centre plant such as filters and pumps. A comprehensive asset survey supplementing the work undertaken by MWH, in relation to asset condition and remaining lives of plant is required. This survey will also provide 43 Draft Recreation and Culture Activity Management Plan Doc
246 information on renewals programmes and materials used. Public buildings are inspected annually as part of the building WOF compliance programme as required under the Building Act The quality of water is regularly tested and analysed to ensure that it meets the requirements of NZS 5826:2000 for water quality in public Aquatics Centre. Monthly microbiological tests are undertaken by an independent laboratory with the test results being analysed by Council s Water Services Engineer. As a one off assessment, Council joined the 2007 pools benchmarking project being conducted through Yardstick to provide a measure for benchmarking of the pool operations. Now that the filter and heating upgrades have been completed, an assessment of this information can be undertaken to identify any potential issues. The pool is a registered Pool Safe pool. Safety All accidents are recorded in the accident register and analysed annually to determine patterns of recurrence with the implementation of strategies to prevent their future occurrence. Aquatics Centre supervision is carried out by trained pool attendants who are qualified in lifeguarding and first aid. Staffing levels and technical competencies of staff are maintained in accordance with the standards set out in the NZ Recreation Association Aquatics Centre Guidelines. Dangerous goods and chemicals are secured in accordance with HSNO Act and a hazard data sheet for each type of chemical is available on site. Council has recently joined the Pool Safe Programme which involves yearly independent inspections of Council facilities with respect to administration and safety. The Te Kuiti centre was accredited in 2006 and has maintained its yearly accreditation. Cultural and Arts Centre Provision This facility provides a high class events centre available for hireage by the community and tourism groups alike. Some refurbishment work is required and is included in this AMP to enable the facility to maintain its prestige in the community. It is well used. Quality A 10-year maintenance and renewal plan is being prepared to cover all Council owned buildings including the Cultural and Arts Centre. Currently maintenance is reactive and unplanned and most works have a renewals focus. This will enable the refurbishment, renewals and upkeep to be managed over the coming years. Along side this 10 year plan, a refurbishment programme to update the building and catch up on deferred renewals has been prepared along with the associated costing and this is included in the renewals works listings. Safety The Cultural and Arts Centre is inspected annually as part of the building WOF compliance programme as required under the Building Act Reserve and Community Facilities Provision Reserve and Community facilities are located throughout the District. Figure 4.7 further details the distribution of Reserve and Community Facilities by population and includes such facilities as Waitomo Indoor Sports Centre, various club and community facilities with a comprehensive list of items in the base information for this Activity Plan. Note that many of these facilities, while on Council land are not owned by Council and maintenance works are undertaken by the owner of the facility. Generally Council has a lease agreement for locating these facilities on Council land, although many of these have been lost. Council s lease register is not current and is undergoing a comprehensive review. In many cases the current lease is rolled over without a review. 44 Draft Recreation and Culture Activity Management Plan Doc
247 Figure 4.7: Provision of Reserve and Community Facilities Location No of Facilities (owned by Council) No of Facilities (not owned by Council) Population Facilities /1,000 People Te Kuiti 2 (1) 11 4, Piopio Waitomo Balance of Rural Ward 0 8 4, DISTRICT TOTAL , (1)Recreation Centre (leased) and Centennial Park Grandstand In many cases the facilities not located on reserves will revert to Council by default or through the lease agreement should the club or facility operator go into recess. This is a potential liability to Council which requires further investigation as many of these facilities are poorly maintained. Figure 4.8 identifies where possible the overall effect of this. Council in many cases could then be looked upon as the future provider of the facility. 45 Draft Recreation and Culture Activity Management Plan Doc
248 Figure 4.8: Reserve and Community Facilities on Reserves and the Potential Effect on WDC Location Building Building Use Owner Potential Effect on Waitomo DC Centennial Park Te Kuiti Rukuhia Domain - Piopio Band Hall Band practise Te Kuiti & District Highland Band Reverts to WDC BMX Facility Storage Te Kuiti BMX Club Restored to flat grassed area if requested by Licensor Hot Rod Clubrooms Clubrooms Te Kuiti Hot Rod Club Soccer Clubrooms Clubrooms King Country Junior Football Squash Clubrooms Squash Courts Te Kuiti Squash Club Netball Clubrooms Clubrooms Maniapoto Netball Association Gun Club Shooting Range Waitomo Small Arms Society Unknown Unknown Unknown Unknown Unknown Pavilion Clubrooms/changing Piopio Rugby Club Reverts to WDC Toilet block Toilets Piopio Rugby Club Unknown Score/Commentary Box Score Board Piopio Rugby Club Unknown Mapiu Recreation Reserve Pavilion Clubrooms Mapiu Domain board Reverts to WDC St Helens Domain, Aria Pavilion Clubrooms Aria Squash Reverts to WDC Club/Aria Domain Board Squash Courts Squash Courts Aria Squash Club Reverts to WDC Benneydale Domain Pavilion Clubrooms Bush United Rugby club Removed by Club Tainui Wetere Domain Pavilion Clubrooms Tainui Rugby Club Reverts to WDC Toilet/change Facilities Toilet/change Facilities Tainui Rugby Club / Mokau Domain Board Reverts to WDC Ward Street Reserve King Country Playcentre Kindergarten King Country Playcentre Unknown Marokopa Recreation Reserve Pavilion Sport and Social Club Marokopa Community Unknown Te Waitere Road, Te Waitere Garage Boat Club shed Unknown (To be confirmed) Unknown 46 Draft Recreation and Culture Activity Management Plan Doc
249 Figure 4.9: Other Reserve and Community Faculties and the Potential Effect on WDC Location Building Building Use Owner Potential Effect on Waitomo DC Rora Street, Te Kuiti Te Kuiti Museum Museum TK Historical society Unknown Piopio Piopio museum (5) buildings Museum Piopio Museum Society Unknown Waitomo Centre Aquatics Tower Swim Club administration TK Swim Club Unknown Waitomo Aquatics Centre Storage Shed Swim Club storage TK Swim Club Unknown Quality A 10-year maintenance and renewals plan is to be prepared to cover all Council owned buildings where Council is responsible for building maintenance and will include those Reserve and Community Facilities where Council already has a maintenance commitment. It will not include those buildings privately owned or where the user has maintenance obligations. Safety Public buildings are inspected annually as part of the building WOF compliance programme as required under the Building Act Aerodrome Provision Council has one aerodrome within its District. This is a 36ha site to the north of Te Kuiti Township immediately adjacent to State Highway 3. The airstrip is used by casual users, Waitomo Aeroclub, two commercial aerial fertilizer operators as well as the additional land for horse training, cropping and grazing. Quality The aerodrome has one airstrip approximately 800m in length. The southern 500m of the airstrip is hotmix/seal with the remainder in grass. The surface of the sealed section of the runway was renewed during the year. The site has several very old buildings on it, which are generally in a poor state of repair. The Aero Club clubhouse is the original horse racing club building and is recorded as a historic building by the Historic Places Trust. Again this building requires extensive renewals works which will be itemised through the building componentisation and condition grading process Council is about to undertake. A refuelling facility is available on site for users and operated by Greenstone Ltd and a private refuelling facility has been established for Wanganui Aeroworks. Approximately half of the site is leased for horse training and includes a 1,600m all weather training track. Overall grass maintenance is by way of a grazing lease and grass harvesting. A 10-year maintenance and renewals plan is to be prepared to cover all Council owned buildings and will include those buildings at the aerodrome where Council has a building maintenance obligation. Public buildings are inspected annually as part of the building WOF compliance programme as required under the Building Act A Memorandum of Understanding or similar document is required to establish a Te Kuiti Aerodrome user committee; this document would detail how users interact with one another to ensure the safe operation of the facility. This could form part of a reserve management plan for the facility. Safety Public buildings are inspected annually as part of the building WOF compliance, as required under the Building Act The CAA completes a full safety audit and inspection annually to ensure compliance of the airfield to Civil Aviation regulations. 47 Draft Recreation and Culture Activity Management Plan Doc
250 Camp Grounds (note budgets for campgrounds have been included in the Housing & Other property Activity Plan) Provision Council provides three official camp grounds which are leased to operators, being the Te Kuiti Campground adjacent to the Domain; Marokopa Camp Ground situated one street back from the west coast and Tui Park, and Piopio (community lease). In direct competition to this and private operators, Council allows free camping on a casual basis at Mangaokewa Reserve and Brook Park in Te Kuiti and Waikawau Reserve. Quality The Te Kuiti Camp Ground provides facilities for ablutions, cooking, cabins, caravans as well as tent and powered sites. Many of these facilities are in poor condition and while they are the responsibility of the lessee, Council s strategic direction for this campground is to relocate it away from the Te Kuiti Domain, to Brook Park. In the meantime the expired lease needs to continue on a year to year basis. WDC will be seeking a one year lease with one year right of renewal as investigations into relocation are undertaken which are currently on going. The Marokopa Camp Ground offers similar facilities an old school site as well as tennis courts and a small shop to the community. The campground also supplies water to Council s public toilets. Again a strategic direction for this facility has been established with the gradual refurbishment of this campground and its facilities along with a renegotiated lease. WDC will be seeking a five year lease with two, thee year rights of renewal. As an interim a year by year lease has been established while the facility is upgraded. An investigation has been undertaken to ensure that Council s camp grounds are meeting the regulations as defined in the Camping Ground Regulations (1985) and to record the condition of the components making up the campgrounds. Identified works are scheduled in the renewals programme for campgrounds but budgets are included in the Housing and Other Property Activity Plan as they are leased land. Independent works associated with Te Kuiti Camp Ground may not be undertaken if plans for relocation are adopted by Council as money will be used for relocating. Safety Power boxes need to be put on an inspection regime, inspected and tested to ensure compliance with safety regulations through renegotiated lease agreements when they become available Utilisation Aquatic Facilities Records relating to the Pool utilisation are available through the till record system and manual counts and are shown below in graph form. The yearly figures and monthly figures for recent years are shown in figure 4.10 and Note that the pool closed in September 2005 for the heating upgrade which affects the figures for 2005 by approximately 1,000 users. Figure 4.10: Yearly Pool User Numbers (Seasonal Year) Yearly Users pool Complex No. of Users Year Pool administration and costs have been a controversial issue during the 2008 and 2009 annual plan processes and much adverse publicity has been spread regarding the complex which has adversely affected patronage at the pool. The result of this was that Council resolved to fund the pool for a seven month a year operation. 48 Draft Recreation and Culture Activity Management Plan Doc
251 The two factors severely impacted on the 2009 patronage and the challenge now is to turn this around. The 2010 figures go part way to achieving this. Figure 4.10 shows a gradual winning back of this custom, even taking into account the seven month operation now taking place. During the season WDC experienced difficulties in the provision of this service due to the inability to attract experienced qualified staff to run the facility. This impacted on the Level of Service, customer expectations and the general level of the public satisfaction. In an endeavour to limit the impact of this and address the issue WDC has entered into a provision of service contract with Community Leisure Management an experienced service provider within this field. Figure 4.11: Monthly Pool User Monthly Users Pool Complex No. of Users Jan Feb Mar April May June July Aug Sept Oct Nov Dec Month Records for the Cultural and Arts Centre complex utilisation is recorded below Figure 4.15: Yearly Booking Events (Financial Year) Yearly Booking Events No. of Bookings / / / / / / /14 Year 49 Draft Recreation and Culture Activity Management Plan Doc
252 Figure 4.16: Yearly Booking Hours (Financial Year) Total yearly Hours Yearly Booking Hours / /09 Year 2009/ / / / /14 Council is always looking for opportunities to promote the usage of the Cultural and Arts Centre and needs to include a promotional budget to achieve this and other community Facilities Included in the LTP but is yet to be implemented. This is included along with monies for all Recreation and Cultural facilities. Currently it is well used taking account of no promotion. Better use in conjunction with the outdoor area if this part of the facility, including the equipment available was refurbished. A budget for this is included in the LoS projects. The economic downturn and the poor condition of the facility have impacted on the usage of this facility and Council needs to promote the facility to the wider Waikato community. The ongoing upgrade works have meant that at times the facility has been unable to be let, influencing the usage data. The programmed upgrade is due for completion year, by which time all the facilities will have been upgraded. It is anticipated that this will improve patronage. Reserve and Community Facilities No information is available to Council regarding the utilisation of these facilities. Aerodrome There is limited information available on the number of landings at the Te Kuiti Airfield as there is no control tower to record landing details. A voluntary honesty box for landing strip usage by casual users is available but it is suspected that this is not well utilised by the users. Usage figures will be greatly enhanced with the introduction of a radio monitoring system to replace the camera system installed in which has proved limited in its ability to provide the necessary information. The users of Te Kuiti Airfield are shown in figure Figure 4.17: Aerodrome Users User Use Waitomo Aero Club Taumarunui Aerial Cooperative Rotoworks Helicopters Casual Flyers Super Air NZ Wanganui Aeroworks Greenstone Ltd W Symonds Te Kuiti Horse and Sports Association Waitomo Honey Ltd Flying Aerial Fertiliser Spreading Flying, agriculture Flying Aerial Fertiliser Spreading Aerial Fertiliser Spreading Supply Avgas Grass cutting/grazing/ cropping Horse grazing and training Storage bee hives 50 Draft Recreation and Culture Activity Management Plan Doc
253 The lease for the Te Kuiti Horse and Sport association has been renegotiated in 2010 with an expiry date of 2016 and the renewal for the Symonds lease accepted. Council, in recent times has had enquiries for the establishment of new hangars on the aerodrome site as well as commercial operations. While only one development has materialised to date, these must be prime considerations in relation to land usage as both potentially increase the usage of the facility and the potential income derived from the facility. The proposed management plan will need to define where these developments should take place. Camp Grounds Information has historically been difficult to obtain as the main two areas, Te Kuiti and Marokopa Campgrounds, has not been readily available. Council obtained information for the period March 2010 to February 2011 and this is shown below. Figure 4.18: Number of Campground Users Campground Te Kuiti Domain Campground Marokopa Campground Number of Users March 2010 February No further data available 4.3 Asset Condition/Remaining Life Details of asset condition for the different groups of assets are included in the base information for this Avtivity Plan. Condition profiles for the different asset groups are provided below. These condition gradings apply to Council owned assets only. A preliminary assessment of condition and remaining life has been undertaken in 2008 and in some cases reviewed in 2010/2011 but the asset register and condition assessment information is not used in predicting expenditure requirements. No review has been undertaken as part of this AMP update. Extensive work is required to formulate a comprehensive asset register and condition gradings and this is ongoing. During these assessments major renewals and maintenance items have been identified and these have been included in the budgets. Note that in each category the information relating to Mechanical services is unavailable. A comprehensive review of these assets is required including of the pumps / values and specialist equipment at the pools and air conditioning units. Aquatic Facilities The Te Kuiti Pool facilities will require some minor upgrading and replacement work over the next few years. The complex was completed in approximately 1939 and in 2007 the entrance / office was upgraded. In 2010 a new filter and plant room was completed along with an efficiency upgrade of the heating system. Minor works were completed to the ventilation of the changing rooms and painting of the surfaces. Minor leak repairs are undertaken on an as required basis Repairs to the grounds and roof have also recently been undertaken. There is still a need to undertake renewals works around: Improvements to water circulation to allow isolation of the toddlers pool should a faecal accident occur New lids to water wells and other service chambers (partly completed) Reduce contamination of pool water with ground water Repainting of the pool included 2011/2012 year (completed) and schedule for 2015/16 Leak investigations and corresponding renewals to circulation pipe work Include scheduled renewal of outdoor equipment Replacement covers Replacement balance tank part of ongoing renewals Overall the condition of the building components falls into category 1-3. A summary of asset condition grades related to pumps in aquatic facilities is included in figure 4.19 below. 51 Draft Recreation and Culture Activity Management Plan Doc
254 Figure 4.19: Condition Grade Summary KEY PUMP INFRASTRUCTURE Pump Location Pump Model Age Condition Main Pool Pump Main Pool Motor Transfer Circulating Pump Aerating Pump Vacuum Pool Pump Chlorine Dosing Pump Goulds Pump Model GIS Serial No: RDO 68G WEG Motor Model IP55 Serial No: LOWARA Pump (Main Pool to Small Pool) Model LEA-M120/5 Serial No: XXXUAS WEG Pump Model H3De Serial No: BN68940 LOWARA Pump Model COM A Serial No: GRUNFOS Pump Model DME-10 Serial No: C P year 1 Unknown 2 3 years 1 Unknown 3 6 years 2 2 years 1 Cultural and Arts Centre This 1980 building has had little renewal or maintenance works undertaken since construction and is showing tiredness in its current condition. Again a refurbishment programme, begun with Stage one in 2010 has been ongoing and is included in the renewals programme, predominately based on the internal furnishings. Figure 4.21: Condition Grade Summary Arts and Cultural Building Components Number Condition Grade Reserve and Community Facilities No information available predominately privately owned. Aerodrome The Aerodrome assets are generally in fair to poor condition. The aerodrome runway was resealed in 2011 and future renewals of this will be included in the future renewal programme but falls outside the planning period of this plan. Camp Grounds A detailed assessment of the assets and condition grades for campground assets has been undertaken in Refer to Housing & Other Property AMP. 4.4 What the Assets are Worth Recreation and Culture assets are defined as fixed assets that provide a continuing service to the community and are generally regarded as tradable unless positioned on reserves. The valuation of assets associated with the Recreation and Culture Activity is made up of the following: 52 Draft Recreation and Culture Activity Management Plan Doc
255 Figure 4.23: Valuation of Recreation and Culture Assets Asset Value Land Value: Pool Complex Cultural and Arts Centre Reserve and Community Facilities Aerodrome Camp Ground (Marokopa) Museums $ 39,000 $ 23,000 $ 87,000 $ 743,000 $ 235,000 $ 112,000 Building Reinstatement Value: Pool Complex Cultural and Arts Centre Reserve and Community Facilities Aerodrome Camp Grounds - Te Kuiti - Marokopa Museums Rora Street,(QV) Piopio Museum (QV) $1,109,000 $5,472,000 $1,222,000* $ 301,000 $ 61,000 $ 509,300 $ 158,200 $ 422,000 * includes 2013 improvement value for Waitomo Indoor Sports Centre ($810,000), Centennial Park grandstand / public convenience The total value of the Recreation and Culture Activity assets is approximately $11,787,000 where the Land value is based on the rating value which was reassessed in 2013 by Darroch Limited. Building reinstatement values were prepared in 2012 by Quotable Value. Where the facility falls on a reserve the land value is included in the appropriate section of the Parks and Reserves Activity Management Plan. 4.5 Confidence in our data The Recreation and Culture Asset grading system is used for all the facilities components and groups and is held in the confirm Excel spreadsheet form along with the specific building componentisation information. The improvement programme recommends investigation into a proprietary Asset Management system. The total value of the Recreation and Culture Activity is $10,493,500 and is based on the improved rating value of 2012/13. A componentised fair value was established at the time of the rating value but needs to be updated and correlated with the updated asset register. This value will be systematically amended as the information is gathered to allow the above table to be completed based in actual assets on site and Discounted Replacement Value. The improvement value will be decreased as improved information relating to detailed asset values is obtained and included in the table above. The data used in the asset summaries above has been graded as per the Confidence Grading scale explained in section 6.5. The condition, utilisation and performance information is graded between A & D. 53 Draft Recreation and Culture Activity Management Plan Doc
256 Element Confidence Grade Comment Asset type C Data structure in use but gaps in information held. Mechanical and underground services information to be gathered, included in improvement plan. Installation Date A Installation date obtained for major assets. Location A Location and titles obtained. Quantity B Most assets captured with exception of underground utilities and mechanical services in buildings. Size/ number B Good information most assets. Materials C Information on materials accurate as to assumptions from asset gathering. Condition C Individual assets graded but not mechanical and underground services. Performance B Reasonable performance information held need to compare with Yardstick for the pool. Useful Life D Useful lives assessed. Unit Cost D Valuation not componentised (outdated). 54 Draft Recreation and Culture Activity Management Plan Doc
257 How We Manage the Service (Lifecycle Management) 5.1 Operations and Maintenance Strategies/Tactics Pool Complex The Pool complex is currently managed by Community Leisure Management for Community Services section of WDC over a seven month operational period Community Leisure Management undertake all the functions associated with the day to day delivery of the pool operations Mechanical maintenance, the responsibility of WDC is undertaken by independent contractors while all other maintenance is on a casual basis through the Community Services team. A 10 year programme for maintenance and renewals is to be prepared along with asset assessments for the plant, facility and buildings. An inventory of the key mechanical features, pumps, valves and plant is currently being undertaken along with condition grading of these and has been included in this plan for the pumps. As a guide to operations, maintenance and costing, Council has the option of further partaking on an infrequent basis in Yardstcik Pools benchmarking audit and has also been accredited with Pool Safe certification. Pool Safe is a recognised safety audit through NZ Recreation Association and ACC. Council works closely with the Te Kuiti and Piopio Swimming Clubs as well as local schools to provide a facility worthy of the District. Mowing is included under Council s Parks mowing schedule. Cultural and Arts Centre The Cultural and Arts Centre is managed by Council s in-house staff, through Council s Customer Services team who take all bookings and administer invoicing. On site administration of these bookings is undertaken Community Services Officer Minor building maintenance and gardening is on a casual basis through the Community Services team. Major building maintenance is undertaken by specialist contractors. A-10 year programme for maintenance and renewal is to be prepared along with asset assessments for the plant, facility and buildings. The specialist service involving air conditioning is undertaken under a competitively tendered contract and cleaning is undertaken through council s competitively tendered cleaning contract. Reserve and Community Facilities These facilities are generally either privately owned or leased with the lessee responsible for administration and maintenance. Aerodrome The aerodrome complex is managed by Council s in-house Community Services staff, including the administration of the associated leases and licences. Maintenance is on a casual basis through the Community Services team. A 10-year programme for maintenance and renewals is to be prepared along with asset assessments for the plant, facility and buildings. Minor mowing requirement is undertaken by users, utilizing councils mowing equipment Maintenance of the runway is undertaken utilizing the resources available through Council s roading contractors. Campgrounds These facilities are leased with the lessee responsible for administration and maintenance with the exception of the casual areas where any required maintenance is included in the various community services contracts. Overall Maintenance Contracts Maintenance contracts associated with this activity are summarised in Figure 5.1.
258 Figure 5.1: Maintenance Contract Details Contract Date Let Term Contractor How Delivered Cost for Garden Maintenance for all facilities WDC Internal Services Unit Annual contract Cultural and Arts Centre WDC Internal Services Unit - $11155 Building Maintenance - - Individual contractors Refer 10yr schedule being developed, casual work at present partially available below Pool complex Cultural and Arts Centre Individual contractors Individual contractors $23276 $26964 Mowing 01/07/2013 3years WDC Internal Services Unit Annual contract Pool complex 01/07/2013 WDC Internal Services Unit WDC Internal Services Unit WDC Internal Services Unit $6175 Cultural and Arts Centre 01/07/2013 WDC Internal Services Unit WDC Internal Services Unit WDC Internal Services Unit $4,800 Cleaning Contract 01/09/ years OCS Ltd District Cleaning Contract Cultural and Arts Centre 01/09/ years OCS Ltd OCS Ltd $15713 Security Contract ongoing Maniapoto Security Pool complex Maniapoto Security District Security contract Maniapoto Security $960 monthly Cultural and Arts Centre Cost included in housing and other property Air Conditioning Contract year by year basis McAra Airconditioning District Air Conditioning Mtc contract Cultural and Arts Centre McAra Airconditioning McAra Airconditioning $885 monthly Waitomo District Aquatics Centre Provision of Service Contract 1/10/ year Community Leisure Management Provision of operational services Waitomo district Aquatics Centre 1/10/ year Community Leisure Management Community Leisure Management $186,730 less income derived 56 Draft Recreation and Culture Activity Management Plan Doc
259 These contracts and agreements specify the levels of service, performance criteria, standards and reporting details for the following activities. Further detail is provided in Contract tables throughout the following lifecycle management sections. Public enquiries and requests Weed control Garden maintenance Litter control Cleaning Air conditioning Maintenance Mowing Routine inspections Emergency works Hard surface maintenance Security Any work carried out will be in accordance with industry best practice. In some cases different standards apply to different facilities. Where these change, it is usually in response to community demands or financial constraints. However, the primary objective is to provide a consistent standard of management for similar facilities. In general the management standards set for recreation and community facilities relates to one or more of the following characteristics: Public safety Location Value to community Capital investment National or local significance Specialised use Community use NZ Standards or guidelines Building Maintenance is currently on a casual basis but in the future will be more aligned and based on Council s 10-year maintenance programme, to be developed by the Community Services Team. Currently work is undertaken on a casual basis, based on visual inspections and failure and issues identified during the there yearly detailed inspections. Some rationalisation/grouping within the 10 year programme could be possible allowing some works to be competitively tendered. Planned Inspections In some areas regular inspections to assess the condition of recreation and cultural assets identify future risks and maintenance needs or repair work that is required and meet Council s statutory requirements for its Building Warrant of Fitness. The frequency of inspections is based on the outcomes of any asset failure for levels of service, costs, environmental impacts or corporate image and Warrant of Fitness requirements. The inspection programme will be regularly reviewed and modified in response to unplanned maintenance and risks. The following figure 5.2 identifies the required actions for carrying out planned inspections. Figure 5.2: Inspection Details Asset Frequency Inspector Checks Pool Complex Daily Pool Staff (Service Provider) Water quality Daily Daily Pool Staff (Service Provider) Pool Staff (Service Provider) Water temperature Pool Mechanical Services Building Warrant of Fitness Building Airconditioning Civic Centre Annually Weekly NZ Recreation Assoc. Community Services Officer Pool Safe Accreditation Weekly site meeting with Provider Annually Independent contractor Building WOF (Fire Safety, signage, air conditioning etc.) 3 monthly Independent contractor Filters and Air-conditioning running Building Maintenance Inspections Annual (not undertaken at present) currently adhoc and three yearly for major buildings Independent contractor Update of 10yr maintenance schedules being developed Campgrounds Yearly Council s Health Inspector Compliance to campground health Regulations 57 Draft Recreation and Culture Activity Management Plan Doc
260 5.1.2 Planned Maintenance At present planned maintenance is directly related to areas of regular inspection e.g. air conditioning Planned non-critical maintenance accounts are estimated to represent approximately only 32% of the total maintenance budget, although this cannot be substantiated from expenditure to date but is based to some degree on the building maintenance budget (unplanned expenditure). Systems are required for this correlation to be confirmed. Planned maintenance of higher values will be identified during building and specialist plant inspections or critical works specified in future maintenance contracts, ensuring that assets remain in satisfactory condition as well as managing the risk of potential asset failure. Such works can include preventative maintenance of equipment. These are dependent upon assessment factors such as: a) Impact of failure b) Rate of asset decay c) Economic deficiency d) Weather conditions e) New Zealand Standards Council has identified a need to continue working towards the completion of the detailed asset register of all plant and equipment associated with the Recreation and Culture activity and house these in spreadsheets or proprietary asset management system databases. Lives and condition ratings will be applied so that detailed renewals programmes can be established and funded. This will effectively reduce the unplanned maintenance currently undertaken. The initial first cut on establishing the information for these spreadsheets has been collected in late 2008 with some review in Unplanned Maintenance Unplanned maintenance accounts are estimated to represent approximately less than 68% of the total maintenance budget, although this cannot be substantiated from expenditure to date (based on building maintenance budgets). Systems are required for this correlation to be confirmed. Unplanned maintenance is generally associated with building maintenance where this at present is not based on any programme of works to any degree. The unplanned maintenance priorities are: a) Concern for the safety of facility users and adjacent property owners b) The likelihood that if repairs are left unattended the final cost could increase c) Secondary works may be dependent upon primary works d) To maintain the functionality of the work area 5.2 Renewal Renewal Strategies The general renewal strategy is to rehabilitate or replace assets based on four factors, being asset performance, economics, risk and asset condition. These are discussed below. Development and renewable monies are only partially separated and need to be developed into the financial tables as information becomes available. Also, currently much renewals work is undertaken utilizing a general repairs and maintenance allowance, included in most budgets. Asset Performance If assets fail to perform to the required level of service this is generally identified by measuring the asset s condition and performance during inspections, or based on the investigation of customer complaints. Indicators of non-performing assets include: a) Repeated asset failure b) Poor appearance c) Low customer satisfaction d) Frequent vandalism e) Unsafe f) Low use rates 58 Draft Recreation and Culture Activity Management Plan Doc
261 Economics The objective for renewals is to achieve: a) The optimum lifecycle costs for the asset b) Savings by incorporating renewal works with other works Risk The objective in reducing risk is to prioritise and programme work according to the following criteria: a) Public safety b) Legislative requirements c) Environmental risk d) Financial risk of deferring work e) Importance of asset location f) Intensity of use Condition Asset condition is an integral part of performance, rehabilitation, cost and risk and is further discussed below Condition Assessment The assessment of asset condition is essential for AM planning and the initial survey for Recreation and Culture assets were completed in 2008 with some reassessment in A graphical summary is shown in Section 4.3 where available. Further development of this survey information will increase the confidence and reliability. The data collected from these inspections is used to determine: a) What stage an asset is in its lifecycle b) The remaining effective life of an asset c) The deterioration rate of an asset d) When rehabilitation or replacement of the asset is required e) Financial forecasts f) The risk of asset failure g) The frequency of inspection required to manage risk of failure. The condition of assets is rated according to the New Zealand Parks and Recreation Asset Condition Grading Standards Manual (PRAMS) and the building assessments utilize the NAMS building condition table. These define specific rating standards and definitions for various asset groups based on the following general condition rating standards. Council does not currently have an Asset programme for this information so it is kept as Excel spreadsheets and will be used to identify maintenance, development and renewal or disposal works Renewal Standards The standards and specifications for renewal works are generally the same as new works Key Renewal Programmes Several Recreation and Culture assets have been identified as less than average in the preliminary asset condition assessments undertaken and will require assessing for renewal or removal. Some key projects affecting the main assets have been specifically identified and included in the table below. Other renewals will be included as the condition assessment interpretation is developed. Figure 5.3: Renewal Programmes Project Key Service Criteria Forecasted Total Cost Confidence Level In Projections Estimated Timeline for Project Completion Waitomo District Aquatics Centre Repaint Quality Satisfaction $10,000 C Draft Recreation and Culture Activity Management Plan Doc
262 Project Key Service Criteria Forecasted Total Cost Confidence Level In Projections Estimated Timeline for Project Completion Cultural and Arts Centre Upgrade Refer to LoS project Miscellaneous renewals at Waitomo District Aquatics Centre (hatch covers, shade sails, fencing, painting Quality Satisfaction Economic $80,000 (4yrs) $15,000 biannually D to From Entrance Footpath / Accessway upgrade to Waitomo District Aquatics Centre Quality Satisfaction $33,000 D Improvements to the taxiways at Aerodrome to improve drainage Quality $10580 $11,000 $11,000 D (Current) Aerodrome runway resurfacing Quality Satisfaction Economic $20,000 D Replacement pool covers Waitomo District Aquatics Centre Economic $17,000 $17,000 $17,000 B Grandstand Roof Renewal Waitomo District Aquatics Centre Quality $30,000 D Cultural and Arts Centre courtyard redevelopment Quality Satisfaction Refer project LoS D Currently funded Waitomo District Aquatics Centre Repaint The Pool paint degrades as it interacts with the clhlorine and other chemicals in the pool water and an ongoing renewals program on an approximate 5-6 year basis is required. The pool paint was sand blasted off in 2008 and it is not anticipated that this work will be required during the life of this plan. Cultural and Arts Centre Upgrade Continuation of the upgrade program, scheduled for completion Miscellaneous renewals at Waitomo District Aquatics Centre The renewals budget covers such this as outdoor furniture renewal, hatch covers, pipe renewals etc and covers the day to day renewal requirements. Entrance Footpath / Accessway upgrade to Waitomo District Aquatics Centre General improvement to the access and control of parking at the entrance to the pool complex to improve safety. Improvements to the taxiways at Aerodrome to improve drainage Resurfacing of the taxiways to crown the access to improve drainage and quality of the surface. Aerodrome runway resurfacing The sealed surface of the runway needs to be treated as a road, and the on going integrity of the assets is maintained by surface renewal on and ongoing programmed basis. Replacement pool covers Waitomo District Aquatics Centre 60 Draft Recreation and Culture Activity Management Plan Doc
263 On a five yearly renewal basis the pools covers need to be replaced. They react ot the chemicals in the pool water as well as the UV light which over time degrades them. Grandstand Roof Renewal Waitomo District Aquatics Centre The grandstand roof is in poor condition and is very rusty and therefore to maintain the integrity of the asset in a usable condition this is scheduled for replacement Cultural and Arts Centre courtyard redevelopment Part of the ongoing renewals at the Arts & Cultural Centre and is programmed as part of the existing budget Deferred Renewals Works identified in terms of renewal strategies may be deferred where costs are beyond Council s current ability to fund them. This may occur where higher priority works are needed for other infrastructure assets, or there are short-term peaks in expenditure or inadequate funds exist. The asset lifecycle management sections detail any deferred renewals for that category of assets. 5.3 Disposal and Rationalisation Disposal There are no primary assets being considered for disposal although clarification of ownership of the Te Kuiti Sports Centre is required as it is currently unsure as to whether this property was transferred into the ownership of Te Kuiti Little Theatre Trust and a long term lease of the land entered into. Council is however developed an assets assessment and disposal process which will be used to review assets from time to time Asset Rationalisation The asset rationalisation process is an opportunity to review configurations, type and location of assets, need and the service delivery processes relevant to the activity. This includes the provision of shared services with neighbouring Councils. It involves two parts. The first part consists of regular and close monitoring of recreation and culture assets data identified from the following processes: a) Monitoring use rates of recreation and culture assets (surveys) b) Monitoring complaints received about assets levels of service (analyse Council s Request for Service System) c) Monitoring use rates of facilities (surveys, charges) d) Monitoring condition of assets (planned inspections) The second part of the asset rationalisation process involves the identification and investigation of alternative uses or alternative provision for existing assets or other courses of action prior to disposal being considered. It may be that user expectations may be better met or user numbers increased, this may involve one or more of the following processes: a) Upgrading of facilities (feasibility study) b) Alternative uses for facilities (feasibility study) c) Refitting of facilities (feasibility study and engineers report) d) Entering into partnership with private enterprise or other Councils (feasibility study) Rationalisation will be one of the considerations as part of the Leisure Strategy currently included in the levels of service projects to be completed and funded as part of the Parks & Reserves Activity Plan Assessments Undertaken (Cemeteries/Public Toilets) Sanitary services assessments as specified under the Local Government Act 2002 have been undertaken and completed for Council in Locations of toilets within the Recreational and Cultural Activity include: a) Aquatic Complex Toilets b) Cultural and Arts Centre Toilets c) Aerodrome Toilets d) Te Kuiti Camp Ground e) Marokopa Campground 61 Draft Recreation and Culture Activity Management Plan Doc
264 These toilets were not included in the assessment as the focus was on full public toilet locations. Further assessment information is required to be undertaken to include these assets. 5.5 Managing Risk Council to date has undertaken an identification process for risks but has not undertaken a risk management plan for Recreation and Culture assets and this is a key issue to be addressed. It is to include public health risk management plan, preparation of operation manuals for various key equipment components, and investigations to establish as built information Risk approach Risk = (failure consequence X likelihood of failure) A pragmatic approach has been taken to risk management, in identifying risk events they have been grouped into: Natural events, where there is no real control over the timing or extent of the event, although probabilities may be understood, e.g. floods, lightning strikes, earthquakes. External impacts, where other service providers are not providing services which impact on the organization or individuals, e.g. power supply failures, material supply failures. Physical failure risks, where condition or performance of the asset could lead to failure Operational risks, where management of the asset or asset management activities may impact adversely on the asset. These risk events, while impacting directly on the assets, have other consequences on such things as: Repair costs financial Loss of income Loss of service Loss of life, or injury Health impacts Damage to property Failure to meet statutory requirements Third party loss Loss of image Risk Management Process Risk identification In the identification stage all risks should be noted, however further work is required to further identify specific risks to parks asset area. The matrix chart as detailed below identifies some of the risks (threats) that could impact on parks assets, and Council Staff. Risk evaluation Evaluation requires that all risks are measured as to the likelihood of them occurring, and then scored allowing a monetary conversion. Risk management Management of the risks to parks assets requires that Staff exercise judgement regarding avoidance, reduction or transfer. It is proposed that risk will be avoided, mitigated, reduced or transferred by the following means: Avoid risk by Changing location, procedures, materials, or equipment and/or no longer provide the service or asset that presents the risk; Reduce the risk by - The Installation of security devices such as lighting; Formulating procedural safeguards, such as condition assessments, security patrols and performance evaluations; and further training to educate Staff and Contractors in safe working conditions and emergency procedures; Transferring the risk Legal methods to assign the risk of potential losses to a third party by Insurance or altering the terms or conditions of contracts or adding this risk to new contracts. Retention of risk Council can take on the risk as increasing insurance premiums and insurance excesses are also forcing the retention of further risks onto Council. The probability of physical failure of an asset is related directly to the current condition of the asset, hence the importance of realistic and accurate condition assessment. The effort put into assessing and managing risk needs to be proportional to the risk exposure. Within the parks area the key risks centre around failure of structural assets on reserves or associated with playgrounds. Natural events e.g. flooding are mitigated by closing the reserve 62 Draft Recreation and Culture Activity Management Plan Doc
265 5.5.3 Measures of Likelihood of Risks Measures of likelihood or probability are explained in the table below: Figure 5.4: Probability Table LIKELIHOOD DESCRIPTOR DESCRIPTION 100% PROBABILITY OF FAILURE PROBABILITY 9-10 Almost certain The event is expected to occur in most circumstances 7-8 Likely The event will probably occur in most circumstances Within 1 year 0.9 Within 2 years Possible The event should occur at some time 3-4 Unlikely The event could occur at some times 1-2 Rare The event may occur but only in exceptional circumstances Within 3 10 years Within years After more than 20 years Draft Recreation and Culture Activity Management Plan Doc
266 5.5.4 Measures of Consequence Figure 5.5 Measures of Consequence or Impacts CONSEQUENCE DESCRIPTION FINANCIAL TECHNICAL PERSONNEL INCIDENT OR ACCIDENT SOCIAL POLITICAL COMMERCIAL 1 Negligible <$10,000 Minimal impact to production First treatment aid Minimal impact or disruption Minimal interest Minimal impact Limited lost time 2 Minor >$10,000 <$50,000 Limited disruption and some loss of production Medical treatment required Lost time injury Some disruption to normal access or community systems Minor impact or interest Questions raised in local forums, local media reports Claims from business or repairs to other services Customers inconvenienced 3 Moderate >$50,000 <$500,000 Significant impact, production reduced or stopped for up to two weeks Serious injury Extended medical treatment required Disruption to public access and other systems Increased potential for accidents Community discussion Broad media cover over a regional basis Significant claims Customers forced to other options Questions regulator from 4 Major >$500,000 Disruption and damage to system or incident involving other infrastructure Serious injury or loss of life Extensive disruption Incidents/accid ents involving the public Loss confidence facility management Corporate credibility affected of in Loss substantial business opportunity of Rebuke or threat from regulator 5 Catastrophic Very high Extensive losses within and beyond the system Extensive disruption and damage with broad impact on other infrastructure Loss of more than one life and or extensive injuries Broad impact on community health or the environment Public furore and investigations. Management changes demanded Loss substantial of business of part Loss of licence for a large area or region 64 Draft Recreation and Culture Activity Management Plan Doc
267 5.5.5 Risk Matrix Risks are aligned to: Public Health, Environment, Security of Service, Quality, Asset Protection and Capacity. The following table explains the risk rating matrix used to assess the risks tabulated below for the recreation and cultural assets. Risk is assessed as the product of Consequence and Probability, thus a high likelihood of the event occurring with a major consequence leads to an extreme risk that requires immediate action. Figure 5.6: Risk Rating EVENT Consequence Likelihood Rating Negligible Minor Moderate Major Catastrophic 9-10 Almost Certain Moderate High High Extreme Extreme 7-8 Likely Moderate Moderate High Extreme Extreme 5-6 Moderate Low Moderate Moderate High Extreme 3-4 Unlikely Low Low Moderate High Extreme 0-2 Rare Low Low Moderate High High Recreation and Culture Identified Risks High risks are shown in this abbreviated summary table. A full assessment is included in the appendices. Figure 5.7: Key Identified Risks Asset Affected Failure Mode Description Recreation and Culture Assets Risk Rating Current Mitigation Accidental harm Death High Check for safety issues on a programmed basis Managed Risk Rating Low Recreation and Culture Assets Decline in amenity value deterioration of asset - building, chattels, fixtures and fittings Building décor and assets provided are outdated, and /or insufficient for customer needs High Condition assessments and renewals Low Recreation and Culture Assets Arson Fire High Alarm monitoring and security measures in place will protect commercial buildings but not other building assets Installation of smoke alarms Moderate 65 Draft Recreation and Culture Activity Management Plan Doc
268 Figure 5.8: Identified Risks continued Asset affected Recreation and Culture Assets - pool Failure mode Drowning Description Personal injury death Risk Rating High Current mitigation Pool staff trained in accordance with Aquatics Centre guidelines Managed risk rating High Sufficient pool staff employed by service provider Recreation and Culture Assets - Te Kuiti Airport Accident Aircraft accident aeroplane collision or High NOTAMs issued for public and aircraft safety High Mitigation Measures Mitigation measures typically include design and engineering measures to strengthen the ability of the asset to withstand the hazard event or staff training to improve the response to potential risks. When an asset has failed or is expected to fail in the future; strategies can then be developed to avoid or react to the failure. If the failure mode of an asset is critical to the organisation, failure avoidance is likely to be more effective than reactive activities. Depending on the failure mode, the strategies may include: changed maintenance activities, rehabilitation works, replacement works, or abandonment of the asset or staff training. These Strategies can provide a list of works, which may be further broken down into: Should Do Complete within 5 years Could Do Works which may possibly be deferred for 5 years Defer Works which can be deferred for 5 years Based on the risk rating matrix above, the table below gives some guidance on mitigation measures. Figure 5.9: Mitigation Measures Extreme High Risk Moderate Risk Low Risk Immediate action required to reduce risk Treatment options must be reviewed and action taken to manage risk Treatment options reviewed and action taken dependant on treatment cost Managed by routine procedures 66 Draft Recreation and Culture Activity Management Plan Doc
269 5.6 Critical Asset Identification A critical asset is one that if it fails to provide the required service it will result in a significant impact on the community. (Significant impact can be viewed as a loss of a major amenity, disruption to many businesses or people, harm to Councils image or inability for Council to function) Identification of critical assets involves assessing the asset against a series of criteria and allocating a grade. The process involves Listing the main asset group Assessing and scoring the impact of an event using 0-3 grade Summing the scores Assets deemed to have a total of 10 or more,, then the asset is a critical asset Recreation and Culture assets are assessed below. Figure 5.10: Critical Asset Assessments and Identification Asset matrix 0= No impact 1= Low impact 2= Moderate impact 3= Severe impact Direct Costs (Repair, lost revenue, damaged, legal costs Effect on Community (loss of supply) Effect on public safety Environmental Damage Image / Public support Other Total (sum) Waitomo District Aquatics Centre Cultural and Arts Centre Reserves and Community Facilities Aerodrome Camp Grounds By this method, two Recreation and Culture assets are deemed to be critical to Council, these being the Cultural and Arts Centre and Waitomo District Aquatics Centre The Cultural and Arts Centre is a large investment for Council, it is the only venue of its type available in the District and its temporary loss would impact on events and tourism. Similarly the Aquatics Centre is the only Council facility of its type in the District and its loss would impact on availability to schools and use of facility by swim clubs and the provision of learn to swim classes for the district. Its replacement cost is significant and there is the potential for pollution should the chemically treated water migrate to our waterways. 67 Draft Recreation and Culture Activity Management Plan Doc
270 Financial Summary - What It Costs and How We Will Pay For It 6.1 Summary of Financial Policies The focus of this AMP is to provide agreed levels of service at the optimum or lowest lifecycle cost to the community. The acquisition of funds required to achieve this focus are noted below. General rates, UAGC and user charges fund the net costs of this function. Capital development is funded by internal loans or from depreciation with interest charged in accordance with Council funding policy. This interest is then allocated to the rates-funded activities. 6.2 Capital Works Framework Capital works projects are either identified through the processes in Section below or they are identified on an ongoing basis through public requests, complaints, user groups, Council staff, and outside agencies Project Identification and Prioritisation The prioritization of capital works is guided by the Recreation and Culture strategic goals which are to: To ensure that the long term operation and maintenance of the Recreation and Culture asset portfolio provides compliant public facilities. To provide community-agreed levels of service in the most cost effective way through the creation, operation, maintenance, renewal and disposal of assets to provide for existing and future users. To demonstrate responsible management in the operation, maintenance, renewal of Council owned Recreation and Culture asset portfolio To ensure that adequate recreation and culture facilities are provided for (by either private or public means) for the residents within and visitors to the District. Capital projects are identified from the following: The sanitary assessments undertaken within the framework of the 2008 Annual Plan where they affect Recreation and Culture assets The Leisure Strategy ( to be developed) Reserve Management Plans as completed where Recreation & Cultural assets are on reserves The Te Kuiti Aerodrome Management Plan (currently being developed) Memorandum of Understanding and subsequent User committee of the aerodrome Strategic plan for the campgrounds (current study of Te Kuiti under development) And requests, user group requirements, complaints etc These documents all involve extensive public consultation, some of which is as outlined in the Reserves Act 1977 and Local Government Act 2002 / Projects are identified from the above sources as well as community requests, Council resolutions and through inspections. These projects are collated throughout the year and funding sought through the Annual plan process where they have not been catered for in the LTP process. An adopted Council process is required to allow prioritization of all projects, with prioritization based on a ranking system. Once the various strategies and plans are developed a detailed project list can be developed and included in the Activity Management Plan. At the moment this is not possible and inclusion of some individual projects, are included in the LTP process where identified but others as identified will be presented through the Exceptions to Annual Plan process. Any funding available should at this time be prioritised towards completing the planning and strategy documents. 6.3 Development and Financial Contributions The overall premise on which contributions are based is that development should pay the cost for providing services and facilities required to accommodate growth and effects. Waitomo District has a declining population but growth can present itself in many forms e.g. growth in an ageing population resulting in more leisure time. Section 102 of the Local Government Act 2002 (LGA 2002) requires Council to have a policy on development contributions or financial contributions. A financial contributions policy prepared under the Resource Management Act 1991 forms part of Council s operative District Plan. It provides for the protection of the natural and physical environment, retention and possible enhancement of public access to the sea and along the margins of the District s significant lakes, rivers and streams in the form of access strips and esplanade reserves, and the 68 Draft Recreation and Culture Activity Management Plan Doc
271 equitable sharing of the costs of the provision and maintenance of infrastructure for development. Financial contributions are effects based. Full details of Council s Financial Contributions Policy can be found in Part 3, Section 25, of Council s Operative District Plan. Council has currently not implemented its above mentioned Financial Contributions Policy, but needs to investigate this option as a way of funding enhancements to the Community Services Assets. Contributions will provide the appropriate balance of funding between the community, WDC and those undertaking the development. There are risks associated with contributions as a funding source and mainly these risks relate to formulating projections and other trend information on which the calculations are based. Council intends to review its development contributions policy during the term of its Long Term Plan. 6.4 Financial Forecasts The following budgets have been prepared assuming that all investigatory and strategy type works will lead to future development projects which will be depreciated. For this reason, this AMP has included these works in the Capital/Renewals section of the budgets, noting that the funding source needs to be confirmed in the future, i.e. either capital, renewal or operational. The Recreation and Culture Activity Plan includes an activity associated with campgrounds which itemises some renewals works. For Council s financial budgeting function, due to the size of the activity, the monies are included in the renewals section of the Housing and Other Property Activity. The following figure 6.1 summarises the financial forecast for recreation and culture assets from 2014 (existing Annual Plan) to 2025/26 financial year. For the purposes of this AMP expenditure is identified as: a) Operations/Maintenance/Management b) Revenue c) Renewals d) Capital Development e) Funding Sources Over the next three years, the predominant emphasis is based on undertaking the tasks included in the Improvement Plan and undertaking the various Strategies/management plans identified. The net result is that only specific renewals are shown and very little capital works are included. Detailed renewals and capital works, based on the improvement plan, strategies and management plans will be included in this plan as they are completed and the impact assess as part of the 2018 LTP review. The management costs include administrative overheads, rates, cost of capital, AM planning, data collection etc. Figure 6.1 identifies funding required over the next 10 years to implement the recommended work strategies noted in this AMP. A financial forecast for each of the asset groups is shown in dollar values current from 1 July Note that where it is believed that there will be major increases due to the tendering process, these have been included. 69 Draft Recreation and Culture Activity Management Plan Doc
272 Figure 6.1: Recreation and Culture Financial Summary To be finalised 70 Draft Recreation and Culture Activity Management Plan Doc
273 Figure 6.2: Summary of Recreation and Culture 10 Year Expenditure Forecast To be finalised 71 Draft Recreation and Culture Activity Management Plan Doc
274 Figure 6.3: Swimming Pool 10 Year Expenditure Forecast To be finalised 72 Draft Recreation and Culture Activity Management Plan Doc
275 Figure 6.4: Cultural and Arts Centre 10 Year Expenditure Forecast To be finalised 73 Draft Recreation and Culture Activity Management Plan Doc
276 Figure 6.5: Aerodrome 10 Year Expenditure Forecast To be finalised 74 Draft Recreation and Culture Activity Management Plan Doc
277 Figure 6.6: Campgrounds 10 Year Expenditure Forecast Note budgets included in Housing and Other Property Financials 6.5 Confidence Levels The confidence in the asset data used as a basis for the financial forecasts has been assessed using the following grading system shown in figure 6.2, from the NZWWA NZ Guidelines for Infrastructure Asset Grading Standards, final draft, August Figure 6.8: Confidence Grading Scale Confidence Grade A B C D Highly Reliable General Meaning Data based on sound records, procedures, investigations and analysis which is properly documented and recognised as the best method of assessment Reliable Data based on sound records, procedures, investigations, and analysis which is properly documented but has minor shortcomings for example the data is old, some documentation is missing and reliance is placed on unconfirmed reports or some extrapolation Uncertain Data based on sound records, procedures, investigations or analysis which is incomplete or unsupported, or extrapolation from a limited sample for which grade A or B data is available Very Uncertain Data is based on unconfirmed verbal reports and/or cursory inspection and analysis Overall the confidence level is B/C in relation to the assets data. Key Assumptions The following key assumptions relate to the Recreation and Culture Activity Management Plan: It is assumed that the population data from the current 2006 census is correct. The AMP for Council s Recreation and Culture assets, which form part of the overall Community Service Activity, will be progressively updated as more complete information becomes available over time. Best practice and current knowledge has been used in formulating information regarding the assets in this Activity Plan. This information is not well supported by solid historical data. It is assumed that this information is correct. The annual cost of the contract maintenance of the network will not increase above CPI when it is re-tendered. The valuations using rating values is an accurate assessment of the true valuation of the Recreation and Culture assets. 75 Draft Recreation and Culture Activity Management Plan Doc
278 Our Commitment to Excellence (Management Practice & Improvement Programme) This section of the AMP firstly describes the current asset management practices under the headings of processes, systems and data. The gap between current and desired asset management practices in particular is described. The improvements required to close this gap are set out in the improvement programme. The programme also identifies priorities, timetables, resources and estimated costs for achieving the desired management practices. Finally the methodology for the monitoring and review of asset management activities is described. Note that selective improvement items are scheduled for the three years leading up to the scheduled 2018 LTP review. These are costed into the improvement programme and included in the overall Asset Management budgets. 7.1 Assessment of Current Practice This section outlines the decision-making practices that WDC currently use to determine long-term maintenance, levels of service, renewal and capital expenditure requirements for Recreation and Culture. Current practice is summarised in four broad areas of activity: a) Processes: The processes, analysis and evaluation techniques needed for life cycle asset management. b) Information Systems: The information support systems used to store and manipulate the data. c) Data: Information available for manipulation by the systems to produce the required outputs. d) This Plan. The following sections detail current management practices and describe the desired management practices WDC intends to develop over time Asset Processes Figure 7.1: Asset Management Processes Current and Desired Practice Current Management Practices Desired Management Practices Operations Some operational processes documented in service contracts Pool operations manual developed Library operational manual developed Some ongoing monitoring of contractors performance by contract supervisor (5-10% of work is randomly audited per month) Operational activities identified and documented in 'controlled' manuals Operational activities contestably priced where appropriate Operational activities optimised to minimise lifecycle costs Contractor performance monitored using specific key performance indicators Performance Monitoring Performance measures and levels of service linked Monthly unplanned surveys of contractors work performance Some Performance standards documented in contracts/operations manual Performance reported to customers through Key Performance Indicators Performance measures and levels of service linked Performance standards fully documented Performance reported to customers and contractors regularly Continuous monitoring and reporting of performance against measures 76 Draft Recreation and Culture Activity Management Plan Doc
279 Current Management Practices Desired Management Practices Optimised Lifecycle Strategy Developing a 10 year forward works programme for renewals and maintenance Risk assessments undertaken Critical assets identified Failure works predicted Treatment options identified for identified risks Lifecycle costs determined and optimised using NPV analysis 10 year plus forward works programme available Knowledge of Assets Plans and records are incomplete Updating process is not documented One off attribute information available for assets Water testing at Pool complex recorded Asset information relating to buildings in basic form Full 'as built' recording process in place to continually update data Process documented for updating of asset information Process documented for collecting attribute information via maintenance activities Ability to access asset registers for all relevant staff. Condition Assessments Condition assessment of some assets and buildings by Council staff/contractors No contract reporting on asset condition Condition assessment of critical assets carried out on an agreed frequency for all recreation and culture assets Maintenance feedback processes established and documented Assessment interval optimised Project Management Contract management reporting processes but not well documented Designers required to consider lifecycle costs Designs undertaken to best practice Overseer appointed to ensure project is carried out to specifications Asset Utilisation Incomplete knowledge of asset utilisation Information available from annual Versus satisfaction surveys Disposal process for land assets adopted All asset utilisation identified (via enhanced customer surveys- Resident Satisfaction and Park Check) Non-performing assets investigated and correction options assessed Disposal/rationalisation policy clearly identified 77 Draft Recreation and Culture Activity Management Plan Doc
280 Current Management Practices Desired Management Practices Quality Assurance Deloittes annually audits performance measures reported in Annual Plan Continuous improvement evident in all AM processes Quality assurance inspections for maintenance contracts Continuous QA of maintenance contracts during retendering process Service requests monitored Accounting and Economics NCS financial system for cost records NCS property data base for leases / license partly developed Asset values based on rating valuation Process in place for recording costs against assets where appropriate FRS-3 valuation complete for Recreation and Culture assets. Levels of Service Levels of service are noted in the contract documents Annual Ratepayer survey results LOS based on customer research and reviewed regularly Information Systems Figure 7.2: Asset Management Information Systems Current and Desired Practice Current Management Practices Desired Management Practices Asset Register Basic asset register of recreation and culture kept in hard copy form Spreadsheets are used to store data for all Recreation and Culture assets. Database for all recreation and culture assets excluding buildings Integration of Database and GIS databases Integration of Database to Financial system Proprietary asset system for buildings Financial System Flexible job costing system Financial system is not currently linked to any Proprietary AMS NCS Database used to record maintenance costs against individual assets as a total Spreadsheets used to manage all leases and tenancies but are to be included in new NCS module 2011/12 Database used to record maintenance costs against individual assets Asset valuation generated from Database and via consultants Lease register continually updated 78 Draft Recreation and Culture Activity Management Plan Doc
281 Current Management Practices Desired Management Practices Maintenance Management Maintenance work on assets is not recorded and is not linked to the asset System links maintenance details to significant assets and asset groups to enables tracking of work history Critical and non-critical assets flagged system and database Competitively tender grouped building maintenance items Condition/Performance Monitoring Hard copy records available Information also recorded in excel databases Condition, performance and utilisation data stored in System Customer Enquiries Request for Service:: customer service complaint and enquiry register and response tracking software that features: Complaint location, type and frequency Response time to query Resolution times for faults Customer enquiry records recorded against individual assets Customer enquiry tracking system in place Risk Management Risk assessment undertaken Critical assets identified Risk register developed to record identified high risk assets Optimised Renewal Strategy Non existent No change Systems Integration Non existent The benefits and costs of an asset management system integration with GIS and Financial system analysed and integrated if appropriate Plans and Records As built plans; maintenance contract files; general files; CAPEX contract files; inspection reports and property register available in some cases Electronic plans and records linked to GIS database 79 Draft Recreation and Culture Activity Management Plan Doc
282 7.1.3 Asset Management Data Figure 7.3: Asset Management Data Current and Desired Practice Current Management Practices Desired Management Practices Asset Classification Asset classification system in place for assets stored in spreadsheet form Formalised asset classification system for all assets and documented Asset Identification Unique asset identification system in place for assets stored in spreadsheet form No change Asset Attributes Inventories established for services and structures, horticultural amenities, and furniture and fittings Condition ratings for inventories approximately Information for buildings gather but incomplete componentization databases established Relevant and up to date attributes recorded for all assets Location of land assets identified on GIS Maintenance Data Regular maintenance activity and costs available from contracts Unscheduled maintenance work records available in hard copy form via order system Maintenance data collected against significant assets or groups of assets Lifecycle Costs Renewal and capital costs for common items are available from recent works Good database of complete lifecycle costs, which can be used for decision making Future Prediction Data Limited current future prediction data available Census results used to predict future demand Actual versus predicted growth monitored Levels of Service LOS recorded in AM plan and contracts where appropriate Regularly monitor and recorded current level of service against performance measures Asset Management Plans Second Draft AM Plan completed 2011 Up to date AP s available for all asset groups and used as basis for forward planning Activity Management Plan This Activity Management Plan has historically been prepared with the assistance of Hollier Consultants and Prophet IAM Consultants. A desktop peer review has been undertaken by Hollier Consultants for the initial version in 2009 to gauge compliance. This plan at the time was considered to meet the requirements of a basic asset management plan and further detail has been added since that time Organisational Tactics To be developed. 80 Draft Recreation and Culture Activity Management Plan Doc
283 7.2 Planned Improvements The development of this Third AMP is based on current levels of service, asset information and the knowledge of Council staff. The AMP will be continuously reviewed, regularly monitored and updated to improve the quality of AM planning and accuracy of financial projections. This process is dependent upon improved knowledge of customer expectations, further developed AM practices, data to optimise decision making, review of outputs, development of strategies and further planning. Reviews will be dependant on the availability of resources to undertake the review. Minor progress has been made on improvements identified for the period in the improvement plan due to other priorities relating to staff time during that period. The improvement programme therefore repeats those items previously identified Improvement Programme The purpose of an AM improvement programme is to improve the current management practices for AM processes, information systems and data, by implementing an improvement programme that brings current management practices in to line with desired management practices. The improvement plan will provide for the staged improvement of AM practices to an appropriate level for AMP preparation, process improvements, information system development, and data collection and recording. The improvement programme tasks to be completed to bring this activity plan to the advanced developed AMP and are to be used as the basis for future funding of the improvement programme and are shown in the figure below: Figure 7.4: Improvement Programme Task AMP PREPARATION Review AMP every 3 years. Review levels of service by testing options within the community Confirm corporate AM objectives Conduct external audit of AMP (initial audit undertaken in 2009 and included in this plan. Identify and include any assets that are not included in this AP Identify development, renewal, maintenance strategies where required Link financial forecasts to the lifecycle management strategies Include valuation results by independent valuer for key assets (not rateable values) AM DATA IMPROVEMENTS Asset classification Develop and document formal asset classification system for all assets Asset attributes Continue to collect asset attribute information Maintenance tasks/data Collect maintenance data against significant assets or asset groups Lifecycle costs Collect lifecycle costs for significant assets or asset groups Future prediction data Monitor actual versus predicted growth Levels of service Measure performance in levels of service against targets 81 Draft Recreation and Culture Activity Management Plan Doc
284 Task AM PROCESSES Operations Ensure operations and maintenance are competitively tendered Optimise operations to minimise lifecycle costs Documentation of operations and maintenance activities Performance monitoring Process in place for monitoring, analysing and reporting of performance against levels of service and performance measures Optimised lifecycle strategy Predict failure works Assess risks and identify treatment options Determine and optimise lifecycle costs using NPV analysis for major new works. Knowledge of assets Develop process for updating asset data with new assets and data collected via the maintenance contract. Asset register available to all relevant staff Compile up to date information on leased reserves Complete reserves management plan Condition Assessments Process in place for the condition assessment of assets including assets to be assessed, frequency and ranking procedures. Project management Designers to consider lifecycle costs and risk. Audit CAPEX development plans Asset utilisation Processes in place to ensure identify current asset utilisation of significant assets Develop and assess options for non performing assets Develop disposal/rationalisation policy Accounting and economics Process in place for collecting costs against assets where appropriate FRS-3 compliant valuation complete for parks and reserves assets Levels of Service Process developed for the review of levels of service (including customer consultation procedures) 82 Draft Recreation and Culture Activity Management Plan Doc
285 Task AM SYSTEMS IMPROVEMENTS Asset register Develop database for all community facilities Financial system System available to allocate maintenance costs against individual assets Maintenance management Link maintenance history to significant assets or asset groups Condition/performance monitoring Use AMS to store asset condition, performance and utilisation data where appropriate Customer enquiries Record all customer enquiries against individual assets Risk management Develop a risk register Systems integration Investigate the integration of AMS with GIS and the financial system, integrate if appropriate Plans and records Link electronic plans and records to GIS database Monitoring and Review To ensure the effective development and implementation of this activity plan the following tasks will be carried out: a) Council Adoption of AMP b) Review/Adopt Levels of Service Council will review service levels, via public consultation, to ascertain an accurate understanding of current and future needs and expectations of customers. The resulting redefined levels of service and performance measures will be adopted by Council. c) AMP Revision The AMP will be revised and updated on a 3 yearly basis to incorporate the outcome of service levels review and any new knowledge resulting from the AMP improvement programme. d) Quality Assurance Audit Audits will be undertaken to ensure that the integrity and cost effectiveness of data collected for use in the AP is maintained. e) Peer Review Internal audits will be undertaken to assess the effectiveness of AMP processes, information systems and data, whereas, external audits will be undertaken to measure AMP performance against best practice Review of AMP against OAG Requirements This review was undertaken by Hollier Consultants on the instruction of Council s Group Manager - Community Services in 2009 as part of the initial development of this activity plan. As a result of this review minor changes were made to the plan including the addition of financials and building information that Council believes makes this AMP comply with the core requirements of the OAG. 83 Draft Recreation and Culture Activity Management Plan Doc
286 7.2.4 Specific Improvement Projects Specific improvement projects are recorded below for the periods that relate to the Recreation and Culture Activity Management Plan and based on $5,000 being made available each year to fund these improvements. Timeframes, resource requirements and estimated costs are recorded. The confidence level of the estimated resources and costs is graded as C D. Figure 7.6: Specific Improvement Projects SPECIFIC IMPROVEMENT PROJECTS PROJECT YEAR WDC STAFF RESOURCE EXTERNAL ESTIMATED COST Underground services investigations and other data gathering Yes Yes $3,000 in Review operational manuals for Arts & Culture Centre and print booklets Expand recovery plans to sit with risk Analysis Yes No $2, Yes Yes $5,000 Review of Activity Plan Yes No In-House Adoption of funding for three year improvement plan 2015 Yes No Nil Develop detailed asset data associated with Recreation & Culture Assets Yes Unknown $3, $2, Draft Recreation and Culture Activity Management Plan Doc

287 Public Amenities Activity Management Plan
288 Prepared by: Desktop review by: Hollier Consultant 2008 Date of Review: November 2008 Adoption by Waitomo District Council: June 2009 Review by Waitomo District Council: February 2012 Adopted by Waitomo District Council: 29 June 2012 Review by Waitomo District Council: February 2014 John De Luca, Group Manager - Community Services Waitomo District Council
289
290 TABLE OF CONTENTS EXECUTIVE SUMMARY: PUBLIC AMENITIES...1 Purpose... 1 Link to Community Outcomes... 1 Strategic Goals... 2 Effects of the Service... 2 Levels of Service... 2 Future Demand... 6 Existing Situation Described... 9 Maintenance and Operation Renewals Current Asset Management Practices Financial Summary Specific Improvement Projects INTRODUCTION Waitomo District Council s Commitment to its Community Why Council Provides the Service - Rationale for Service Delivery The Role of Council in the Provision of Public Amenities The Role of Other Parties Significant Effects of the Service About this AMP LEVELS OF SERVICE: WHAT OUR CUSTOMERS WANT AND HOW WELL WE ARE DOING TO ACHIEVE IT (LOS) How Our Services Contribute to Community Outcomes Strategic Goal Legislative Framework Our Customers Other Stakeholders Service Delivery Options Considered Levels of Service Key Performance Indicators Trends Impacting on Levels of Service (Possible Future Changes/Service Level Review) Key Programmes to Achieve Levels of Service GROWTH PLANNING FOR THE FUTURE AND DEMAND FOR THE SERVICE Population Growth and Structure Current Pattern of Building and Sub-divisional Development Future Subdivisional Activity Potential societal change factors Demand Projections Ability of the Activity to Respond Demand Management Key Programmes to Meet Growth and Demand Capital Works Programmes to Meet Growth and Demand Confidence Levels and Assumptions Risk LEVELS OF SERVICE: THE ASSETS WE USE Description of Asset Base How Assets Work Asset Condition/Remaining Life What the Assets are Worth... 50
291 HOW WE MANAGE THE SERVICE (LIFECYCLE MANAGEMENT) Operations and Maintenance Renewal Disposal and Rationalisation Assessments Undertaken (Cemeteries/Public Toilets) Managing Risk Critical Asset Identification WHAT IT COSTS AND HOW WE WILL PAY FOR IT (FINANCIAL SUMMARY) Summary of Financial Policies Capital Works Framework Development and Financial Contributions Financial Forecasts Confidence Levels and Key Assumptions OUR COMMITMENT TO EXCELLENCE (MANAGEMENT PRACTICE AND IMPROVEMENT PROGRAMME) Assessment of Current Practice Planned Improvements... 82
292 Executive Summary: Public Amenities This Activity Management Plan (AMP) for Public Amenities has been prepared by Waitomo District Council (Council) staff with outside assistance. Asset data capture has been undertaken during 2008 and 2011 and the analysis of this information is an ongoing task. This plan will provide the basis for the Public Amenities Activity in the Long Term Plan (LTP) following review and adoption of this AMP by Council in early Purpose The different groups of public amenities are: Cemeteries that provide areas for burial in a dignified and appropriate manner. Public Toilets that provide toilet facilities that are safe, hygienic and conveniently located. Public Car Parks that provide convenient parking in the main towns for shoppers and users of Council facilities. Street Furniture/Amenity Areas located in convenient locations and increase the amenity of towns and other areas. CCTV System - providing security to the central business area of Te Kuiti. Civil Defence administration of the Civil Defence function for our District for the protection and security of residents. Rural Fire co-ordination of the Rural Fire functions to protect our District. Rationale for Service Delivery The Community Service Group, through its Public Amenities Activity, provides public amenities in order to support the health, security and well-being of the community by providing areas for burial, restroom facilities for the comfort and convenience of visitors and residents, community security and improved town street amenities. Council provides a number of public amenities that are grouped according to their primary purpose. Link to Community Outcomes Council considers in its Long Term Plan that the Community Service Group contributes, through its Public Amenities Activity, to the following community outcomes: Primary Contribution Sustainable Infrastructure CO10 A place that provides safe, reliable and well managed infrastructure which meets the district community needs and supports maintenance of public health, provision of good connectivity and development of the District Secondary Contribution Vibrant Communities CO2 A place where all age groups have the opportunity to enjoy social, cultural and sporting activities within our District Vibrant Communities CO5. A place where we preserve the natural environment for future generations, ensuring that natural resources are used in a sustainable manner. Prosperous District CO6. A place that attracts more people who want to live, work and play, and raise a family Effective Leadership CO8 A place where the development of partnerships for the delivery of programmes and services is encouraged and pursued. 1 Draft Public Amenities Activity Management Plan Doc347241
293 Strategic Goals The strategic goal s for the Public Amenities Activity is to: Strategic Goal 1: To ensure that Council s Public Amenities are available and maintained to an acceptable standard for the residents within and visitors to the District. The Public Amenities AMP has been developed to: Show how assets will be managed in order to achieve LOS and need demand for services. Meet Council s obligations under the Local Government Act 2002 and amendment, especially the completion of sanitary services assessments for public toilets and cemeteries. Provide the linkage between Council s strategic goals for public amenities and the current Levels of Service. Provide a detailed description of public amenities assets and services that Council owns and manages. Estimate the financial expenditure requirements for the next 10 years including operation, maintenance, renewals and capital expenditure. Describe the current valuation of Public Amenities assets. Identify opportunities for improvement and subsequent implications of those improvements. Effects of the Service The Public Amenities Activity has a number of effects on the local community. Figure S.1: Effects of Service Positive Effects Maintaining/improving health and wellbeing from the provision of adequate burial facilities. Negative Effects None identified Improved public safety through provision of CCTV, Civil defence and rural fire administration. Improved amenity values. Improved hygiene in towns and other areas where public toilets are provided and the protection of the clean green image. Increase in tourism through provision of facilities and amenity areas. More spending within the District. None identified Potential ground pollution from burial grounds Potential for uncontrolled rural fires Cost of compliance with applicable standards Cost of provision for a small local authority None identified Levels of Service Levels of Service (LOS) are determined by Council s understanding of customer needs as established through interaction with facility users. In setting the current LOS, Council has sought to ensure that the services are provided in the most cost effective way and encourage community involvement. Some LoS, mainly those dealing with health and safety considerations, are driven by legislative requirements. Customer expectations are changing with time and therefore periodic reviews of the LOS are essential. Council has historically commissioned the Versus survey in order to identify how well the Council is performing in terms of residents perception of its services offered to the community. In 2014 this was replaced with an Annual Residents survey conducted in-house by WDC. These surveys do not cover all areas of Public Amenities. The results of surveys where possible are used to help develop LOS. Council monitors achievement in key service criteria, through the analysis of data produced by different inspections, surveys and audits as they relate to specific activities. 2 Draft Public Amenities Activity Management Plan Doc347241
294 The key LOS indicators directly relate to meeting the target LOS. Other more technical LOS are included in the body of the AMP document. Figure S.2: Levels of Service for Public Amenities Performance Measurement and Targets Key Service Criteria Link to Community Outcomes LOS Statement Type of Measure Measure Current Performance Measurement Procedure Quality Sustainable Infrastructu re Compliance with maintenance standards and specifications for toilets Managemen t Tool Number of noncompliance notices issued per contract per year = < 5 = < 5 = < 5 = < 5 Analysis of contract documentation for non performance notices per contract per year for each activity within Public Amenities Satisfaction Quality Prosperous District Quality public amenities will be provided KPI Percentage of community satisfied with the quality of public amenities (Public Toilets and Cemeteries) = > 80% Current 84% >=81% >=82% >=82% Annual Resident Satisfaction Survey results for cemeteries and public toilets Satisfaction Quality Prosperous District Compliance with the Burials and Cremations Act and Births, Deaths, Marriages Registration Act Managemen t Tool Compliance with legislative requirements 100 % 100% 100% 100% Annual Resident Satisfaction Survey results for cemeteries and review of cemetery records Responsivene ss Vibrant Communitie s Public enquiries will be responded to in a timely manner AMP Performanc e Measure Number of service requests not actioned within three days = < 20 = < 18 = <18 = < 18 Analysis of response records through Request for Service records for numbers not resolved by three working days 3 Draft Public Amenities Activity Management Plan Doc347241
295 Key Service Criteria Link to Community Outcomes LOS Statement Type of Measure Measure Performance Measurement and Targets (existing) Performance Measuremen t Procedure Community Preparedness Safety Prosperous District Community education and information provided to build community awareness and preparedness KPI The number of residents who understand the need to plan for the ability to survive on their own for 3 days if there was an emergency event =>40% =>42% =>45% =>50% Analysis Resident Satisfaction Survey results for community preparedness Surviving on your own means without electricity, gas, phone, water and toilet facilities, and having enough food and water Safety Prosperous District WDC is resourced and staff trained to a level sufficient to efficiently operate the Civil Defence Headquarters during an emergency AMP Performance Measure One major training exercise involving Civil Defence HQ staff will be held per year Baseline 1 exercise per year 1 exercise per year 1 exercise per year 1 exercise per year Record of exercise participation Community Preparedness Safety Prosperous District Educational visits to schools and community groups to promote awareness of the need to prepare the community for emergency events AMP Performance Measure Number of educational visits carried out Baseline 6 per year 6 per year 6 per year 6 per year Records of visits as supplied by Western Waikato Committee 4 Draft Public Amenities Activity Management Plan Doc347241
296 Key programmes that have been identified to enable the LOS to be met are: Figure S.3: Key Programmes to Maintain and Achieve Levels of Service Trend Project Key Service Criteria Forecasted Total Cost Confidence Level In Projections Estimated Timeline For Project Completion Increasing Rate Death Development of accurate maps of Council cemeteries to assist with development, record keeping and compliance and include cemetery signage for visitors Quality Satisfaction $15,000 (5yrs) $3,000 annually D to Increasing Rate Death Access way upgrades to all cemeteries Quality Satisfaction $31,740 (3yrs) $10,580 annually D See renewals Continuation of programme Social Targeted fencing of Railway Corridor Safety $65,000 (Contribution from KiwiRail $30,000) B Currently funded Other investigatory/strategy type programmes have been identified that, while not impacting on Levels of Service initially, the outcomes may. These are listed below: Figure S.4: Key Programmes Impacting on Future Levels of Service Trend Project Key Service Criteria Forecasted Total Cost Confidence Level In Projections Estimated Timeline for Project Completion Tourism Growth Toilet Strategy study / investigation into toilet replacement programme Quality $10,000 Currently funded C Currently funded Cultural Profile of Community Investigation into types of burial areas required (ethnic requirements) Quality $5,000 C Currently Funded Increasing Rate Cultural Death Pandemic Plan for Cemeteries Legislative In-house no additional funding required D Currently funded Economic Establishment of Waikato Valley Rural Fire Authority Quality $35,000 annually included in operational budgets note B In operational budget but is currently only in the planning stage Economic Cultural Other parking adjacent to Arts and Cultural Centre (estimate 50 car parks) Quality $125,000 D Outside Planning Period 5 Draft Public Amenities Activity Management Plan Doc347241
297 Future Demand The key issues impacting on demand forecasts for public amenities are: An aging population The need to develop assets relevant to community needs User pays as a means of funding and addressing equity issues Pressure to maintain and enhance environmental values An increase in public awareness and expectations of higher standards District population trends Tourism- increase usage of facilities Through community involvement in policy and facility development, the development of effective partnerships with community groups, community education, and the possible introduction of user charges and continued dialogue with private operators, the Public Amenities Activity will meet these future demand changes. Capital works projects being planned to meet the growth in demand include: Figure S.5: Capital Projects to Meet Growth and Demand Trend Project Key Service Criteria Forecasted Total Cost Confidence Level In Projections Estimated Timeline for Project Completion Increasing Death Rate and age structure Development Plan of new block at Cemetery at Te Kuiti Legislative Satisfaction $5,000 D Increasing Death Rate Development of new block at Cemetery at Te Kuiti Legislative Satisfaction $150,000 over 3 years ($50,000 per year) D Increasing Death Rate and age structure Development of new block at Cemetery at Piopio Legislative Satisfaction $6,000 D Tourism Provision of a caravan dump station at Benneydale Quality Satisfaction $15,000 D Draft Public Amenities Activity Management Plan Doc347241
298 Other Capital Works Projects Being Planned Trend Project Key Service Criteria Forecasted Total Cost Confidence Level In Projections Estimated Timeline for Project Completion Economic Tourism Implementation of Te Kuiti Redesign of Main Street (redesign of gardens included in year) Quality Satisfaction $150,000 (5yrs) $90,000 for gardens with $60,000 previously funded D Monies from 2016, 2017 years transferred to Plaza development Economic Social Expansion and upgrade of security camera network Safety $40,000 (subject to obtaining $30,000 grant) D Economic Social Replacement toilet Benneydale Environmental Economic $165,000 C Economic Social Replacement toilet Marokopa Environmental Economic $165,000 C Draft Public Amenities Activity Management Plan Doc347241
299 Public Amenities Identified Risks High risks are shown in the abbreviated summary table. A full assessment is included in the background information. Figure S.6: Public Amenities Identified Risks Asset Affected Failure mode Description Risk Rating Current Mitigation Managed Risk Rating Public Amenities all Assets Accidental harm Death High Check for safety issues on a programmed basis Low Public Amenities Assets - Toilets and Structures Decline in amenity value - deterioration of asset - building, chattels, fixtures and fittings Building décor and assets provided are outdated and/or insufficient for customer needs High Condition Assessments Low Public Amenities Assets - Toilets and Structures Arson Fire High Alarm/ Town Camera monitoring and security measures in place will protect some commercial buildings but not other building assets Installation of smoke alarms Moderate District wide assets Destruction of assets - public and private Rural Fire High Agreements in place with other providers Low- Moderate Participation in Rural Fire Group Trained Principal Rural fire Officer District wide assets Destruction of assets - public and private Civil Emergency Defence High Member Waikato Valley Emergency Management Group Lowmoderate Trained Staff A critical asset or service is one that if it fails to provide the required service it will result in a significant impact on the community. (Significant impact can be viewed as loss of a major amenity, disruption to many businesses or people, harm to Council's image, inability for Council to function). Three of the Public Amenities assets score is sufficient to be classed as a critical asset. 8 Draft Public Amenities Activity Management Plan Doc347241
300 Figure S.7: Critical Asset Assessment and Identification Asset matrix 0= No impact 1= Low impact 2= Moderate impact 3= Severe impact Civil Defence Service Delivery Direct Costs (Repair, lost revenue,3rd damaged, legal costs Effect on Community (loss of supply) Effect on public safety Environmental damage Image/Public support (1) 14 Other Total (sum) Cemeteries (1) 12 Rural Fire Service Delivery (1) 11 Existing Situation Described Assets covered by the Public Amenities Activity include: Figure S.8: Summary of Public Amenities Asset Type Quantity Cemeteries 8 Public Toilets 20 Public Car Parks 4 Street Furniture Amenity Areas Towns Amenity Areas Cemeteries CCTV System Civil Defence Rural Fire Approx 330 items 28 beds ha 4 beds ha 1 system, 9 cameras Service delivery only Service delivery only Includes restricted toilets at Tui Park Campground and Mokau Domain 9 Draft Public Amenities Activity Management Plan Doc347241
301 Maintenance and Operation Various contractors are responsible for maintenance and renewal of cemetery assets, toilet assets and street amenities. Maintenance standards set by Council, noted in contracts Figure 5.3, which are mostly competitively tendered in some cases for set periods, apply to all asset components identified in contract specifications regardless of their location or profile. Council has been reviewing the method of delivery of some services to improve responsiveness and value of works. Within this activity the areas being reviewed include the provision of garden maintenance services and toilet cleaning. Several specialist maintenance services are provided by external providers on a non-competitive basis including provision of security, sanitary facilities etc. Some operation/maintenance is also provided by Council s internal staff, e.g. furniture maintenance, grave digging. Regular inspections are completed to assess the condition of public amenities to identify future risks and maintenance needs or repair work that is required. The frequency of inspections is based on the outcomes of any asset failure for Level of Service (LoS), costs, environmental impacts or corporate image. These inspections will become more rigorous and regulated as new contracts are developed. Council has undertaken a risk management plan for Public Amenities and plans to address these risks are a high priority. Actions will include a Public Health Risk Management Plan and investigations to establish as-built information. Renewals Inspections and asset gathering/condition grading has identified to date the following renewals works for inclusion in the AMP for Public Amenities: Figure S.9: Renewal Programmes Project Key Service Criteria Forecasted Total Cost Confidence Level In Projections Estimated Timeline for Project Completion Public Amenities General Renewals Quality Satisfaction $215,000 (10 yrs) $21,500 annually from year 2 C - D Based on priorities of Sanitary Assessment Toilets Mokau Toilet Effluent System Quality Satisfaction $120,000 D 2014/2015 Existing funding Cemetery Accessway Upgrades Quality Satisfaction $31,740 over 3 years plus $10,580 currently funded D Continue programme existing Table and Bin Renewals Quality Satisfaction $52,900 (10yrs) $5,290 annually D Te Kuiti Overbridge Renewal Works Quality $140,000 over 2 Years $60,000 yr 1 $80,000 yr 2 D TK Sports Complex carpark renewal Civic Centre Carpark Reseal Quality $8,000 D Quality $15,000 D Draft Public Amenities Activity Management Plan Doc347241
302 Current Asset Management Practices The following is a snapshot of the current status of asset management practices: Some operational processes are documented in service contracts which are casually audited Risk assessments have been undertaken but no forward plan developed Knowledge of assets is limited but improving daily Condition assessments are currently being worked through for Public Amenity assets Limited asset utilisation information Spreadsheets are used to store data with no link between expenditure and asset Request for service utilised for complaints and enquiries. Financial Summary The following budgets have been prepared assuming that all investigatory and strategy type works will lead to future development projects which will be depreciated. For this reason, this AMP has included these works in the Capital/Renewals section of the budgets, noting that the funding source needs to be confirmed in the future, i.e. either capital, renewal or operational. For the purpose of Council s overall financial budgeting, these works have been included as operational expenditure. For some activities this treatment leads to minor variations between budgets contained in the Long Term Plan from that shown in the Activity Management Plan. The following summary outlines the financial implications for the Public Amenities AMP. The valuations of Council s Public Amenities assets are assessed at $2,759,250. Land and Improvement values are based on the rating value which was reassessed in 2009 by Darroch Limited. Building reinstatement values were prepared in 2011 by Quotable Value. As the infrastructure is individually identified and valued, this overall valuation will become more accurate. There is a large section of assets that relate to street furniture/amenity areas that could be missing from these valuations. Currently depreciation is also based on the rating valuation and will be calculated on an individual asset basis as the valuation improves. Rora Street North Public Toilets The following summary (S10) outlines the financial implications the Public Amenities Activity has on the overall Community Services Potrfolio. For this specific summary of the Public Amenities Activity management Plan financials refer to (S11): 11 Draft Public Amenities Activity Management Plan Doc347241
303 Figure S.10: Overall Financial Summary for Community Services Community Services EAP 2014/15 LTP 2016 LTP 2017 LTP 2018 LTP 2019 LTP 2020 LTP 2021 LTP 2022 LTP 2023 LTP 2024 LTP 2025 Operating Income Parks and Reserves Housing and Other Property Recreation and Culture Public Amenities Total Operating Income Operating Expenditure Parks and Reserves Housing and Other Property 1,079 1,212 1,238 1,093 1,112 1,127 1,127 1,148 1,168 1,188 1,204 Recreation and Culture 1,058 1,115 1,125 1,123 1,139 1,135 1,128 1,174 1,215 1,258 1,303 Public Amenities ,018 1,043 1,073 Safety Total Operating Expenditure 3,728 3,964 3,981 3,940 4,053 4,141 4,210 4,359 4,443 4,522 4,649 Net Operating Cost/(Surplus) 2,924 3,480 3,529 3,452 3,550 3,625 3,678 3,810 3,877 3,937 4,043 Capital Expenditure Parks and Reserves Housing and Other Property Recreation and Culture Public Amenities Total Capital Expenditure 1,364 1, Net Expenditure 4,288 4,544 4,500 3,921 3,881 3,885 3,973 4,064 4,147 4,206 4,366 Funded By Internal Loans Reserves General Rates 1,541 1,435 1,455 1,415 1,423 1,459 1,556 1,610 1,697 1,719 1,741 UAGC 1,430 1,659 1,683 1,636 1,649 1,692 1,797 1,861 1,961 1,994 2,029 Target Rate - Marokopa Hall Target Services Rate - Rural Target Services Rate - Urban Total Funding 4,291 4,545 4,499 3,925 3,880 3,883 3,973 4,067 4,143 4,206 4, Draft Public Amenities Activity Management Plan Doc347241
304 Figure S.11: Public Amenities Financial Summary To be inserted 13 Draft Public Amenities Activity Management Plan Doc347241
 is correct.")
305 Assumptions In preparing this Activity Management Plan, some key assumptions have been made as detailed below: It is assumed that the population data from the current paper prepared by National Institute of Demographic and Economic Analysis (Waikato University) is correct. It is assumed that given the expected trends in mortality rates that sufficient land is available for future cemetery expansion to meet this trend The AMPs for Council s Public Amenity assets, which form part of this AMP, will be progressively updated as more complete information becomes available over time. Centennial Park Toilets Best practice and current knowledge has been used in formulating information regarding the assets in this AMP. This information is not well supported by solid historical data. It is assumed that this information is correct. The Council will continue to be involved in the provision of cemetery services within the District and the LOS will not change. The annual cost of the contract maintenance of the network will not increase above CPI when it is re-tendered or negotiated with the Internal Services Unit. The valuation using rating values is an accurate assessment of the true valuation of the Public Amenities assets. Te Kuiti Cemetery Specific Improvement Projects The following are the priority improvements to this AMP for the 2015/2025 planning period: Figure S.11: Specific Improvement Projects (year ending) SPECIFIC IMPROVEMENT PROJECTS PROJECT Underground Services and Car Parking Asset Investigations YEAR WDC STAFF RESOURCE EXTERNAL Yes Yes $5,000 ESTIMATED COST Purchase of Notebook and development of inspections programme for toilet inspects and other functions within the Community Services area Yes Yes $5,000 Review AMP Yes Yes In-house 14 Draft Public Amenities Activity Management Plan Doc347241
306 SPECIFIC IMPROVEMENT PROJECTS PROJECT Include Building data in a designed Asset Management Programme such as SPM or spreadsheets attached to GIS Asset Management Planning miscellaneous YEAR WDC STAFF RESOURCE EXTERNAL Yes No In-house Yes Unknown $5,000 ESTIMATED COST 15 Draft Public Amenities Activity Management Plan Doc347241
307 Introduction 1.1 Waitomo District Council s Commitment to its Community Council is committed to ensuring that appropriate levels of public amenities are provided within the District. Council presently maintains 8 cemeteries, 20 public toilets, 2 public car parks, several hundred items of street furniture, many amenity areas in the towns and 1 CCTV system, and also has trained staff in the service delivery roles of Civil Defence and Rural Fire as part of its commitment in this area. 1.2 Why Council Provides the Service - Rationale for Service Delivery The Community Service Group, through its Public Amenities Activity, provides public amenities in order to meet the current and future needs of communities for good quality local infrastructure and local public services by providing areas for burial, restroom facilities for the comfort and convenience of visitors and residents, community security and improved town street amenities. Council provides a number of public amenities that are grouped according to their primary purpose. The different groups of public amenities are: Cemeteries that provide areas for burial in a dignified and appropriate manner. Public Toilets that provide toilet facilities that are safe, hygienic and conveniently located. Public Car Parks that provide convenient parking in the main towns for shoppers and users of Councils facilities. Street Furniture/Amenity Areas located in convenient locations and increase the amenity of towns and other areas. CCTV System - providing security to the central business area of Te Kuiti. Civil Defence administration of the Civil Defence function for our District for the protection and security of residents. Rural Fire co-ordination of the Rural Fire functions to protect our District. 1.3 The Role of Council in the Provision of Public Amenities Territorial Authorities have a number of responsibilities relating to the supply of parks and reserves and many individual public amenities are located on reserve land. One such responsibility is the duty under the Reserves Act 1977 to control and manage the reserves in accordance with the appropriate provisions of the Reserve Act, to ensure the use, enjoyment, development, maintenance, protection and preservation of the reserve for the purpose for which it is classified. There are however other public amenities, e.g. toilets, car parks, street furniture, amenity gardens, security systems that have been established for the public good. As these are assets or services of Council, it is Council s duty to control and manage these in a planned and coordinated manner. Furthermore, Council, under Civil Defence & Emergency Management Act 2002 and Forest & Rural Fires Act 1977 must provide services such as Civil Defence and Rural Fire administration for the well-being of its residents The requirement to provide and manage cemeteries is set out in the Burial and Cremations Act 1964, the Local Government Act 2002 and the Resource Management Act These acts also make Territorial Authorities responsible for ensuring that there are places for burial within the District. Council considers in its Long Term Plan that the Community Service Group contributes, through its Public Amenities Activity, to the following community outcomes: Primary Contribution Sustainable Infrastructure CO10 A place that provides safe, reliable and well managed infrastructure which meets the district community needs and supports maintenance of public health, provision of good connectivity and development of the District Tourist activity and visitors are a major part of the District's front window to the world outside and as such, a key means of attracting people and investment permanently to the area. Council can promote tourism by providing good public amenities for the use of tourists. 16 Draft Public Amenities Activity Management Plan Doc347241
308 Council s active involvement in such activities as civil defence, provision of CCTV cameras and rural fire administration, helps provide an environment of security that will attract people to want to live, work and play, and raise a family in our district. Safety and security are essential to personal well-being and to this end Council has provided a CCTV system for the main township of Te Kuiti. Secondary Contribution Vibrant Communities C02 - A place where all age groups have the opportunity to enjoy social, cultural and sporting activities within our District Waitomo's clean-green (Waitomo Green) natural characteristics are one of the District's greatest recreational assets. They are an integral part of living in Waitomo, a key attraction and a vital component of the way the District is seen, i.e. the external image. WDC protects this image through the preservation of and provision of public amenties and internal spaces to its towns, WDC also through the Public Amenities Activity provides facilities for the ongoing support and administration of the district that is called Waitomo. Vibrant Communities CO5 A place where we preserve the natural environment for future generations, ensuring that natural resources are used in a sustainable manner Waitomo's clean-green (Waitomo Green) natural characteristics are one of the District's greatest recreational assets. They are an integral part of living in Waitomo, a key attraction and a vital component of the way the District is seen, i.e. the external image. Provision of public amenities protects our environment (toilet provision, cemetery provision) and furniture and gardens enhance our townships Lack of public amenities, such as toilets gives rise to inappropriate use of our landscape and reserves. By providing such facilities, Council is protecting our fauna, flora and waterways. Cemeteries provision mean orderly use of land, meaning this key asset is not jeopardised for future generations. Adequate provision of cemeteries enables Council to meet its statutory obligation and meet the Health requirements of the District. CO 6 - Prosperous District A place that attracts more people who want to live, work and play, and raise a family Effective Leadership CO8 A place where the development of partnerships for the delivery of programmes and services is encouraged and pursued. Well resourced public amenities including open spaces in our towns provide an environment for the enjoyment of all. These facilities, open spaces and the safety aspects identified as part of Public amenities AMP provide the environs to attract and sustain the families within the District 1.4 The Role of Other Parties There are several other agencies that also provide public amenities which complement the provision of Public Amenities by Council. These include: Urupa Cemeteries owned and managed by local Marae (refer appendix in Sanitary Assessment for known Urupa) Shopping centre car parks 17 Draft Public Amenities Activity Management Plan Doc347241
309 Public toilets provided in shopping centres, petrol stations and other similar areas Tourism centre facilities Local fire brigades Waikato Regional Civil Defence 1.5 Significant Effects of the Service The Public Amenities Activity has a number of effects on the local community. Figure 1.1: Significant Effects of this Activity Positive Effects Maintaining/improving health and wellbeing from the provision of adequate burial facilities. Negative Effects None identified Improved public safety through provision of CCTV, Civil defence and rural fire administration. Improved amenity values. Improved hygiene in towns and other areas where public toilets are provided and the protection of the clean green image. Increase in tourism through provision of facilities and amenity areas. More spending within the District. None identified Potential ground pollution from burial grounds Potential for uncontrolled rural fires Cost of compliance with applicable standards Cost of provision for a small local authority None identified 1.6 About this AMP Document Structure This document follows the following structure to enable Council to comply with legislative requirements by preparing Asset Management/Activity Management Plans for each of its activities. The pattern being: What our customers want and how well we are doing to achieve it The assets we use (LoS Lifecycles) How we manage the service (Lifecycle Management) Planning for the future demand for the service (Growth) What it costs and how we will pay for it (Financial Summary) Our commitment to excellence (Management Practice and Improvement Programme) Links to Other Plans Activity Management Plans (AMPs) are a key component of Council planning process that link to the following documents: Long Term Plan (LTP): Defines the strategic direction for the next 10 years. Activity Management Plans are prepared to supplement the information in the LTP and confirm the Council s role in achieving Community Outcomes. Annual Plan: The works identified in the AMP should become the basis on which future Annual Plans are prepared. Contracts: The LOS, strategies and information requirements contained in AMPs are translated into contract specifications and reporting requirements. 18 Draft Public Amenities Activity Management Plan Doc347241
310 Bylaws, Standards and Policies: These tools for asset creation and subsequent management are needed to support AM tactics. The links to other plans are shown in the schematic below: Figure 1.2: Plan of Plans Legislation Local Government Act 2002 Resource Management Act 1991 Building Act 1991 Reserves Act 1977 MSC Act 1992 Other Acts Government Initiatives Statutory Plans District Plan Reserve Management Plans Services Assessments Sanitary Services Assessments Long Term Plan Strategy Documents Leisure Strategy Toilet Strategy Open Space Strategy Esplanade Reserve Strategy Policy Statements Funding Development Contributions Significance Activity Management Plans Bylaws Annual Plan Annual Report Operations / Maint Plans and Contracts 19 Draft Public Amenities Activity Management Plan Doc347241
311 Levels of Service: What Our Customers Want and How Well We Are Doing To Achieve It (LoS) 2.1 How Our Services Contribute to Community Outcomes The Community Service Group, through its Public Amenities Activity, provides public amenities in order to support the health, security and well-being of the community by providing areas for burial, restroom facilities for the comfort and convenience of visitors and residents, community security and improved town street amenities. The Public Amenities Activity directly contributes to Council s Community Outcomes by: Figure 2.1: Relevant Community Outcomes for Public Amenities Primary Outcome Activity Contributes to: How the Public Amenities Activity Contributes Outcome Effect Indicator CO10 Sustainable Infrastructure A place that provides safe, reliable and well managed infrastructure which meets the district community needs and supports maintenance of public health, provision of good connectivity and development of the District By ensuring that we have good access to parking in our central business areas that will suit business staff, shoppers and people passing through. By providing sufficient, well maintained toilet facilities in the key tourist locations throughout the District and our townships. Minimal complaints regarding parking in our towns and tourist areas. People will have good access to sufficient, appropriately distributed toilet facilities based on a toilet development strategy. By providing a safe environment for our visitors. By providing not only sustainable cemeteries and toilets but also planning for future needs. By providing cemeteries for remembrance. Increased perception of personal safety by Te Kuiti visitors and residents and district residents alike. Sufficient cemetery and toilet facilities are available now; and in the future to cater for residents and visitors alike. People will have good access to areas set aside specifically for reflecting our past for preserving and respecting the history and knowledge of our past; our forefathers; and our identities. 20 Draft Public Amenities Activity Management Plan Doc347241
312 Secondary Outcome Activity Contributes to: How the Public Amenities activity contributes Outcome Effect Indicator Vibrant Communities CO2 A place where all age groups have the opportunity to enjoy social, cultural and sporting activities within our District. By ensuring that our towns have an appearance that residents can take pride in, enjoy and feel safe. By providing not only sustainable cemeteries and toilets but also planning for future needs. By providing an environment where our residents and visitors alike feel safe and protected People will take pride in our towns. Provision of CCTV cameras and providing for the activities of civil defence and rural fire CO5 A place where we preserve the natural environment for future generations, ensuring that natural resources are used in a sustainable manner By ensuring that our towns have an appearance that residents can take pride in, enjoy and feel safe. By providing a balance of spread of public toilet facilities throughout the district we are protecting our natural environment for our community People will take pride in our towns. Adequate toilet provision of quality toilet facilities provided throughout district Prosperous District CO 6 A place that attracts more people who want to live, work and play, and raise a family By ensuring that our towns have an appearance that residents can take pride in, enjoy and feel safe. People will take pride in our towns. Effective Leadership CO8 A place where the development of partnerships for the delivery of programmes and services is encouraged and pursued. 21 Draft Public Amenities Activity Management Plan Doc347241
313 In addition to these, WDC has indicated support for initiatives to: Foster a shared service with Waipa and Otorohanga District Councils for the provision of Civil Defence activity to enhance that capability of the Council Foster a shared service with Otorohanga District Councils for the provision of Rural Fire activity to enhance that capability of the Council A commitment to the Sanitary assessments and the need to upgrade many of Councils Public toilets within our central town areas and rural beaches Participating in the Rural Fire enlarged district discussions Committed to extending the CCTV system into the railway complex development Provision of targeted fencing to the railway corridor fencing as a joint venture with KiwiRail Continue with improvement programs for street furniture in our towns. 2.2 Strategic Goal The strategic goal for the Public Amenities Activity is to: Strategic Goal 1: To ensure that Council s Public Amenities are available and maintained to an acceptable standard for the residents within and visitors to the District. And the WDC s principal objectives are to: a) Programme works for the development of land and buildings in accordance with adopted AMPs b) Operate WDC public amenities to a standard acceptable to users by providing appropriate management structures / resources c) Identify life-cycle (long-term) costs for an agreed Level of Service d) Ensure the maintenance of the public amenities assets in perpetuity, so that there is no decrease in value, and to forecast the estimated future cost of so doing; e) Put in place a sound management regime for all matters relating to Public Amenities activities 2.3 Legislative Framework The following legislation impacts on the management of Public amenities: Local Government Act (2002) and Amendments This Act gives Council power of general competence to undertake any business or activity. Provided the activity is consistent with the object of the Act and the community has been consulted in a meaningful way, this can include the protection of reserves and the provision of recreation facilities. Resource Management Act (1991) and Amendments This Act requires Waitomo to manage the use, development and protection of natural and physical resources in a way, or at a rate, which enables people and communities to provide for their social, economic and cultural well-being and for their health and safety. Council must also sustain the potential of natural and physical resources to meet the reasonable foreseeable needs of future generations and to avoid, remedy or mitigate any adverse effect of activities on the environment. Reserves Act (1977) and Amendments The purpose of this Act is to provide the regulatory framework for the management of parks and reserves. It requires Waitomo to classify the different types of reserves and to specify their purpose. The Act also requires Waitomo to protect, to an extent compatible with the principal or primary purpose of each reserve, the scenic, historical, archaeological, biological, geological or other scientific features and indigenous flora, fauna and wildlife. In addition, the Act specifies the statutory procedures for managing each reserve as well as the preparation and development of management plans for each reserve subject to the Minister's approval. Many public amenities are located on parks and reserves and therefore their management relates to this act. Building Act (2004) and Amendments The purpose of this Act is to ensure that any building work undertaken within the area of a Local Authority complies with the building code. Council currently administer the powers of this Act and its regulations to ensure that buildings in the District meet the code of compliance, whether private building or building works undertaken by Council. 22 Draft Public Amenities Activity Management Plan Doc347241
314 Health and Safety in Employment Act (1992) and Amendments The purpose of this Act is to ensure that employers provide safe working conditions for their employees in the workplace. Council has taken steps to ensure that its employees are provided with safe working conditions and that other persons are protected in workplaces. Burials and Cremations Act (1964) The Burials and Cremations Act, sets out the broad range of statutory roles and responsibilities that territorial authorities have in relation to burial and cremation activities in their District. Section 4 obliges Territorial Authorities to ensure sufficient provision is made for the burial of the bodies of persons dying within its District, to establish and maintain a suitable cemetery. Health Act (1956) and Amendments The Health Act places a duty on every Local Authority in Section 23 to improve, promote and protect public health within its District. This involves identifying potential health risks and ensuring that these risks are managed to within acceptable levels. Births, Deaths and Marriages Registration Act (1995) The Births, Deaths and Marriages Registration Act set procedures for local authorities in the recording of such events. Civil Defence Emergency Management Act (2002) and Amendments The Act requires that a risk management approach be taken when dealing with hazards. In considering the risks associated with a particular hazard, both the likelihood of the event occurring and its consequences must be considered. As part of the comprehensive approach to CDEM, all hazards, not only natural hazards, must be taken into consideration. The primary goal for communities is to be self-reliant. Communities should aim to reduce the likely impact from, prepare for, and be able to respond effectively to, emergency events on their own. To encourage this, regional cooperation and coordination is paramount and is one of the cornerstones of the Act. The Act provides for local authority delegated representatives, Mayors or the Minister to declare a state of local emergency. The Minister may declare a state of national emergency. Declared emergencies have a standard duration of 7 days but may be extended or terminated. The Act establishes a framework for CDEM through the planning and activities of over 400 agencies spread across central and local government, emergency services, lifeline utilities, businesses and volunteer agencies. This is guided by a national strategy and plan and regional plans as well as the individual plans of each territorial authority. Forest and Rural Fire Act (1977) Responsibility for fires and fire protection in the forests and rural areas of New Zealand (approximately 97 percent of the total land area) lies with the Rural Fire Authorities ( RFAs ) under the Forest and Rural Fires Act There are some 86 RFAs, which can be territorial local authorities, the Ministers of Conservation (the Department of Conservation manages approximately 30 percent of land in New Zealand), and Defence (the New Zealand Defence Force operates six fire stations on its bases throughout the country, as well as a specialist fire training school). As well as having specific control over fires within their areas, the RFAs are must establish fire plans according to the requirements of Part 2 of the Forest and Rural Fires Regulations Other Council Plans and Bylaws The Waitomo District Plan, Reserve Management Plans and Bylaws also impact on the management of Public Amenities. 2.4 Our Customers Who Our Customers Are In order to provide an efficient LOS Council needs to identify its potential customers. For Public Amenities assets, the customers include: 23 Draft Public Amenities Activity Management Plan Doc347241
315 Figure 2.2: Potential Customers External Internal District Community Asset Management Staff Visitors to the District Council Staff Car park users Councillors Local Authority and Government agencies Council s Consultants Funeral Directors WDC Internal Services Unit Regional Rural Fire NZ Police Family of bereaved Waikato Region Civil Defence Local Fire Brigades Customer Expectations Council has historically commissioned the Versus survey intermittently over the last ten years (now an internal survey sent to all residents in the District) in order to identify how well Council is performing in terms of the services offered to the community for the major facilities in this AMP. This survey provides satisfaction information which enables comparisons within the activity over a period of time. Unfortunately changes occur in the survey over time, and the chronological order is incomplete. This survey utilises various telephone interviews or direct user interviews and the random telephone surveys are structured to be representative of the various wards in the District. Results showing the percentage of survey recipients who consider that their satisfaction is either good or excellent for the various activities from are shown below. Public Conveniences Figure 2.3: Percentage of visitors satisfied with the District s public conveniences Percentage (%) Year Figure 2.3 shows that in the period 2002 to 2006 the level of satisfaction with public conveniences declined especially in period. The 2005/ 2006 and the surveys were more rigorous as it was a District survey rather than a user survey and had a significant did not know component, up to 33%, whereas the earlier surveys did not have this category. During 2006 many of the facilities were repainted and the cleaning regimes revisited to arrest this decline in satisfaction and this refurbishment continued through , especially the outlying small town toilets. 24 Draft Public Amenities Activity Management Plan Doc347241
316 Issues associated with the disposal system at Mokau toilet have continually influenced the results and at the time of this AMP have not been resolved. Land purchase is still being sought from the Ministry of Education and this has now reached approval. A remedial project is included in the LOS projects although it is proving difficult to provide a solution. Stringent maintenance regimes have been implemented as a temporary measure to mitigate the issues where possible until a permanent solution is found. Public conveniences were not included in the 2007 and 2008 survey. New toilets already programmed (Piopio) and Marokopa / Benneydale in the Amp will further assist in improving the satisfaction rating. Note that from 2012 this was a joint survey question asking about cemeteries as well. Figure 2.4: Percentage of visitors satisfied with the District s Cemeteries Percentage (%) Year The percentage of respondents to the Versus cemetery satisfaction survey indicate that a high level of satisfaction is being achieved and that the satisfaction percentage is increasing. Since 2012 this survey was combined with the toilets above as one question Other Activities No satisfaction surveys or localized surveys have been undertaken for other elements of this Activity. Some standard questions around Civil Defence are being developed for the Waikato Valley Emergency Operating Area and these will be included in future surveys when available. 2.5 Other Stakeholders In order to provide efficient LOS Council needs to identify its potential stakeholders. For Public Amenities assets, the stakeholders include: Sub Activity Cemeteries Public Toilets Stakeholders Funeral Directors Neighbours Waikato District Health Board Returned Services Association Contractors WDC Internal Services Unit Utility Service Providers Tour Operators Neighbours/adjacent landowners Business Owners DOC Waikato District Health Board 25 Draft Public Amenities Activity Management Plan Doc347241
317 Contractors WDC Asset Team Street Furniture Amenity Features Car Parks CCTV Civil Defence Rural Fire Business owners Contractors Donors Business Owners Neighbours Police Retailers/ Business Owners Waikato Regional Civil Defence Local Authorities within the Region Local Authorities Western Waikato CD Emergency Operating Area National Headquarters for Civil Defence National Rural Fire Authority Te Kuiti Fire Brigade Mokau Rural Fire Party Farming Community DOC Piopio Fire Brigade Benneydale Fire Brigade Otorohanga District Council 2.6 Service Delivery Options Considered Levels of Service in the AMP are determined by Council s understanding of customer needs as determined through regular interaction with facility users and historical provision. During 2008/2009 as part of the LTP Sanitary Assessments Council consulted with the Community on its provision of Public Toilets and Cemeteries. No major issues arose from this consultation with the exception being the adequacy of provision / poor cleanliness of the Mokau toilets As yet, the Council has not carried out any formal consultation with customers on Levels of Service options. This is partly offset by monitoring public enquiries/complaints relating to the standards in the maintenance contract. This activity is included in the improvement programme in Section 7.2 but not funded in the first three years of the Activity Plan. As yet, WDC has not carried out any formal consultation with customers on LoS options. This is partly offset by monitoring public enquiries/complaints relating to the standards in the maintenance contract and feedback from WDC s ratepayer annual survey. 26 Draft Public Amenities Activity Management Plan Doc347241
318 2.7 Levels of Service Key Criteria and Management Indicators Strategic Goal: To ensure that Council s Public Amenities are available and maintained to an acceptable standard for the residents within and visitors to the District. Figure 2.5: Customer Levels of Service for Public Amenities Performance Measurement and Targets Key Service Criteria Link to Community Outcomes LOS Statement Type of Measure Measure (existing) Performance Measurement Procedure Quality Satisfaction Quality Satisfaction Quality Responsivenes s Sustainable Infrastructure Prosperous District Prosperous District vibrant Communities Compliance with maintenance standards and specifications for toilets Quality public amenities will be provided Compliance with the Burials and Cremations Act and Births, Deaths, Marriages Registration Act Public enquiries will be responded to in a timely manner Managemen t Tool KPI Managemen t Tool AMP Performance Measure Number of noncompliance notices issued per contract per year Percentage of community satisfied with the quality of public amenities (Public Toilets and Cemeteries) Compliance with legislative requirements Number of service requests not actioned within three days = < 5 = < 5 = < 5 = < 5 Analysis of contract documentation for non performance notices per contract per year for each activity within Public Amenities = > 80% Current 84% >=81% >=82% >=82% Annual Resident Satisfaction Survey results for cemeteries and public toilets 100 % 100% 100% 100% Annual Resident Satisfaction Survey results for cemeteries and review of cemetery records = < 20 = < 18 = <18 = < 18 Analysis of response records through Request for Service records for numbers not resolved by three working days 27 Draft Public Amenities Activity Management Plan Doc347241
319 Key Service Criteria Link to Community Outcomes LOS Statement Type of Measure Measure (existing) Performance Measurement and Targets Performance Measurement Procedure Community Preparedness Safety Safety Community Preparedness Safety Prosperous District Prosperous District A Vibrant and Prosperous District Community education and information provided to build community awareness and preparedness WDC is resourced and staff trained to a level sufficient to efficiently operate the Civil Defence Headquarters during an emergency Educational visits to schools and community groups to promote awareness of the need to prepare the community for emergency events KPI AMP Performance Measure AMP Performance Measure The number of residents who understand the need to plan for the ability to survive on their own for 3 days if there was an emergency event One major training exercise involving Civil Defence HQ staff will be held per year Number of educational visits carried out =>40% =>40% =>40% =>40% Annual Resident Satisfaction Survey results for community preparedness Baseline 1 exercise per year Baseline 6 per year Planned for 2 nd half of 14/15 year 1 exercise per year 1 exercise per year 1 exercise per year Surviving on your own means without electricity, gas, phone, water and toilet facilities, and having enough food and water Record of exercise participation 6 per year 6 per year 6 per year Records of visits as supplied by Western Waikato Committee 28 Draft Public Amenities Activity Management Plan Doc347241
320 It is to be noted that indicators shown as AMP performance measure or Management Tools are for internal management use only. They are not designed to be reported publicly as part of the performance of the Community Service Group. They are not designed to be audited to any of the standards and requirements which pertain to performance measures which are used to report to Council and the community. Council considers that these indicators are valuable for internal management purposes, but for various reasons they are not suitable for reporting at Council nor community level. Reasons for this may include concerns (sometimes marginal) around: Relevance Realism / ability of Council to control performance Verifiability Neutrality Robustness Perverse incentives or Metadata issues, including Collection methods Monitoring frequency Data storage Quality assurance systems Intended use These internal management indicators are reviewed, and appropriate remedial action is undertaken, on an ongoing basis. 2.8 Key Performance Indicators In order to gauge how well we are achieving our Levels of Service and Key Service Criteria, (i.e. identified in 2.7 above); Council s Community Services staff supervise all contracts. Presently inspections tend to be on an informal basis although new contracts will allow for random monthly of bimonthly inspections. Council in the future will develop methodologies to analyse results from these monthly inspections to ascertain percentages over a 12 month period which can then be compared on an annual basis. The Levels of Service Indicators/Key Performance Indicators directly relate to meeting the target Levels of Service as measured using the Performance Measures identified. The achievement of the target Levels of Service is linked to the successful completion of the programmes and projects identified in 2.10 below. 2.9 Trends Impacting on Levels of Service (Possible Future Changes/Service Level Review) Environmental Increasing standards of effluent disposal will influence the ability of Council s toilet facilities to respond to the challenge of effluent disposal in environmental sensitive coastland reserve areas and or where adequate reticulated services are not readily available Economic Growth in tourism and the increasing expectations of our local residents will increase pressure on the provision of car parks, public toilets and street furniture/amenities areas and their ability to cater for the growth. The development of new tourist destinations, as part of Council s Community Outcomes, may require the construction of new public toilets, car parks and the installation of additional street furniture Social An aging population rate will escalate the demand for burial and cremation services. Council may need to provide additional facilities able to be used by people with disabilities. An aging population will increase demand for such facilities. 29 Draft Public Amenities Activity Management Plan Doc347241
321 2.9.4 Cultural Changing cultural profile of the community could lead to demand for a different mix of services from those currently provided Confidence Levels and Assumptions for Stated Trends Refer to Section 6.5 for Grading Definitions. Figure 2.7: Data Confidence Levels Trend National Demographic trends sourced from National Institute of Demographic and Economic Analysis (Waikato University) Other Trends Confidence Level A C 2.10 Key Programmes to Achieve Levels of Service Council is implementing a number of projects to assist in achieving the target LOS. These range from facilities/equipment works to process improvement projects. The table below summarises the projects, their forecasted total cost to Council which has been included in the LTP budgets, and an assessment of the confidence in the projections Key Programmes to Achieve LOS Figure 2.8: Key Programmes to Maintain and Achieve Levels of Service Trend Project Key Service Criteria Forecasted Total Cost Confidence Level In Projections Estimated Timeline For Project Completion Increasing Death Rate Development of accurate maps of Council cemeteries to assist with development, record keeping and compliance and include cemetery signage for visitors Quality Satisfaction $3000 per year for 5 yrs D to Increasing Death Rate Access way upgrades to all cemeteries Quality Satisfaction $31,740 (3yrs) $10,580 annually D See renewals Continuation of programme Social Targeted fencing of Railway Corridor Safety $65,000 (Contribution from KiwiRail $30,000) B Currently funded 30 Draft Public Amenities Activity Management Plan Doc347241
322 Key Strategies Impacting on Future LoS Figure 2.9: Key Programmes Impacting on Future Levels of Service Trend Project Key Service Criteria Forecasted Total Cost Confidence Level In Projections Estimated Timeline for Project Completion Tourism Growth Cultural Profile of Community Toilet Strategy study / investigation into toilet replacement programme Investigation into types of burial areas required (ethnic requirements) Quality $10,000 C Currently funded Quality $5,000 C Currently funded Increasing Death Rate Cultural Pandemic Plan for Cemeteries Legislative In-house no additional funding required D 2015/2016 Currently funded Economic Establishment of Waikato Valley Rural Fire Authority Quality $35,000 annually included in operational B In operational budget but is currently only in planning stage Economic Cultural Other parking adjacent to Arts and Cultural Centre (estimate 50 car parks) Quality $125,000 D Outside planning period Description of Key Programmes Several projects have been identified as being essential over the life of this AMP to enable Council to maintain and/or enhance the LOS expected by the community. Brief descriptions of these are below. Cemetery Maps and Records and Site Signage & Procedures Cemetery maps and records are an important part of Council s commitment to complying with legislation governing cemeteries. Council s current cemetery mapping is a manual system with no checks and balances. Accurate digital plans need to be established to ensure historical information is not lost by the community of the Waitomo District. Legislative compliance is critical in the administration of cemeteries. Record keeping is an integral part of this process and also provides a strong foundation to ensure that mistakes do not happen within the administration process. Historically, mistakes have happened causing distress to families as well as staff. A complete review of Council s cemetery procedures with independent advice is required to ensure that where possible these mistakes are eliminated or minimised and new procedures with standardized forms will be completed during the year. A common theme derived from the Resident Satisfaction Survey indicated the need to improve signage at the cemeteries that may include mapping. 31 Draft Public Amenities Activity Management Plan Doc347241

323 Access Way Development Cemeteries are places frequented on a regular basis by our community and visitors alike. Historically Council has not maintained quality access ways to our cemeteries which means in many areas considerable deferred maintenance is required to bring the areas to an acceptable standard. Targeted Fencing Railway Corridor Te Kuiti An on going safety issues prevails through the central business area of Te Kuiti where people cross the railway lines at non crossing points resulting at times in tragedy. Historically, KiwiRail have addressed this issue with targeted fencing. Further targeted fencing is required to encourage use of the over bridge, and KiwiRail and WDC have jointly committed to implementing further fencing during the financial year. Mokau Boat Ramp Toilet Toilet Strategy / Study Councils Sanitary Assessment of 2008 recommended that in the future Council undertake a full assessment of current toilet capability and locations. Although provision in the district is adequate the purpose of the study is to identify any gaps in location and specific provision. E.g. when a toilet is due for replacement would it be better served in a new location? Cemetery Ethnic Requirements Council needs to be aware that the ethnic composition of New Zealand s and Waitomo s community, which could lead to a requirement to provide alternative burial areas satisfying this changing ethnicity. Pandemic Plan Cemeteries are an integral part of future planning for disasters, especially in the ability to cope in such an event. A pandemic plan for the cemetery operation is required and will be developed in-house. Establishment of Waikato Valley Rural Fire Authority Council is currently investigating, along with other Councils in the Waikato Valley Area and Thames District Council, the formation of an enlarged rural fire district, being Otorohanga, Waipa, Waikato, Matamata Piako, Hauraki and Thames Coromandel District Councils and the Department Of Conservation, which is being facilitated by National Rural Fire Authority. The purpose of this is to streamline and improve the effectiveness of rural fire management in the Waikato Valley Area. The new Rural Fire District will be governed by a body corporate committee. This budget assumes that this operational matter will be in force for the 2012 /2013 year but is yet to come to fruition at the time of writing this AMP. As an interim, Waitomo is seeking a shared service with Otorohanga DC in this field to improved the Councils capability 32 Draft Public Amenities Activity Management Plan Doc347241
324 Other parking adjacent to Arts and Cultural Centre Parking has always been an issue for larger events at the Civic Centre as there is only roadside parking available with the extensive park lawn areas catering for most of the additional space. This is an issue during adverse conditions and some hard surface parking is required on land immediately adjacent to the Civic Centre where Council currently owns other buildings. This project is identified but falls outside the planning period. 33 Draft Public Amenities Activity Management Plan Doc347241
325 Growth Planning for the Future and Demand for the Service The key issues potentially impacting on demand forecasts for Recreation and Culture are: a. An aging population and a higher proportion of under 15 year olds in the population b. The need to develop assets relevant to community needs c. User pays as a means of funding and addressing equity issues d. the low socio-economic demographics for our region e. Pressure to maintain and enhance environmental values f. An increase in public awareness and expectations of higher standards g. An increase in diversity of recreational opportunities h. Apparent stabilisation / minor decrease in District population i. Governmental emphasis on fitness j, Increasing tourism to our District k. The need to provide services in a more efficient manner 3.1 Population Growth and Structure The following information has been sourced from a paper prepared by the National Institute of Demographic and Economic Analysis (Waikato University) for the Waikato Regional Council in August Council has chosen to use these population forecasts for the LTP as Statistics New Zealand Forecasts for the planning period are not available until The graph below presents the 2013-base medium population projection for Waitomo District to 2063, along with historical population estimates from Statistics New Zealand back to The 2006-base Statistics New Zealand (SNZ) high, medium and low projections (October 2012 update) are also included for comparison. The NIDEA projections show a continuing trend of declining population for Waitomo District with a projected population of 8,743 in These projections follow the recent trend in the District s population reasonably closely, with annualised population decline over the period of 0.5% per year (base year projection is different to actual). 34 Draft Public Amenities Activity Management Plan Doc347241
326 Figure 3.1: Baseline Medium Population Projections for Waitomo District and Comparison with Statistics NZ (2012) Subnational Projections Current Pattern of Building and Sub-divisional Development As in the previous section the population growth for the District is projected to be static and/or in decline. Historic trends of pockets of sub divisional and building activity in the form of modest lifestyle development around Te Kuiti, Waitomo Village, Mokau, and Awakino are also slowing. The sub divisional activity that was occurring in and around the Te Waitere area has slowed in recent years. Over the last five years there has been an average of 12 new dwellings constructed per year. In terms of subdivisions the average number of lots created over the same period has been 3. Whilst 151 new lots were consented over the last five years only 63 new dwellings were actually consented. While this is partly due to the delay between subdivision approval and building construction, there is also a backlog of undeveloped lots in the District which need to be factored into planning consideration Future Subdivisional Activity From a recent, informal, desktop planning exercise, drawing from development proposals which are known to officers and/or are in the early stages of consent processing, it has been identified that further growth is unlikely to place pressure on the provision of Council services. Indications are the recent trends of relatively slow development are likely to continue in to the foreseeable future. The demographic and development trends show that there is no demand for growth related infrastructure at the present time or in the foreseeable future. For the past few years Council has been working on improving the condition of its core infrastructure assets, particularly in the Water Supply and Sewerage activity areas, in order to support public health outcomes and to meet its Resource consent and other legislative requirements. The growth and development trends support an approach which continues to upgrade and maintain existing assets as opposed to the development of new capacity driven infrastructure. There is currently enough capacity in the infrastructure network to allow for minimal growth should it occur. Council does not anticipate any significant land-use changes during the period of this LTP. Potential societal change factors The age structure of the Waitomo District is among the more youthful in the Waikato Region (fourth- youngest in 2013) and experiences the least degree of population ageing. In 2013, 14.2 percent of the population is aged 65 years and over, and this is projected to increase to 19.4 percent by The proportion of the population under 65 years of age is relatively high at 85.8 percent in 2013, 82.8 percent in 2033 and 68.7 by The ratio of elderly persons to children increases slightly from 0.61 in 2013 to 0.98 in 2033, before increasing markedly to 2.71 in Draft Public Amenities Activity Management Plan Doc347241
327 Age-Sex structure for Waitomo District, 2013 and 2013 (medium projection) The District s population characteristics, which include a high proportion of Maori, can be expected to translate into demand for compatible services, e.g. community infrastructure in the form of increased recreational and cultural facilities. Council considers these changes have been adequately catered for in its LTP. Any departure from this assumption can be addressed during the 3-yearly review of the Plan. 3.2 Demand Projections Tourism Trends The impact of key demand areas for Public Amenities will be driven by the trends based on increasing tourism growth to the District, e.g. requirements for public parking, provision of sanitary services as well as the need to continue the beautification of our towns. A draft Tourism Feasibility Study of the King Country Region was prepared pre 2008, by Stafford & Associates Pty Ltd for Maraeroa C Incorporation. This study concluded that forecast visitor numbers to the region will increase from 139,000 in 2006 to 153,000 in In percentage terms this is an increase of between 22% and 25%. While these figures will have been impacted by the world economic downturn, they will still be relevant as economies progress over the coming years. Recent trends in local and international trends associated with experiencing our outdoor through cycling and walking has impacted on through traffic. This is particularly so in association with Pureora cycleway and the Great NZ Walk (Te Araroa) Social Trends There may be a need to be more culturally sensitive to the provision of specialist areas within our cemeteries for the expanding multi-cultural society within our country. The alternative use of Urupa for burials is a significant pattern for burials in the District as shown in the sanitary assessment. Any trend away from this will impact on Council s services by increasing the requirement for burial space in Council s cemeteries. Care will be taken to ensure that the long term planning of the Public Amenities activity takes into account the net effects of these trends Age Structure Within Council Cemeteries, any increasing demand for burial space at Council s cemeteries will also be driven by the ageing population of our District and the effects of any New Zealand wide pandemic Global Weather Trends Changing weather patterns in New Zealand and the Pacific along with the prolonged Canterbury Earthquake scenarios and Australian fires have increased the public awareness of natural disasters and their impacts. 36 Draft Public Amenities Activity Management Plan Doc347241
328 Central and Local Government is tasked with the oversight and administration of natural disasters and WDC s response is through the Civil Defence Activity and the Rural Fire Activity 3.3 Ability of the Activity to Respond At present cemetery sites are adequate; land is available for future expansion over the next years with the exception of Te Kuiti Cemetery where additional land has been sourced in 2013 year. Development costs associated with this can be funded by user charges, loans and any possible future Community Services Financial Contributions where growth is a part of the requirement for this expansion. There will however be ongoing development of the available land in readiness for its use as burial sites. These have been included in the growth section of the capital works. Car parking demand is not seen as an issue in the main towns of the District, with the exception of the township of Waitomo where growth is influenced by tourism. The local community is currently preparing a development plan for Waitomo Township which will identify any issues associated with carparking It is believed that toilet provision is adequate for the District and this will be confirmed by undertaking usage studies as part of the proposed redevelopment programme report. Location can also be considered at that time. Usage counts have recently shown the tourism numbers passing through Benneydale have impacted on the small toilet at this location. Similarly the summer town of Marokopa, where counts have identified the inadequacy of the public toilet. WDC has already funded replacement toilets for Benneydale which will be constructed early Council is a Rural Fire Authority in its own right and is currently in discussions regarding the formation of an enlarged Rural Fire Authority to streamline operations. Currently WDC is also seeking a shared service with Otorohanga District Council in an endeavour to improve the capability within this activity. Council is also a participant in the Western Waikato Operating Area (Waipa, Otorohanga and Waipa District Councils through a shared service) for civil defence and the Waikato Regional Civil Defence Group. 3.4 Demand Management The objective of demand management is to modify customer demand for services in order to maximise utilisation of existing assets. This can be achieved by focusing planning on maximising benefits to customers rather than on maximising the outputs from assets. The following strategies enable this objective to be met: Involving the community in policy and amenity development, and where practical transfer accountability for operating public amenities back to the community, e.g. Te Waitere Cemetery. Developing effective partnerships with community groups such as schools and private sector organisations for the provision of public amenities e.g. combined parking. Recovering costs by charging users, taking into account their ability to pay, assessing public and private benefit, as well as Council objectives. 3.5 Key Programmes to Meet Growth and Demand Strategy Council has a land bank facility adjacent to all cemeteries with the exception of Te Kuiti cemetery where further land purchase. This has been achieved in Most public toilets are located on road reserve or existing parks and this trend will continue, therefore future land requirements will be minimised. Some land may however be required to achieve a new disposal system for Mokau and negotiations are currently ongoing with the Ministry of Education Tactics To practice good demand management, in order to maximise utilisation of existing assets to meet the different types of growth. Renewal of existing assets to maximize potential where possible Costs Most capital expenditure is Level of Service related rather than growth related although the proposed toilets in Marokopa and Benneydale can be linked to tourism growth. Council proposes to fund growth related capital expenditure primarily by internal loans. Completion of Council s various strategies and AMPs will assist in identifying a future capital expenditure model and when these strategies and plans are complete, the outcomes will be included in this AMP. 37 Draft Public Amenities Activity Management Plan Doc347241
329 3.6 Capital Works Programmes to Meet Growth and Demand Capital works projects being planned to meet the growth in demand include: Figure 3.5: Capital Projects to Meet Growth Trend Project Key Service Criteria Forecasted Total Cost Confidence Level In Projections Estimated Timeline for Project Completion Increasing Death Rate and age structure Development Plan of new block at Cemetery at Te Kuiti Legislative Satisfaction $5,000 D Increasing Death Rate Development of new block at Cemetery at Te Kuiti Legislative Satisfaction $150,000 over 3 years ($50,000 per year) D Increasing Death Rate and age structure Development of new block at Cemetery at Piopio Legislative Satisfaction $6,000 D Tourism Provision of a caravan dump station at Benneydale Quality Satisfaction $15,000 D Te Kuiti Cemetery Expansion and Development The projections formulated in the Cemetery Sanitary Assessment forecast that additional minor developments will be required at the Te Kuiti Cemetery in the 2015/2016 financial year. The purchase of new land was undertaken in 2013 This purchase is required at this time to secure the future of the cemetery as adjacent land is currently being subdivided as lifestyle blocks although some difficulties have been experienced relating to land usage once it was purchased. Two projects have been identified associated with the land initially a development plan and then undertaking some development over the coming three years. Surplus land is to be leased. Areas of work required include the uplifting of covenants, tree removal / fencing access and development of area for burials Piopio Cemetery Expansion and Development WDC has land banked sufficient land for future developments at the Piopio Cemetery. The cemetery assessment identified the need to expand the usable year in approximately This involves minor levelling, fencing and grassing Provision of a caravan dump station at Benneydale Benneydale Township is strategically located on SH31 which is developing into a major tourist route resulting from the extensive tourist developments associated with Pureora Forest walkways and cycle tracks. For the protection of our environment it is considered prudent to establish such a facility in conjunction with the development of the new toilets in Benneydale. 38 Draft Public Amenities Activity Management Plan Doc347241
330 Other Capital Works Projects Being Planned: Trend Project Key Service Criteria Forecasted Total Cost Confidence Level In Projections Estimated Timeline for Project Completion Economic Tourism Implementation of Te Kuiti Redesign of Main Street Quality Satisfaction $150,000 (5yrs) $90,000 for gardens with $60,000 previously funded D Monies from 2016, 2017 years transferred to Plaza development Economic Social Expansion and upgrade of security camera network Safety $40,000 (subject to obtaining $30,000 grant) D Economic Social Replacement toilet Benneydale Environmental Economic $165,000 C Economic Social Replacement toilet Marokopa Environmental Economic $165,000 C Redesign of Te Kuiti Main Street / Implementation The current planters within the main street areas of Te Kuiti have deteriorated to the extent that a renewal programme is required. The design was funded in the 2011/2012 financial year and implementation is scheduled for the following five years. The last two years being utilised towards the plaza development associated with the railway project. Expansion and Upgrade of CCTV system WDC has received several requests for the expansion of the network, including the establishment of cameras around the newly developed railway complex. There is also a need to update some of the individual cameras which in some cases predate 2007 and the picture quality now available is far superior. It is anticipated a grant of $30,000 will be sought to part fund this development Replacement Toilets at Marokopa and Benneydale. Issues related to these tank type toilets were raised in the Sanitary assessment. Coupled with toilet counts that show excessive use for the facilities available and increasing tourism numbers WDC has proposed to replace these toilets over the next two years, preferably using the Piopio design to save on design costs. 3.7 Confidence Levels and Assumptions The population trends identified by statistical analysis of the 2013 Census are, inherently, inexact results and approximations. They rely on the robustness of the original collection methodology and base data, as well as that of statistical manipulation. This analysis assumes that the base information is accurate. The data used has been graded as per the Confidence Grading Scale explained in Section Risk Risk management is all about limiting the consequences of failure in our assets and services and therefore limiting the likelihood of this failure. See Section 5.5. Risk is also about Council s ability to meet future demand and changes. Council has a supply of landbanked land to meet future cemetery requirements. 39 Draft Public Amenities Activity Management Plan Doc347241
331 The study into toilet replacement programmes based on the sanitary assessment will assist Council to focus on future requirements and ensuring demand is met. Council has obligations under the Forest and Rural Fires Act 1997 to make provisions to mitigate rural fires in our district. Planning needs to ensure adequate trained staff are available should the Principal Rural Fire Officer for the district not be available and the proposed shared service with Otorohanga DC will greatly assist this.. Similarly, Council has an obligation to ensure that its obligations under the Civil Defence Emergency Management Act in relation to trained staff and procedures are met. There are risks in the preparedness of Council in these two areas of service delivery. 40 Draft Public Amenities Activity Management Plan Doc347241
332 Levels of Service: The Assets We Use 4.1 Description of Asset Base Figure 4.1 identifies the scope of assets covered by the Public Amenities Activity within the Waitomo District. Figure 4.1: Summary of Public Amenities Asset Type Quantity Cemeteries 8 Public Toilets 20 Public Car Parks 4 Street Furniture Amenity Areas Towns Amenity Areas Cemeteries CCTV System (township) CCTB System (Aerodrome) Civil Defence Rural Fire approx 330 items 28 beds ha 4 beds ha 1 system, 9 cameras 1 system, 1 camera Service delivery only Service delivery only Includes restricted toilets at Tui Park Campground and Mokau Domain A more detailed breakdown of assets is found in the base information for this Activity Plan. Note the amenitiy areas associated with Te Kuiti will have marginally changed due to redesign of the central road area. Cemeteries Council is required under the provisions of the Burial and Cremations Act 1964 to provide, maintain and manage cemeteries. Currently we provide and manage eight cemeteries throughout the District and have one Returned Services Association area within these facilities located at Te Kuiti Cemetery. In addition, Bylaws regulate activities within these cemeteries. Two of the eight Council cemeteries are either closed or have reached capacity with the only burials available being in reserved plots. There is however some debate as to whether the Mapiu Cemetery is officially closed or not and further investigation into this is required. There are also 28 identified Urupa located within the Waitomo District although it is believed other Urupa do exist. Any trend away from the use of Urapa will dramatically effect the burials in WDC cemeteries Although there is no crematorium facility located within the Waitomo District, Council does provide ashes plots and walls for the internment of ashes. An issue has recently come to light regarding unauthorised burials in the closed Kiritehere Cemetery which requires further investigation. The location, status and size of each of Council s cemeteries is presented in Figure 5.2 below. 41 Draft Public Amenities Activity Management Plan Doc347241
333 Figure 4.2: District Cemeteries Name Location Status Area (Ha) Brief Description Te Kuiti Old Cemetery Te Kuiti Open Monumental, open for ashes only Te Kuiti New Cemetery Te Kuiti Open Monumental Te Kuiti New Cemetery Expansion Te Kuiti Unavailable To be developed Mokau Cemetery Mokau Open Monumental Aria Cemetery Aria Open Monumental Te Waitere Cemetery Te Waitere Open Monumental Mapiu Cemetery Mapiu Closed (to be confirmed) Old monumental cemetery Kiritehere (Tahuna) Cemetery Kiritehere Closed (to be confirmed) Monumental Piopio Cemetery Piopio Open Monumental TOTAL Ashes walls are provided in the following locations: Aria Cemetery, Piopio Cemetery, Te Kuiti New Cemetery and Te Waitere Cemetery. Figure 4.3: District Cemeteries Assets Description Ha. Km. No. Horticultural Amenities - Grassed Area Amenity Garden Area Memorial Trees unknown Infrastructure Services - Kerb & Channel Edging unknown - Hard Surface Pads Roads Taps 2 - Water Tank 1 Furniture and Fittings - Flagpole 1 - Bins 7 - Seats 18 - Signs 4 - Table 1 Structures - Fencing Cattle stops 2 42 Draft Public Amenities Activity Management Plan Doc347241
334 Description Ha. Km. No. - Gates 10 - Walls Handrails Memorials 2 - Shelters, Pergolas, Structures 5 A more detailed breakdown of assets found in cemeteries is found in the base information for this Activity Plan. It is to be noted that Council has undertaken an extensive programme of asset identification since 2008 at its cemeteries. Confidence in this information would be graded as A. Public Toilets The purpose of providing public toilets is to ensure residents and visitors to the District have access to safe, clean and attractive toilet facilities. We currently provide and maintain in one form or another 20 public toilets throughout the District. The majority of these are located on parks and reserves or in the central business district of the major towns throughout the District, or alternatively located in outlying rural areas. Figure 4.4 identifies the number of public toilet facilities located in the areas that comprise the District. Note that other public toilets associated with Council s building complexes are not included in this AMP but in the associated AMP under which the building falls. Figure 4.4: District Public Toilets Ward Number Location Te Kuiti Area 7 Centennial Park Redwood Park TK Cemetery Brook Park Mangaokewa Reserve TK Rora Street Main Rora Street North Piopio 2 Tui Park Camp Area Piopio SH3 Toilets Waitomo 1 I-site Toilets* Other 10 Awakino Heads TOTAL 20 Kiritehere Vault Waikawau Vault Mokau Domain Mokau Boat Ramp Awakino War Memorial Hall (Leased) Mokau SH3 Toilets Te Waitere Toilets Marokopa Toilets Benneydale Toilets Te Maika Toilets (disbanded) *There is however a public toilet that Council does not manage, in the i-site at Waitomo Village. This is managed by the Waitomo Discovery Centre under a Service Level Agreement with Council. 43 Draft Public Amenities Activity Management Plan Doc347241
335 Te Mika toilet is disbanded although there has been a public request to reinstate a facility in this location. Should a decision to replace be made, a vault toilet will be installed utilising the current renewals budget Figure 4.5: District Public Toilet Minor Assets Description Ha. Km. No. Furniture and Fittings - Bins 3 Infrastructure - Hard Surface Pads Road Water Tank 3 Structures - Fencing.0075 Component building information is included in the Housing and Other Property AMP and detailed sanitary information, e.g. numbers of pans etc, is recorded in Section 5.4 of this AMP. Public Car Parks The purpose of providing car parks is to ensure residents and visitors to the District can access conveniently located off-street parking for motor vehicles. Council currently provides two car parks. These are located in the central business district of the Te Kuiti Township to allow facility users easy access to town shopping and adjacent facilities. The following table identifies the number and area of car parks located in the wards of the District. Figure 4.6 identifies the total number and area of car parks located in the District. Figure 4.6: District Public Car Parks Ward Number Hectares Te Kuiti Area Piopio 0 0 Other 0 0 TOTAL Figure 4.7: District Public Car Park Assets Description Ha. Km. No. Infrastructure - Roading Chip seal Kerb & Channel Paths Sumps 3 - Asphalt Street Furniture/Amenity Areas Community assets consist of two asset groups located on streets and other areas, in contrast to reserves throughout the District. The purpose of these asset groups is twofold. Firstly, it is to visually enhance the environment by providing a natural living component. Secondly, for furniture and fittings it is to provide the means and opportunity for people to relax and enjoy the natural living environment. The following Figure 4.8 identifies community asset components. Where figures are included in the number column this identifies the number of segments that comprise the total kilometres or hectares identified. Note 44 Draft Public Amenities Activity Management Plan Doc347241
336 these figures have not been updated since 2012 and will be reviewed as part of the improvement plan once the Te Kuiti mainstreet development has been completed Figure 4.8: District Street Furniture/Amenity Areas (based on 2011 data) Description Ha. Km. No. Horticultural Amenities - Grass Gardens Amenity displays Hedge Infrastructure - Roading Hard surface pads/paving CCTV System (2) 2 - Edging.0126 Furniture And Fittings - Bench seats 28 - Picnic tables 9 - Litter bins 53 - Bike racks 1 - Flagpoles 2 - Garden lights 20 - Information Kiosk 2 - Signs 13 Structures - Fencing Bollards 47 - Tree Guards 44 - Walls Monuments, Memorials, Plaques 17 - Shelters 4 - Bus shelters 2 - Water Feature.0015 (1) A breakdown of the components of this system is included in the appendices It is to be noted that Council has undertaken an extensive programme of asset identification related to Street Furniture and Amenity assets. Confidence in this information would be graded as A. Rural Fire Council is a Rural Fire Authority under the Forest and Rural Fires Act Council appoints a representative to the Waikato Regional Fire Committee which includes representatives from Otorohanga, Waipa, Waikato, South Waikato District Councils, Department of Conservation, New Zealand Fire Services, National Rural Fire Authority, Pumicelands Rural Fire District and Thames Valley Rural Fire District. Council has one Rural fire party situated at Mokau, known as the Tanui Rural fire party and also contributes operational funding for the management and delivery of rural fire services. The Council has in place a Fire Plan which sets out the framework for reducing fire risk, being ready for an event, responding to and recovering from a fire event. It covers the period September 2014 and September 2016 and has been adopted by Council. 45 Draft Public Amenities Activity Management Plan Doc347241
337 Council is currently investigating the forming of an enlarged Rural Fire District, with Otorohanga, Waipa, Waikato and Department Of Conservation and other District councils in the Hauraki plains and Thames which is being facilitated by National Rural Fire Authority. The purpose of this is to streamline and improve the effectiveness of rural fire management in the Waikato Valley Area. The new Rural Fire District will be governed by a body corporate committee. As an interim until the outcomes of the development of an enlarged rural fire district and the likely impacts on service delivery, WDC in 2014 has entered into a Shared Service arrangement with Otorohanga District council for the provision Rural fire and to meet our statutory obligations. Council considers that this activity is undertaken to benefit the wider public generally in avoiding the consequences of uncontrolled fires. Therefore it is a public cost although some subsidy assistance is available from the national Rural Fire Authority and recoveries can be achieved in certain circumstances from those who cause fires. Through after hour services, Council s after-hours phone contractor, there is continuous 24-hour coverage to react to emergency situations. Council operates a Customer Services Request system where requests or complaints are logged and investigated and as necessary actioned and closed out. Rural Fire calls are directed to Rural Fire Network. Council is currently negotiating a shared service with Otorohanga DC to improve Councils capacity within this activity. Civil Defence The legislation requiring the provision of these services is the Civil Defence Emergency Management Act There are specific requirements detailed in the National Civil Defence Strategy, the National Civil Defence Plan, the Waikato Regional Civil Defence Emergency Management Group Plan (2011), and the Forest and Rural Fire Regulations The range of emergencies that occur in New Zealand are mostly related to flooding or earthquakes. Council must not only react to the immediate emergency to counteract the immediate effect of any disaster, but must also manage the medium and long term recovery in the District to help residents live their lives as normally as possible after an emergency. Council has a shared service with Waipa and Otorohanga District Councils to deliver the day to day operational Civil Defence activities and is an active member of the Waikato Civil Defence Group 4.2 How Assets Work Performance Cemeteries Council prepared a Cemetery Sanitary Services Assessment in 2008 (updated 2014) to consider the adequacy of the provision of cemeteries in meeting future demand for the period and to outline the direction and policies for the operation and development. Analysis shows that the land areas provided are adequate to meet the needs of the community, with the exception of Te Kuiti Cemetery (since purchased), Piopio cemetery in the later year of the LTP, although some cemeteries will require development of berms to provide burial areas. Figure 4.9: Provision of Cemeteries (1) per 1,000 Population Mokau Cemetery Location No of Cemeteries Total Area Population Ha/1000 People Te Kuiti , Piopio Other , District-wide , (1) Includes closed memorial cemeteries The cemeteries operated by Council have casual operating procedures in place to safeguard public health although it is considered that these need a review and the establishment of an ordered operating system. Similarly, adequate survey maps/layout maps need to be prepared to ensure orderly development of, and 46 Draft Public Amenities Activity Management Plan Doc347241

338 burials in, the cemeteries. Council has embarked on an update of procedures and mapping. This is included in the current budget. No auditing of procedures is undertaken at present. Public Toilets The provision of public toilets throughout the District was seen adequate to meet the estimated demand within the District for the 10-year planning period (as confirmed by the Sanitary Assessment), when considered with a slightly decreasing population and an anticipated corresponding increase in tourism numbers. However a review of user counts in 2013 identified an issue at peak times at Benneydale and Marokopa. The provision of toilets per 1000 residents is more than double the average of those Councils partaking in Yardstick surveys. It is to be noted through that there are three influencing factors: the average is influenced by toilet provision in the cities Waitomo is a large rural district and other rural districts have higher than average provision The size and nature of our district, especially the small settlements adjacent to the coast Council carried out its Toilet Sanitary Services Assessment (Public Toilets) in 2008 with reviews in 2011 and The performance of WDC public toilets in meeting the expectations of residents and visitors was determined in the study by assessing each facility against a number of criteria including hygiene, safety/security, accessibility and convenience. A number of facilities (structure and fit out) were identified as being less than adequate in one or more performance factors. In the LTP Council provided an allowance to bring these toilets up to standard by providing a renewals budget of $20,000 per year. Minor renewals works have been progressed since that time untilising this ongoing budget. These include: Kiritehere Vault : new roof, painting and general refreshment of facility Waikawau Vault : new roof, painting and general refreshment of facility Piopio Main Street Toilets : effluent field additions, minor electrical work, painting Mokau Boat Ramp : new piping, signage Centennial Park : new partitioning and security work Brook Park : complete refurbishment due to arson attack Awakino Heads : reinstatement of effluent piping Awakino War Memorial Hall : new pipe to effluent field Te Kuiti Cemetery : maintenance to water supply tank Mangaokewa Reserve : seats/basin replacements Figure 4.10 details number of public toilets in the District s urban centres. Figure 4.10: Public Toilets in Towns and Settlements Location No. of Toilet Blocks Population Toilets/1,000 People Te Kuiti Area 7 4, Piopio Waitomo Other 10 4, District-wide 20 9, Note public toilet provided privately in Waitomo in various forms Public toilet usage is governed by two features namely that several of the toilets are on SH 3, the main road between the Waikato and Taranaki, and also the location at many beach resorts where summer holiday makers/campers reside as well the trend towards cycling and walking. Public Car Parks Off-street car parking has been provided in four locations in the Te Kuiti Township. The adequacy of off-street car parking in central Te Kuiti has not been raised as an issue in previous annual plan processes. 47 Draft Public Amenities Activity Management Plan Doc347241
339 Public off street parking has however been raised as an issue within the areas of the Arts & Cultural Centre where only 7 car parks are provided. A combination of on street parking and lawn areas provide most of the parking. This is an issue at times of poor weather and Council has jointly funded with the local kindergarten to joint venture the provision of further parking adjacent to the two sites. Note that off-street car parking associated with complexes such as the Library are included in the relevant AMP for that activity. Carpark Location Carpark Spaces The Cottage Carpark 29 TK Sports Centre Carpark 25 TK South end Carpark 25 TK Taupiri St covered parks Utilisation Cemeteries Council s Cemetery Sanitary Services Assessment shows the latest figures of total burials, actual and predicted, in the District. There are over 746 plots currently available in the District, made up of the various types of plots, although availability might not meet specific local demand. As a result there has been a need identified to further develop specific cemeteries, including Piopio Cemetery and with Te Waitere Cemetery which was expanded in Development projects are included in the projects associated with the maintenance of service levels. Figure 4.11: Cemetery Burial Numbers Cemetery Burial Numbers (calendar year) Te Kuiti Old Cemetery Te Kuiti New Cemetery Piopio cemetery Mokau Cemetery Aria Cemetery Mapiu Cemetery Te Waitere Cemetery Kiritehere Cemetery Totals The availability figure mentioned above for 2014 does not include the months of November and December and does not include undeveloped areas. A reassessment of the need to bring forward the development of new areas of cemetery land will need to be reviewed as part of Council s Pandemic preparedness. Council has closed the Kiritehere and Mapiu cemeteries with the only burials available being in reserved plots. Note that the procedure in establishing whether these cemeteries are closed needs to be investigated. Data shows that only about 40% of Waitomo residents were buried in one of the District s cemeteries after their deaths for the period This means that the majority of deaths in the District are either being buried outside the District or in Maori Urupa. Any major change to this percentage will significantly affect the rate of use of Council s cemetery land. Public Toilets The Toilets Sanitary Services Assessment estimated the extent of use of the public toilets within the District to categorise the facilities. The report concluded that of the 19 public toilets located on parks and reserves or in the towns managed by Council, 8 had low, 3 medium and 8 had a high extent of use. The high value is in many cases governed by high seasonal demand at beach reserves. 48 Draft Public Amenities Activity Management Plan Doc347241
340 Public Car Parks No utilisation assessments have been undertaken relating to public car parks Street Furniture/Amenity Areas Key items in this category are bins and seating, statues, garden areas, CCTV system and clocks. Again no assessment of utilisation has been undertaken, but where bin capacity appears to be insufficient either the emptying contract regime is amended or the size of the bin changed. 4.3 Asset Condition/Remaining Life Details of asset condition for the different groups of assets are included. In summary these show that the activity s assets are in average to poor condition overall. These figures have not been updated for this AMP Split by asset category and type they are: Cemeteries Figure 4.12: Conditions of Cemetery Assets Based on 2011 data Infrastructure Furniture & Fittings Structures Number Condition Grade Number Condition Grade Condition Grade Public Toilets Figure 4.13: Conditions of Public Toilet Assets Number Infrastructure Number Furniture & fittings Condition Grading Condition Grading Number Structures Number Toilet building components Condition Grading Condition Grading Public Car Parks No condition grading has been undertaken for car park assets with respect to the hard surface. This also applies to the roading, parking hard surfaces associated with the cemeteries above. Street Furniture 49 Draft Public Amenities Activity Management Plan Doc347241
341 Figure 4.14: Conditions of Street Furniture Assets Infrastructure Condition Grade Number Furniture & Fittings Condition Grade 4.4 What the Assets are Worth Public Amenities assets are classified as infrastructure assets, defined as fixed assets that provide a continuing service to the community and are generally not regarded as tradable. The valuation of assets associated with Public Amenities Activity is made up of the following: Figure 4.15: Valuation of Public Amenities Assets Asset Value Land Value (1) Cemeteries Public Toilets Public Car parks Amenity Areas $ 279,900 $ 4,850 $ 206,000 On road Buildings Reinstatement Value Cemeteries Public Toilets Public Car parks Amenity Areas $ 21,000 $1,263,300 Unavailable $ 1,119,800* Improvement Value (1) Cemeteries Public Toilets Public Car parks Amenity Areas Horticultural Amenities $ 25,650 $ 26,600 $ 128,000 Unavailable Included Hard Surfaces Roading Car parks Footpaths Furniture Included Included Included Included Utility Services Included * does not include CCTV Reinstatement Value 50 Draft Public Amenities Activity Management Plan Doc347241

342 The total value of the Public Amenities Activity is $2,924,000. Land and Improvement values are based on the rating value which was reassessed in 2011 by Darroch Limited. Building reinstatement values were prepared in 2014 by Quotable Value. This value will be systematically amended as the information is gathered to allow the above table to be completed based in actual assets on site. Note that this is assumed as the building values have been deducted to arrive at the improvement value as these will be included in other AMPs. The improvement value will be decreased as improved information relating to detailed asset values is obtained and included in the table above. Also there has been no value attributed to the amenity garden areas in the town. A considerable investment has been made in these areas and there is a continual need for renewing beds. 4.5 Confidence in Our Data The data used in the asset summaries above has been graded C as per the Confidence Grading scale explained in Section 6.5. The condition, utilisation and performance information is graded between B/C. Figure 4.16 Assessment of confidence - Public Amenities Assets Element Confidence Grade Comment Asset type B Data structure in use but gaps in information held. Installation Date C Installation date assumed for majority of assets. Location C Location generally determined by building location streets and parks Quantity B Most assets captured with exception of underground utilities Size/ number B Good information most assets Materials B - C Information on materials accurate as to assumptions from asset gathering and the broad categories used Condition B Individual assets graded for categories used Performance C Some performance information held Useful Life C Some Useful lives assessed. Unit Cost D Valuation not componentised (outdated). Redwood Park Public Toilets 51 Draft Public Amenities Activity Management Plan Doc347241
343 How We Manage the Service (Lifecycle Management) 5.1 Operations and Maintenance Strategies/Tactics Council policy regarding the management of Public Amenities is to encourage community involvement, especially associated with street amenities. This will be achieved through planned consultation associated with future upgrades of the street amenities. Other groups that influence the management of Public Amenities in the District include urban and rural Councillors. The following Figure 5.1 details Public Amenities administered in part or in full by other groups. Figure 5.1: Public Amenities Advisory Groups Facility Administering Group Activities Streetscapes Piopio Main Street Piopio Main Street Committee Street Amenities, Toilet Development Te Kuiti Main Street Te Kuiti Development Inc Street Amenities / Promotions Benneydale Township Benneydale INC Street Amenities / Promotions Cemeteries Te Waitere Cemetery Te Waitere Cemetery Group Cemetery Maintenance / Graves assistance Rural Fire Rural Fire Mokau Rural Fire Brigade Rural Fire Provision WDC Shared Service Agreement Civil Defence Regional Civil Defence Joint Committee Waikato Regional Civil Defence provision Region Civil Defence Co-ordinating Executive Group Regional Civil Defence Western Waikato Civil Defence Emergency Operating Area WDC Shared Service Agreement Local Civil Defence provision The operations and maintenance of Public Amenities is undertaken through a combination of competitively let tenders, negotiated contracts and Council s own staff and volunteers. Overall the total direct expenditure budgets for this activity are: Figure 5.2: Annual Budgets Direct Expenditure Budget Code Public Amenities Activity Budget (2008/2009) Time of LTP Budget (2014/2015) Current 240 Public Toilets $217,022 $209, Cemeteries $58,425 $76, Street Furniture/Amenities $248,480 $249,663 * garden maintenance and mowing undertaken in-house) 243 Public Car parks $8,610 $9, Rural Fire $12,623 $65,248** 522 Civil Defence $21,285 $62,300 *** Note * major redistribution of mowing and gardening budgets as the ISU established, so that costs accrued to the correct cost centre Note ** includes $35,000 for enlarged fire district Note *** Increased costs associated with the Western Waikato Shared Service and increased legislative focus on this activity 52 Draft Public Amenities Activity Management Plan Doc347241
344 In small communities it is often difficult to obtain competitive tenders and Council is reassessing the method of delivery of some maintenance services. This is also being looked at from a responsiveness aspect where sometimes there is a response lag when using out-of-district contractors. The provision of garden maintenance and some cleaning services since the 2009 LTP, have been investigated and in 2009 the provision of garden maintenance was bought in-house to assist Council in achieving a sustainable budget moving forward. Similarily, the mowing of parks, property and other areas were bought in house when the contract expired in June 2012 The various contractors who are currently responsible for maintenance and renewal of cemetery assets, toilet assets, as well as street amenities are shown below. Maintenance standards set by Council noted in contracts Figure 5.3, which are competitively tendered in most cases for set periods, apply to all asset components identified in contract specifications regardless of their location or profile. Several specialist maintenance services are provided by external providers on a non competitive basis - this includes provision of security, sanitary facilities etc. Some operation/maintenance is also provided by Council s staff, e.g. furniture maintenance, grave digging. The difficulty in obtaining competitive tenders was recently highlighted when tenders for the cleaning of the southern toilets was sought with very little interest. Figure 5.3: Maintenance Contract Details Contract Date let Term Contractor Cost / Budget for Mowing Contract Cemeteries 01/07/ yrs renewal to June 2019 Internal Services Unit $38,062 Street Amenities $94,000 Garden Mtc Contract Cemeteries 01/07/ yrs renewal to June 2019 Internal Services Unit $38,062 Street amenities $94,000 Cemeteries Contract Burial Services 01/07/ yrs renewal to June 2019 Internal Services Unit Varies on location Miscellaneous Car Park Maintenance (1) Casual (Roading Contractor) Casual Various $7,536 Sanitary Services Te Kuiti Toilets (7) Piopio Toilets Te Waitere Marokopa Awakino/Mokau ( 4) Benneydale 01/03/ yrs Initial $6,774 $864 $235 $235 $942 $235 Bin emptying Downers Included in road maintenance contract Septic Tank Emptying 01/07/ monthly Hydro Tec ltd $ Draft Public Amenities Activity Management Plan Doc347241
345 Contract Date let Term Contractor Cost / Budget for Cleaning Contracts Mostly renegotiated on yearly basis due to difficulty in obtaining tenders Te Kuiti Toilets (7) Piopio Toilets Te Waitere 01/09/ /07/ /07/ yrs 1 yrs 1 yrs OCS Ltd MacDougal Boat Club $38, $7,675 $4,018 Marokopa Awakino/Mokau ( 4) 01/07/ /10/ yrs 1 yrs Hall Putt $6,505 $16,459 Benneydale 01/07/ yr Ali $7,248 Western Waikato Civil Defence Shared Service Agreement ongoing ongoing Waipa DC as administrator $49,500 Waikato Lifelines ongoing ongoing Waikato Engineers Lifelines Project $3,000 Shared Service Rural fire provision ongoing ongoing Otorohanga DC as administrator $35,000 (1 ) Estimate only - yearly works based on annual visual inspection. Implemented 2008/09 The maintenance and renewals required for car parks is to be based on an annual inspection undertaken by Council s roading contractor, with the value of works undertaken based on roading contractual rates. This process was implemented over the period and is now ongoing. LoS for toilet cleaning is outlined in each contract, and bin emptying is outlined in the Solid Waste Envirowaste contract. These are monitored based on any ongoing issues raised though complaints. Toilet cleaning regimes are based on usage. Mowing and ground maintenance LoS within cemeteries and street areas are specified within the ISU mowing contract. Similarly work schedules and programmes are prepared for the in-house staff undertaking the garden maintenance and are based on the historic garden maintenance contract. Actual burials are undertaken by Council staff and are directly reflected in Council s charges for this service, although this requires a full review. All cemetery operations are covered by Council s Bylaws and procedures. These contracts specify the LoS, performance criteria, standards and reporting details for the following activities. Further detail is provided in 'contract tables' throughout the following lifecycle management sections: Figure 5.4: Standards Identified in Contracts Garden maintenance( in-house schedules and programmes) Civil Defence Provision Removal of graffiti (minor) Edge trimming Toilet cleaning Mowing Routine inspections Emergency works Litter control Sanitary Services 54 Draft Public Amenities Activity Management Plan Doc347241
346 Any work carried out will be in accordance with industry 'best' practice and where possible costs benchmarked against information gained through Council s participation in Yardstick. In some cases different standards apply to different facilities. Where standards change it is usually in response to community demands or financial constraints. However, the primary objective is to provide a consistent standard of management for similar facilities. In general the management standards set for Public Amenities facilities relates to one or more of the following characteristics: Figure 5.5: Standards Relate to Following Characteristics Public safety Location Value to community Capital investment National or local significance Specialised use Community use RSA requirements Planned Inspections Regular inspections assess the condition of public amenities assets, identify future risks and maintenance needs, or repair work that is required. The frequency of inspections is based on the outcomes of any asset failure for Levels of Service, costs, environmental impacts or corporate image. The inspection programme will be regularly reviewed and modified in response to unplanned maintenance and risks. The following Figure 5.6 identifies the required actions for carrying out planned inspections. Figure 5.6: Inspection Details Asset Frequency Inspector Checks Cemeteries Random monthly inspection related to mowing, garden maintenance and toilet inspections Community Services Officer General condition of asset, Contractor performance where appropriate Street furniture - and Miscellaneous Street structures No inspection regime - adhoc Community Services Officer Vandalism, graffiti, damage, obstructions, safety, security Public Toilets Monthly inspection Random inspections Community Services Officer Contractor Council staff for coastal toilets Vandalism, graffiti, damage, obstructions, safety, security, Contractor performance Public Car Parks Yearly inspection (to be implemented) Councils Roading Contract Supervisor General condition of asset Planned Maintenance Planned, non-critical maintenance accounts for approximately 90% of the total maintenance budget. The 'Contract tables' in each of the asset sub-sections detail the percentage of planned works. This work usually involves routine maintenance. For example, garden and lawn maintenance, litter removal, shrub pruning and spraying according to Contract specifications. The scheduling of works is the responsibility of the Contractor or in-house staff who optimise work activities in order to meet specified minimum service standards. Specific activities planned for maintenance of assets are also detailed in the 'Contract tables' where information is currently available. Planned maintenance of higher value or critical works specified in maintenance contracts ensures that assets remain in satisfactory condition as well as managing the risk of potential asset failure. These are dependent upon assessment factors such as: a. Impact of failure b. Rate of asset decay c. Economic deficiency 55 Draft Public Amenities Activity Management Plan Doc347241
347 d. Weather conditions e. New Zealand Safety Standards Unplanned Maintenance Unplanned maintenance accounts for approximately 10% of the total maintenance budget. No monies are currently identified for building maintenance this need to be addressed as currently it is included in Housing & Other Property as well as the public amenities budget. A breakdown of the current budget is required so that building maintenance is coded to the correct activity area. Within the lifecycle plan for each asset category the percentage of unplanned works is identified in the 'Contract tables'. This work usually involves extraordinary maintenance. For example, contingency works, emergency repairs, removal of storm damage when requested by Council. The unplanned maintenance priorities are: a. Concern for the safety of users and adjacent property owners b. The likelihood that if repairs are left unattended the final cost could increase c. Secondary works may be dependent upon primary works. 5.2 Renewal Renewal Strategies The general renewal strategy is to rehabilitate or replace assets based on three factors - asset performance, economics and risk. Generally renewals are identified although some minor renewal work is undertaken utilising a general repairs and maintenance allowance included in most direct expenditure budgets. As asset information is improved, budgeting for renewals improves by creating individual renewal budgets. Historically, prior to 2008, Council removed rather than renewed assets as they came to the end of their economic life. This was particularly so with assets such as tables, seats and BBQ s which are now shown as concrete pads only. Parkcheck identified these assets as important features that would increase satisfaction. Asset Performance Asset performance is a combination of where an asset fails to perform to the required Levels of Service identified by measuring the asset's condition and performance during inspections and investigation of customer complaints. Indicators of non-performing assets include: Economics Repeated asset failure Poor appearance Low customer satisfaction Frequent vandalism Unsafe Low use rates The objective for renewals is to achieve: Risk The optimum lifecycle costs for the asset Savings by incorporating renewal works with other works The objective in reducing risk is to prioritise and programme work according to the following criteria: Public safety Legislative requirements Environmental risk Financial risk of deferring work Importance of asset location Intensity of use 56 Draft Public Amenities Activity Management Plan Doc347241
348 5.2.2 Condition Assessment The assessment of asset condition is essential for AM planning. The data collected from regular inspections is used to determine: What stage an asset is in its lifecycle The remaining effective life of an asset The deterioration rate of an asset When rehabilitation or replacement of the asset is required Financial forecasts The risk of asset failure The frequency of inspection required to manage risk of failure. Council in 2008 established an asset register associated with this activity and part of this update has been to establish condition grades for building components and all other assets. Refer to summaries in Section 4.2. Where known issues have been experienced, these tables have been updated in Building inspections have also been undertaken and component conditions have been established, although this area of work is still in its early stage of development. This data is used to support core AM activities. For example, risk management, predictive modelling, planned maintenance and rehabilitation, asset valuation and budget forecasting. Asset condition data collected allows for: Planning for the long-term delivery of the required Levels of Service Prediction of future expenditure requirements Management of risk associated with asset failures Refinement of inspection, maintenance and rehabilitation strategies Selection of work priorities Using cost effective renovation options to avoid premature asset failure The condition of assets is rated according to the New Zealand Parks and Recreation Asset Condition Grading Standards Manual (PRAMS). This defines specific rating standards and definitions for various asset groups based on the following general condition rating standards. These condition ratings are then loaded into the Excel database for Public Amenities to identify maintenance, development and renewal or disposal works. Figure 5.7: Condition Grading Criteria 0 Non-existent - Absent or no longer exists 1 Excellent Sound physical condition; no work required 2 Good - Acceptable physical condition; only minor work required if any 3 Average - Significant deterioration evident; work required but asset is still serviceable 4 Poor - Failure likely in the short term; substantial work required but asset still serviceable 5 Very Poor - Failed or failure imminent; major work or replacement required urgently Renewal Standards The standards and specifications for renewal works are generally the same as new works Key Renewal Programmes Several Public Amenities assets have been assessed as less than average and will require renewal works. A minor renewals amount for Public Amenities is required on an annual basis for such things as bins and tables. Mokau toilet effluent system does not cope with the growth in usage from passing traffic and a redesigned system is urgently required. 57 Draft Public Amenities Activity Management Plan Doc347241
349 Figure 5.8: Renewal Programmes Project Key Service Criteria Forecasted Total Cost Confidence Level In Projections Estimated Timeline for Project Completion Public Amenities General Renewals Quality Satisfaction $215,000 (10 yrs) $21,500 annually from year 2 C - D Based on priorities of Sanitary Assessment Toilets Mokau Toilet Effluent System Quality Satisfaction $120,000 D Existing funding Cemetery Accessway Upgrades Quality Satisfaction $31,740 over 3 years plus $10,580 currently funded D Continue programme existing Table and Bin Renewals Quality Satisfaction $52,900 (10yrs) $5,290 annually D Te Kuiti Overbridge Renewal Works Quality $140,000 over 2 Years $60,000 yr 1 $80,000 yr 2 D TK Sports Complex carpark renewal Civic Centre Carpark Reseal Quality $8,000 D Quality $15,000 D Toilet Renewals Programme The Toilet Sanitary Assessment identified toilets requiring upgrade due to compliance requirements and use requirements in relation to the public toilets standard. However, it is unknown whether the existing toilets are located where the most need is. There is a need to do a further assessment on use/location to ensure any future renewals or new development is in the best interest of Council and will cater for the community s future requirements. As an interim, minor renewals / maintenance has been undertaken at these toilet facilities identified as requiring the most urgent attention. Mokau Toilet Effluent Disposal Upgrade The Toilet Sanitary Assessment identified health, quality and satisfaction issues with the disposal system associated with the Mokau Public Toilets. There have been historical issues with this system as well. The assessment recommended immediate actions to rectify these issues and therefore works were scheduled for 2009/2010 financial year. Difficulty has been experienced in achieving an adequate solution to the issues of effluent disposal at Mokau and temporary high maintenance regimes have been implemented since 2010 as an interim measure. Further funding for land purchase was included in this plan as a capital project to allow for purchase of land, this is now almost complete and the effluent field will be installed in 2015 Table and Bin Renewals Council, for a long period of time has not undertaken renewals of the street furniture in our towns, especially the smaller towns and coastal areas and has removed these assets as they came to the end of their economic life. This monetary allowance is for the gradual renewal over time of these assets. 58 Draft Public Amenities Activity Management Plan Doc347241
350 Cemetery Accessway Upgrades Accessways to WDC s cemeteries are generally in poor condition with the exception being part of the New Te Kuiti Cemetery. A program to upgrade these and possible seal the key cemetery entrances will be undertaken. Te Kuiti Overbridge Renewal Works An engineering assessment of this overbridge has been undertaken in 2014 and identified considerable renewals work especially around handrail safety compliance and some dislodged / rotten timbers. This is a key structure within the Te Kuiti central business area and works will be programmed immediately to address the issues raised. TK Sports Complex carpark renewal This carpark is contributing to the water tracking issues and some hotmix re-levelling is required to address the ponding issues and minimize its effect on the building Civic Centre Carpark Reseal This carpark is in very poor condition with much of the existing seal broken away. A reseal of the total area is required after repairing those areas that have opened up Deferred Renewals Works identified in terms of renewal strategies may be deferred where costs are beyond Council s current ability to fund them. This may occur where higher priority works are needed for other infrastructure assets, or there are short-term peaks in expenditure or inadequate funds exist. 5.3 Disposal and Rationalisation Any disposal of land/building assets would follow the process for disposal as identified in the Housing and Other Property AMP, the procedure was adopted by Council in Council has, in its Sanitary Assessment (Cemetery), identified one specific type of rationalisation with the closure of the Mapiu Cemetery. Toilets are historically located and may not be in the area of need. While the Toilet Assessment looked at existing provision and quality it does not investigate location. A LoS project in 2012/2013 is identified to take the assessment to another level so that it can be used as a guideline document for future toilet replacement and possible rationalization. The leisure strategy may also identify areas for possible rationalization. Figure 5.9: Possible Rationalisation Facility Mapiu Cemetery Toilets Action Closure of cemetery (confirmation) Assessment of need and location 5.4 Assessments Undertaken (Cemeteries/Public Toilets) Sanitary services assessments as specified under the Local Government Act 2002 have been undertaken and completed for Council in 2008 and reviewed in 2011 and 2014 and consulted with the community as part of the consultation process during the development of the LTP. Note: No sanitary assessment has been undertaken for Councils swimming pool. Facilities assessed included: Toilets provided by the Council or community groups and located in parks, reserves, and civic areas. Toilets provided by other public agencies and located in parks and reserves. Temporary provision of public toilets for events and gathering in public places such as parks and reserves. Campervan waste disposal activities. Cemeteries administered by Council. The assessment determined there were adequate toilet and waste disposal facilities and cemeteries to meet both current and future demand although considerable burials appear to be undertaken at Urupa and 59 Draft Public Amenities Activity Management Plan Doc347241
351 this could impact on Council s facilities in the future should the availability of space decline at these facilities. Public Toilets The initial 2008 sanitary Assessment of the performance of Council s Public Toilets in meeting expectations of residents and visitors was determined by assessment of each facility against a number of criteria including hygiene, safety/security, accessibility and convenience. It is believed that this assessment is still relevant at the current time with the exception of those areas where upgrade works have been undertaken. A grade of 1 was considered unsatisfactory, 3 considered adequate and 5 considered very good. Where a facility was identified as being less than adequate in one or more performance factors it is therefore considered as a priority for upgrading as shown in the figure below. The balance can be identified from the sanitary assessment An assessment of the current performance of the districts public toilets in meeting the expectations of residents and visitors was determined by assessment of each facility against a number of criteria including hygiene, safety /security, accessibility and convenience. A grade of 1 was considered unsatisfactory, a grade of 3 considered adequate and grade 5 considered very good. A number of facilities were identified as being less than adequate in one or more performance factors and are considered as a priority for upgrading. 60 Draft Public Amenities Activity Management Plan Doc347241
352 Figure 5.10: Facilities that should be considered for upgrading (as they have a grade 1 in one or more category) Facility Name Opening Hours Days open per year Extent Of Use Kiritehere Vault Toilet HIGH Sex Safety / security Hygiene Equality Convenience Privacy Score Performance Weighted Score M F Rank Priority 1= 8 Waikawau Toilets HIGH Marokopa Toilets HIGH Piopio Toilets HIGH Mokau Boat Ramp MED Centennial Park Toilets MED Brook Park Toilets LOW Mokau Domain LOW Awakino Heads Toilet LOW M F M F M F M F M F M F M F M F = Awakino War Memorial Hall LOW M F Te Kuiti Cemetery Toilets LOW M F = 9 Mangaokewa Toilets Reserve LOW M F = 9 Benneydale Toilets LOW M F Tui Park Toilets Res 365 LOW M Note that this assessment is based on compliance and suitability and not building condition/ layout. In many cases the building layout will not allow for change. 5.5 Managing Risk Council has undertaken risk identification for Public Amenities and the formation of a risk management plan is a key issue to be addressed. It is to include a Public Health Risk Management Plan, pandemic planning and investigations to establish as-built information. Risk management is all about limiting the consequences of failure in our asset and service and therefore limiting the likelihood of this failure. 61 Draft Public Amenities Activity Management Plan Doc347241
353 5.5.1 Risk Management Context Risk = (failure consequence X likelihood of failure) A pragmatic approach has been taken to risk management in identifying risk events; they have been grouped into: Natural events, where there is no real control over the timing or extent of the event, although probabilities may be understood, e.g. floods, lightning strikes, earthquakes. External impacts, where other service providers are not providing services which impact on the organisation or individuals, e.g. power supply failures, material supply failures. Physical failure risks, where condition or performance of the asset could lead to failure. Operational risks, where management of the asset or asset management activities may impact adversely on the asset. These risk events, while impacting directly on the asset and service, have other consequences on such things as: Repair costs Loss of income Loss of service Loss of life, or injury Health impacts Damage to property Failure to meet statutory requirements Third party loss Loss of image Stages of Risk Management Risk Identification - In the identification stage all risks should be noted, however further work is required to identify other specific risks to Public Amenities assets. The matrix chart as detailed below identifies some of the risks (threats) that could impact on Public Amenities assets and Council Staff. Risk Evaluation Evaluation requires that all risks are measured as to the likelihood of them occurring, and then put a value on them; this can be by way of a risk in dollar or non dollar terms. To quantify risks in dollar terms a calculation can be made if you don t insure against a particular situation, e.g. a fire what will it cost to replace the asset? Impacts non-dollar terms could be stress on staff, business interruption, staff down time. Risk Management Management of the risks to Public Amenities assets requires that staff exercise judgement regarding avoidance, reduction or transfer. It is proposed that risk will be avoided, mitigated, reduced or transferred by the following means: Avoid risk by - Changing location, procedures, materials, or equipment and/or no longer provide the service or asset that presents the risk. Reduce the risk by - The Installation of security devices such as dead locks, security systems, smoke alarms, sprinklers or safety doors etc; Formulating procedural safeguards, such as condition assessments, security patrols and performance evaluations; and further training to educate Staff and Contractors in safe working conditions and emergency procedures. Transferring the risk - Legal methods to assign the risk of potential losses to a third party by Insurance or altering the terms or conditions of contracts or adding this risk to new contracts. Retention of risk Council takes on the risk; but at the same time making appropriate financial reserves available. Council has various property assets where the risk to the asset is low, where this is a workable option. Increasing insurance premiums and insurance excesses are also forcing the retention of further risks onto Council. 62 Draft Public Amenities Activity Management Plan Doc347241
354 The probability of physical failure of an asset is related directly to the current condition of the asset, hence the importance of realistic and accurate condition and service assessment. The effort put into assessing and managing risk needs to be proportional to the risk exposure. Within the public amenities area the key risks centre around failure of structural assets associated with toilets or associated with cemeteries. Natural events, e.g. flooding, are mitigated by closing the facility although no risk plans have been finalised. This work is included in the improvement plan Measures of Likelihood of Risks Measures of likelihood or probability are explained in the table below: Table 5.11: Probability Table Likelihood Descriptor Description 100% Probability of Failure Probability 9-10 Almost certain The event is expected to occur in most circumstances 7-8 Likely The event will probably occur in most circumstances 5-6 Possible The event should occur at some time 3-4 Unlikely The event could occur at some times 1-2 Rare The event may occur but only in exceptional circumstances Within 1 year 0.9 Within 2 years 0.5 Within 3 10 years 0.15 Within years 0.07 After more than 20 years Draft Public Amenities Activity Management Plan Doc347241
355 5.5.4 Measures of Consequence Figure 5.12: Measures of Consequence or impact CONSEQUENCE DESCRIPTION FINANCIAL TECHNICAL PERSONNEL INCIDENT OR ACCIDENT SOCIAL POLITICAL COMMERCIAL 1 Negligible <$10,000 Minimal impact to production. First aid treatment. Limited lost time. Minimal impact or disruption. Minimal interest. Minimal impact. 2 Minor >$10,000 <$50,000 Limited disruption and some loss of production. Medical treatment required. Lost time injury. Some disruption to normal access or community systems. Minor impact or interest. Questions raised in local forums, local media reports. Claims from business or repairs to other services. Customers inconvenienced. 3 Moderate >$50,000 <$500,000 Significant impact, production reduced or stopped for up to two weeks. Serious injury. Extended medical treatment required. Disruption to public access and other systems. Increased potential for accidents. Community discussion. Broad media cover over a regional basis. Significant claims. Customers forced to other options. Questions regulator. from 4 Major >$500,000 Disruption and damage to system or incident involving other infrastructure. Serious injury or loss of life. Extensive disruption. Incidents/accidents involving the public. Loss of confidence in facility management. Corporate credibility affected. Loss of substantial business opportunity. Rebuke or threat from regulator. 5 Catastrophic Very high. Extensive losses within and beyond the system Extensive disruption and damage with broad impact on other infrastructure. Loss of more than one life and or extensive injuries. Broad impact on community health or the environment. Public furore and investigations. Management changes demanded. Loss of substantial part of business. Loss of licence for a large area or region. 64 Draft Public Amenities Activity Management Plan Doc347241
356 5.5.5 Risk Matrix Risks are aligned to Public Health, Environment, Security of Service, Quality, Asset Protection and Capacity. The following table explains the risk rating matrix used to assess the risks tabulated below for the public amenities assets. Risk is assessed as the product of Consequence and Probability, thus a high likelihood of the event occurring with a major consequence leads to an extreme risk that requires immediate action. Figure 5.13: Risk Rating EVENT CONSEQUENCE Likelihood Rating Negligible Minor Moderate Major Catastrophic 9-10 Almost Certain Moderate High High Extreme Extreme 7-8 Likely Moderate Moderate High Extreme Extreme 5-6 Moderate Low Moderate Moderate High Extreme 3-4 Unlikely Low Low Moderate High Extreme 0-2 Rare Low Low Moderate High High Public Amenities Identified Risks High risks are shown in this abbreviated summary table. A full assessment is included in the base information for this Activity Plan Figure 5.14: Public Amenities Identified Risks Asset Affected Public Amenities all assets Failure Mode Description Risk Rating Current Mitigation Accidental harm Death High Check for safety issues on a programmed basis Managed Risk Rating Low Public Amenities assets toilets and structures Decline in amenity value - deterioration of asset - building, chattels, fixtures and fittings Building décor and assets provided are outdated and /or insufficient for customer needs High Condition Assessments Low Public Amenities assets toilets and structures Arson Fire High Alarm/ Town Camera monitoring and security measures in place will protect some commercial buildings but not other building assets Installation of smoke alarms Moderate District wide assets Destruction of assets - public and private Rural Fire High Agreements in place with other providers Participation in Rural Fire Group Low - Moderate Trained Principal Rural Fire Officer District wide assets Destruction of assets - public and private Civil Defence Emergency High Member Waikato Valley Emergency Management Group Low - moderate Trained Staff 65 Draft Public Amenities Activity Management Plan Doc347241
357 5.5.7 Mitigation Measures Mitigation measures typically include design and engineering measures to strengthen the ability of the asset to withstand the hazard event. When an asset has failed or is expected to fail in the future; strategies can then be developed to avoid or react to the failure. If the failure mode of an asset is critical to the organisation, failure avoidance is likely to be more effective than reactive activities. Depending on the failure mode, the strategies may include: changed maintenance activities, rehabilitation works, replacement works, or abandonment of the asset. These Strategies can provide a list of works, which may be further broken down into: Should Do Complete within 5 years; Could Do Works which may possibly be deferred for 5 years; Defer Works which can be deferred for 5 years. Based on the risk rating matrix above, the table below gives guidance on mitigation measures. Figure 5.15: Mitigation Measures Options Extreme High Risk Moderate Risk Low Risk Immediate action required to reduce risk Treatment options must be reviewed and action taken to manage risk Treatment options reviewed and action taken dependant on treatment cost Managed by routine procedures 5.6 Critical Asset Identification A critical asset is one that if it fails to provide the required service it will result in a significant impact on the community. (Significant impact can be viewed as loss of a major amenity, disruption to many businesses or people, harm to Council's image, inability for Council to function). Identification of critical assets involves assessing the asset against a series of criteria and allocating a grade. The process involves: Listing the main asset group Assessing and scoring the impact of an event using 0-3 grade Summing the scores Assets deemed to have a total of 10 or more, then the asset is a critical asset Public amenities assets are assessed below. 66 Draft Public Amenities Activity Management Plan Doc347241
358 Figure 4.11: Critical Asset Assessment and Identification Asset matrix 0= No impact 1= Low impact 2= Moderate impact 3= Severe impact Civil Defence Service Delivery Direct Costs (Repair, lost revenue,3rd damaged, legal costs Effect on Community (loss of supply) Effect on public safety Environmental damage (1) 14 Image/Public support Other Total (sum) Cemeteries (1) 12 Rural Fire Service Delivery (1) 11 Public Toilets CCTV Camera System Public Car Parks Street Furniture/Amenity (1) Unable to undertake legal obligations By this method it can be seen that Council s cemetery assets within the Public Amenities Activity area scores above the required 10 points to be classified as critical assets. The two key areas being Council s legal obligations regarding cemetery provision and the ability to respond to a pandemic crisis the effect this would have on our community. To counterbalance this: Council s cemeteries are located in several locations throughout the district and the likelihood that all cemeteries were critical at the same time is extremely low. Council s Service delivery functions associated with Rural Fire and Civil Defence also score above the required 10 points to be classified as critical service delivery functions. Council has trained staff to perform these functions and also is a member of the Waikato Valley Civil Defence operating area and the Waikato Region emergency Management Group. 67 Draft Public Amenities Activity Management Plan Doc347241
359 What It Costs and How We Will Pay For It (Financial Summary) 6.1 Summary of Financial Policies The focus of this AMP is to provide agreed LoS at the optimum or lowest lifecycle cost to the community. The acquisition of funds required to achieve this focus are noted below. General rates, UAGCs and user charges fund the net costs of this function. Capital development is funded by loans and depreciation in accordance with Council funding policy. The interest for these loans is then allocated as a cost to the rates funded activities. 6.2 Capital Works Framework Project Identification and Prioritisation The identification of capital works is guided by the Public Amenities Activity strategic goal which is to ensure that Council s Public Amenities are available and maintained to an acceptable standard for the residents within and visitors to the District. Projects are primarily identified from: Changes to LoS, i.e. demand for higher LoS. Community groups/organisations. Analysing statistical data relating to mortality rates. Public complaints. Sanitary assessments A system for prioritising projects within the Community Service area needs to be developed using a point scoring system. Large projects such as Te Kuiti streetscape will primarily be driven by such organisations as Te Kuiti Development Inc. 6.3 Development and Financial Contributions The overall premise on which contributions are based is that development should pay the cost for providing services and facilities required to accommodate growth and effects. Waitomo District has a declining population but growth can present itself in many forms e.g. growth in an ageing population resulting in more leisure time. Section 102 of the Local Government Act 2002 (LGA 2002) requires Council to have a policy on development contributions or financial contributions. A financial contributions policy prepared under the Resource Management Act 1991 forms part of Council s operative District Plan. It provides for the protection of the natural and physical environment, retention and possible enhancement of public access to the sea and along the margins of the District s significant lakes, rivers and streams in the form of access strips and esplanade reserves, and the equitable sharing of the costs of the provision and maintenance of infrastructure for development. Financial contributions are effects based. Full details of Council s Financial Contributions Policy can be found in Part 3, Section 25, of Council s Operative District Plan. Council has currently not implemented its above mentioned Financial Contributions Policy, but needs to investigate this option as a way of funding enhancements to the Community Services Assets. Contributions will provide the appropriate balance of funding between the community, WDC and those undertaking the development. There are risks associated with contributions as a funding source and mainly these risks relate to formulating projections and other trend information on which the calculations are based. Council intends to review its development contributions policy during the term of its Long Term Plan. 68 Draft Public Amenities Activity Management Plan Doc347241
360 6.4 Financial Forecasts The following Figure 6.1 summarises the financial forecast for Public Amenities assets from 2015/2025 For the purposes of this initial Activity Management Plan, expenditure/revenue is identified as: a. Operations/Management /Maintenance (planned and unplanned) including depreciation b. Revenue c. Renewals d. Development e. Source of funding to be supplied by treasury The management costs include administrative rates, AM planning, data collection etc. The current 2015/2016 budget is also included to allow comparison with the existing budget. 69 Draft Public Amenities Activity Management Plan Doc347241
361 Figure 6.1: Financial Forecast To be finalised 70 Draft Public Amenities Activity Management Plan Doc347241
362 Figure 6.2: Summary of Public Amenities - 10-Year Expenditure Forecast To be finalised 71 Draft Public Amenities Activity Management Plan Doc347241
363 Figure 6.3: Public Toilets - 10-Year Expenditure Forecast To be finalised 72 Draft Public Amenities Activity Management Plan Doc347241
364 Figure 6.4: Cemeteries - 10-Year Expenditure Forecast To be finalised 73 Draft Public Amenities Activity Management Plan Doc347241
365 Figure 6.5: Street Furniture and Amenities - 10-Year Expenditure Forecast To be finalised 74 Draft Public Amenities Activity Management Plan Doc347241
366 Figure 6.6: Public Car Parks - 10-Year Expenditure Forecast To be finalised 75 Draft Public Amenities Activity Management Plan Doc347241
367 Figure 6.7: Emergency Management - 10-Year Expenditure Forecast To be finalised 76 Draft Public Amenities Activity Management Plan Doc347241
368 Figure 6.8: Rural Fire- 10-Year Expenditure Forecast To be finalised 77 Draft Public Amenities Activity Management Plan Doc347241
369 6.5 Confidence Levels and Key Assumptions The confidence in the asset data used as a basis for the financial forecasts has been assessed using the following grading system shown in figure 6.2, from the NZWWA NZ Guidelines for Infrastructure Asset Grading Standards, final draft, August Figure 6.2: Confidence Grading Scale Confidence Grade A B C D General Meaning Highly Reliable Data based on sound records, procedures, investigations and analysis which is properly documented and recognised as the best method of assessment. Reliable Data based on sound records, procedures, investigations, and analysis which is properly documented but has minor shortcomings, e.g. the data is old, some documentation is missing and reliance is placed on unconfirmed reports or some extrapolation. Uncertain Data based on sound records, procedures, investigations or analysis which is incomplete or unsupported, or extrapolation from a limited sample for which grade A or B data is available Very uncertain Data is based on unconfirmed verbal reports and/or cursory inspection and analysis. The confidence level is C overall. The asset data has a current confidence level of D. Key Assumptions It is assumed that the population data from the current census is correct. It is assumed that given the expected mortality rates that sufficient land is available for future cemetery expansion with the exception being Te Kuiti. The Activity Management Plans for Council s Public Amenity Assets, which form part of this AMP, will be progressively updated as more complete information becomes available over time. Best practice and current knowledge has been used in formulating information regarding the assets in this AMP. This information is not well supported by solid historical data. It is assumed that this information is correct. Council will continue to be involved in the provision of cemetery services within the District and the Levels of Service will not change. The annual cost of the contract maintenance of the network will not increase above CPI when it is re-tendered. That valuation using rating values is an accurate assessment of the true valuation of the Public Amenities Assets. 78 Draft Public Amenities Activity Management Plan Doc347241
370 Our Commitment to Excellence (Management Practice and Improvement Programme) This section of the AMP firstly describes the current asset management practices under the headings of processes, systems and data. The gap between current and desired asset management practices in particular is described. The improvements required to close this gap are set out in the improvement programme. The programme also identifies priorities, timetables, resources and estimated costs for achieving the desired management practices. Finally the methodology for the monitoring and review of asset management activities is described. 7.1 Assessment of Current Practice This section outlines the decision-making practices that Council currently use to determine long-term maintenance, Levels of Service, and renewal and capital expenditure requirements for public amenities. Current practice is summarised in three broad areas of activity: 1. Processes: The processes, analysis and evaluation techniques needed for life cycle asset management. 2. Information Systems: The information support systems used to store and manipulate the data. 3. Data: Information available for manipulation by the systems to produce the required outputs. The following sections detail current management practices and describe the desired management practices Council intends to develop over time Asset Processes Figure 7.1: Asset Management Processes Current and desired practice Current Management Practices Desired Management Practices Operations Some Operational processes documented in service contracts where required. Some Ongoing monitoring of contractors performance by contract supervisor (5-10% of work is randomly audited per month). Operational activities identified and documented in 'controlled' manuals. Operational activities contestably priced where appropriate. Operational activities optimised to minimise lifecycle costs. Contractor performance monitored using specific key performance indicators. Performance Monitoring Performance measures and Levels of Service linked. Monthly surveys of some contractors work performance. Performance standards documented in some contracts. Performance reported to customers through Key Performance Indicators. Performance reported to customers and contractors regularly. Continuous monitoring and reporting of performance against measures. Optimised Lifecycle Strategy Developing a 10 year forward works programme. Risk assessments undertaken. Failure works predicted. Risk assessments undertaken and treatment options identified. Lifecycle costs determined and optimised using NPV analysis. 10 year plus forward works programme available. 79 Draft Public Amenities Activity Management Plan Doc347241
371 Current Management Practices Desired Management Practices Knowledge of Assets Plans and records are incomplete especially underground services and hard surfaces. Updating process being developed. One-off attribute information relating to assets undertaken and reviewed. Asset information relating to buildings available Sanitary assessments completed. Full 'as built' recording process in place to continually update data. Process documented for updating of asset information. Process documented for collecting attribute information via maintenance activities. Ability to access asset registers for all relevant staff. Condition Assessments Condition assessment of street furniture and park furniture by Council staff and consultants. No contract reporting on condition of assets. Condition assessment of critical assets carried out on an agreed frequency. Maintenance feedback processes established and documented. Assessment interval optimised. Project Management Contract management reporting processes. Designs undertaken to best practice. Overseer appointed to ensure project is carried out to specifications. Designers required considering lifecycle costs. Asset Utilisation Incomplete knowledge of asset utilisation. Some minor information available from annual Versus surveys. Preliminary toilet count information available. All asset utilisation identified (via enhanced customer surveys Versus and Park Check ). Non-performing assets investigated and correction options assessed. Disposal/rationalisation policy clearly identified. Quality Assurance Deloittes annually audits performance measures reported in Annual Plan. Continuous improvement evident in all AM processes. Quality assurance inspections for maintenance contracts. Continuous QA of maintenance contracts. Accounting and Economics NCS financial system for cost records. In house spread sheets to monitor overall department expenditure. Asset values based on rating values. Process in place for recording costs against assets where appropriate. FRS-3 valuation complete for public amenity assets. Levels of Service Levels of Service are noted in the contract documents. Annual Versus survey results. LOS based on customer research and reviewed regularly. 80 Draft Public Amenities Activity Management Plan Doc347241
372 7.1.2 Information Systems Figure 7.2: Asset Management Information Systems Current and Desired Practice Current Management Practices Desired Management Practices Asset Register Basic asset register of public amenities kept in hard copy form and Excel spreadsheet Database for all Public Amenities Assets excluding buildings Integration of Database to Financial system. Integration of Database and GIS Databases Financial System Flexible job costing system (NCS). Financial system is not currently linked to any proprietary AMIS. Spreadsheets used to hold valuation information. Database used to record maintenance costs against individual assets. Asset valuation generated from Database. Maintenance Management Maintenance work on assets is unrecorded and not linked to the asset. System links maintenance details to significant assets and asset groups to enables tracking of work history. Critical and non-critical assets flagged in database. Condition/Performance Monitoring Hard copy records available and digital spreadsheet. Information also recorded in spreadsheets. Condition, performance and utilisation data stored in System. Customer Enquiries Request for Service customer service complaint and enquiry register and response tracking software that features: complaint location, type and frequency response time to query resolution times faults Customer enquiry records recorded against individual assets. Customer enquiry tracking system in place. Risk Management Risk Assessment undertaken. Risk register developed to record identified high risk assets. Optimised Renewal Strategy Non existent. No change. Systems Integration Non existent. The benefits and costs of an Asset Management system integration with GIS and Financial system analysed and integrated if appropriate. Plans and Records As-built plans; maintenance contract files; general files; CAPEX contract files; inspection reports and property register available in some cases. Electronic plans and records linked to GIS database. 81 Draft Public Amenities Activity Management Plan Doc347241
373 7.1.3 Asset Management Data Figure 7.3: Asset Management Data Current and Desired Practice Current Management Practices Desired Management Practices Asset Classification Asset classification system in place for assets stored in spreadsheet form. Formalised asset classification system for all assets and documented. Asset Identification Unique asset identification system in place for assets stored in spreadsheet along with photos. No change. Asset Attributes Inventories established for services and structures, horticultural amenities, and furniture and fittings approximately 90% complete. Condition ratings for furniture and fittings approximately 90% complete. High level Information for buildings available at this time. Relevant and up to date attributes recorded for all assets. Location of land assets identified on GIS. Maintenance Data Regular maintenance activity and costs available from contracts. Unscheduled maintenance works records available in hard copy form. Maintenance data collected against significant assets or groups of assets. Lifecycle Costs Renewal and capital costs for common items are available from recent works. Good database of complete lifecycle costs, which can be used for decision making. Future Prediction Data Limited current future prediction data available. Census results used to predict future demand. Actual versus predicted growth monitored. Levels of Service LOS recorded in AMP. Regularly monitor and recorded current Levels of Service against performance measures. Asset Management Plans First Draft AMP completed 2008/2009. Second Draft completed 2011/2012. Up to date AMPs available for all asset groups and used as basis for forward planning Activity Management Plan The 2014 version of this AMP has been prepared in-house. This plan at the time was considered to meet the requirements of a basic asset management plan and further detail has been added since that time. 7.2 Planned Improvements The development of this draft AMP is based on current LOS, asset information and the knowledge of Council staff. The AMP will be continually reviewed, regularly monitored and updated to improve the quality of AM planning and accuracy of financial projections. This process is dependent upon improved knowledge of customer expectations, further developed AM practices, data to optimise decision making, review of outputs, development of strategies and further planning. Minor progress has been made on improvements identified for the period in the improvement plan due to other priorities relating to staff time during that period. The improvement programme therefore repeats those items previously identified. 82 Draft Public Amenities Activity Management Plan Doc347241
374 7.2.1 Improvement Programme The purpose of an AM improvement programme is to improve the current management practices for AM processes, information systems and data, by implementing an improvement programme that brings current management practices in to line with desired management practices. The improvement plan will provide for the staged improvement of AM practices to an appropriate level for AM plan preparation, process improvements, information system development, and data collection and recording. The improvement programme tasks to be completed to bring this activity plan to the advanced developed AMP and are to be used as the basis for future funding of the improvement programme and are shown in the Figure below: Figure 7.4: Improvement Programme Task AM PLAN PREPARATION IMPROVEMENTS Review AMP every two years. Review LOS through public consultation Confirm corporate AM objectives Conduct external audit of AMP 2015 Identify and include any assets that are not included in this AMP Identify development, renewal, maintenance strategies where required Link financial forecasts to the lifecycle management strategies Include valuation results in a more structured format AM DATA IMPROVEMENTS Asset attributes Continue to collect asset attribute information and refine recording Maintenance tasks/data Collect maintenance data against significant assets or asset groups Lifecycle costs Collect lifecycle costs for significant assets or asset groups and recorded in Confirm Future prediction data Monitor actual versus predicted growth Levels of Service Measure performance in LOS against targets 83 Draft Public Amenities Activity Management Plan Doc347241
375 Task AM PROCESSES IMPROVEMENTS Operations Ensure operations and maintenance are competitively tendered where possible Optimise operations to minimise lifecycle costs and documentation of operations and maintenance activities Performance monitoring Process in place for monitoring, analysing and reporting of performance against Levels of Service and other performance measures. Optimised lifecycle strategy Predict failure works and identify treatment options for risks Determine and optimise lifecycle costs using NPV analysis for major new works. Knowledge of assets Develop process for updating asset data with new assets and data collected via the maintenance contract. Asset register available to all relevant staff Compile up to date information on leased reserves and Complete reserves management plans Condition assessments Process in place for the condition assessment of assets including assets to be assessed, frequency and ranking procedures. Project management Designers to consider lifecycle costs and risk. Audit CAPEX development plans Asset utilisation Processes in place to ensure identify current asset utilisation of significant assets Develop and assess options for non performing assets Develop disposal/rationalisation policy Accounting and economics Process in place for collecting costs against assets where appropriate FRS-3 compliant valuation complete for public amenities assets Levels of Service Process developed for the review of Levels of Service (including customer consultation procedures) AM SYSTEMS IMPROVEMENTS Asset register Develop database for all community services Financial system System available to allocate maintenance costs against individual assets Use System to generate valuation Maintenance management Link maintenance history to significant assets or asset groups Criticality of assets identified in System Condition/performance monitoring Use System to store asset condition, performance and utilisation data where appropriate Customer enquiries Record all customer enquiries against individual assets Systems integration Investigate the integration of system with GIS and the financial system, integrate if appropriate. Plans and records Link electronic plans and records to GIS database 84 Draft Public Amenities Activity Management Plan Doc347241
376 7.2.2 Monitoring and Review To ensure the effective development and implementation of this activity plan the following tasks will be or have been carried out: a. Council Adoption of AMP b. Review/Adopt Levels of Service Council will review service levels, via public consultation, to ascertain an accurate understanding of current and future needs and expectations of customers. The resulting redefined Levels of Service and performance measures will be adopted by Council. c. AMP Revision The AMP will be revised and updated on a three-yearly basis to incorporate the outcome of Levels of Service review and any new knowledge resulting from the AM improvement programme. d. Quality Assurance Audit Audits will be undertaken to ensure that the integrity and cost effectiveness of data collected for use in the AP is maintained. e. Peer Review Annual internal audits will be undertaken to assess the effectiveness of AM processes, information systems and data, whereas, external audits will be undertaken to measure AM performance against best practice Review of AMP against the OAG Requirements This review of the Public Amenities AMP was undertaken by Hollier Consultants on the instruction of Council s Group Manager - Community Services in As a result of this review minor changes were made to the AMP including more asset information and the addition of financials that Council believes makes this AMP comply with the core requirements of the OAG. Council has budgeted in the 2015 improvement year to undertake a further review of this document for compliance. Detailed financial information for the plan is supplied by Treasury Specific Improvement Projects Specific priority improvement projects are recorded below for the periods that relate to the Public Amenities AMP and based on $5,000 being made available each year to fund these improvements. This money is included in the Toilet direct expenditure Timeframes, resource requirements and estimated costs are recorded. The confidence level of the estimated resources and costs is graded as C-D. Figure 7.5: Specific Improvement Projects (year ending) SPECIFIC IMPROVEMENT PROJECTS PROJECT Underground Services and Car Parking Asset Investigations YEAR WDC STAFF RESOURCE EXTERNAL Yes Yes $5,000 ESTIMATED COST Purchase of Notebook and development of inspections programme for toilet inspects and other functions within the Community Services area Review AMP Include Building data in a designed Asset Management Programme such as SPM or spreadsheets attached to GIS Asset Management Planning miscellaneous Yes Yes $5, Yes Yes In-house 2015/16 Yes No In-house Yes Unknown $5, Draft Public Amenities Activity Management Plan Doc347241
377 Housing and Other Property Activity Management Plan
378 Prepared by: John De Luca Group Manager - Community Services Waitomo District Council Peer Review by: Richard Hollier Consultancy 2008 Date of Review: September 2008 Adopted by Waitomo District Council: 24 March 2009 Review by Waitomo District Council: February 2012 Review Adopted by Council: 29 June 2012 Review by Waitomo District Council: November 2014
379
380
381 TABLE OF CONTENTS EXECUTIVE SUMMARY: HOUSING AND OTHER PROPERTY...1 Purpose...1 Rationale for Service Delivery...1 Link to Community Outcomes...1 Strategic Goals...2 Effects of the Service...2 Levels of Service...3 Future Demand...6 Housing and Other Property Identified Risks...7 Existing Situation Described...8 Maintenance and Operations...8 Renewals...9 Financial Summary Specific Improvement Projects Key Assumptions INTRODUCTION Waitomo District Council s Commitment to its Community Why WDC Provides the Service The Role of WDC in the Provision of Housing and Other Property Activity The Role of Other Parties Significant Effects of the Service About this AMP LEVELS OF SERVICE - WHAT OUR CUSTOMERS WANT AND HOW WELL WE ARE DOING TO ACHIEVE IT How Our Services Contribute To Community Outcomes Strategic (Goals) Legislative Framework Our Customers Other Stakeholders Service Delivery Options Considered Levels of Service Key Performance Indicators Trends Impacting on Level of Service (Possible Future Changes/Service Level Review) Key Programmes to Achieve Levels of Service GROWTH PLANNING FOR THE FUTURE AND DEMAND FOR THE SERVICE Population Growth and Structure Demand Projections Ability of the Activity to Respond Demand Management Key Programmes to Meet Growth and Demand Key Projects to Meet Growth and Demand Confidence Levels and Assumptions Risk Management THE ASSETS WE USE Description of Asset Base How Assets Work Asset Condition/Remaining Life What the Assets Are Worth Confidence in Our Data HOW WE MANAGE THE SERVICE (LIFECYCLE MANAGEMENT) Operations and Maintenance Renewal Description of Renewal Programmes Disposal and Rationalisation and Creation Assessments Undertaken (Cemeteries/Public Toilets) Managing Risk Risk Approach Risk Management Process... 67
382 5.6.3 Measures of Likelihood of Risks Measures of Consequence Risk Matrix Housing and Other Property Identified Risks Mitigation Measures Critical Asset Identification FINANCIAL SUMMARY WHAT IT COSTS AND HOW WE WILL PAY FOR IT Summary of Financial Policies Capital Works Framework Development and Financial Contributions Financial Forecasts Confidence Levels and Key Assumptions OUR COMMITMENT TO EXCELLENCE (MANAGEMENT PRACTICE AND IMPROVEMENT PROGRAMME) Assessment of Current Practice Planned Improvements... 84
383 Executive Summary: Housing and Other Property This Activity Management Plan (AMP) for Housing and Other Property has been prepared by Waitomo District Council with outside assistance. Initial asset data capture has been undertaken during 2008 and 2011 and the analysis and updating of this information is an ongoing task. This AMP will provide the basis for the Housing and Other Property activity in WDC s Long Term Plan (LTP) following review and adoption of this AMP by Council in early Purpose Waitomo District Council (WDC) provides a number of Housing and Other Properties assets that are grouped according to their primary purpose. The different groups of Housing and Other Property are: Housing that provides housing in the form of elderly persons housing units (EPH), potential staff housing and a pool of miscellaneous housing rental units primarily for strategic investment purposes. Corporate Property that provides WDC office accommodation, library building. Community Halls to provide areas for community focus within the rural District. WDC Depots to enable WDC and its operators to function within the District. Te Kuiti Railway Hub to provide a focus to the central area of Te Kuiti and allow WDC to bring its services to the community General Property that includes miscellaneous land holdings for either investment or landbanking for the provision of land across all WDC s activity areas as well as WDC s two historic buildings and campgrounds. Rationale for Service Delivery The Community Service Group, through its Housing and Other Property Activity, is involved in considerable property and land holdings to provide resources, places for community activities, affordable housing, preservation of history / culture and a place from which WDC can support its functions. Link to Community Outcomes WDC considers in its Long Term Plan that the Community Service Group contributes, through its Housing and Other Property Activity, to the following outcomes: PRIMARY CONTRIBUTION Prosperous District CO6. A place that attracts more people who want to live, work and play, and raise a family CO7. A place where wealth and employment are created through local businesses and tourism opportunities and facilities are developed, facilitated and encouraged SECONDARY CONTRIBUTION Vibrant Communities CO2 A place where all age groups have the opportunity to enjoy social, cultural and sporting activities within our District CO5 A place where we preserve the natural environment for future generations, ensuring that natural resources are used in a sustainable manner. Effective Leadership CO8 A place where the development of partnerships for the delivery of programmes and services is encouraged and pursued. 1 Draft Housing and Other Property Activity Management Plan Doc
384 Strategic Goals The strategic goals for Housing and Other Property are: Strategic Goal 1: To ensure that an adequate Housing and Other Property portfolio is provided and maintained for the well-being of the user and community groups. Strategic Goal 2: To provide community-agreed LOS in the most cost effective way through the creation, operation, maintenance, renewal and disposal of assets to provide for existing and future users. The Housing and Other Property AMP has been developed to: a) Ensure that an adequate Housing and Other Property portfolio is provided and maintained for the well-being of the user groups; b) Provide and develop land/buildings located within other activity areas in a manner that meets an appropriate level of social needs; c) Act as WDC s agent for the purchase and supply of land across all WDC s activities; d) Ensure that the long-term operation and maintenance of the Housing and Other Property asset portfolio is sustainable; e) Demonstrate responsible management in the operation, maintenance, renewal and disposal of WDC owned Housing and Other Property asset portfolio. WDC s principal objectives of the Housing and Other Property AMP are to: a) Programme works for the development of land and buildings in accordance with adopted AMPs; b) Operate WDC owned halls to a standard acceptable to users by providing appropriate management structures; c) Show how assets will be managed in order to achieve Levels of Service and need demand for services; d) Continue the disposal of land identified as surplus to WDC requirements and provide land for WDC s other activities; e) Identify life-cycle (long-term) costs for an agreed LOS; f) Ensure the maintenance of the public infrastructural assets in perpetuity, so that there is no decrease in value, and to forecast the estimated future cost of so doing; g) Put in place a sound management regime for all matters relating to Housing and Other Property activities; and h) Ensure WDC s assets are legally protected by the provision of easements and other legal instruments. Effects of the Service The Housing and Other Property Activity has a number of effects on the local community. 2 Draft Housing and Other Property Activity Management Plan Doc
385 Figure S.1: Significant Effects of the Service SOCIAL POSITIVE EFFECTS NEGATIVE EFFECTS Affordable accommodation for the elderly WDC houses potentially available to entice employees and potential employees into the District Our customers will be highly satisfied with the quality of the services we provide and our stakeholders will recognise us as providing good quality affordable housing Focus on the elderly whilst others with needs such as people with disabilities may be in greater need Legislative constraints through the Residential Tenancies Act 2010 can limit WDC s ability to move quickly to maximise market opportunities Poor quality of housing stock CULTURAL POSITIVE EFFECTS NEGATIVE EFFECTS Provides amenities for cultural use, e.g. halls None identified Provide building facility to house Public Library Limited library capacity in building provided Provide facility for TK Community House ECONOMIC POSITIVE EFFECTS NEGATIVE EFFECTS WDC involvement in the property market can stimulate development and growth WDC houses could be an incentive and an effective staff retention tool Lack of adequate funding mechanisms to maintain asset base, e.g. halls Legislative constraints through the Public Works Act (1981) and Reserves Act (1977), can limit WDC s ability to move quickly to maximise market opportunities during land dealings Rural communities ability to provide resources to administer halls ENVIRONMENTAL POSITIVE EFFECTS NEGATIVE EFFECTS Protecting natural areas and resources Levels of Service Levels of Service (LoS) are developed from WDC s understanding of customer needs as established through regular interaction with users and WDC s resident satisfaction survey. These surveys do not cover all areas of Housing and Other Property. The Housing and Other Property Activity has set LoS with the aim to provide and maintain the buildings and services within the activity and throughout the District in a manner appropriate to the respective social, sporting or cultural needs and use. There is also a LoS to internal customers, i.e. other WDC Departments, where the Housing and Other Property Activity provides the land requirements in a timely manner for these other activities. Some LoS, mainly those dealing with health and safety considerations, are driven by legislative requirements while others are based on the community s expectation of the services provided or WDC s corporate goals. 3 Draft Housing and Other Property Activity Management Plan Doc
386 As yet, WDC has not carried out any formal consultation with customers on LoS options. Until tested it is assumed that the current service levels in the maintenance contracts is what is expected by the community. Predominately LoS centre on the housing portfolio, rural halls and provision of internal property. Within both areas these building conditions are less than adequate and the emphasis is on improving this area and the corresponding satisfaction of these facilities WDC monitors achievement in key service criteria, through the analysis of data produced by different inspections, surveys and audits as they relate to specific activities. The key LOS indicators directly relate to meeting the target LoS. 4 Draft Housing and Other Property Activity Management Plan Doc
387 Figure S.2: Key Levels of Service for Housing and Other Property Key Service Criteria Link to Community Outcomes LOS Statement Type of Measure Measure Performance Measurement and Targets (existing) Performance Measurement procedure Satisfaction Prosperous District Vibrant Communities Provision and maintenance of Elderly Persons Housing that meets the needs of the tenants Management Tool Percentage of tenants satisfied with the provision and maintenance of Elderly Persons Housing > 60% > 65%* > 65% >65% Elderly Persons Housing Customer Satisfaction Survey of tenants Health and Safety Cost Prosperous District Prosperous District Vibrant Communities Users of WDC owned buildings are safe WDC s Housing and Other Property Activity delivered within budget Management Tool Management Tool Number of accidents recorded in building/property accident register Variance of actual expenditure against yearly budget Variance + or 5% Nil Nil Nil Nil Analysis of building /property accident register (to be established) Variance + or 5% Variance + or 5% Variance + or 5% Analysis of budgets 5 Draft Housing and Other Property Activity Management Plan Doc
388 Figure S.3: Key Programmes to Maintain and Achieve Levels of Service Trend Project Key Service Criteria Forecasted Total Cost Confidence Level in Projections Estimated Timeline for Project Completion Economic Energy efficiency Plan for WDC s buildings Satisfaction In-house In-house Ongoing Social Investigations and facilitation of EPH complex for Te Kuiti (refer item below) Satisfaction Currently funded as an exception projection item 2015 EAP Social Facilitation of EPH development** Satisfaction $45,000 Refer investments D AMP refer above Economic Provision of WDC Office Generator Meet $50,000 D Legislative requirements Economic Category 3 WDC Office Building Meet $15,000 D Assessment Legislative requirements Economic Disposal costs associated with the relocation of TK Community House Trust Satisfaction $10,000 D Key Strategies Impacting on Future Levels of Service Other investigatory/strategy type programmes have been identified that, while not impacting on levels of service initially, the outcomes may. These are listed below. Figure S.4: Other Key Programmes That May Affect Levels of Service Trend Project Key Service Criteria Economic Review of Leases and Licences Responsiveness Quality Forecasted Total Cost $5,500 annually onwards Confidence Level in Projections Estimated Timeline for Project Completion D Ongoing in operational budget Future Demand The key issues impacting on demand forecasts for Housing and Other Property are: a) An aging population b) The need to develop assets relevant to community needs c) User pays as a means of funding and addressing equity issues d) An increase in public awareness and expectations of higher standards e) Records storage 6 Draft Housing and Other Property Activity Management Plan Doc
389 Capital works projects being planned to meet growth in demand include: Figure S.5: Capital Programmes to Meet Growth and Demand Trend Project Key Service Criteria Forecasted Total Cost Confidence Level In Projections Estimated Timeline for Project Completion Economic Fire Proof Records/ Archives Store Legislative $150,000 D Outside planning period of this AMP Economic Expansion to Building Records Store Legislative $20,000 D Figure S.6: Other Miscellaneous Capital Programmes Trend Project Key Service Criteria Forecasted Total Cost Confidence Level In Projections Estimated Timeline for Project Completion Social Redwood Flats conversion of Bed sits Quality Satisfaction Dependent on WDCs facilitation of alternative Elderly Housing D Unknown Influenced by WDC s future vision which will be included in the 2015 LTP development Housing and Other Property Identified Risks High risks are shown in this abbreviated summary table: Figure S.7: Housing & Other Property Identified Risks Asset Affected Failure Mode Description Risk Rating Current Mitigation Buildings for hire Decline in amenity Building décor and High Condition or Community value - assets provided are assessments Purposes deterioration of outdated, and/or asset - building, insufficient for chattels, fixtures customer needs and fittings Building Assets Arson Fire High Alarm monitoring and security measures in place will protect commercial buildings but not other building assets Installation of smoke alarms Property Assets Accidental Harm Death High Regular assessment and maintenance ensures the asset is kept in good condition Managed Risk Rating Low Moderate Low One critical asset has been identified in the Housing and Other Property AMP. This primarily centres around WDC s administration building where non performance of the building would severely impact on WDC s ability to undertake its legislative requirements and provide a Civil Defence headquarters in time of need. 7 Draft Housing and Other Property Activity Management Plan Doc
390 Figure S.8: Critical Asset Assessment and Identification Asset matrix 0= No impact 1= Low impact 2= Moderate impact 3= Severe impact Direct Costs (Repair, LoSt revenue,3 rd damaged, legal costs Effect on Community (LoSs of supply) Effect on public safety Environmental damage Image/Public support Other Total (sum) Corporate Property Existing Situation Described The Housing and Other Property activity covers the following assets: Figure S.9: Summary of Housing and Other Property Asset Group Asset Type Land Only (Sites) Buildings Housing Elderly Persons Housing 1 8 Rentals 7 7 Corporate Property WDC Offices 1 1 WDC Depots 2 5 Dog Pound / Stock Pound 2 1 Information Centres 1 1 WDC Library 1 1 Te Kuiti Railway Hub WDC Service Delivery Space Community Space Commercial space 1 (Leased) 4 General Property Rural Halls Buildings Historic Buildings 0 5 Campgrounds 3 9 Maintenance and Operations No changes in maintenance operations are envisaged with the exception of: Changes to the procurement method of mowing services Asset management funding Independent contractors are responsible for much of the maintenance and renewal of these assets. Maintenance standards, set by WDC, apply to all asset components identified in contract specifications regardless of their location or profile. At this time WDC needs to consider all service delivery options for these operations due to the difficulties experienced in obtaining competitive tenders in small communities. Several specialist maintenance services will always be provided by external providers on a competitive basis. These include security, sanitary provision, air conditioning maintenance etc. In-house operations are undertaken in some areas such as minor building maintenance and gardening maintenance and mowing. 8 Draft Housing and Other Property Activity Management Plan Doc
391 Regular inspections are completed to assess the condition of Housing and Other Property assets, identify future risks and maintenance needs or repair work that is required. The frequency of inspections is based on the potential outcomes of any asset failure for LOS, costs, environmental impacts or corporate image and are reviewed as part of this document. Renewals Inspections and asset gathering/condition grading has identified the following renewals works for inclusion in the AMP: Figure S.10: Renewal Programmes Project Hall Compliance Renewals (fire, building and emergency compliance ) Redwood Flats Building essential renewals Key Service Criteria Quality Satisfaction Safety Legislative Quality, Satisfaction Safety Forecasted Total Cost $15,000 (5 yrs) $3,000 annually $110,000 (10 yrs) $11,000 annually Confidence Level In Projections Estimated Timeline for Project Completion D 5 years, onwards Continue existing funding C Annually from 2015 Continuation of existing funding Building Renewals general fund until cost programme developed Railway Station building refurbishment Committed works Quality Satisfaction Safety Legislative Quality Safety Satisfaction Legislative $150,000 (10 yrs) $15,000 annually0000 $1,678,000 C (QS Estimate) D 10 years from Continuation of existing funding Currently funded in projections Railway Building project 4 Building 3 Community space Quality Safety Satisfaction Legislative $90,000 C (QS Estimate Railway building Plaza Redevelopment Quality Safety Satisfaction $171,000 D Upgrade 28 Taupiri Street (internal renewal for TK Community house Quality Safety Satisfaction Legislative $635,500 Note $301,000 grant from Lotteries to offset this B (QS Estimate) (currently funded) Campground Renewals TK Sports Centre leak Repairs contribution Roof Painting 10 Kea Street, Piopio Kitchen renewal 10 Kea Street, Piopio Safety Satisfaction Quality Safety Satisfaction Quality Satisfaction Quality Satisfaction Quality $4,000 (year 1) $93,600 (split year 2/3) $151,800 (split year 4,5 and 6) Balanced over the associated years Refer to establishment of new campground Te Kuiti $20,000 contribution D D D D (CF Balance) (CF Balance) $10,000 D $22,000 D Draft Housing and Other Property Activity Management Plan Doc
392 Project Floor Coverings 10 Kea Street Piopio Key Service Criteria Satisfaction Quality Forecasted Total Cost Confidence Level In Projections Estimated Timeline for Project Completion $5,500 D Current Asset Management Processes The following is a snapshot of where WDC is at regarding asset management practices and Housing and Other Property: Some operational processes are documented in service contracts which are randomly audited Risk assessments have been undertaken but no forward plan developed Knowledge of assets is improving daily especially around ownership and condition Condition assessments of assets were undertaken in 2008 and selective key assets were revisited in 2011 Limited asset utilisation information Spreadsheets are used to store data with no link between expenditure and asset Request for service utilised for complaints and enquiries Financial Summary The following budgets have been prepared assuming that all investigatory and strategy type works will lead to future development projects which will be depreciated. For this reason, this AMP has included these works in the Capital/Renewals section of the budgets, noting that the funding source needs to be confirmed in the future, i.e. either capital, renewal or operational. For the purpose of WDC s overall financial budgeting, these works have been included as operational expenditure. For some activities this treatment leads to minor variations between budgets contained in the LTP from that shown in the AMP. The following summary (S11) outlines the financial implications the Housing and Other Property AMP has on the overall Community Services Portfolio. For this specific summary for Housing & Other Property Activity Management Plan financials refer to (S12) 10 Draft Housing and Other Property Activity Management Plan Doc
393 Figure S.11: Summary of Financial Forecasts for the Community Services Portfolio Community Services EAP 2014/15 LTP 2016 LTP 2017 LTP 2018 LTP 2019 LTP 2020 LTP 2021 LTP 2022 LTP 2023 LTP 2024 LTP 2025 Operating Income Parks and Reserves Housing and Other Property Recreation and Culture Public Amenities Total Operating Income Operating Expenditure Parks and Reserves Housing and Other Property 1,079 1,212 1,238 1,093 1,112 1,127 1,127 1,148 1,168 1,188 1,204 Recreation and Culture 1,058 1,115 1,125 1,123 1,139 1,135 1,128 1,174 1,215 1,258 1,303 Public Amenities ,018 1,043 1,073 Safety Total Operating Expenditure 3,728 3,964 3,981 3,940 4,053 4,141 4,210 4,359 4,443 4,522 4,649 Net Operating Cost/(Surplus) 2,924 3,480 3,529 3,452 3,550 3,625 3,678 3,810 3,877 3,937 4,043 Capital Expenditure Parks and Reserves Housing and Other Property Recreation and Culture Public Amenities Total Capital Expenditure 1,364 1, Net Expenditure 4,288 4,544 4,500 3,921 3,881 3,885 3,973 4,064 4,147 4,206 4,366 Funded By Internal Loans Reserves General Rates 1,541 1,435 1,455 1,415 1,423 1,459 1,556 1,610 1,697 1,719 1,741 UAGC 1,430 1,659 1,683 1,636 1,649 1,692 1,797 1,861 1,961 1,994 2,029 Target Rate - Marokopa Hall Target Services Rate - Rural Target Services Rate - Urban Total Funding 4,291 4,545 4,499 3,925 3,880 3,883 3,973 4,067 4,143 4,206 4, Draft Housing and Other Property Activity Management Plan Doc
394 Figure S.12: Summary of Financial Forecasts for Housing & Other Property To be Inserted 12 Draft Housing and Other Property Activity Management Plan Doc
395 Specific Improvement Projects The following priority projects for the planning period have been identified: Figure S.12: Specific Improvement Projects SPECIFIC IMPROVEMENT PROJECTS PROJECT YEAR WDC STAFF RESOURCE EXTERNAL ESTIMATED COST Asset gathering investigations Review of AMP 2015 Include Building data in a designed Asset management Programme such as SPM or adapted NCS Yes Specialist $5, Yes Yes $2, Yes No In-house if NCS Input leases and licences into NCS Current Yes No In-house Miscellaneous Asset Management. Works selected from schedule Yes Unknown $8000 Key Assumptions In reviewing this AMP, some key assumptions have been made as detailed below: It is assumed that the population data from the Waikato University Population study is correct. The AMP for WDC s Housing and Other Property assets, which forms part of Community Service Group, will be progressively updated as more complete information becomes available over time. Best practice and current knowledge has been used in formulating information regarding the assets in this AMP. This information is not well supported by solid historical data. It is assumed that this information is correct. The annual cost of the contract maintenance of the network will not increase above CPI when it is re-tendered. The valuations using rating value is an accurate assessment of the true valuation of the Housing and Other Property assets. 13 Draft Housing and Other Property Activity Management Plan Doc
396 Introduction 1.1 Waitomo District Council s Commitment to its Community WDC is committed to ensuring that appropriate Housing and Other Property is provided to support delivery of WDC services supplied within the District. WDC presently maintains 20 elderly pensioner units, 7 residential properties, 1 corporate office, 2 WDC depots, 10 rural halls, 1 Information Centre, 1 dog pound, 2 historic building sites and 3 campground sites and one library building as well as miscellaneous sections. Excluded from this are the utility holdings forming part of the relevant Utility AMPs. 1.2 Why WDC Provides the Service The Community Service Group, through its Housing and Other Property Activity, is involved in considerable property and land holdings to provide resources, places for community activities, affordable housing, preservation of history/culture and a place from which WDC can undertake its functions. WDC provides Housing and Other Property in order to support its services and fulfil social objectives. WDC provides a number of Housing and Other Properties that are grouped according to their primary purpose. The different groups of Housing and Other Property are: Housing that provides housing in the form of elderly persons housing units (EPH), and a pool of miscellaneous housing rental units primarily for strategic investment purposes and at times can be used as staff housing. Corporate property that provides WDC office accommodation. Community halls to provide areas for community focus within the rural District. WDC depots to enable WDC and its operators to function within the District. Railway Complex to assist with providing community space and vibrancy to central Te Kuiti General property that includes miscellaneous land holdings for either investment or landbanking for the provision of land across all WDC s activity areas as well as WDC s two historic buildings and campgrounds. (Note; campgrounds form part of the Recreation and Culture Activity Plan but the costing falls into housing and Other Property Activity Plan as they are 100% leased facilities) Note; property holdings by WDC associated with specific utility services in included in the relevant utility activity plan. 1.3 The Role of WDC in the Provision of Housing and Other Property Activity WDC considers in its Long Term Plan that the Community Service Group contributes, through its Housing and Other Property Activity, to the following community outcomes: PRIMARY CONTRIBUTION CO 6 - Prosperous District A place that attracts more people who want to live, work and play, and raise a family CO 7 - Prosperous District A place where wealth and employment are created through local businesses and tourism opportunities and facilities are developed, facilitated and encouraged Tourist activity and visitors are a major part of the District's front window to the world outside and as such, a key means of attracting people and investment permanently to the area. WDC can promote tourism by being proactive in land purchasing and development to assist with this activity and providing facilities for Visitor Information Centre s. The productive earning capacity of land is the life-blood of the Waitomo economy. Achieving maximum effective economic advantage from the land is the foundation of the District's economy Value-added business development associated with the primary sector offers Waitomo the most likely opportunity to significantly improve the wealth of the District through external earnings and local employment. 14 Draft Housing and Other Property Activity Management Plan Doc
397 Supporting that development will need, and offer, other commercial activity such as service industries (electricians, engineers, suppliers, accommodation, food processors etc), which in turn provide opportunity for other manufacturing or industrial businesses. If people are to live and work in Waitomo they must have choice of housing value, style and location. Such choice must be comparable with other communities in New Zealand. Quantity and quality of accommodation is equally critical to meeting the needs and expectations of visitors and the tourist business. WDC provides Elderly Persons Housing, potential staff housing as well as market rentals. SECONDARY CONTRIBUTION Vibrant Communities C02 - A place where all age groups have the opportunity to enjoy social, cultural and sporting activities within our District. Vibrant Communities CO5 - A place where we preserve the natural environment for future generations, ensuring that natural resources are used in a sustainable manner Effective Leadership CO8 A place where the development of partnerships for the delivery of programmes and services is encouraged and pursued. Waitomo's clean-green (Waitomo Green) natural characteristics are one of the District's greatest recreational assets. They are an integral part of living in Waitomo, a key attraction and a vital component of the way the District is seen, i.e. the external image. WDC protects this image through the preservation of historic buildings, and the provision of rural recreational facilities (Rural Halls) to promote the rural lifestyle. WDC also through the Housing and Other Property Activity provides facilities for the ongoing support and administration of the district that is called Waitomo. 1.4 The Role of Other Parties In addition to WDC s supply of Elderly Persons Housing (EPH), there are other significant operators providing this service throughout the District. These include private operators and investors, church and/or community groups; and government agencies such as other nearby local authorities and the Department of Building and Housing. WDC operates in direct competition to these providers. Similarly, WDC offers a pool of rental housing in direct competition to the rental housing market. If this housing was of suitable quality it could be used to act as an incentive to the attraction of staff to Waitomo District Council. The administration of WDC s District halls (excluding Piopio Hall) is undertaken on a community basis, by locally elected committee representatives. Within WDC s other property portfolios also include various sub-dividable parcels of land should the property market enable a future gain on disposal. 1.5 Significant Effects of the Service Significant effects of the service are shown in the table below: 15 Draft Housing and Other Property Activity Management Plan Doc
398 Figure 1.1: Significant Effects of the Service SOCIAL POSITIVE EFFECTS NEGATIVE EFFECTS Affordable accommodation for the elderly WDC houses potentially available to entice employees and potential employees into the District Our customers will be highly satisfied with the quality of the services we provide and our stakeholders will recognise us as providing good quality affordable housing Focus on the elderly whilst others with needs such as people with disabilities may be in greater need Legislative constraints through the Residential Tenancies Act 2010 can limit WDC s ability to move quickly to maximise market opportunities Poor quality of housing stock CULTURAL POSITIVE EFFECTS NEGATIVE EFFECTS Provides amenities for cultural use, e.g. halls None identified Provide building facility to house Public Library Limited library capacity in building provided Provide facility for TK Community House ECONOMIC POSITIVE EFFECTS NEGATIVE EFFECTS WDC involvement in the property market can stimulate development and growth WDC houses could be an incentive and an effective staff retention tool Lack of adequate funding mechanisms to maintain asset base, e.g. halls Legislative constraints through the Public Works Act (1981) and Reserves Act (1977), can limit WDC s ability to move quickly to maximise market opportunities during land dealings Rural communities ability to provide resources to administer halls ENVIRONMENTAL POSITIVE EFFECTS NEGATIVE EFFECTS Protecting natural areas and resources 1.6 About this AMP Document Structure This document follows the following pattern to assist WDC fulfilling its legislative requirements to prepare Asset Management/Activity Management Plans for each of its Activities. The pattern being: What our customers want and how well we are doing to achieve it The assets we use (LoS Lifecycles) How we manage the service (Lifecycle Management) Planning for the future demand for the service (Growth) What it costs and how we will pay for it (Financial Summary) Our commitment to excellence (Management Practice and Improvement Programme) 16 Draft Housing and Other Property Activity Management Plan Doc
399 1.6.2 Links to Other Plans Activity Plans are a key component of WDC s planning process that link to the following documents: Long Term Plan (LTP): Defines the strategic direction for the next 10 years. AMPs are prepared to supplement the information in the LTP and confirm the WDC s role in achieving Community Outcomes. Annual Plan: The works identified in the AMP should become the basis on which future Annual Plans are prepared. Contracts: The LoS, strategies and information requirements contained in AMPs are translated into contract specifications and reporting requirements. Bylaws, Standards and Policies: These tools for asset creation and subsequent management are needed to support AMP tactics. Figure 1.2: Link to other Plans Legislation Local Government Act 2010 Resource Management Act 1991 Building Act 2004 Reserves Act 1977 MSC Act 1992 Other Acts Government Initiatives Statutory Plans District Plan Reserve Management Plans Services Assessments Water Services Assessments Sanitary Services Assessments Long Term Plan Strategy Documents Hall Strategy Quarry Strategy EPH Review Surplus Property Procedures Campground Review \ Policy Statements Funding Financial contributions Significance Activity Management Plans Bylaws Annual Plan Annual Report Operations / Maint Plans and Contracts 17 Draft Housing and Other Property Activity Management Plan Doc
400 Levels of Service - What Our Customers Want and How Well We Are Doing To Achieve It 2.1 How Our Services Contribute To Community Outcomes The Housing and Other Property Activity contributes to the community by: Figure 2.1: Relevant Community Outcomes for Housing and Other Property Primary Outcome Activity Contributes to: CO6 Prosperous District A place that attracts more people who want to live, work and play, and raise a family How the Housing and Other Property Activity Contributes By actively committing to the preservation of Historic Buildings in our community. By increasing provision of affordable housing to meet the needs of the elderly and disadvantaged in the District. By providing buildings, structures and property to allow for efficient provision of services for WDC s customers. By developing services that respond to changing customer needs. By providing property to house key WDC services such as Information Centres. By providing land for productive farming where possible, e.g. disposal of or lease of unformed roads and landbanked land. By providing adequate land for all WDC activities. Outcome Effect Indicator WDC will provide good quality affordable accommodation for the elderly acknowledging the Community s expectation that WDC has a responsibility to assist and respect that the elderly: Are custodians of our heritage contributing to and preserving traditional knowledge. Are acknowledged as a living cultural asset reflecting the cultural and social identity of our community. WDC is committed to providing good quality affordable accommodation for the elderly. People will have good access to services and facilities to provide the services. WDC is committed to maintaining its relationship with hall committees. Tourism numbers will increase and new developments created in the District. Maximisation of WDC s commercial return from it property dealings and leasing operations. Primary Outcome Activity Contributes to: How the Housing and Other Property Activity Contributes Outcome Effect Indicator CO 7 Prosperous District A place where wealth and employment are created through local businesses and tourism opportunities and facilities are developed, facilitated and encouraged By actively committing to the preservation of Historic Buildings in our community. By decreasing WDC s carbon footprint through forestry development on unused land. WDC will actively value and promote the preservation of Historic Buildings. Maximisation of WDC s commercial return from it property dealings and leasing operations. 18 Draft Housing and Other Property Activity Management Plan Doc
401 By providing buildings, structures and property to foster commercial development within the community. Secondary Outcome Activity Contributes to: How the Housing and Other Property Activity Contributes Outcome Effect Indicator CO2 - Vibrant Communities A place where all age groups have the opportunity to enjoy social, cultural and sporting activities within our District. By actively committing to the preservation of Historic Buildings in our community. By actively committing to the provision of rural halls in our community. By providing the infrastructure to enable WDC to perform its obligations under the Local Government Act By contributing to the health and overall welfare of elderly by providing quality affordable housing. WDC will actively value and promote the preservation of Historic Buildings. Maximisation of WDC s commercial return from it property dealings and leasing operations. WDC will provide good quality affordable accommodation for the elderly acknowledging the Community s expectation that WDC has a responsibility to assist and respect that the elderly: Secondary Outcome Activity Contributes to: How the Housing and Other Property Activity Contributes Outcome Effect Indicator CO5 - Vibrant Communities A place where we preserve the natural environment for future generations, ensuring that natural resources are used in a sustainable manner By actively committing to the preservation of Historic Buildings in our community. By contributing to the health and overall welfare of elderly by providing quality affordable housing. By ensuring the WDC s property needs based on community requirements are met through the provision of adequate land WDC will actively value and promote the preservation of Historic Buildings. WDC will provide good quality affordable accommodation for the elderly acknowledging the Community s expectation that WDC has a responsibility to assist and respect that the elderly: Adequate land, when identified is purchased and or sold to meet WDC s requirements 19 Draft Housing and Other Property Activity Management Plan Doc
402 Stimulate the central Te Kuiti CBD by redeveloping the railway complex 2.2 Strategic (Goals) The strategic goals for Housing and Other Property are: Strategic Goal 1: To ensure that an adequate Housing and Other Property portfolio is provided and maintained for the well-being of the user and community groups; Strategic Goal 2: To provide community-agreed LOS in the most cost effective way through the creation, operation, maintenance, renewal and disposal of assets to provide for existing and future users; And the WDC s principal objectives are to: a) Programme works for the development of land and buildings in accordance with adopted AMPs b) Operate WDC owned halls to a standard acceptable to users by providing appropriate management structures / resources c) Implement the policies as set out in the proposed adopted forestry management plans d) Continue the disposal of land identified as surplus to WDC requirements e) Identify life-cycle (long-term) costs for an agreed Level of Service f) Ensure the maintenance of the public infrastructural assets in perpetuity, so that there is no decrease in value, and to forecast the estimated future cost of so doing; g) Put in place a sound management regime for all matters relating to Housing and Other Property activities h) Ensure WDC s assets are legally protected by the provision of easements and other legal instruments. 2.3 Legislative Framework The following legislation impacts on the management of Housing and Other Property and the LOS offered by WDC in relation to the Housing and Other Property activity. Local Government Act 2010 and Amendments This Act gives WDC power of general competence to undertaken any business or activity. Provided the activity is consistent with the object of the Act and the community has been consulted in a meaningful way, this can include the protection of reserves and the provision of recreation facilities. The consultation process through the Local Government Act provides an indicator for the Level of Service that the community expects. Resource Management Act (1991) and Amendments This Act requires WDC to manage the use, development and protection of natural and physical resources in a way, or at a rate, which enables people and communities to implement and review objectives, policies, and methods to achieve integrated management of the effect of the use, development, or protection of land and associated natural and physical resources of the district. 20 Draft Housing and Other Property Activity Management Plan Doc
403 The purpose of this Act is to ensure that employers provide safe working conditions for their employees in the workplace. WDC has taken steps to ensure that its employees are provided with safe working conditions and that other persons are protected in workplaces. Land Transfer Act (1952) Property Law Act (2007) These Acts govern how WDC, and other dealers in land, proceed with the disposal of land and subdivisions that it is involved in. As WDC often deals in land, whether for strategic purposes, land banking or subdivision or leases, due process for the disposal and purchase are followed. The Act provides general rules to dispositions, instruments, transactions and property as well as setting the parameters for leases, covenants, easements, access lots, mortgages and other miscellaneous land dealings. Residential Tenancies Act (1986 and amendment 2010) All WDC s residential tenancies, including the Elderly Persons Housing complex, fall under this Act. The Act governs the administration of rental properties and sets out frameworks for this administration. Other WDC Plans and Bylaws The District Plan, reserve management plans and bylaws also impact on the management of Housing and Other Property. 2.4 Our Customers Who Our Customers Are In order to provide efficient LOS WDC needs to identify its potential customers. For Housing and Other Property assets, the customers include: Figure 2.2: External and Internal Customers External Internal Elderly community WDC staff and Contractors District community Elected Representatives Lessees WDC s consultants Tenants Neighbours Hall users and committees Department of Conservation Department of Health, Waikato Health Board Land sellers and purchasers Department of Work and Income KiwiRail 21 Draft Housing and Other Property Activity Management Plan Doc
404 Elderly Persons Housing In 2008 WDC included in the Versus Survey, a survey to measure overall district satisfaction with the Elderly Persons Housing (EPH) services provided (result shown in graph form below). The results will then be used to revise and improve the service standards. Future surveys will enable comparisons on a yearly basis and gauge trends in WDC s service and housing stock. The results of the initial Versus District survey between for the EPH are included in the graphs below. While the figures are relatively low, it is believed this is a reflection that few people have personal dealings with the facility. It is noted that the figure is however increasing each year Figure 2.3: Versus Percentage Satisfied with the Elderly Persons Housing Facilities Percentage (%) l Year No survey of EPH was undertaken in 2013 and The reasons for this was that results have historically been skewed as so few residents are involved in this activity. To assist with the knowledge gained from the above graph, a further tenant only satisfaction survey has been undertaken internally by WDC in 2008, and 2011 to gauge tenant adequacy and satisfaction with the facility. 22 Draft Housing and Other Property Activity Management Plan Doc
405 No Reply Vpoor Poor Ave Satis Vsat Satisfaction EPH Overall Satisfaction Number No Reply Poor Vpoor Ave Satis Vsatis Satisfaction As discussed, this is a very low satisfaction result in the District Versus survey. A large do not know component of 39% may be skewing the result. However the tenant survey in 2008 generally considers the adequacy of provision and general satisfaction as being quite high. Other Housing No survey information is available. A tenant survey is to be carried out yearly, beginning in This has not been implemented to date but qwill be implemented in Community Halls Historically in 2005 and 2006 the halls have been included in the annual Versus survey but not since that time. These figures are shown below in the graph. In future the hall management committees should be surveyed annually to measure satisfaction with WDC provided services and assistance with building maintenance. The first survey was to be carried out in 2012 after the introduction of the hall deferred maintenance assistance and compliance maintenance but will now be implemented in the year once the assistance programmes have bedded in.. 23 Draft Housing and Other Property Activity Management Plan Doc
406 Year This survey shows a satisfaction level at or marginally above 50% which is unsatisfactory. The value increases to 60% and 66% respectively if the average figures are included. A high did not know figure shows through on the District survey and therefore it may be best to consider those that identified the halls as poor or very poor. These figures are 4% and 1% respectively. More accurate, current information needs to be gathered to give WDC a better picture. Part of the issue with Rural Halls is the backlog of deferred maintenance and the ability of the hall committees to fund long term maintenance works. WDC included funding for deferred maintenance and compliance works in year 2011/2012 in the LTP which should flow through into the satisfaction figures in the long term. This funding is to be continued into the LTP Other In order to manage customer expectations effectively, the users perception of the service to be delivered by WDC must match WDC s goals. A customer charter is one way of communicating to customers exactly what it is that WDC provides, while setting clear expectations in terms of the service delivery and responsibilities on both sides. This will be important in providing funding for community halls. Customer expectations may vary between the different communities, customers and stakeholder groups. Care will be taken to ensure the consultative process to develop the customer expectations framework involves a fair representation of users. 2.5 Other Stakeholders In order to provide an efficient Levels of Service (LOS) WDC needs to identify its potential stakeholders. For Housing and Other Property, the stakeholders include: Figure 2.6: Activity s Potential Stakeholders Housing Corporate Property Community Halls Railway Complex WDC Depots General Property Department of Building and Housing Department of Work and Income Families of the Elderly i-site New Zealand Waikato Regional WDC LIANZA for library activities Hall Committees KiwiRail Other lessees Waikato Regional WDC Rural Schools WDC Staff WDC Staff Senior Citizens Group Historic Places Trust Internal Services Unit Department of Conservation Sporting Groups WDC Staff Historic Places Trust Transit New Zealand Tenants All Users Lessees Other lessees 24 Draft Housing and Other Property Activity Management Plan Doc
407 WDC. 25 Draft Housing and Other Property Activity Management Plan Doc
408 2.7 Levels of Service Elderly Persons Housing, Corporate Property, Depots and Community Halls Strategic Goal 1: To ensure that an adequate Housing and Other Property portfolio is provided and maintained for the well-being of user and community groups. Figure 2.7: Customer Levels of Service for Housing and Other Property Key Service Criteria Satisfact ion Health and Safety Link to Community Outcomes Prosperous District Vibrant Communitie s Prosperous District LOS Statement Provision and maintenan ce of Elderly Persons Housing that meets the needs of the tenants Users of WDC owned buildings are safe Type of Measur e Manag ement Tool Manag ement Tool Measure (existi ng) Percentage of tenants satisfied with the provision and maintenanc e of Elderly Persons Housing Number of accidents recorded in building/pro perty accident register Performance Measurement and Targets > 60% > 65% * > 65% > 65% Performance Measurement procedure Elderly Persons Housing Customer Satisfaction Survey of tenants Nil Nil Nil Nil Analysis of building /property accident register (to be established) Strategic Goal 2: To provide community-agreed Levels of Service in the most cost effective way through the creation, operation, maintenance, renewal and disposal of assets to provide for existing and future users. Figure 2.8: Technical Levels of Service for Housing and Other Property Performance Measurement and Targets Key Service Criteria Cost Link to Community Outcomes Prosperous district Vibrant Communities LOS Statement WDC s Housing and Other Property Activity delivere d within budget Type of Measure Manage ment Tool Measure (existi ng) Variance of actual expenditure against yearly budget Variance + or 5% Varian ce + or 5% Varian ce + or 5% Varianc e + or 5% Performance Measurement procedure Analysis budgets of 26 Draft Housing and Other Property Activity Management Plan Doc
409 It is to be noted that indicators shown as AMP performance measure or Management Tools are for internal management use only. They are not designed to be reported publicly as part of the performance of the Community Service Group. They are not designed to be audited to any of the standards and requirements which pertain to performance measures which are used to report to WDC and the community. WDC considers that these indicators are valuable for internal management purposes, but for various reasons they are not suitable for reporting at WDC nor community level. Reasons for this may include concerns (sometimes marginal) around: Relevance Realism / ability of WDC to control performance Verifiability Neutrality Robustness Perverse incentives or Metadata issues, including Collection methods Monitoring frequency Data storage Quality assurance systems Intended use These internal management indicators are reviewed, and appropriate remedial action is undertaken, on an ongoing basis. 2.8 Key Performance Indicators In order to gauge how well we are achieving our LoS and Key Service Criteria Indicators, identified in 2.7 above, WDC s Community Services staff supervise any relevant contracts. Presently inspections tend to be on an informal basis, although new contracts will allow for random monthly inspections eg ISU contracts. WDC in the future will develop methodologies to analyse these monthly inspections to ascertain percentages over a year period which can then be compared on a yearly basis. The Levels of Service Indicators / Key Performance Indicators directly relate to meeting the target Levels of Service as measured using the Performance Measures identified. The achievement of the Target LoS is linked to the successful completion of the programmes and projects identified in 2.10 below. 2.9 Trends Impacting on Level of Service (Possible Future Changes/Service Level Review) Environmental An increasing environmental awareness/perceived responsibility in maintaining environmental sustainability encourages movement towards using environmentally sound technologies in terms of construction, maintenance and energy consumption. Environmental imperatives often conflict with economic priorities yet they are critical to local features. Local authorities will have a stake in meeting global targets for sustainability as well as having responsibility to promote the environmental well being of the area Economic A growing pressure for more sustainable approaches to economic growth. Rates of migration into town centres and away from the country as the population ages. Market fluctuations: Supply/demand influences by private market on rents (i.e. reflected in market median influencing rent levels and affordability). The fluctuations of the real estate cycle and its current boom / bust impact on construction costs. 27 Draft Housing and Other Property Activity Management Plan Doc
410 Effects of Legal Compliance and new legislation introduced by Government Increased demand for localised facilities as the cost of living increases eg some local halls Social An aging population may lead to increased demand for WDC s Elderly Persons Housing facilities. Improvements in overall life expectancy of the elderly; potentially extending tenancy periods. A higher rate of applications for elderly housing made by couples (rather than singles) and the effect this may have on internal and external requirements. Increased attention on quality of life issues, growing leisure time and a need for elderly group/community participation, recreation, health management etc. Higher rate and extended use of vehicle usage by the elderly. An increase in neighbourhood safety concerns for the elderly. Rates of volunteerism for hall management dropping. Failing demand in some cases for the services that community halls provide. Rural schools generally have a characteristic interdependence with rural community halls in the District; therefore school closure has had a large impact on hall patronage. An increase in the rural employee/resident tending to be more transient in nature Cultural Changing cultural expectations and ethnic profile of the community may lead to a change in the demand for the type of properties the WDC currently operates. The impact of cultural diversity may impact on customer relations and/or expectations Confidence Levels and Assumptions for Stated Trends Refer to Section 6.5 for grading definitions. Figure 2.9: Data Confidence Levels Trend National Demographic and Social trends sourced from National Institute of Demographic and Economic Analysis (Waikato University) Legal compliance commissioned from professional interpretation of statute Maintenance and renewal trends sourced from WDC and contractors records Confidence Level A A C 2.10 Key Programmes to Achieve Levels of Service WDC is implementing a number of projects to achieve the target LOS. facilities/equipment works to process improvement projects. The projects are split into two categories: Key programmes to maintain and achieve levels of service and Key programmes/strategies impacting on future LOS. These range from The table below summarises these projects, their forecasted total cost to WDC and an assessment of the confidence in the projections along with an estimated timeline. 28 Draft Housing and Other Property Activity Management Plan Doc
411 Key Programmes Figure 2.10: Key Programmes to Maintain and Achieve Levels of Service Trend Project Key Service Criteria Forecasted Total Cost Confidence Level in Projections Estimated Timeline for Project Completion Economic Energy efficiency Plan for WDC s buildings Satisfaction In-house In-house Ongoing Social Investigations and facilitation of EPH complex for Te Kuiti Satisfaction Currently funded as an exception projection item 2015EAP Social Facilitation of EPH development Satisfaction $45,000 refer Investments D AMP refer above Economic Provision of WDC Office Generator Meet $50,000 D Legislative requirements Economic Category 3 WDC Office Building Meet $15,000 D Assessment Legislative requirements Economic Disposal costs associated with the relocation of TK Community House Trust Satisfaction $10,000 D Key Strategies Impacting on Future Levels of Service Other investigatory/strategy type programmes have been identified that, while not impacting on levels of service initially, the outcomes may. These are listed below. Figure 2.11: Other Key Programmes That May Affect Levels of Service Trend Project Key Service Criteria Forecasted Total Cost Confidence Level in Projections Estimated Timeline for Project Completion Economic Review of Leases and Licences Responsiveness Quality $5,500 annually D Ongoing Description of Key Programmes Investigation and Facilitation of EPH Development WDC has identified the need for an assessment of its EPH stock to identify the appropriateness of the stock and deferred and ongoing maintenance costs and build on the previous GWH maintenance study. This report will be used to assist WDC in its future decision making in relation to the provision of EP Housing within the wider context of Waitomo District. Instead of undertaking the review, workshops with Council for the development of this Activity Plan discussion around the appropriateness of the housing stock were held. It was considered that in the best interests of providing for future EP Housing that the existing monies be reallocated to investigations associated with alternative funding and development opportunities. It is considered that WDC s long term vision should align itself with being a facilitator rather than being a funder/provider with respect to housing for the elderly. 29 Draft Housing and Other Property Activity Management Plan Doc
412 Energy Efficiency Plan WDC is a major user of energy and forms a large component of WDC s maintenance budgets across the organisation. A study of WDC s major energy use has identified areas of savings. Further internal plans are required to maximize benefits. Review of Leases and Licences WDC has many leases and licences as required under the Local Government Act 2002, Public Works Act 1951, Reserves Act 1977 and the Property Law Act 2007 for sporting groups, ground usage and grazing. Aside from this, there are also many areas where these should but do not exist. Leases and Licences protect groups but also are a potential valuable source of income for WDC. Review and action is an ongoing to bring these into a current status Provision of WDC Office Generator WDC has an obligation through its Civil Defence function to be able to operate in times of emergency. To enable WDC office to function at all times an alternative power source is required. Currently the generator that is available for this function is used at the Te Kuiti pump station in times of emergency meaning the WDC office is potentially unable to function. Category 3 WDC Office Building Assessment WDC also has an obligation under its Civil Defence function to provide a facility meeting the standards of a category three building to operate from in times of emergency. Currently the WDC office has no category rating and therefore an engineering assessment is required to identify any works, should they be required, to enable WDC to meet its obligations. Outcomes of this assessment will be dealt with through the exceptions AP process.satisfaction Disposal costs associated with the relocation of TK Community House Trust WDC resolved in the 2009 LTP to dispose of the building at 2 Jennings Street, currently housing the TE Kuiti Community House Trust. Disposal could not take place until the TKCHT was relocated and this is currently planned for early 2015 to 28 Taupiri Street, another WDC building. At this stage it is not WDC s intention to dispose of the land but the building only due to its poor condition and relatively high cost of repair. Costs associated with this disposal are included in the plan. 30 Draft Housing and Other Property Activity Management Plan Doc
413 Growth Planning for the Future and Demand for the Service The key issues potentially impacting on demand forecasts for Recreation and Culture are: a. An aging population and a higher proportion of under 15 year olds in the population b. The need to develop assets relevant to community needs c. User pays as a means of funding and addressing equity issues d. the low socio-economic demographics for our region e. Pressure to maintain and enhance environmental values f. An increase in public awareness and expectations of higher standards g. An increase in diversity of recreational opportunities h. Apparent stabilisation / minor decrease in District population i. Governmental emphasis on fitness j, Increasing tourism to our District k. The need to provide services in a more efficient manner 3.1 Population Growth and Structure The following information has been sourced from a paper prepared by the National Institute of Demographic and Economic Analysis (Waikato University) for the Waikato Regional Council in August Council has chosen to use these population forecasts for the LTP as Statistics New Zealand Forecasts for the planning period are not available until The graph below presents the 2013-base medium population projection for Waitomo District to 2063, along with historical population estimates from Statistics New Zealand back to The 2006-base Statistics New Zealand (SNZ) high, medium and low projections (October 2012 update) are also included for comparison. The NIDEA projections show a continuing trend of declining population for Waitomo District with a projected population of 8,743 in These projections follow the recent trend in the District s population reasonably closely; with annualised population decline over the period of 0.5% per year (base year projection is different to actual). Figure 3.1: Baseline Medium Population Projections for Waitomo District and Comparison with Statistics NZ (2012) Subnational Projections 31 Draft Housing and Other Property Activity Management Plan Doc

414 Current Pattern of Building and Subdivisional Development As in the previous section the population growth for the District is projected to be static and/or in decline. Historic trends of pockets of sub divisional and building activity in the form of modest lifestyle development around Te Kuiti, Waitomo Village, Mokau, and Awakino are also slowing. The sub divisional activity that was occurring in and around the Te Waitere area has slowed in recent years. Over the last five years there has been an average of 12 new dwellings constructed per year. In terms of subdivisions the average number of lots created over the same period has been 3. Whilst 151 new lots were consented over the last five years only 63 new dwellings were actually consented. While this is partly due to the delay between subdivision approval and building construction, there is also a backlog of undeveloped lots in the District which need to be factored into planning considerations. Future Subdivisional Activity From a recent, informal, desktop planning exercise, drawing from development proposals which are known to officers and/or are in the early stages of consent processing, it has been identified that further growth is unlikely to place pressure on the provision of Council services. Indications are the recent trends of relatively slow development are likely to continue in to the foreseeable future. The demographic and development trends show that there is no demand for growth related infrastructure at the present time or in the foreseeable future. For the past few years Council has been working on improving the condition of its core infrastructure assets, particularly in the Water Supply and Sewerage activity areas, in order to support public health outcomes and to meet its Resource consent and other legislative requirements. The growth and development trends support an approach which continues to upgrade and maintain existing assets as opposed to the development of new capacity driven infrastructure. There is currently enough capacity in the infrastructure network to allow for minimal growth should it occur. Council does not anticipate any significant land-use changes during the period of this LTP. Potential societal change factors The age structure of the Waitomo District is among the more youthful in the Waikato Region (fourthyoungest in 2013) and experiences the least degree of population ageing. In 2013, 14.2 percent of the population is aged 65 years and over, and this is projected to increase to 19.4 percent by The proportion of the population under 65 years of age is relatively high at 85.8 percent in 2013, 82.8 percent in 2033 and 68.7 by The ratio of elderly persons to children increases slightly from 0.61 in 2013 to 0.98 in 2033, before increasing markedly to 2.71 in Figurre 3.2: Age-Sex structure for Waitomo District, 2013 and 2013 (medium projection) 32 Draft Housing and Other Property Activity Management Plan Doc
Section D: Financial Information
 The Shearer Statue Section D: Financial Information This section provides the Financial Strategy, details on the financial implications of the Plan, including estimated expenditure, revenue and public
Performance Management. Framework
 Management Framework Section Two Supporting Information LTP 2015-25 Structure of Groups of Activities Council carries out a number of activities or functions in order to meet it statutory responsibilities
Financial Strategy Rautaki Pūtea
 FOR CONSULTATION Financial Strategy Rautaki Pūtea SUPPORTING THE LONG TERM PLAN 2018-28 CONSULTATION DOCUMENT Financial Strategy Note: The information in this strategy has been drafted to support the proposed
Significant Forecasting Assumptions
 Summary of s The following general and financial s are assumed for the life of this Long Term Plan (2018-28). Level Consequence General s 1 Population Change Medium Low Minor 2 Household Change Medium
Pre-Election Report. July 2016 Clare Hadley, Chief Executive
 Pre-Election Report July 2016 Clare Hadley, Chief Executive This document constitutes the pre-election report for the purposes of Section 99A of the Local Government Act 2002 Contents Contents... 2 Introduction...
2018 Long Term Plan Financial forecasting assumptions
 2018 Long Term Plan Financial forecasting assumptions Forecasting assumption Risk Likelihood of occurrence Projected price change factors Forecast financial information That actual price changes vary Medium
Otorohanga District Council Summary Annual Report for the year ended 30 June 2015
 Otorohanga District Council Summary Annual Report for the year ended COMMENTS FROM THE MAYOR AND THE CHIEF EXECUTIVE Council continues to generally operate in a very lean and efficient mode, made possible
Section E: Policies and Strategies
 Centennial Park Te Kuiti Section E: Policies and Strategies This section contains: Policy Statement on Council Controlled Organisations Policy on Appointment of Directors to Council Controlled Organisations
long term plan financial strategy Financial Strategy
 33 Financial Strategy long term plan 2012-22 financial strategy As a part of Council s planning for the future, we have considered the importance of good financial management and have prepared what we
Revenue and Financing Policy 2017
 Revenue and Financing Policy 2017 Foreword Andrew Duncan Manager Financial Policy, Auckland Council Adopted by the Governing Body on 29 June 2017 Resolution number: GB/2017/65 4 Auckland Council Revenue
Strategic Performance Framework
 Strategic Performance Framework Overview The strategic performance framework is a list of Key Performance Indicators (KPIs), which enable the Council to report how successful it has been in delivering
2 level set out in the Long Term Plan 2015/2025. We have been able to utilise our improved financial capacity and flexibility to further our current c
 File number: 2304.15 Approved for agenda Report to: Council Meeting date: 14 March 2017 Subject: Annual Plan 2017/2018 material - source documents Date of report: 06 March 2017 From: Glennis Christie,
achieving results in the public sector Kāpiti Coast District Council Financial Investigation of a Kāpiti Coast Unitary April 2013
 AUCKLAND SYDNEY BRISBANE PERTH Kāpiti Coast District Council Financial Investigation of a Kāpiti Coast Unitary achieving results in the public sector TABLE OF CONTENTS 1. INTRODUCTION... 1 2. METHODOLOGY...
DRAFT 10-YEAR PLAN SIGNIFICANT FORECASTING ASSUMPTIONS
 2018-28 DRAFT 10-YEAR PLAN SIGNIFICANT FORECASTING ASSUMPTIONS Purpose 1. To outline the significant forecasting assumptions that inform the draft 2018-28 10-Year Plan. Introduction 2. Legislation requires
Significant forecasting assumptions LTP 2018 V2 12 February 2018
 Significant forecasting assumptions LTP 2018 V2 12 February 2018 Introduction In preparing forecasts, both financial and non-financial, there is a need to provide assumptions to address the uncertainties
POPULATION GROWTH. Steady and moderate growth of 1.7% a year to 2018, slowing to 0.6% a year out to 2048 MITGATING FACTORS (IF APPLICABLE)
") POPULATION GROWTH Steady and moderate growth of 1.7% a year to 2018, slowing to 0.6% a year out to 2048 ALTERNATIVES IMPACT LIKELIHOOD OVERALL RISK REASONS AND FINANCIAL EFFECT That the population growth
POPULATION GROWTH Steady and moderate growth of 1.7% a year to 2018, slowing to 0.6% a year out to 2048 ALTERNATIVES IMPACT LIKELIHOOD OVERALL RISK REASONS AND FINANCIAL EFFECT That the population growth
Infrastructure Strategy:
 Infrastructure Strategy: 2018-2048 Introduction Infrastructure provides a foundation for building strong and resilient communities. This Strategy sets out how the Invercargill City Council s existing infrastructure
Financial Strategy. What is Council s financial strategy?
 Financial Strategy Having a financial strategy is one of the key tools to the Council achieving its vision for the future. It is a new requirement under the amendments to the Local Government Act 2002.
Section 5 Dollars and Cents
 Section 5 Dollars and Cents section Revenue and financing policy 5a Financial statements 5b Funding impact statement rating implications 5c Rating changes 5d Balanced budget statement 5e Financial reporting
HAVE YOUR SAY CONSULTATION DOCUMENT ON THE ANNUAL PLAN CARTERTON DISTRICT COUNCIL ISSN
 CONSULTATION DOCUMENT HAVE YOUR SAY ON THE ANNUAL PLAN 2017-2018 CARTERTON DISTRICT COUNCIL ISSN 1171 7459 FROM HIS WORSHIP THE MAYOR The biggest issue facing us now is finding a way to eventually discharge
Southland District Council. Pre-Election Report
 Southland District Council Pre-Election Report Chief Executive s Introduction Welcome to Southland District Council s first Pre-Election Report. The purpose of this report is to provide information to
Otorohanga District Council Summary Annual Report for the year ended 30 June 2016
 Otorohanga District Council Summary Annual Report for the year ended COMMENTS FROM THE MAYOR AND THE CHIEF EXECUTIVE The 2015/16 year was another year of steady performance by Council. Whilst there were
Development Contributions Policy 2018: Springvale Urban Expansion Area and Otamatea West
 Development Contributions Policy 2018: Urban Expansion Area and West 1 P a g e Development Contributions Policy 2018: Urban Expansion Area and West Originator: Damien Wood, Development Engineer Contact
2017 ENTERPRISE ASSET MANAGEMENT PLAN
 Corporate Asset Management 2017 ENTERPRISE ASSET MANAGEMENT PLAN Investments in Peel s Infrastructure We are all asset managers! Executive Summary The Region s infrastructure is a public investment with
PROPERTY ASSET MANAGEMENT PLAN EXECUTIVE SUMMARY
 PROPERTY ASSET MANAGEMENT PLAN EXECUTIVE SUMMARY - 2017 Introduction One of the main purposes of Local Authorities under the LGA 2002 is to meet the current and future needs of communities for good quality
Financial Strategy
 2015-25 Financial Strategy Quality Information Document Ref 2 Financial Strategy Date 30 June 2015 Prepared by Peter Till, Chief Executive Reviewed by Approved by Peter Till, Chief Executive Revision History
Draft Long Term Plan
 Draft Long Term Plan 2018-28 Christchurch City Council draft Long Term Plan 2018 2028 Christchurch Ōtautahi Volume 1 of 2 ccc.govt.nz/haveyoursay Published on 9 March 2018 by Christchurch City Council
achieving results in the public sector Wairarapa District Councils
 AUCKLAND SYDNEY BRISBANE PERTH Wairarapa District Councils Phase Three Report: Investigation into the formation of an Amalgamated Wairarapa District Council and a Wairarapa Unitary Authority achieving
Christchurch City Council Draft Annual Plan 2016/17 and Proposed Amendments to the Long-term Plan (Draft) Council Consideration Draft
 Council Consideration Draft") Christchurch City Council Draft Annual 2016/17 and Proposed Amendments to the Long-term 2015-2025 (Draft) Council Consideration Draft Please note: This document contains the Council consideration draft
Christchurch City Council Draft Annual 2016/17 and Proposed Amendments to the Long-term 2015-2025 (Draft) Council Consideration Draft Please note: This document contains the Council consideration draft
NAPIER CITY COUNCIL TEN YEAR PLAN APPENDIX A 2012/13 TO 2021/22. Detailed Financial Information and Council Policies. Adopted 26 June 2012
 NAPIER CITY COUNCIL TEN YEAR PLAN 2012/13 TO 2021/22 ISSN 1173-4477 APPENDIX A Detailed Financial Information and Council Policies Adopted 26 June 2012 Napier City Council Phone: 06 835 7579 Private Bag
Strategic Asset Management Policy
 Strategic Asset Management Policy Submission Date: 2018-04-24 Approved by: Council Approval Date: 2018-04-24 Effective Date: 2018-04-24 Resolution Number: Enter policy number. Next Revision Due: Enter
SUMMARY 2017/18 ANNUAL REPORT MESSAGE FROM THE MAYOR AND CHIEF EXECUTIVE.
 ANNUAL REPORT SUMMARY /18 MESSAGE FROM THE MAYOR AND CHIEF EXECUTIVE We are pleased to present the Annual Report for the year ended 30 June. This Report details Council s overall performance as well as
B.29[19a] Matters arising from our audits of the long-term plans
![B.29[19a] Matters arising from our audits of the long-term plans](/thumbs/95/123081028.jpg "B.29[19a] Matters arising from our audits of the long-term plans") B.29[19a] Matters arising from our audits of the 2018-28 long-term plans Photo acknowledgement: istock LazingBee B.29[19a] Matters arising from our audits of the 2018-28 long-term plans Presented to the
B.29[19a] Matters arising from our audits of the 2018-28 long-term plans Photo acknowledgement: istock LazingBee B.29[19a] Matters arising from our audits of the 2018-28 long-term plans Presented to the
Revenue and Financial Policy
 Revenue and Financial Policy Revenue and Financing Policy The Revenue and Financing Policy sets out how the Council funds each activity it is involved in and why. The Council is required to have this Policy
THAMES-COROMANDEL DISTRICT COUNCIL COASTAL HAZARDS POLICY
 THAMES-COROMANDEL DISTRICT COUNCIL COASTAL HAZARDS POLICY 1. OBJECTIVES a) To sustainably manage the effects of coastal hazards on the District s coastal foreshore land by ensuring risk to life and property
FINANCIAL PLAN WATER AND WASTEWATER LINES OF SERVICE
 UCS2018-0223 ATTACHMENT 1 FINANCIAL PLAN 2019-2022 WATER AND WASTEWATER LINES OF SERVICE 2018 MARCH 14 MAKING LIFE BETTER EVERY DAY UCS2018-0223 Financial Plan 2019-2022 - Water and Wastewater Lines of
SUPPORTING DOCUMENTS FOR THE CONSULTATION DOCUMENT
 SUPPORTING DOCUMENTS FOR THE CONSULTATION DOCUMENT 1 2 Contents Proposed Financial Strategy 5 Financial Strategy 8 Proposed Infrastructure Strategy 27 Infrastructure Strategy 2018-48 28 Proposed Statements
Revenue and financing policy
 Revenue and financing policy Revenue and Financing policy Background The Local Government Act 2002 (LGA) requires the Council to adopt a range of policies in order to provide predictability and certainty
Supporting Information index.
 2018-28 Supporting Information index. Subject Page Financial Strategy 2 Infrastructure Strategy 10 Significant forecasting assumptions 51 Levels or service, Performance Measures, and Targets. 64 Financial
PEOPLE PLAN PROGRESS. Our Achievements
 Our Achievements Our Achievements (service performance reporting) In the statements of service performance there are references to an Annual Survey. This survey was undertaken by Key Research and the sample
Revenue and Financing Policy
 Revenue and Financing Policy REVENUE AND FINANCING POLICY P a g e 1 Revenue and Financing Policy The Revenue and Financing Policy sets out how Council funds each activity it is involved in and why. Council
REVENUE AND FINANCING POLICY
 001 Attachment 1 REVENUE AND FINANCING POLICY The purpose of this document is to set out, in accordance with Section 103 of the Local Government Act 2002, to outline Council s decision on the appropriate
ASSESSMENT REPORT FOR ANNUAL PLAN 17/18 DIFFERENCES FROM YEAR 3 OF THE LTP
 ASSESSMENT REPORT FOR ANNUAL PLAN 17/18 DIFFERENCES FROM YEAR 3 OF THE LTP 2015-25 SIGNIFICANT OR MATERIAL? In order to determine if consultation is required on the Annual Plan 2017/18 Council must assess
KAWERAU DISTRICT COUNCIL
 KAWERAU DISTRICT COUNCIL Long Term Plan 2018-2028 Incorporating the Annual Plan 2018/2019 Contents OVERVIEW... 2 From the Mayor and CEO... 4 Financial Strategy... 6 Infrastructure Strategy... 13 Balancing
Hurunui District Council. Pre-election Report. July 2016
 Hurunui District Council Pre-election Report July 2016 1 TABLE OF CONTENTS 1. PURPOSE... 3 2. INTRODUCTION... 3 3. SOURCE OF THE INFORMATION PROVIDED IN THIS DOCUMENT... 3 4. BALANCE SHEET... 6 5. FUNDING
Revenue and Financing Policy
 Revenue and Financing Policy Overview Environment Canterbury s financial policies aim to achieve efficient and effective regional governance. We will prudently manage the our finances in such a manner
Draft Strategic Asset Management Plan
 Draft Strategic Asset Management Plan 2016-2026 December 2015 Revised to include Special Rate Variation Scenarios The capital works programs included in this Strategic Asset Management Plan are subjected
2030 Infrastructure Plan Introduction
 2 nd Draft February 25, 2016 Infrastructure Plan Introduction 1.0 INTRODUCTION The Infrastructure Plan covers the City s infrastructure investment needs for the next 15 years (2016-) and was developed
REVENUE AND FINANCING POLICY
 REVENUE AND FINANCING POLICY 2018 1 Far North District Council Long Term Plan 2018-28 Revenue and Financing Policy Overview The Local Government Act 2002 (LGA) requires all councils to adopt a Revenue
A snapshot of local government s financial health: a sector in good shape
 A snapshot of local government s financial health: a sector in good shape Prepared by the Local Government Funding Agency December 2015 Contents Foreword Observations on local government sector finances
Significant Forecasting Assumptions
 Significant Forecasting Assumptions Council has made the following significant assumptions in preparing the Ashburton District Council Long Term Plan 2015-2025. Most of these assumptions have been identified
Significant Planning Assumptions. Supporting Document for LTP
 Significant Planning s Supporting Document for LTP 2018-28 CONTENTS SIGNIFICANT PLANNING ASSUMPTIONS... 3 INFLATION... 3 POPULATION GROWTH... 4 HOUSEHOLD GROWTH... 4 GROWTH IN RATING BASE... 6 RESOURCE
MUNICIPALITY OF ARRAN-ELDERSLIE CHESLEY DRINKING WATER SYSTEM FINANCIAL PLAN
 MUNICIPALITY OF ARRAN-ELDERSLIE CHESLEY DRINKING WATER SYSTEM FINANCIAL PLAN 15-013 GSS Engineering Consultants Ltd. Unit 104D 1010 9 th Avenue West Owen Sound ON N4K 5R7 519.372.4828 TABLE OF CONTENTS
Water Quality Improvement Act Purpose and Need For Legislation
 Water Quality Improvement Act Purpose and Need For Legislation Sec. 1 Short Title: Water Quality Improvement Act. Sec. 2. Sewer Overflow Control Grants: The capital costs that cities bear to address combined
ACCOUNTING INFORMATION
 CONTENTS Accounting Information... 1 Inflation Adjusted Accounts... 14 Reserve Funds... 25 Financial Regulations Benchmarks... 28 ACCOUNTING INFORMATION REPORTING ENTITY The financial forecasts reflect
Southern Metropolitan Regional Council
 Southern Metropolitan Regional Council Draft Long Term Financial Plan 2013 23 13 June 2013 Contents 1 Message from the Chief Executive Officer 3 2 Long Term Financial Planning 4 3 Who Are We 6 4 Our Vision
District of North Saanich 2019 Dra Budget
 District of North Saanich 2019 Dra Budget Budget in Brief Each year, the District develops an annual budget outlining how tax dollars are invested to support our residents and community. We include a five-year
other information LONG-TERM PLAN other information
 417 other information This section contains the assumptions on which this plan is based, a summary of the Assessment of Water and Sanitary Services and a summary of the Waste Management and Minimisation
CORPORATE ASSUMPTIONS
 of Minor and short term population changes have minimal impact on Council. Usually Resident Population (URP) of the district will continue to decline at a rate of approximately 0.02% per annum. (Source:
our city our future DRAFT RESOURCING STRATEGY July 2014 FOR PUBLIC EXHIBITION 4 August - 15 September 2014
 our city our future SUSTAINABLE BLUE MOUNTAINS FOR PUBLIC EXHIBITION 4 August - 15 September 2014 DRAFT RESOURCING STRATEGY 2014-2024 July 2014 Including three possible options for Resourcing Our Future
PART 3 Long Term Financial Plan
 PART 3 Long Term Financial Plan Draft Resourcing Strategy July 2014 1 Contents Part 3 Long Term Financial Plan... 1 3.1 Introduction... 4 3.2 Executive Summary... 4 3.3 Where are we today?... 6 3.3.1 Current
Significant Forecasting Assumptions
 Significant Forecasting Assumptions In preparing this Long Term Plan it was necessary for Council to make a number of assumptions about the future. The following tables identify those forecasting assumptions
Te Kauwhata Consolidated Detailed Business Case. Housing Infrastructure Fund
 Te Kauwhata Consolidated Detailed Business Case Housing Infrastructure Fund April 2018 EXECUTIVE SUMMARY This business case proposes accelerated infrastructure development in Te Kauwhata to enable the
DRAFT MULTI-YEAR Water and Wastewater & Treatment Budget December 17, ANNUAL UPDATE INVESTING IN OUR FUTURE. london.
 6 MULTI-YEAR BUDGET FOR THE 2019 ANNUAL UPDATE INVESTING IN OUR FUTURE london.ca/budget DRAFT 2019 Water and Wastewater & Treatment Budget December 17, 2018 Table of Contents Recommendations... 1 WATER
Funding Impact Statement
 Funding Impact Statement 1. Revenue and Financing Sources Generally The following revenue mechanisms will be used in 2015/16 and throughout the term of this LTP: General rates Targeted rates Fees and charges
Financial information
 Financial information 135 Significant forecasting assumptions and risks Greater Wellington Draft Long-Term Plan 2012-22 These prospective financial statements were authorised for issue by the Council on
EXPLAINED. Your Rates
 Your Rates EXPLAINED 2018-2019 The Horizons Region extends over 22,200km2 - from Ruapehu in the north and Horowhenua in the south, to Whanganui in the west and Tararua in the east, and has a population
Christchurch City Council Long-term Plan (Draft) Volume 1 of 2
 Volume 1 of 2") Christchurch City Council Long-term 2015-2025 (Draft) Published on 17 March 2015 by Christchurch City Council P O Box 73015 Christchurch, New Zealand Tel 64 3 941 8999 Fax 64 3 941 8984 Web http:// www.ccc.govt.nz
Christchurch City Council Long-term 2015-2025 (Draft) Published on 17 March 2015 by Christchurch City Council P O Box 73015 Christchurch, New Zealand Tel 64 3 941 8999 Fax 64 3 941 8984 Web http:// www.ccc.govt.nz
Water and Sewer Utility Rate Studies
 Final Report Water and Sewer Utility Rate Studies July 2012 Prepared by: HDR Engineering, Inc. July 27, 2012 Mr. Mark Brannigan Director of Utilities 591 Martin Street Lakeport, CA 95453 Subject: Comprehensive
STORMWATER ASSET MANAGEMENT PLAN. Hauraki District Council June 2015 Version
 2015-25 STORMWATER ASSET MANAGEMENT PLAN Hauraki District Council June 2015 Version Table of Contents 1.0 OVERVIEW OF THE STORMWATER ACTIVITY 4 1.1 History 4 2.0 STORMWATER ACTIVITY GOALS & OBJECTIVES
Mayoral Intent for the 10-year Budget (Long-term Plan)
") Mayoral Intent for the 10-year Budget (Long-term Plan) 2018 2028 Author: Mayor Phil Goff 22 August 2017 1 Purpose This report sets out my priorities as Mayor and the advice and work plans that I am asking
Mayoral Intent for the 10-year Budget (Long-term Plan) 2018 2028 Author: Mayor Phil Goff 22 August 2017 1 Purpose This report sets out my priorities as Mayor and the advice and work plans that I am asking
Upper Tukituki Flood Control Scheme. Asset Management Plan. October 2017 HBRC Plan Number 4559 HBRC Report Number AM 15-04
 Upper Tukituki Flood Control Scheme Asset Management Plan October 2017 HBRC Plan Number 4559 HBRC Report Number AM 15-04 Asset Management Group Technical Report ISSN 1174 3085 Engineering Section Upper
This introduction will give you a guide on how to follow the financial information given in this report.
 FINANCIAL STATEMENTS Introduction to the Financial Statements Financial Statements are produced by the WDC to fulfil the requirements of the Local Government Act 2002 and also to communicate its financial
Improving Financial Sustainability for Local Government
 Improving Financial Sustainability for Local Government A Guide for Elected Members INSIDE Use of financial indicators The role of debt Strategies and long term financial planning Local Governments in
Introduction to the Financial Statements
 Financial Statements Introduction to the Financial Statements Financial Statements are produced by the Council to fulfil the requirements of the Local Government Act 2002 and also to communicate its financial
UNDERSTANDING YOUR RATES ACCOUNT. INSTALMENT 1: Last day for payment 30 September 2016
 UNDERSTANDING YOUR S ACCOUNT INSTALMENT 1: Last day for payment 30 September HOW ARE S CALCULATED? Your rates account will show the different kinds of rate that we collect. Most of them are based on the
Significant Forecasting Assumptions. February 2015
 Significant Forecasting Assumptions February 2015 Significant Forecasting Assumptions Forecasting Assumption Risk Level of Population and Demographic Assumptions Population Growth: Kaipara District Council
PENSIONER HOUSING POLICY Approved by Finance and Corporate Committee
 PENSIONER HOUSING POLICY 2017 Approved by Finance and Corporate Committee 28 November 2017 1.0 INTRODUCTION This policy sets out the Council s practice in regard to the provision, management and tenancy
FUTURE SHAPING OUR. Annual Plan Waihangatia Nga Rangi Meake Nei. Ahutahi Ki Mua - Moving forward together!
 Waihangatia Nga Rangi Meake Nei SHAPING OUR FUTURE Ahutahi Ki Mua - Moving forward together! 2017-18 Masterton District Council I 161 Queen Street I PO Box 444 I Tel (06) 370 6300 I www.mstn.govt.nz 1
Financial Strategy. Balanced Budget
 Financial Strategy The theme of this 10-year plan is financial sustainability. The financial strategy is a cornerstone to the council achieving the goal of living within its means and ensuring sufficient
Water Service Asset Management Plan
 Water Service Asset Management Plan November 2016 Joel Shaw, P.Eng. 1435 Water Street Kelowna, BC V1Y 1J4 TEL (250) 469-8739 jshaw@kelowna.ca kelowna.ca Document Control Rev No Date Revision Details Author
REGIONAL EVALUATION FRAMEWORK 1.0 INTRODUCTION 2.0 PURPOSE 3.0 DEFINITIONS. Edmonton Metropolitan Region Planning Toolkit
 Edmonton Metropolitan Region Planning Toolkit Re-imagine. Plan. Build. Edmonton Metropolitan Region Growth Plan 1.0 INTRODUCTION On October 26, 2017, the Government of Alberta approved the Edmonton Metropolitan
MAXIMISE THE LEVEL OF SERVICE USING CROSS ASSET PORTFOLIO RENEWALS MANAGEMENT
 Mason, Rangamuwa, Henning Page 1 of 15 MAXIMISE THE LEVEL OF SERVICE USING CROSS ASSET PORTFOLIO RENEWALS MANAGEMENT Michael Mason 1, Siri Rangamuwa 1, Theunis F. P Henning 2 Corresponding Author: Michael
Forecasting assumptions
 Forecasting assumptions All assumptions have medium or low uncertainty unless otherwise specified. The significant lives of assets can be found in the Accounting Policies (available on our website) and
Long Range Financial Plan
 Long Range Financial Plan SUMMARY Water for Life, Ka Wai Ola MARCH 2018 Table of Contents The Value of a Long Range Financial Plan................................... 3 The BWS s Large and Complex Water
MUNICIPALITY OF MISSISSIPPI MILLS. plan. December, 2016
 MUNICIPALITY OF MISSISSIPPI MILLS plan December, 2016 PREFACE This Asset Management Plan is intended to describe the infrastructure owned, operated and maintained by the Municipality of Mississippi Mills
Mission Statement. Table of Contents
 Mission Statement Otorohanga District Council will strive to be the best rural council in New Zealand, operating proactive policies which promote progress while taking into account social, cultural, economic
2017 Budget In Brief June 2017
 2017 Budget In Brief June 2017 TABLE OF CONTENTS INTRODUCTION 201 7 BUDGET General Overview... 2-3 Financial Overview... 4-7 SUPPLEMENTARY INFORMATION Where the Money Comes From... 8 Where We Spend the
Contents. Table of Figures. Community Budget Report 2012/13 Australia s most sustainable region
 Contents Mayor s Message... 4 Introduction... 6 Budget at a Glance... 6 Financial Statements... 7 Statement of Income and Expenses... 8 Statement of Financial Position... 9 External Loan Liabilities...
Environmental Improvement Fund
 Informational Paper 64 Environmental Improvement Fund Wisconsin Legislative Fiscal Bureau January, 2009 Environmental Improvement Fund Prepared by Kendra Bonderud Wisconsin Legislative Fiscal Bureau One
Agenda Council Meeting. Tuesday 23 February am. Council Chambers Queen Street TE KUITI
 Agenda Council Meeting Tuesday 23 February 2016 9.00am Council Chambers Queen Street TE KUITI Doc No 384978 NOTICE OF MEETING A MEETING OF THE WAITOMO DISTRICT COUNCIL IS TO BE HELD IN THE COUNCIL CHAMBERS,
ASSET MANAGEMENT STRATEGY
 ASSET MANAGEMENT STRATEGY Version 3 - Final Adopted 19 February 2013 Doc Code CD-WS-T-001 NAMS.PLUS Burnie City Council Asset Strategy Document Control Document Control NAMS.PLUS Asset www.ipwea.org.au/namsplus
What s the Plan Rangitikei...?
 RANGITIKEI DISTRICT COUNCIL CONSULTATION ON THE LONG TERM PLAN 2015-2025 What s the Plan Rangitikei...? Consultation Document for the Proposed Long Term Plan DISTRICT COUNCIL RANGITIKEI DISTRICT COUNCIL
NATIONAL LAND TRANSPORT PROGRAMME / INformation sheet / october 2012
 NATIONAL LAND TRANSPORT PROGRAMME 2012 15 / INformation sheet / october 2012 Creating transport solutions for a thriving New Zealand The NZ Transport Agency Board has adopted the 2012 15 National Land
Annual Plan CENTRAL HAWKE S BAY DISTRICT COUNCIL
 Annual Plan 2017-18 CENTRAL HAWKE S BAY DISTRICT COUNCIL Introduction Once every three years, Central Hawkes Bay District Council (CHBDC) adopts a 10 year Long Term Plan (LTP) and in the intervening years,
Financial Performance
 Financial Performance Statement of Comprehensive Revenue and Expense For the year ended 30 June Note Budget Revenue Rates, excluding targeted rates for water supply 4 57,758 57,786 54,146 57,740 54,146
Accounting policies. 1. Reporting entity
 Accounting policies 1. Reporting entity Taupō District Council (TDC) is a Local Authority under Schedule 2, Part 2 of the Local Government Act 2002. The Council has not presented group prospective financial
WELLINGTON CITY COUNCIL POLICY ON UNDERGROUNDING OF OVERHEAD CABLES
 WELLINGTON CITY COUNCIL POLICY ON UNDERGROUNDING OF OVERHEAD CABLES CONTENTS Foreword 3 Summary of Council Policy 3 Introduction 5 Definitions 5 Policy Objectives 5 Undergrounding Principles 5 Cost and
RATE STUDY. Town of Midland. HEMSON C o n s u l t i n g L t d.
 WATER AND WASTEWATER RATE STUDY Town of Midland C o n s u l t i n g L t d. December 2010 TABLE OF CONTENTS EXECUTIVE SUMMARY.........1 I BACKGROUND AND STUDY OBJECTIVES.........9 ll ASSOCIATED LEGISLATION.........13
Outline of significant changes to the Development Contributions Policy 2018/19
 Outline of significant changes to the Development Contributions Policy 2018/19 Updated 4/4/2018 Hamilton City Council is updating its Development Contributions Policy ( the existing Policy ). The Council