FISCAL YEAR BUDGET REPORT
|
|
|
- Tobias Chandler
- 5 years ago
- Views:
Transcription


1 FISCAL YEAR BUDGET REPORT
2 Table of Contents FOREWORD... 4 EXECUTIVE SUMMARY... 5 SAN FRANCISCO STATE UNIVERSITY BUDGETING AND PLANNING PROCESS COLLABORATIVE INPUT INTO BUDGET PLANNING SF STATE UNIVERSITY BUDGET CALENDAR CONSOLIDATED OPERATING BUDGET RECOMMENDED CURRENT FUNDS CONSOLIDATED FY17-18 REVENUE BUDGET (BY REVENUE ACCOUNT CATEGORY) SUMMARY BUDGET EXPENDITURE BY NATURAL CLASSIFICATION, FY EXPENDITURES BUDGET BY CABINET, FY EXPENDITURES BY UNIT AND TYPE, FY ACTUAL EXPENSES BY UNITS, RECOMMENDED FUNDS, FY14-15 to FY FUND BALANCE DETAILED STATEMENT OF UNIVERSITY GENERAL FUND REVENUE BUDGET GENERAL FUND ADDITIONS, FY DETAIL OF BUDGET ADJUSTMENTS, FY16-17 AND FY FY17-18 GENERAL FUND SOURCES GENERAL FUND ADDITIONS SOURCES AND USES FY OPERATING FUNDS SUMMARY FY14-15 to FY GENERAL FUND BUDGET SUMMARY BOARD OF TRUSTEES HIGHLIGHTS AND SPECIFICS FOR FY17-18 GENERAL FUND BUDGET BENCHMARK OF CSU CAMPUS GENERAL FUND EXPENDITURES FY ORGANIZATIONAL CHANGES STUDENT FEES SF STATE ENROLLMENT PLAN FY EXPENDITURE BUDGET BY CABINET ACADEMIC AFFAIRS FY EXPENDITURE BUDGET BY UNIVERSITY DIVISION (COLLEGE) COLLEGE OF LIBERAL CREATIVE ARTS COLLEGE OF ETHNIC STUDIES... 50
3 COLLEGE OF HEALTH & SOCIAL SCIENCES COLLEGE OF SCIENCE & ENGINEERING (CoSE) COLLEGE OF BUSINESS GRADUATE COLLEGE OF EDUCATION ACADEMIC SUPPORT UNITS STUDENT AFFAIRS & ENROLLMENT MANAGEMENT OFFICE OF THE DEAN OF STUDENTS DIVISION OF STUDENT AFFAIRS DIVISION OF ENROLLMENT MANAGEMENT DIVISION OF INTERNATIONAL EDUCATION DIVISION OF CAMPUS SAFETY OFFICE OF EQUITY PROGRAM & COMPLIANCE VP STUDENT AFFAIRS & ENROLLMENT MANAGEMENT UNIVERSITY ADVANCEMENT ADVANCEMENT COMPUTING PROGRAM DEVELOPMENT GOVERN & COMMUNITY RELATIONS PUBLIC AFFAIRS VP UNIVERSITY ADVANCEMENT ADMIN ADMINISTRATION & FINANCE AUDIT & ADVISORY SERVICES BUDGET & RISK MANAGEMENT BUSINESS OPERATIONS CAPITAL PLAN DESIGN & CONSTRUCTION FACILITIES & SERVICE ENTERPRISE FISCAL AFFAIRS / CONTROLLER HUMAN RESOURCES INFORMATION TECHNOLOGY PHYSICAL PLANNING & DEVELOPMENT VP ADMIN & FINANCE OFFICE OF THE PRESIDENT AUXILIARY AND SELF SUPPORT UNITS ATHLETICS P age
4 STUDENT HEALTH CENTER CHILDREN S CAMPUS UNIVERSITY PARKING SERVICES CAMPUS RECREATION AND MASHOUF WELLNESS CENTER COLLEGE OF EXTENDED LEARNING (CEL) UNIVERSITY PROPERTY MANAGEMENT ASSOCIATED STUDENTS FOUNDATION UNIVERSITY CORPORATION GRANTS AND CONTRACTS LOTTERY FUND CAPITAL PLAN AND FY17-18 CAPITAL BUDGET FUNDING THE CAPITAL PLAN, FY17-18 TO FY22-23 OVERVIEW CAPITAL PLAN FY17-18 TO FY22-23 PRESENTED BY FUNDING TYPE CAPITAL PLAN FY17-18 TO FY22-23 PRESENTED BY CABINET CAPITAL PLAN FY17-18 TO FY22-23 PRESENTED BY PROJECT CATEGORY CAPITAL PLAN FY17-18 TO FY22-23 BY PROJECT DETAIL THE CAPITAL BUDGET, FY IN PROGRESS CAPITAL CARRYFORWARD BUDGET FY17-18 NEWLY APPROVED CAPITAL BUDGET CAPITAL BUDGET IMPACT ON FY17-18 OPERATIONS PROJECT SHOWCASE APPENDIX APPENDIX A: GLOSSARY OF TERMS APPENDIX B: 2 YEARS UNIVERSITY STATEMENT OF ACTIVITIES APPENDIX C: CAPITAL PROCESS-SUPPLEMENTAL INFORMATION APPENDIX D: ORGANIZATIONAL CHARTS FEEDBACK REQUEST P age
5 FOREWORD Purpose/Use of this Document This presentation of the San Francisco State University budget is prepared primarily for the campus community in the spirit of transparency. It also may be used in support of grant applications, recruiting senior administrators, and providing information in response to inquiries from the media, auditors, professional associations, accreditation teams, NCAA eligibility and compliance teams. The last page provides information on how to contact the university budget administration and operation office with your comments regarding the usefulness of this document and any suggestions as to its enhancement. Scope of Information This report reflects the Fiscal Year (FY) university budget information as of July 1, Changes to the university s budget subsequent to this date will be reflected in the university FY17-18 revised budget and quarterly revenue and expenditure reports. The budget document provides details on the current fiscal year from an overall university perspective, as well as more in-depth information specific to each division or service groups. Budget Comparison and Analysis While comparisons of budget from one fiscal year to another are useful, it is important to note that organizational and/or operational changes may impact comparison of multi-year financial data. This report format provides some historical context for understanding variances of spending against the prior year plan and changes reflected in the current plan. Detailed information regarding the history of organizational specific shifts may be necessary to draw accurate and meaningful conclusions. One additional fact to consider is the state of California s changing economic conditions. Distribution of this Document This report will be accessible on the university budget operation and administration office web site. 4 P age
6 EXECUTIVE SUMMARY I am pleased to submit the San Francisco State University Fiscal Year Budget Plan for your approval. The Budget Plan is comprised of two parts. The first part is the Consolidated Budget for Operations Plan, which includes all of the anticipated state allocations, operating revenues and expenses for FY The second part is the Capital Plan and Budget, which is set in the framework of a multi-year Capital Plan. The following bullet points are intended to provide context for the decisions reflected in this memo, including anticipated Student Success Graduation Initiatives 2025 (SSGI) funding, current and forecasted California State University (CSU) allocations to SF State support for enrollment and associated tuition adjustments, and the projected outcomes of current contract negotiations. 1. As some of you all know, the FY17-18 general fund budget was allocated based on the FY16-17 actual general fund expenditures. This differs from prior incremental budgeting, which is typical across the CSU, in that it addressed the structural deficit we've been experiencing for the past few years, and also aligned our budget planning with our expected revenue. 2. SF State revenue has increased, but that's the case only for the tuition increase portion of our revenue. We did not receive additional general fund support for the enrollment increase from the CSU. Over the past several years, SF State has been spending at our Chancellor's Office established enrollment target, but we have missed the revenue targets by approximately $14M (for the last three fiscal years) as a result of the gaps in enrollment. 3. The gap between our spending (based on 24,099 full-time equivalents (FTEs)), and our revenue performance (less than 24,099 FTEs) has resulted in the cumulative deficit noted above. These deficits have been covered with carry-forwards (one-time funds), but as we become more precise about all funds budgeting to actuals, there will be less available to cover future deficits. 4. As we begin to plan for the future, the FY16-17 carry-forward funds were permitted to remain with the Cabinet areas, some as encumbrances against prior commitments and others for earmarks defined by each Cabinet area. These carry-forward funds are one-time dollars; they are neither available to fund permanent positions, nor to fund recurring expenses. In addition to the budget plan, there are carry-forward or trust funds, which may be languishing in various accounts and not being put to good use. Through the financial review period, we will analyze these types of funds in order to ascertain their balances, or best use, either for campus priorities or for the bridging of one-time expenses. 5 P age
7 5. In order to provide a complete picture, for the first time, we have included recommended funds (lottery, instructional-related activities, miscellaneous trust, and indirect costs) as part of the overall budget planning. Changes in campus fees and cost recovery have had a notable impact on our ability to sustain some programs or manage declining resources. 6. Given the large number of organizational changes planned toward the end of the summer, the Budget Administration and Operation office has made adjustments to relevant allocations, based on what they know about restructuring, group movements, additions, or reductions. Each adjustment has been extensively discussed, but there may still be necessary corrections. Please have your budget analyst work with the Executive Director of Budget Administration and Operation office and her team on updates. In addition to the above, we are continuing our priorities for SSGI and budget transparency. We will be carefully monitoring outcomes in these areas and making funding allotments in accordance with our collective decisions in these arenas: a. SSGI 2025, Priority 1 has been allocated in the amount of $2.1 M, primarily in Academic Affairs and Student Affairs & Enrollment Management. The money has been committed, and funds will be allocated upon hire or for expenditures. b. The Budget Academic Committee (BAC) in Academic Affairs is working diligently toward a marginal cost of instruction model that will help us clearly understand the instructional expenses by course type and establish future budgets by college enrollment. Simultaneously, Administration and Finance is benchmarking various positions across the entire campus, both against the CSU and national competitors, which will enable better staff planning at various enrollment levels. 7. While we do not anticipate dramatic personnel actions, here are a few points: a. We should begin planning for the campus to cover additional negotiated compensation increases, which may range from one to three percent of the relevant salary base. Two bargaining units have declined to extend the current expired contracts, which signal a hard line on salary holdouts, yet the CSU authorization for bargaining outcomes is estimated at approximately two percent. b. It is critically important to carefully assess and plan for any new positions during the budget process and throughout the year. From a campus perspective, the Chancellor's Office has not maintained adequate funding for our health, retirement, and other benefits costs, and only does so retroactively. This has placed a further burden on the 6 P age


 new building, Romberg Tiburon Center (RTC) seismic reinforcement ($2.")
8 campus with regard to expenses, and it has created an additional level of complexity to the campus financial planning process. 8. The Consolidated Operating Budget includes $542 million in revenue funds and a balanced expense side. FY17-18 is the first year where the university has taken on an all-funds budgeting approach. The general fund operating budget includes $364 million in general funds, $208 million of which flows to the academic colleges in accordance with a previously agreed-upon allocation. After other transfers and adjustments, $85 million remains in general funds, which is to be allocated to other Cabinets. The rest is held central for other campus mandatory costs. The general fund operating budget revenues are expected to grow by four percent over FY16-17 actual results, driven principally by the tuition increase. The remaining $178 million in revenue funds is comprised of self-support and auxiliary enterprises. 9. The Capital Budget calls for $64 million in expenditures in FY These expenditures are in support of a five-year Capital Plan that, if fully completed, would require $1.5 billion in total project funding. Principal expenditures next year will be directed to the Broadcast and Electronic Communication Arts (BECA) new building, Romberg Tiburon Center (RTC) seismic reinforcement ($2.6 million). We appreciate the opportunity to submit the FY17-18 Budget Report. We have taken great care in preparing this report for your consideration. I would like to provide a special thanks to my budget team and executive office staff who worked diligently to prepare the budget we present to you today. I look forward to the opportunity to discuss. Ann M. Sherman Vice President, Administration and Finance and CFO (Interim) 71 age
9 STRATEGIC PRIORITIES With the launch of the Student Success Graduation Initiatives 2025 (SSGI), the university s strategic priorities are clear. We seek to leverage our unique capabilities to address some of the most crucial problems. The response of the SF State community in supporting this effort has been positive. As we developed the budget, the role of SSGI was central to our planning in several aspects. First, we worked with the Provost and VP s to identify how their budget requests fit with the strategic goals. Second, as funds became available we allocated general funds on a one-time basis this year and permanent base for the following years. Third, we aimed to provide adequate support to University Advancement to continue addressing our key fundraising priorities. Throughout this document we will refer back to these planning initiatives and attempt to reflect our budget priorities within them. In addressing the campus master plan efforts, a new cabinet, University Enterprises has been developed to provide the necessary leadership in development, implementation, and funding opportunities of the five year, SF State capital plan. BUDGETARY PRIORITIES Budget priorities are aligned to support the university s strategic initiatives, as well as for a number of key objectives necessary to maintain the ongoing operation of the university. The most notable priorities reflected in the FY17-18 budget are: 2025 Student Success and Graduation Initiatives Student Success at SF State means holding our students to high expectations and offering them the support they need to reach them. As a campus with a social justice mission at our core, we maintain excellence and equity to be fundamental and interlinking values: we want to see our students graduate with degrees that represent learning experiences of the highest possible quality, inclusive of all of our students. Toward these ends, our campus plan is structured around six strategies: 1. Improved course availability and curriculum 2. Coordinated, intrusive and strategic advising 3. Broad accessibility and visibility of student success data 4. High-quality student experience in the first year of college for incoming freshmen 5. Effective, targeted support services to achieve educational equity (directed specifically at our first-generation, low-income and underrepresented students, with special attention to men of color); and 6. Short- and long-term planning for faculty hiring and development tied to curricular need and student success. Campus graduation initiatives 2025 goals: 1. Four-year Freshman graduation rate at 33% 2. Six -year Freshman graduation rate at 69% 8 P age
10 3. Pell Grant Closing freshman at 0% 4. Four-year transfer graduation rate goal at 86% 5. Two-year transfer graduation rate at 49% 6. Underrepresented minority (URM) gap closing Freshman at 0% State.edu/content/graduation-initiative-2025-goals Compensation, Recruitment, and Retention Perhaps the most critical issue in the budget process was maintaining our market position for faculty and staff. We faced strong competition in attracting and retaining new faculty and staff. In this highly competitive market place we allocated almost $5 million in incremental funds for newly negotiated general fund salary increase, retention, and related faculty and staff support costs. This is in addition to an equitable overall faculty and staff salary program and supplementary funds allocated to salaries in areas where we have fallen behind current campus equity averages. Infrastructure An annual priority in any budget process is ensuring that our physical and systems infrastructure continues to meet the needs of our vibrant institution. Almost $10.3 million in general funds this year are directed as follows; $2.3 million in deferred maintenance as an ongoing costs towards academic buildings, additional funds of $6 million was ear-marked for the BECA capital project, and $2 million for other campus capital projects. In addition, we received $2.1 million for RTC Seismic reinforcement and $2.1 million in infrastructure improvements that total $4.2 million in System wide Allocation Transfer (SWAT) funds. Financial Aid As announced in February 2017, SF State adopted a tuition fee increase, which, depending on the program was five and a half to six percent as well as the state university financial aid program (SUG). These enhancements will cover an additional $2.7 million in general funds allocation for SUG. 9 P age

11 10 P age SAN FRANCISCO STATE UNIVERSITY BUDGETING AND PLANNING PROCESS
12 Summary The budget is an important annual planning document for SF State. It reflects adoptions, priorities, and tactics set forth as the result of strategic planning efforts. As needs and opportunities change over time, SF State s budget process allows reasonable flexibility for Cabinet business managers to adapt and optimize their activities during the year, while still requiring university-wide financial planning and accountability. SF State takes a prudent approach to projecting revenues given current uncertainties due to the external environment. Base increases to the operating budget are funded only through the reallocation of funds from the existing base budget or by state allocation s base increases. Savings realized during the course of the fiscal year will result in one-time budget allocations to support qualitative improvements in academic programs and facilities consistent with the established priorities of the university. The budgeting strategy objective is to ensure a solid financial position for SF State; to prevent the extension of base operations beyond current revenue capacities; and to maximize the university's ability to respond to favorable variances throughout the course of the year. The university s budget process has permitted the administration, with significant assistance from the Cabinets, to identify priorities and allow SF State to make the most of existing strengths or improve weaknesses in line with the campus strategic priorities. The President and Cabinet Vice Presidents direct the resource allocation process, including the creation of the operating and capital budgets. The President reviews and approves the budget plan. The Budget Administration and Operation (BAO) office, in collaboration with Student Affairs Enrollment Management and Academic Resources advises on enrollment, revenue and expenditure assumptions, budget considerations, university-wide priorities relative to resource allocations, and institutional policies relating to finances. In order to enable the planning process, budget assumptions are developed and posted on webpage (see link to website below). During the last fiscal year, SF State worked to refine and improve the process for forecasting and budgeting. It also developed a multi-year plan, which in the first phase includes CSU 485- general fund sources and uses with a second phase, which will include all funds. The campus budget process begins in January of each year. Each unit develops or refines their budget for the upcoming fiscal year. Self-supports develop business plans that include an annual budget plan and projected plans for one to two future fiscal years. The focus is on the budget for the upcoming fiscal year, as this is the only budget that is approved by the Board of Trustees in June of each year. 11 P age
13 In May, the Chief Financial Officer gives colleges and major administrative units preliminary allocations as a starting point for building their budgets. The Vice Presidents have great latitude in reallocating funds within their areas of responsibility. In addition to unrestricted operating allocations, many units have other sources of revenue, such as campus fees, lottery, gifts, grants, and sponsored research. Budgeting at the Cabinet-Level Budgeting at the Cabinet level is a decentralized process with each unit responsible for building their own budget. Inputs to the process are the central administration's allocation letter, which includes the assumptions and initial allocation amount, as well as various other data collected at the cabinet level. The individual cabinet budgets are aggregated later by the university's Budget Administration and Operation Office (BAO) in order to produce the overall university budget that is taken to the President for approval. For the most part, the cabinet business managers are responsible for the unit's budget. The level of staff involvement varies across the cabinets; however, the deans and department heads provide significant input to the budget process. The University Wide cabinet budget process is managed centrally and includes the following line items: benefits, utilities, risk (this expense category includes the worker s compensation pool, property and auto insurance, industrial and non-industrial disability leave and Athletic Injury Medical Expense (AIME) insurance), financial aid, and any strategic financial initiatives that fall in the capital strategic planning, deferred maintenance program, and academic program development. The budget and planning process itself varies to some extent among the units: Associated Students, UCorp and Foundation funded by their own resources; making their budget-setting approach different from the budgeting process conferred above. The BAO office reviews the latest budget request reports for each unit and conducts a thorough analysis of all of the budget mechanisms. This analysis is assisted by supporting documents provided by the respective units. As necessary, the BAO staff work with the business managers of the units to resolve any matters. The operating budgets for each unit are reviewed in depth to ensure that the allocation amounts agree. The other elements of the budget are analyzed to determine if the unit appropriately applied the assumptions that were provided earlier in the process, and to explain any variances. As an overall check, the BAO office looks at the current year forecast and trends to determine the reasonableness of the budget for the upcoming fiscal year and the forecasts by analyzing any variance of over 10% versus the prior year s adopted budget and actual spending. The BAO office then prepares discussion points relative to each unit which function as the agenda for the financial review. In developing the discussion points, the results of all analyses 12 P age
14 are considered. If needed, an informal financial review may take place to address any remaining issues before finalizing the review. SF State s BAO office and the units make substantial effort to prepare the financial reviews. These reviews are critical to the successful development of the inclusive university consolidated operating budget. Capital Funding Process SF State s Annual Capital Plan includes new construction projects, renovations to existing buildings, deferred maintenance and repairs, real estate and equipment leasing, and strategic property purchases. The Capital Plan is detailed in the capital improvement process and includes projections for the next five years. The BAO office and the cabinets work with each of the colleges/departments to determine the college s budget and priorities for capital improvements and/or space expansion. This is done as part of the capital call cycle issued by Capital Planning each February. Each college/department presents a list of anticipated capital projects, the justification for each project, and the ways in which each project supports the college's and the university's strategic priorities. In between the financial review meeting periods, several of the central administrative offices (including Capital Planning, BAO, and Fiscal) are in frequent communication with each other about capital projects and capital planning, working with the Provost, CFO, the deans, and relevant department heads to develop information, cost estimates, and decision-making alternatives for these projects. All capital projects greater than $635K are presented to the President for final authorization. 13 P age

15 COLLABORATIVE INPUT INTO BUDGET PLANNING Acronym Definitions: AS: Associated Students BOT: Board of Trustees 14 P age

16 SF STATE UNIVERSITY BUDGET CALENDAR Blue - Governor s Budget timeline Red - Board of Trustee Budget timeline Purple - Campus Budget timeline 15 P age
17 CONSOLIDATED OPERATING BUDGET WHAT IS THE COLOR OF THE MONEY? SF State receives revenue from multiple sources for its $542 million budget (expense and revenue). Major fund sources include funds allocated by the university (operating fund, campus mandatory fees, grants and contracts, and lottery funds), revenue generated by self-support programs (Housing, Parking, Student Health, CEL and Campus Recreation) and auxiliary organizations funds. The university s budgets are limited to the current group of funds that are available and expected to be expended during the fiscal year. The budget reflects the estimated current funds (revenues and fund balances available for operations) and transfers to and from other groups of funds. It does not include transactions accounted for in the no-current fund groups (i.e., plant, endowment, and student loans). The university s financial statements are more comprehensive and include all assets, liabilities, revenues, and expenses of all fund groups and related entities (see Appendix B). GENERAL FUNDS (REOCCURRING) These are unrestricted funds that comprise the majority of the budget. For management purposes, these funds are further classified as either undesignated or designated. Undesignated General Funds: Student tuition and fees revenue, service assessments, state appropriations, and investment income. General funds are the primary source of support for instructional and all other major functions of the university. Designated General Funds: These funds are earned by the university and classified as unrestricted but directed to a particular college and departments for specific purposes. Designated general funds include such revenue as student fees (course and program fees). AUXILIARY ENTERPRISE FUNDS (REOCCURRING) Generated by self-support activities through charging fees to students and other external to the institution (Foundation, UCorp, ASI). These enterprises usually pay the university for central services through the cost allocation process (procurement, accounting, accounts payable, etc.). Auxiliary enterprises generate 20% of the university total revenues and include the following: housing, parking, student health, children s campus, athletics, student center, and CEL). Selfsupport auxiliary units pay all their expenses and receive no taxpayer or tuition support. 16 P age
18 RESTRICTED FUNDS (RECURRING) State University Grants account for the 9.4% of the university s revenue and come with externally established limitations and stipulations. Restricted funds generally include federal and state grants and contracts, endowment income, federal and state financial aid, and restricted gifts. FUND BALANCES (NON-REOCCURRING) The accumulation of excess revenue and expenses from prior years (one-time). Why is it important for financial health of the university? 1. Fiscally responsible management practice 2. Secure funds for multi-year commitments in advance 3. Manage financial risk A contingency fund is an important element in a sound budget. Unanticipated revenue or expense changes can happen during the fiscal year. Without a designated reserve, the university would have to impose mid-year budget corrections. That would place stress on the ability of the university and its units to maintain a consistent level of instruction and support to students, faculty, and staff. The FY17-18 general fund budget includes $15 million in contingency, or reserve, funds. This represents four percent of budgeted general fund expenditures. 17 P age
 18 P")
19 RECOMMENDED CURRENT FUNDS CONSOLIDATED FY17-18 REVENUE BUDGET (BY REVENUE ACCOUNT CATEGORY) 18 P age
20 SUMMARY BUDGET EXPENDITURE BY NATURAL CLASSIFICATION, FY17-18 Utilities 2% Financial Aid & Workstudy 9% Risk Pool 1% Operating Expenses 19% Salaries 43% Transfer 6% Benefits 20% 19 P age
21 EXPENDITURES BUDGET BY CABINET, FY17-18 in thousands Academic Affairs Admin & Finance Student Affairs Office of the President University Advancement University Enterprise University Wide Campus Auxiliaries University Percentage Salaries 150,734 37,882 24,760 2,776 5,482 1,058 5,279 6, , % Benefits 71,576 18,924 11,765 1,377 2, ,619 1, , % Operating Expenses 36,712 37,004 11,898 1, , ,435 96, % Deferred Maintenance - 2, , % Transfer 4,125 18,856 5,999 1, , % SSGI 2025 (1st Priority) ,092-2, % Utilities - 5, ,657-10, % Risk Pool ,633-4, % Financial Aid & Workstudy ,821-50, % All Funds 263, ,478 54,938 6,565 8,710 3,648 70,952 14, , % Note: s may be slightly affected by rounding. 20 P age
22 EXPENDITURES BY UNIT AND TYPE, FY17-18 in thousands Office of the President University Advancement University Enterprise Campus Auxiliaries University Percentage Academic Affairs Admin & Finance Student Affairs University Wide General Fund Salaries 133,868 26,045 15,087 2,194 5,482 1,046 5, , % Benefits 66,412 12,921 7,485 1,089 2, ,619 93, % Operating Expenses 7,950 8,372 1, , % SSGI 2025 (1st Priority) 2,092 2, % Utilities 4,657 4, % Risk Pool 4,633 4, % Financial Aid & Workstudy 50,821 50, % Operating Fund 208,230 47,337 23,787 3,516 8,710 1,686 70, , % CSU-463-Instructionally Related Activities 2,731 3,050 5, % CSU-465-Grant and Contracts 27,011 27, % CSU-485-Misc. Fee 1,051 10, , % CSU-491-Special Project 2,956 2,081 1,963 6, % CSU-496-Misc. Trust Fund % CSU-481-Lottery Fund 1, , % CSU-441- CEL Colleges % Campus Revenue Funds - 0.0% Continuing Education (CERF) 18,871 18, % Housing Funds 60,100 60, % Parking Funds 79 4,947 5, % Student Health Funds 11,154 11, % Campus Recreation Fund % Mashouf Well Center 11,735 11, % Children Campus 1,684 1, % Campus Auxiliaries - 0.0% Associated Students 9,137 9, % Foundation 1,539 1, % U-Corp 3,528 3, % All Funds 263, ,478 54,938 6,565 8,710 3,648 70,952 14, , % 21 P age
23 COMPENSATION This budget plan calls for approximately two percent to fund compensation increases, which consists of two parts: current contracts and a compensation pool increase for new contracts open in FY17 18 and non-represented employee groups. Salaries Actuals Actuals Actuals Budget in thousands FY FY FY FY YOY President Academic Salaries 82,587 88,343 98,222 98, Department Chair 3,761 3,766 4,021 4, Graduate Assistant Management and Supervisory 15,990 18,552 21,252 22, Support Staff Salaries 60,006 60,089 61,390 67, Overtime Temporary Help Student Assistant 2,017 2,510 2,838 1, Teaching Associates 1,765 1,819 1, Salaries 167, , , ,303 2% Note: Salaries amounts includes all 485 funds (e.g. THxxx $5.7mil for FY 17-18). BENEFITS Mandatory costs are expenditures the university must pay regardless of the level of funding allocated by the state, and they often increase independent of the state budget condition. These costs include increases for employee health, dental, and retirement benefits. Additionally, funding is included in FY17 18 to address increasingly greater compensation costs due to changes in federal overtime rules and state minimum wage laws. Without funding for these types of mandatory cost increases, campuses must redirect resources from other program areas to meet these obligations. In order to preserve the integrity of programs, the FY17 18 plan provides for the following increases in mandatory cost obligations. Actuals Actuals Actuals Budget Benefits FY FY FY FY YOY in thousands OASDI 9,011 9,263 9,867 13,472 27% Dental Insurance 2,520 2,500 2,578 2,630 2% Health and Welfare 27,720 29,405 30,484 31,353 3% Retirement 36,853 39,153 44,766 46,026 3% Industrial Disability % Non-Industrial Disability % Life Insurance % Medicare 2,392 2,478 2,664 2,753 3% Vision Care % Long-Term Disability Insurance % Flex Cash % Benefits-Other % Benefits 79,314 83,637 91,199 97,120 6% Note: Benefits amounts includes all 485 funds (e.g. THxxx $3 Mil for FY 17-18). 22 P age
24 UTILITIES Based on an analysis of previous utility expenditures and a conservative projection of future costs, the FY17-18 utility budget remains at the same level. The table shows actual and budgeted utility expenditures for FY15 through FY18. Favorable global energy prices coupled with performance savings and sustainability initiatives at SF State have helped limit utility expenses. Utilities Actuals Actuals Actuals Budget in thousands FY FY FY FY YOY Electricity 4,537 3,706 3,903 3, Gas 749 1,392 1,938 1, Water 1,893 1,399 1,227 1, Sewage 636 1,011 1,293 1, Hazardous Waste Other Utilities 910 1,080 1,377 2, Supplies and Services Utilities 9,110 8,956 10,026 10,684 6% Note: Utilities amounts includes all funds. FINANCIAL AID The costs for need-based financial aid, athletic aid, and graduate student aid will increase by approximately 8% in FY17-18 from the prior year. This increase allows SF State to maintain its need-based aid program for undergraduates, particularly for those families with incomes below $125,000. State University Grant Actuals Actuals Actuals Budget in thousands FY FY FY FY YOY State E.O.P. Grant Program 1,491 1,465 1,374 1, State University Grant 43,147 43,813 44,212 47,906 State University Grant 44,638 45,278 45,586 49,360 8% Note: s may be slightly affected by rounding. OTHER OPERATING EXPENSES This substantial expense item is the amalgam of graduate stipends, operations and maintenance, capital equipment, materials and supplies, travel, library materials, subcontracts and professional services. 23 P age

25 ACTUAL EXPENSES BY UNITS, RECOMMENDED FUNDS, FY14-15 to FY P age
 Account Payable position (3) one time")
 Campus Union and Wellness")
26 Note: (1) one time expense from fund balance for consultant (2) Account Payable position (3) one time expense wireless projects (4) including legacy capital projects (5) Campus Union and Wellness Center 25 P age
27 in thousands Office of the President Salaries Benefits Operating Expenses 1,226 1,040 1, TF-Instructionally Related Activities Trust 2,253 1,866 2,097 Salaries 2,266 2,027 2,368 Benefits 1,070 1,011 1,162 Operating Expenses Work Study TF-CSU Operating Fund (1) 3,858 3,241 3,972 Salaries 8 Operating Expenses TF-Special Projects Fund-Special Projects Salaries Benefits Operating Expenses TF-Miscellaneous Trust (2) Office of the President 6,487 5,410 6,288 Note: (1) including Athletic all fiscal year (2) Athletic trust funds 26 P age
28 in thousands Student Affairs & Enroll Mgmnt Operating Expenses TF-Extended Education Operations Salaries Benefits Operating Expenses TF-Instructionally Related Activities Trust Operating Expenses 2 (2) TF-Contracts and Grant Trust 2 (2) Salaries Benefits Operating Expenses TF-Parking Revenue Fund-Fines and Forfeitures Tota 788 1, Salaries Benefits Bond Payment Operating Expenses TF-Parking Revenue Fund-Parking Fees 1,494 1,525 1,361 Salaries Benefits Operating Expenses TF-Lottery Education Fund Salaries 18,905 19,403 20,387 Benefits 9,319 9,599 10,527 Operating Expenses 2,091 2,687 3,369 Work Study TF-CSU Operating Fund (2) 30,547 31,872 34,434 Operating Expenses TF-Special Projects Fund-Special Projects Salaries 1,417 1,444 1,187 Benefits Operating Expenses 2,360 1,738 1, TF-Miscellaneous Trust (1) 4,355 3,842 3,037 Salaries Benefits Operating Expenses TF-Campus Union-Operations and Revenue Student Affairs & Enroll Mgmnt 38,111 39,404 40,838 Note: (1) Children Campus (2) Includes Student Health 27 P age
29 in thousands University Advancement Salaries 4,505 4,821 5,068 Benefits 1,966 2,264 2,468 Operating Expenses 1,685 2,231 1,563 Work Study TF-CSU Operating Fund 8,178 9,344 9,119 Operating Expenses TF-Special Projects Fund-Special Projects 1 Operating Expenses TF-Miscellaneous Trust University Advancement 8,221 9,379 9,173 in thousands University Enterprise Salaries 1,346 1,229 1,060 Benefits Operating Expenses Work Study TF-CSU Operating Fund 2,667 1,934 1,713 Operating Expenses TF-Special Projects Fund-Special Projects 3 Salaries 1,172 1,268 1,356 Benefits Operating Expenses TF-Miscellaneous Trust (1) 1,855 2,213 2,122 University Enterprise 4,522 4,147 3,838 Note: (1) TT Auxiliary U-Corp payroll 28 P age
30 in thousands University Wide Operating Expenses TF-Extended Education Operations (1) 14 1 Operating Expenses TF-Lottery Education Fund (2) 555 Salaries (3) Benefits Operating Expenses 18,005 12,440 13,064 Financial Aid 45,039 45,576 45, TF-CSU Operating Fund 63,819 58,785 59,692 Salaries Benefits Operating Expenses (157) 1, TF-Special Projects Fund-Special Projects (4) (157) 1, Operating Expenses TF-Miscellaneous Trust University Wide 63,663 60,910 60,375 University Wide Note: (1) one time expenses: DTC Restroom (2) one time expense: Campus Wise Project (3) Campus Solution Project (4) Captial Projects 29 P age
31 FUND BALANCE In response to the ICSUAM budget policy on campus reserve management and reporting, SF State is working hard to manage fund balances with greater transparency. The university general fund balance declined 6% from 2016 to Much of the general fund balance is already fully committed to various university programs. Most of the dollars are designated for commitments that have been made but are not yet paid, such as program development, open commitments, and plant (facilities maintenance and repairs). Approximatively 4% of our general fund is not designated for specific purposes. This equates to less than a month of payroll expenditures ($20 to $22 million/month) for the total campus. Holding a small share of fund balance in reserve is necessary for the operation of the university. The funds are used as a safeguard against revenue fluctuations caused by enrollment changes or state budget cuts, and to cover sudden cost increases for obligations like utilities, risk pool, and benefits. General Fund Fund Balance FY15-16 and FY16-17 i n thousands 55,000 54,000 Approx 6% Decrease in Fund Balance 53,000 52,000 51,000 50,000 49, Note: CSU-485 fund balance including operating fund, Student Health, 485-Misc course fee, and Escheat 30 P age
32 DETAILED STATEMENT OF UNIVERSITY GENERAL FUND REVENUE BUDGET GENERAL FUND ADDITIONS, FY17-18 Budgeted FTES 2016/17 Budget 2017/18 Budget Adjustment Percent Change CSU Resident FTES Allocation 24,099 24,099-0% SFSU Resident FTES Budget 23,617 23,135 (482) -2% Adjustment (482) (964) Percent Change -2% -4% General Fund Operating Budget in thousands General Fund Appropriations 154, ,299 11,487 7% Revenues 196, ,919 1,021 1% $351,710 $364,218 $12,508 4% DETAIL OF BUDGET ADJUSTMENTS, FY16-17 AND FY17-18 in thousands CSU Budget Adjustments Compensation Adjustments 9,465 Gross Revenue from Fall 2017 In-State Tuition Rate Increase (7,843) Graduation Initiative ,307 Mandatory Costs (b) 207 Retirement Adjustment 2,605 Student Aid 2,746 11,487 Campus Budget Adjustments Tuition Fee Adjustment 3,126 Non-Resident Tuition Adjustment (769) Other Revenues (Adjustment Over Prior Year) (1,336) 1,021 $ 12,508 Footnotes: (a) See next page for a breakdown of Revenues (b) Permanent adjustment for health and dental benefits Campus Budget Adjustment represent the differences between campus calculated fee revenues versus fee revenues calculated by the Chancellor's Office 31 P age
33 FY17-18 GENERAL FUND SOURCES In thousands State Appropriation 166,299 46% State University Tuition Fee Tuition Fee 162,909 45% Non-Residence Tuition Fee Non-Resident Fees 16,769 Campus Adjustment to Non-Res. Fee (769) 16,000 4% Other Student Fees Application Fee 1,864 MBA Fee 1,000 Category 4 Fees 237 3,101 1% Other Funds Interest Revenues 900 Campus Work Study Program 1,700 Cost Recovery from Other Funds 7,276 Est. Retirement 2,305 Balance Budget 3,729 15,909 5% Operating Fund Resources 364, % 32 P age
34 GENERAL FUND ADDITIONS SOURCES AND USES FY17-18 In thousands Additional Sources of Funds Base One-Time General Fund Appropriation 11,487 3,406 14,893 Tuition and Fees 3,126 3,126 Non-Resident Tuition and Fees (769) (769) Other Revenues (Adjustment Over Prior Year) (1,336) (1,336) AA Funds Carried Forward 10,728 10,728 A&F Funds Carried Forward 5,521 5,521 SAEM Funds Carried Forward 1,518 1,518 OP Funds Carried Forward 1,089 1,089 UA Funds Carried Forward WU Funds Carried Forward 22,303 22,303 Sources 12, , ,532.7 Uses of Additional Sources Mandatory Costs/Existing Commitments Compensation Increase (Salaries) 5,279-5,279 Retirement Adjustment 2,390-2,390 SUG Adjustment 2,746-2,746 Academic Preparation Data-Driven Decision Making Year 1 of 2: Course Redesign Reserve for Economic Uncertainty - 15,000 15,000 Infrastructure Improvement - 2,148 2,148 10,415 17,558 27,973 (Continuation) 33 P age
35 In thousands Approved Division Requests and Priorities Academic Affairs Graduation Initiative , ,943 Research, Scholarly & Creative Activity Campus Solution Position Designated for Encumbrance - 1,006 1,006 Designated for Outstanding Commitments - 9,722 9,722 1,373 11,576 12,948 Administration and Finance Campus Solution Position Organizational Change (SAEM) Organizational Change (UE) (1,167) - (1,167) Designated for Encumbrance - 1,628 1,628 Designated for Outstanding Commitments - 3,893 3,893 (284) 5,521 5,237 SAEM Graduation Initiative Campus Solution Position Organizational Change (A&F) (717) - (717) Designated for Encumbrance Designated for Outstanding Commitments - 1,300 1,300 (19) 1,518 1,500 Office of the President Organizational Change (Athletics) 1,112-1,112 Designated for Encumbrance Designated for Outstanding Commitments ,112 1,089 2,200 (Continuation) 34 P age
36 In thousands University Advancement Organizational Change (Athletics to OP) (1,112) - (1,112) Designated for Encumbrance Designated for Outstanding Commitments (1,112) 461 (651) University Enterprise Organizational Change (A&F) 1,167-1,167 University Wide Campus Solution Position (556) - (556) Graduation Initiative 2025 Transfer to capital Projects - 1,221 1,221 Designated for Campus Health & Safety Release U-W CF to BL ,729 3,729 Designated for Encumbrance - 1,552 1,552 (556) 7,303 6,746 Uses 12,508 45,025 57, P age
37 OPERATING FUNDS SUMMARY FY14-15 to FY17-18 San Francisco State University SFCMP Operating Funds: Budget Summary by Dept ID,FY Actual Actual Original Budget Actual Original Budget Changes from 2016/17 Actuals in thousands FY FY FY FY FY Amount Percent a b c d e e-d (e-d)/d General Fund Allocation $ 137,139 $ 145,703 $ 154,812 $ 157,402 $ 166,299 $ 8,897 6% Spring-Revenue 81,908 79,854 81,123 78,242 73,783 (4,459) Summer-Revenue ,894 10,361 12,839 11,632 (1,207) Fall-Revenue 85,457 87,219 85,068 83,587 77,494 (6,093) Other-Revenue (848) No Program-Revenue 4, , ,001 19,389 Revenue 173, , , , ,910 6,782 4% Budget Adjustments. * - - 6,138-6,034 6,034 Federal Reimbursements Work Study. 1,375 1,415 1,700 1,340 1, Reimbursed Release Time. - 1,873 2,400 1,905 2, Cel Cost Reimbursement To General Fund. 1,178 1, , (148) Cost Allocation. 1,906 2,668 4, ,937 3,731 Other Revenue 4,459 6,980 15,921 4,537 15,009 10, % Revenues / Other Sources. $ 315,070 $ 332,395 $ 351,443 $ 338,066 $ 364,218 $ 26,152 8% Salary & Wages. 162, , , , ,302 8,928 5% Benefits. 76,188 80,427 89,235 86,271 93,765 7,494 9% Operating Expenses. 28,421 19,013 17,478 21,850 19,189 (2,661) -12% Utilities. 4,005 4,208 4,529 4,382 4, % Risk Pool. 3,860 4,053 4,533 4,028 4, % Work Study. 1,742 1,457 1,461 1,417 1, % Financial Aid. 45,039 45,576 46,614 45,818 49,360 3,542 8% Carry-Forward: Other Expenses (60) (60) - All Expenses. $ 321,765 $ 324,235 $ 351,443 $ 346,140 $ 364,218 $ 18,078 5% Net Transfers. 3,107 (12,192) 3,624 3,742 - (3,742) Operating Income (Loss). (3,588) (4,031) - (4,332) - 4,332 Ending Fund Balance $ 49,982 $ 45,951 $ - $ 41,619 $ - Operating Funds include: NG001, NG025, NG100, NR101, SE001, SUXXX Net Transfers is "Transfers in" minus "Transfers out". In other words, if Net Transfers is a negative number there is more transfering out than in. * Budget Adjustments - $4 million in carry forward deficit and other CSU transfers 36 P age
38 GENERAL FUND BUDGET SUMMARY The CSU General Fund remains the primary source of support for the university general fund, which includes state funding and student fees collected locally by SF State (e.g., tuition fees, non-resident fees, and application fees). Excluding one-time funds, the university general fund budget totals $364 million, compared to $351 million last year. This 4% increase is mostly due to the tuition increase, which includes compensation adjustments changes, financial aid (SUG) adjustments, and graduation initiatives funding. On a per student basis, state allocation funding increased from $6,420/FTES to $6,900/FTES (reported to the chancellor s office target 24,099FTES). Even though the university s instructional, research, and engagement activities are supported with a mix of undesignated and designated funds, most financial decisions are based on the availability of undesignated general funds. BOARD OF TRUSTEES HIGHLIGHTS AND SPECIFICS FOR FY17-18 GENERAL FUND BUDGET The increase in funding from the State has enabled the CSU and SF State to invest funds towards expanding access to higher education, improving time to degree for our students, as well as compensation increases for our faculty and staff, and addressing critical infrastructure needs. The total funding appropriated by the CSU for the current fiscal year reflects an approximate $314 million increase. The CSU support budget includes a tuition fee increase commensurate with enrollment growth of approximately $26 million. With the additional funding, the CSU has prioritized a $141 million faculty and staff compensation increase, 0.6% enrollment growth (5,200 FTES), student success and completion initiative $75 million, and deferred maintenance funding (related to the new capital financing framework). 37 P age
39 Below is a summary of the CSU s Trustee s approved support base budget and SF State ongoing allocation. SFSU in thousands CSU General Fund State Tuition Rate Increase Increase Enrollment Growth FTES 2, Enrollment Growth Funding 26, Student Success Graduation Initiative ,000-4, /18 State University Grant Increase 39,561-2,746 Employee Compensation (Current Contracts) 141,098 9,465 - Health and Dental 3, Operations & Maintenance of New Facilities Other Mandatory Costs, Lease Rev. Bonds, Transportation Research 27, Subtotal 2017/18 Base Allocations $314,009 $9,672 $7,053 Prior Year Retirement Adjustment (2016/17) 36,833 2, /18 Base Allocations & 2016/17 Base Adjustments $350,842 $12,277 $7,053 Note: Assumes SF State campus enrollment meets the Chancellor s Office approved target (24,099 FTES) The CSU received an additional $72 million in one-time funding in FY17-18 in support of various uses, of which SF State will receive funding towards SSGI and infrastructure improvements. The supplemental one-time funding is broken down as follows: In thousands One-Time Graduation Initiative 2025 Allocation CSU SFSU Academic Preparation 3, Data-Driven Decision Making 2, Year 1 of 2: Course Redesign 1, Student Success Graduation Initiative , Research, Scholarly & Creative Activity 2, Infrastructure Improvement 50,000 2,148 $72,480 $3, P age
40 BENCHMARK OF CSU CAMPUS GENERAL FUND EXPENDITURES FY15-16 in thousands San Francisco San Jose Fullerton Long Beach Northridge San Diego Expense Categories (a) 1 - Instruction 156,407 45% 157,333 44% 184,637 43% 185,147 44% 177,651 43% 169,211 41% 2 - Research 96 0% 222 0% 400 0% 624 0% 3,498 1% 1,423 0% 3 - Public Service 487 0% 1,228 0% 603 0% 692 0% 1,196 0% 1,300 0% 4 - Academic Support 30,262 9% 32,294 9% 29,598 7% 40,830 10% 38,760 9% 47,460 12% 5 - Student Services 26,722 8% 50,333 14% 38,697 9% 46,372 11% 57,107 14% 51,323 12% 6 - Institutional Support 38,442 11% 28,071 8% 61,853 15% 39,240 9% 41,908 10% 39,183 10% 7 - Operations & Maintenance 48,558 14% 46,459 13% 55,751 13% 48,385 12% 36,656 9% 61,839 15% 8 - Student Financial Aid 45,576 13% 38,156 11% 53,173 13% 57,557 14% 59,904 14% 39,635 10% Operating Expenses 346, % 354, % 424, % 418, % 416, % 411, % 2015/16 College Year FTES (b) 23,581 22,701 29,249 28,714 29,903 27,069 $ Expended per FTES Source: "Actuals Summaries" for the CSU Operating Fund can be found on the CSU Budget Office website Auxiliaries, Housing, Parking and Federal funds for student aid are not included. Notes: (a) Campuses representative of the "Big 5" comparable CSU institutions (b) Standard reporting categories used by all universities to report financial data. Source: 3. Rounded to nearest FTES. 39 P age
41 ORGANIZATIONAL CHANGES Starting August 1, 2017, the Athletics Division reports to the Office of the President. Division of Equity & Community Inclusion is a new division within the University s administration to promote equity and inclusion, advance social justice, improve the campus climate for all students and facilitate intercultural and intergroup dialogue. The Division of Equity & Community Inclusion will work with student clubs and organizations and other campus partners to close the educational equity gap in support of the Graduation Initiative 2025, which seeks to raise retention and graduation rates, strengthen student learning and improve the student experience at all levels. University Enterprises, a new cabinet, has been initiated and will oversee the capital planning and construction of the campus master plan, new buildings and renovation. The consolidation of Information Technology Services (ITS) is underway since its first phase has been accomplished, integration of SAEM IT into the main campus ITS frame. 40 P age
42 STUDENT FEES Fiscal Year 2016/ /18 Increase from PY Tuition Fee 6.0 or less Units - PT $ 3,174 $ 3, % Undergraduate Tuition Fee 6.1 or more Units - FT $ 5,472 $ 5, % 6.0 or less Units - PT $ 3,684 $ 3, % Credential Program Tuition Fee 6.1 or more Units - FT $ 6,348 $ 6, % Graduate including Post-Baccalaureate, 2nd Degree and Master's Programs Tuition Fee 6.0 or less Units - PT $ 3,906 $ 4, % 6.1 or more Units - FT $ 6,738 $ 7, % Education Doctorate Tuition Fee 1 or more units $ 11,118 $ 11, % Non-Resident Tuition Per Unit $ 372 $ % Mandatory Fees Student Body Center $ 164 $ Recreation & Wellness Center $ 180 $ % Student Body Association $ 108 $ Student Health Service $ 314 $ IRA-General $ 100 $ IRA-Athletics $ 136 $ Health Facilities $ 6 $ 6 - Campus Service Card $ 4 $ 4 - Gator Pass $ - $ % SIRF $ - $ 4 100% Campus Fees $ 1,012 $ 1,516 Mandatory Student Fees are defined as those fees required from an individual in order to attend SF State. Mandatory fees can be system-wide or campus specific. Category I: System-wide mandatory tuition and other fees that must be paid to apply to, enroll in, or attend the university, or to pay the full cost of instruction required of some students by statute. In March 2017, after four years of tuition freeze, the board of trustees approved an average 5.7% adjustment. Increases vary depending on student level, degree or certificate program ( Category II: Campus mandatory fees that must be paid to enroll in or attend the university. Voluntary Student Representation. In after an extensive consultation process throughout the CSU, a new voluntary fee for the California State Student Association (CSSA) known as the Student Involvement and Representation Fee (SIRF) was implemented. This fee is assessed at a rate of $2 in the fall and spring terms and students may voluntarily opt-out. The full text of E.O may be found on-line ( To estimate the total cost to attend SF State you can find this on line at: Avg 5.7% 27.8% 41 P age
43 SF STATE ENROLLMENT PLAN Student Enrollment drives the majority of the CSU s budget allocations from the State of California, whether for academic activities or capital and technology initiatives. The CSU s Enrollment Plan Cycle begins in the fall for the following fiscal year. A system-wide enrollment level is indicated each year in the Board of Trustees Support budget request. Enrollment targets for each campus are jointly determined by the Chancellor and campus presidents. These targets form the primary driver used to distribute new resources. California (CA) Resident Enrollment (State-support) CA Resident student enrollment has fluctuated over the years as the state budget has experienced periods of health and bust. Between and , CA resident enrollment exceeded the CSU target. As a result, SF State declared a campus-wide impaction for first-time freshmen and new undergraduate transfers in Fall In an effort to address enrollment, the summer program was moved from the self-support summer to the state side, started in With this change, the campus anticipated the enrollment to exceed the SF State budget basis by 2% and meet the CSU target. As shown in the table and chart below, SF State s enrollment allocation (CSU target) had remained the same at 24,099 FTES for the last two years. In , the enrollment declined about 1.5% and came in at 3.6% below the CSU target. With the strong growth in the Fall 2017 for both first-time freshmen and new undergraduate transfers, the campus projected to improve the CA resident enrollment more than 4.0% (or approximately 960 FTES) and anticipated to exceed (or 0.4% above) the CSU target. 24,500 24,000 23,500 23,074 23,351 23,836 23,572 24,099 23,570 24,099 23,000 22,500 22,000 21,500 22,731 22,140 23,580 23,237 24,197 21, / / / / /18* Actuals CSU Target SFSU Budget SFSU Resident Enrollment (FTES) 2013/ / / / /18* CSU Target 23,074 23,351 23,836 24,099 24,099 SFSU Budget 23,074 23,351 23,572 23,570 23,135 Actuals 22,731 22,140 23,580 23,237 24,197 *FY17/18 is a projected actuals 42 P age
44 Non California Resident Enrollment (Self-Supported) While the CSU Support Budget includes projections for both resident and non-resident FTES, the State only funds CA resident FTES. Non-resident FTES is considered a self-supported funding through Tuition Fee and Non-resident Fee revenues. CSU campuses have the authority to set their own internal targets within a reasonable range. As illustrated in the table and chart below, the campus has experienced significant decline in non-resident enrollment for the last two years. In , the non-resident enrollment declined about 8.1% and came in at 0.2% below an internal SF State s target. The further decline was anticipated in It is projected that the non-resident enrollment will be about 18% lower than the previous year or 11% below an internal target. An improvement in non-resident enrollment is the campus s high priority for the upcoming years. The strategic efforts to support the new student recruitment and outreach are critical to redirect the enrollment and improve the quality of our students. 2,000 1,800 1,600 1,400 1,200 1, ,806 1,601 1,663 1,546 1,535 1,298 1,313 1,471 1,325 1, / / / / /18* Actual for Non-Residents, Domestic Actual for Non-Residents, International CSU Target SFSU Non-Resident Enrollment (FTES) 2013/ / / / /18* Internal Target 1,546 1,535 1,601 1,663 1,806 Actuals 1,601 1,663 1,807 1,660 1,479 *FY17/18 is a projected actuals 43 P age
45 SF State Overall Enrollment Summary SF State enrollment (both CA resident and non-resident enrollment) had fluctuated for the last five years. As shown in the table and chart below, the campus experienced significant enrollment decline of about 3.4% in or 1.9% below the overall target (CSU and internal targets). With the strong CA resident enrollment, it is projected that the campus s total enrollment for will improve more than 3% or approximately 0.9% below the overall target. 26,500 26,000 25,500 25,000 24,620 24,886 25,437 25,762 25,905 24,500 24,000 23,500 23,000 24,332 23,803 25,387 24,897 25,676 22, / / / / /18* Actuals CSU & Internal Targets SFSU Overall Enrollment (FTES) 2013/ / / / /18* CSU & Internal Targets 24,620 24,886 25,437 25,762 25,905 Actuals 24,332 23,803 25,387 24,897 25,676 *FY17/18 is a projected actuals Source: Office of Institutional Research 44 P age
46 FY EXPENDITURE BUDGET BY CABINET General Fund Budget Report by Cabinet/Division Assumptions: General Fund includes NG001 and NR101 Actual full-time employee (FTE) is computed as an average appointment for the position for FY 16/17. FY 17/18 Budget is the Cabinet s position planning Academic Salaries includes: Professor, Associate Professor, Assistant Professor, Other Faculty. 45 P age
47 ACADEMIC AFFAIRS General Fund Budget Academic Affairs(Cabinet) 2,000 1,800 1,600 1,400 1,789 1,331 FTE Academic Affairs(Cabinet) 160, , ,000 $141,781 $141,700 Amount 1, ,000 1, ,000 60,000 40, ,000-0 Actuals 2016/17 Budget 2017/18 Actuals 2016/17 Budget 2017/18 Actuals 2016/17 Budget 2017/18 Change from 2016/17 FTE Change from 2016/17 Actuals Academic Affairs (Cabinet) FTE Amount FTE Amount Amount % Amount % in thousands a b c d c-a (c-a)/a d-b (d-b)/b Salaries Academic Salaries , , % 1,961 3% Part Time Faculty , ,605 (404) -95% (5,217) -21% Teaching Associates 50 1, (50) -100% (1,468) -79% Summer Session Fac 1 3,361 4,149 (1) -100% % Graduate Assistant (25) -100% (322) -47% Instructional Faculty 1,216 $ 99, $ 94,747 (427) -35% (4,258) -4% Department Chair 31 4, , % 27 1% Management and Supervisory 49 6, , % 253 4% Support Staff , ,090 (33) -7% 527 2% Salaries 1,789 $ 137,201 1,331 $ 133,750 (457) -26% (3,451) -3% Operating Expenses 4,580 7, ,370 74% Academic Affairs(Cabinet) 1,789 $ 141,781 1,331 $ 141,700 (457) -26% (81) 0% Notes: FY17/18 Budget counts for Vacant FTE without Budget: Academic Salaries = 1, Counts for Vacant FTE with Budget: Support Staff = 12, FTE variance also due to appointment changes Academic Affairs Summary By CSU Fund, 3 Years of Actuals FY14-15 FY16-17: Refer to page P age
48 FY EXPENDITURE BUDGET BY UNIVERSITY DIVISION (COLLEGE) COLLEGE OF LIBERAL CREATIVE ARTS Mission The liberal and creative arts provide students with a foundation of confidence, critical thinking and engagement toward a greater good. Our university community is among the nation s most diverse not only in demographics and global cultures, but also in our embrace of ideas, discourse, creativity and ingenuity. We are here to help you find and fulfill your passions throughout your SF State journey. Our faculty are invested in your success and will work closely with you in the most difficult times. The College of Liberal & Creative Arts Advising and Resource Center provides tutoring and training, study spaces, a computer lab and even office supplies. Our alumni will share their insights and successes and help you chart your own career paths. Source: SF State website Strategic Initiatives: Planning (with Development and Administration and Finance) for the new LCA building Increasing and improving advising services Aligning budget with curriculum planning Source: LCA 47 P age
49 General Fund Budget Col of Liberal and Creative Arts FTE Col of Liberal and Creative Arts Amount ,000 40,000 35,000 30,000 25,000 20,000 $41,414 $39, , ,000 5, Actuals 2016/17 Budget 2017/18 Actuals 2016/17 Budget 2017/18 Actuals 2016/17 Budget 2017/18 Change from 2016/17 FTE Change from 2016/17 Actuals Col of Liberal and Creative Arts FTE Amount FTE Amount Amount % Amount % in thousands a b c d c-a (c-a)/a d-b (d-b)/b Salaries Academic Salaries , , % 1,320 6% Part Time Faculty 155 8,978 5,622 (155) -100% (3,356) -37% Teaching Associates (20) -100% (276) -41% Summer Session Fac (0) -100% 78 11% Graduate Assistant (14) -100% (9) -2% Instructional Faculty 439 $ 33, $ 31,700 (170) -39% (2,242) -7% Department Chair 9 1, , % 21 2% Management and Supervisory % (8) -1% Support Staff 94 5, , % 343 6% Salaries 547 $ 41, $ 39,145 (169) -31% (1,887) -5% Operating Expenses (63) -17% Col of Liberal and Creative Arts 547 $ 41, $ 39,464 (169) -31% (1,950) -5% Note: Counts for Vacant FTE without Budget: Academic Salaries = 1. FTE variance also due to appointment changes 48 P age
50 Division Summary By CSU Fund, 3 Years of Actuals FY14-15 to FY16-17 In thousands LIBERAL&CREATIVE ART - Col of Liberal and Creative Ar Salaries Benefits Operating Expenses TF-Extended Education Operations Salaries Benefits Operating Expenses TF-Instructionally Related Activities Trust Operating Expenses TF-Lottery Education Fund Salaries 37,497 38,721 41,045 Benefits 17,005 17,563 19,001 Operating Expenses Work Study TF-CSU Operating Fund 55,291 56,958 60,814 Salaries Benefits Operating Expenses TF-Special Projects Fund-Special Projects Salaries Benefits Operating Expenses TF-Miscellaneous Trust LIBERAL&CREATIVE ART - Col of Liberal and Creative Ar 57,603 58,816 62, P age
51 COLLEGE OF ETHNIC STUDIES Mission The College of Ethnic Studies provides safe academic spaces for all to learn the histories, cultures, and intellectual traditions of Native peoples and communities of color in the U.S. in the first-person and also practice theories of resistance and liberation to eliminate racism and other forms of oppression. Source: SF State website Strategic Initiatives: Creating a new Race & Resistance Studies major Creating three new minors Piloting a college-wide faculty civic engagement fellow with the Institute for Civic and Community Engagement Source: College of Ethnic Studies 50 P age
52 General Fund Budget College of Ethnic Studies FTE College of Ethnic Studies Amount ,000 6,000 $6,318 $6, ,000 4,000 3,000 2, , Actuals 2016/17 Budget 2017/18 Actuals 2016/17 Budget 2017/18 Actuals 2016/17 Budget 2017/18 Change from 2016/17 FTE Change from 2016/17 Actuals College of Ethnic Studies FTE Amount FTE Amount Amount % Amount % in thousands a b c d c-a (c-a)/a d-b (d-b)/b Salaries Academic Salaries 37 3, , % (4) 0% Part Time Faculty 23 1, ,228 (3) -13% (166) -12% Summer Session Fac (0) -100% 73 40% Instructional Faculty 60 $ 5, $ 5,073 (2) -3% (96) -2% Department Chair (0) 0% (1) -1% Management and Supervisory % - 0% Support Staff (0) -1% (10) -2% Salaries 73 $ 6, $ 6,147 (2) -3% (108) -2% Operating Expenses % College of Ethnic Studies 73 $ 6, $ 6,210 (2) -3% (108) -2% Note: FTE variance due to appointment changes 51 P age
53 Division Summary By CSU Fund, 3 Years of Actuals FY14-15 to FY16-17 In thousands ETHNIC STUDIES - College of Ethnic Studies Salaries Benefits Operating Expenses TF-Extended Education Operations Salaries Benefits Operating Expenses TF-Instructionally Related Activities Trust Operating Expenses TF-Lottery Education Fund Salaries 4,996 5,267 6,260 Benefits 2,163 2,281 2,670 Operating Expenses Work Study TF-CSU Operating Fund 7,234 7,637 9,055 Salaries Operating Expenses TF-Special Projects Fund-Special Projects Operating Expenses TF-Miscellaneous Trust ETHNIC STUDIES - College of Ethnic Studies 7,378 7,714 9, P age
54 COLLEGE OF HEALTH & SOCIAL SCIENCES Mission The College of Health & Social Sciences prepares students to help solve the most pressing and enduring issues confronting the well-being of individuals, families, communities and society. Students, faculty and staff participate in a learning process that fosters excellence in their professions and supports them in the pursuit of equity and social justice. To advance this mission, the College is committed to innovative teaching, scholarship and service that inspire leadership for positive social change. Source: SF State website Strategic Initiatives: Faculty Learning Community to assist new Tenure-Track Faculty CHSS Teaching Academy that assists faculty at all levels to become more effective teachers Expanding Student-Faculty Research Collaboration as high-impact practice Source: HSS 53 P age
55 General Fund Budget College of Health and Social Sciences FTE College of Health and Social Sciences 25,000 $20,098 20,000 15,000 10,000 5,000 - $18,395 Amount Actuals 2016/17 Budget 2017/18 Actuals 2016/17 Budget 2017/18 Actuals 2016/17 Budget 2017/18 Change from 2016/17 FTE Change from 2016/17 Actuals Col of Health and Social Sciences FTE Amount FTE Amount Amount % Amount % in thousands a b c d c-a (c-a)/a d-b (d-b)/b Salaries Academic Salaries 106 9, , % (127) -1% Part Time Faculty 88 5,339 3,839 (88) -100% (1,499) -28% Teaching Associates (1) -100% (34) -100% Summer Session Fac (0) -100% 15 2% Graduate Assistant (0) -100% (13) -100% Instructional Faculty 196 $ 15, $ 14,093 (88) -45% (1,657) -11% Department Chair (0) -1% (7) -1% Management and Supervisory % - 0% Support Staff 48 2, ,578 (4) -9% (66) -2% Salaries 254 $ 19, $ 18,048 (93) -37% (1,730) -9% Operating Expenses % Col of Health and Social Sciences 254 $ 20, $ 18,395 (93) -37% (1,702) -8% Note: FTE variance due to appointment changes 54 P age
56 Division Summary By CSU Fund, 3 Years of Actuals FY14-15 to FY16-17 In thousands HEALTH AND SOCIAL SC - Health and Social Sciences-Col Salaries Benefits Operating Expenses TF-Extended Education Operations 1,113 1, Salaries Benefits Operating Expenses TF-Instructionally Related Activities Trust Salaries Benefits Operating Expenses TF-Contracts and Grant Trust Operating Expenses TF-Lottery Education Fund Salaries 17,827 18,257 19,790 Benefits 7,701 8,129 8,866 Operating Expenses Work Study TF-CSU Operating Fund 26,008 26,586 29,460 Salaries Benefits Operating Expenses TF-Special Projects Fund-Special Projects Salaries Benefits Operating Expenses TF-Miscellaneous Trust HEALTH AND SOCIAL SC - Health and Social Sciences-Col 28,013 29,073 31, P age
57 COLLEGE OF SCIENCE & ENGINEERING (CoSE) Mission CoSE provides an encouraging environment to develop the intellectual capacity, critical thinking, creativity and problem solving ability of its students so that they may become honorable, contributing and forward-thinking members of the science and engineering community of the San Francisco Bay Area and beyond. CoSE fosters a thriving environment for scholarly and creative activities so that new knowledge or solutions to problems are discovered or created and provides science education to all students in the University so that they may be equipped to succeed in the modern world. Source: SF State website Strategic Initiatives: Expanding Advising Services (hiring advisers and remodel of SCI 214) Proposed new Master of Science in Interdisciplinary Marine & Estuarine Sciences Proposed new minor in Computing Applications Source: CoSE 56 P age
58 General Fund Budget College of Science & Engineering FTE College of Science & Engineer Amount ,000 30,000 $29,092 $27, ,000 20,000 15,000 10, , Actuals 2016/17 Budget 2017/18 Actuals 2016/17 Budget 2017/18 Actuals 2016/17 Budget 2017/18 Change from 2016/17 FTE Change from 2016/17 Actuals College of Science & Engineering FTE Amount FTE Amount Amount % Amount % in thousands a b c d c-a (c-a)/a d-b (d-b)/b Salaries Academic Salaries , , % 180 1% Part Time Faculty 79 4,568 4,317 (79) -100% (251) -5% Teaching Associates 30 1,158 - (30) -100% (1,158) -100% Summer Session Fac (0) -100% % Graduate Assistant (10) -100% (281) -100% Instructional Faculty 283 $ 22, $ 21,217 (114) -40% (1,226) -5% Department Chair % 14 2% Management and Supervisory 9 1, , % 15 1% Support Staff 75 4, ,541 (2) -2% (140) -3% Salaries 372 $ 29, $ 27,667 (115) -31% (1,619) -6% Operating Expenses 87 (1) - - (88) -101% College of Science & Engineer 372 $ 29, $ 27,667 (115) -31% (1,425) -5% Note: FTE variance due to appointment changes 57 P age
59 Division Summary By CSU Fund, 3 Years of Actuals FY14-15 to FY16-17 In thousands SCIENCE ENGINEERING - College of Science & Engineer Salaries Benefits Operating Expenses 477 1, TF-Extended Education Operations 631 1, Salaries Benefits Operating Expenses TF-Instructionally Related Activities Trust Salaries Benefits Operating Expenses TF-Lottery Education Fund Salaries 25,308 26,342 29,051 Benefits 11,058 11,960 13,146 Operating Expenses Work Study TF-CSU Operating Fund 36,998 38,029 42,612 Salaries Benefits Operating Expenses 1,471 1,686 1, TF-Special Projects Fund-Special Projects 1,755 2,166 2,660 Salaries Benefits Operating Expenses TF-Miscellaneous Trust SCIENCE ENGINEERING - College of Science & Engineer 40,312 42,906 46, P age
60 COLLEGE OF BUSINESS Mission We are San Francisco s public business school. We embrace the area s rich diversity and provide access to higher education. Our mission is to prepare students for professional success through high quality teaching, innovative and relevant courses, discipline-based and pedagogical scholarship, and engagement with the academic and business communities. Source: SF State website Strategic Initiatives: Expanded advising services Expanded tutoring services Created a degree in MS in Business Analytics Source: College of Business 59 P age
61 General Fund Budget College of Business FTE College of Business Amount ,000 18,000 16,000 14,000 12,000 10,000 8,000 6,000 4,000 2,000 - $17,316 $16,924 Actuals 2016/17 Budget 2017/18 Actuals 2016/17 Budget 2017/18 Actuals 2016/17 Budget 2017/18 Change from 2016/17 FTE Change from 2016/17 Actuals College of Business FTE Amount FTE Amount Amount % Amount % in thousands a b c d c-a (c-a)/a d-b (d-b)/b Salaries Academic Salaries 97 10, , % 304 3% Part Time Faculty 40 2,410 1,964 (40) -100% (445) -18% Summer Session Fac 0 1,048 1,422 (0) -100% % Graduate Assistant (0) -100% (10) -100% Instructional Faculty 138 $ 14, $ 14,300 (21) -15% 222 2% Department Chair % 1 0% Management and Supervisory (1) -14% (90) -16% Support Staff 27 1, ,519 (1) -2% (4) 0% Salaries 172 $ 16, $ 16,924 (22) -13% 130 1% Operating Expenses (521) -100% College of Business 172 $ 17, $ 16,924 (22) -13% (391) -2% Note: FTE variance due to appointment changes 60 P age
62 Division Summary By CSU Fund, 3 Years of Actuals FY14-15 to FY16-17 In thousands BUSINESS - College of Business Salaries Benefits Operating Expenses 287 1, TF-Extended Education Operations 401 1, Salaries Operating Expenses TF-Instructionally Related Activities Trust Operating Expenses TF-Lottery Education Fund Salaries 14,322 14,962 16,796 Benefits 6,186 6,274 7,159 Operating Expenses 1, Work Study TF-CSU Operating Fund 21,853 21,739 24,991 Salaries Benefits Operating Expenses TF-Special Projects Fund-Special Projects Operating Expenses TF-Miscellaneous Trust BUSINESS - College of Business 22,402 23,391 25, P age
63 GRADUATE COLLEGE OF EDUCATION Mission The Graduate College of Education prepares reflective, transformative educators, clinicians, leaders and scholars who advance the professions within education. Our graduates deliver education programs across the life span, demonstrating excellence in the art and science of teaching and learning, research on critical issues in education and communicative disorders, integration of new technologies and commitment to equity and social justice. Professional preparation programs are designed to meet global challenges, through authentic learning experiences in academic and clinical environments that are guided by our commitment to inclusiveness, integrity, community, social action and evidence-based practice. Source: SF State website Strategic Initiatives: Developing an externally funded student success collaborative from pre-service to credentialing. Developing a common trunk among graduate programs as a pathway to teaching Significantly expanding our undergraduate minor programs in the education minor and the special education minor. Source: College of Education 62 P age
64 General Fund Budget Graduate College of Education FTE Graduate College of Education Amount ,000 8,000 7,000 6,000 $7,885 $7, ,000 4, , ,000 1, Actuals 2016/17 Budget 2017/18 Actuals 2016/17 Budget 2017/18 Actuals 2016/17 Budget 2017/18 Change from 2016/17 FTE Change from 2016/17 Actuals Graduate College of Education FTE Amount FTE Amount Amount % Amount % in thousands a b c d c-a (c-a)/a d-b (d-b)/b Salaries Academic Salaries 40 3, , % % Part Time Faculty 28 1, (28) -100% (808) -54% Summer Session Fac (0) -100% (37) -22% Graduate Assistant (0) -100% (9) -100% Instructional Faculty 69 $ 5, $ 5,139 (25) -37% (295) -5% Department Chair % - 0% Management and Supervisory % 7 2% Support Staff 27 1, ,380 (1) -3% (67) -5% Salaries 102 $ 7, $ 7,336 (26) -25% (355) -5% Operating Expenses (66) -34% Graduate College of Education 102 $ 7, $ 7,464 (26) -25% (421) -5% Note: FTE variance due to appointment changes 63 P age
65 Division Summary By CSU Fund, 3 Years of Actuals FY14-15 to FY16-17 In thousands EDUCATION - Graduate College of Education Salaries Benefits Operating Expenses TF-Extended Education Operations Salaries Benefits Operating Expenses TF-Instructionally Related Activities Trust Operating Expenses TF-Lottery Education Fund Salaries 7,508 7,326 7,731 Benefits 3,066 3,025 3,226 Operating Expenses Work Study TF-CSU Operating Fund 10,856 10,656 11,234 Salaries Benefits Operating Expenses TF-Special Projects Fund-Special Projects Salaries Benefits Operating Expenses TF-Miscellaneous Trust EDUCATION - Graduate College of Education 11,164 10,915 11, P age
66 ACADEMIC SUPPORT UNITS J. PAUL LEONARD LIBRARY Mission The mission of the J. Paul Leonard Library is to empower its University constituency with lifelong learning skills to identify, find, evaluate, use and communicate information in promotion of excellence in scholarship, knowledge and understanding. Source: SF State website 65 P age
67 General Fund Budget Library FTE Library 9,000 8,000 7,000 6,000 5,000 4,000 3,000 2,000 $5,651 $8,072 Amount 10 1, Actuals 2016/17 Budget 2017/18 Actuals 2016/17 Budget 2017/18 Actuals 2016/17 Budget 2017/18 Change from 2016/17 FTE Change from 2016/17 Actuals Library FTE Amount FTE Amount Amount % Amount % in thousands a b c d c-a (c-a)/a d-b (d-b)/b Salaries Academic Salaries 22 1, ,739 (0) 0% 15 1% Instructional Faculty 22 $ 1, $ 1,739 (0) 0% 15 1% Department Chair % - 0% Management and Supervisory % - 0% Support Staff 65 2, ,768 (22) -33% 58 2% Salaries 90 $ 4, $ 4,883 (22) -24% 73 2% Operating Expenses 841 3, , % Library 90 $ 5, $ 8,072 (22) -24% 2,421 43% Note: - $3,189,251 of Budget Operating Expense includes $2.3M in transfers. Division Summary By CSU Fund, 3 Years of Actuals FY14-15 to FY16-17 In thousands LIBRARY - Library Salaries Benefits Operating Expenses 2,901 2,441 2, TF-Instructionally Related Activities Trust 2,959 2,497 2,316 Salaries 4,672 4,711 4,810 Benefits 2,147 2,248 2,339 Operating Expenses Work Study TF-CSU Operating Fund 7,745 7,817 8,125 Operating Expenses TF-Miscellaneous Trust LIBRARY - Library 11,000 10,531 10, P age
68 UNDERGRAD EDUCATION & ACADEMIC PLANNING General Fund Budget Undrgrd Ed & Academic Planning FTE Undrgrd Ed & Academic Planning 4,500.0 $4,029 4, , ,000.0 $3,694 Amount 40 2, , , , Actuals 2016/17 Budget 2017/18 Actuals 2016/17 Budget 2017/18 Actuals 2016/17 Budget 2017/18 Change from 2016/17 FTE Change from 2016/17 Actuals Undrgrd Ed & Academic Planning FTE Amount FTE Amount Amount % Amount % in thousands a b c d c-a (c-a)/a d-b (d-b)/b Salaries Academic Salaries (1) -100% (229) -100% Part Time Faculty (9) -100% (426) -67% Instructional Faculty 10 $ 865 $ 210 (10) -100% (655) -76% Management and Supervisory % % Support Staff 46 2, ,566 (0) 0% 203 9% Salaries 60 $ 3, $ 3,445 (8) -14% (273) -7% Operating Expenses (62) -20% Undrgrd Ed & Academic Planning 60 $ 4, $ 3,694 (8) -14% (334) -8% Note: Counts for Vacant FTE with Budget: Support Staff = 7 Division Summary By CSU Fund, 3 Years of Actuals FY14-15 to FY16-17 In thousands UNDRGRD ED&ACAD PLAN - Undrgrd Ed & Academic Planning Salaries Benefits Operating Expenses TF-Instructionally Related Activities Trust Salaries Benefits Operating Expenses TF-Lottery Education Fund Salaries 2,678 2,703 3,717 Benefits 1,333 1,310 1,612 Operating Expenses Work Study TF-CSU Operating Fund 4,384 4,234 5,820 Salaries Benefits Operating Expenses TF-Special Projects Fund-Special Projects Operating Expenses TF-Miscellaneous Trust UNDRGRD ED&ACAD PLAN - Undrgrd Ed & Academic Planning 4,803 4,520 6, P age
69 ACADEMIC AFFAIRS ADMINISTRATION General Fund Budget Academic Affairs Admin FTE Academic Affairs Admin 16,000 14,000 12,000 10,000 8,000 6,000 4,000 2,000 0 $9,733 $13,595 Amount Actuals 2016/17 Budget 2017/18 Actuals 2016/17 Budget 2017/18 Actuals 2016/17 Budget 2017/18 Change from 2016/17 FTE Change from 2016/17 Actuals Academic Affairs Admin FTE Amount FTE Amount Amount % Amount % in thousands a b c d c-a (c-a)/a d-b (d-b)/b Salaries Academic Salaries (2) (513) (556) 2-100% (43) 8% Part Time Faculty - 1, , % Instructional Faculty (2) $ (513) $ 1, % 1, % Management and Supervisory 16 2, , % 150 7% Support Staff 101 6, ,413 (4) -4% 230 4% Salaries 116 $ 7, $ 9,969 (2) -1% 2,072 26% Operating Expenses 1,836 3, ,790 97% Academic Affairs Admin 116 $ 9, $ 13,595 (2) -1% 3,862 40% Note: Counts for Vacant FTE with Budget: Support Staff: 5 Division Summary By CSU Fund, 3 Years of Actuals FY14-15 to FY16-17 In thousands ACADM ADMIN - Academic Affairs Admin Operating Expenses TF-Extended Education Operations Salaries Benefits Operating Expenses TF-Instructionally Related Activities Trust Salaries Benefits Operating Expenses 893 2, TF-Lottery Education Fund 908 2, Salaries 3,219 6,585 7,897 Benefits 3,362 3,806 4,206 Operating Expenses 928 1,491 1,853 Work Study TF-CSU Operating Fund 7,577 11,936 14,030 Salaries Benefits Operating Expenses TF-Special Projects Fund-Special Projects Salaries Benefits Operating Expenses TF-Miscellaneous Trust ACADM ADMIN - Academic Affairs Admin 9,419 15,262 16, P age
70 STUDENT AFFAIRS & ENROLLMENT MANAGEMENT General Fund Budget Student Affairs & Enroll Mgmnt (Cabinet) FTE Student Affairs & Enroll Mgmnt (Cabinet) Amount ,000 $17,051 $16, ,000 14,000 12, ,000 8, , ,000 2, Actuals 2016/17 Budget 2017/18 Actuals 2016/17 Budget 2017/18 Actuals 2016/17 Budget 2017/18 Change from 2016/17 FTE Change from 2016/17 Actuals Student Affairs & Enroll Mgmnt (Cabinet) FTE Amount FTE Amount Amount % Amount % in thousands a b c d c-a (c-a)/a d-b (d-b)/b Salaries Instructional Faculty* (1) % (38) 100% Management and Supervisory 33 3, , % % Support Staff , , % (35) 0% Salaries 210 $ 15, $ 15, % 392 3% Operating Expenses 1,911 1,215 - (696) -36% Student Affairs & Enroll Mgmnt (Cabinet) 210 $ 17, $ 16, % (304) -2% Notes: *37,500 is Ucorp Reimbursement Counts for Vacant FTE without budget: MPP=1, Staff=2 Counts for Vacant FTE with budget: MPP=6, Staff=25 69 P age
71 OFFICE OF THE DEAN OF STUDENTS General Fund Budget Offices of the Dean of Students FTE Offices of the Dean of Students Amount ,200 1,000 $1,039 $1, Actuals 2016/17 Budget 2017/18 Actuals 2016/17 Budget 2017/18 Actuals 2016/17 Budget 2017/18 Change from 2016/17 FTE Change from 2016/17 Actuals Offices of the Dean of Students FTE Amount FTE Amount Amount % Amount % in thousands a b c d c-a (c-a)/a d-b (d-b)/b Salaries Management and Supervisory % 97 24% Support Staff (1) -6% (30) -5% Salaries 16 $ $ 1, % 67 7% Operating Expenses (56) -67% AVP & Dean of Students 16 $ 1, $ 1, % 11 1% Note: Counts for Vacant FTE without budget: MPP=1 DIVISION OF STUDENT AFFAIRS General Fund Budget Division of Student Affairs FTE Division of Student Affairs Amount ,000 2,500 $2,550 $2, , , , Actuals 2016/17 Budget 2017/18 Actuals 2016/17 Budget 2017/18 Actuals 2016/17 Budget 2017/18 Change from 2016/17 FTE Change from 2016/17 Actuals Division of Student Affairs FTE Amount FTE Amount Amount % Amount % in thousands a b c d c-a (c-a)/a d-b (d-b)/b Salaries Management and Supervisory % (23) -5% Support Staff 18 1, ,551 (1) -4% (313) -17% Salaries 22 $ 2, $ 1, % (336) -15% Operating Expenses (2) -1% AVP- Student Affairs 22 $ 2, $ 2, % (338) -13% Note: Counts for Vacant FTE without budget: Staff=2, Counts for Vacant FTE with budget: MPP = 1 70 P age
72 DIVISION OF ENROLLMENT MANAGEMENT General Fund Budget Division of Enrollment Mgmt FTE Division of Enrollment Mgmt Amount ,000 7,000 6,000 5,000 4,000 3,000 2,000 $6,806 $6, , Actuals 2016/17 Budget 2017/18 Actuals 2016/17 Budget 2017/18 Actuals 2016/17 Budget 2017/18 Change from 2016/17 FTE Change from 2016/17 Actuals Division of Enrollment Mgmt FTE Amount FTE Amount Amount % Amount % in thousands a b c d c-a (c-a)/a d-b (d-b)/b Salaries Management and Supervisory 12 1, , % 89 8% Support Staff 90 5, , % 82 2% Salaries 103 $ 6, $ 6, % 171 3% Operating Expenses (329) -59% AVP_Enrollment Mgmt 103 $ 6, $ 6, % (159) -2% Note: Counts for Vacant FTE with budget: MPP = 3, Staff = 19 DIVISION OF INTERNATIONAL EDUCATION General Fund Budget Div of International Education FTE Div of International Education 1,800 $1,582 1,600 1,400 1,200 1, $1,379 Amount - - Actuals 2016/17 Budget 2017/18 Actuals 2016/17 Budget 2017/18 Actuals 2016/17 Budget 2017/18 Change from 2016/17 FTE Change from 2016/17 Actuals Div of International Education FTE Amount FTE Amount Amount % Amount % in thousands a b c d c-a (c-a)/a d-b (d-b)/b Salaries Management and Supervisory % (29) -8% Support Staff % (16) -2% Salaries 18 $ 1, $ 1, % (45) -3% Operating Expenses (158) -57% Div of International Education 18 $ 1, $ 1, % (203) -13% Note: Counts for Vacant FTE with budget: Staff = 1 71 P age
73 DIVISION OF CAMPUS SAFETY General Fund Budget Division of Campus Safety FTE Division of Campus Safety Amount ,000 4,500 4,000 $4,186 $4, ,500 3, , ,000 1, , Actuals 2016/17 Budget 2017/18 Actuals 2016/17 Budget 2017/18 Actuals 2016/17 Budget 2017/18 Change from 2016/17 FTE Change from 2016/17 Actuals Division of Campus Safety FTE Amount FTE Amount Amount % Amount % in thousands a b c d c-a (c-a)/a d-b (d-b)/b Salaries Management and Supervisory % % Support Staff 39 2, , % 199 7% Salaries 44 $ 3, $ 3, % 321 9% Operating Expenses (170) -27% Division of Campus Safety 44 $ 4, $ 4, % 151 4% Note: Includes Counts for Vacant FTE with budget: MPP = 1, Staff = 4 OFFICE OF EQUITY PROGRAM & COMPLIANCE General Fund Budget Office of Equity Prgm & Compliance 4 4 FTE 350 Office of Equity Prgm & Compliance $313 Amount $ Actuals 2016/17 Budget 2017/18 Actuals 2016/17 Budget 2017/18 Actuals 2016/17 Budget 2017/18 Change from 2016/17 FTE Change from 2016/17 Actuals Office of Equity Prgm & Compliance FTE Amount FTE Amount Amount % Amount % in thousands a b c d c-a (c-a)/a d-b (d-b)/b Salaries Management and Supervisory % % Support Staff (1) -100% (33) -100% Salaries 2 $ $ % 76 51% Operating Expenses % Office of Equity Prgm & Compliance 2 $ $ % % Note: Counts for Vacant FTE with budget: MPP = 1 72 P age
74 VP STUDENT AFFAIRS & ENROLLMENT MANAGEMENT General Fund Budget VP Stdnt Affrs & Enroll Mgmt FTE VP Stdnt Affrs & Enroll Mgmt Amount $679 $ Actuals 2016/17 Budget 2017/18 Actuals 2016/17 Budget 2017/18 Actuals 2016/17 Budget 2017/18 Change from 2016/17 FTE Change from 2016/17 Actuals VP Stdnt Affrs & Enroll Mgmt FTE Amount FTE Amount Amount % Amount % in thousands a b c d c-a (c-a)/a d-b (d-b)/b Salaries Management and Supervisory % 63 18% Support Staff % 76 26% Salaries 6 $ $ % % Operating Expenses (10) -20% VP Stdnt Affrs & Enroll Mgmt 6 $ $ % % Note: Counts for Vacant FTE with budget: Staff = 1 73 P age
75 UNIVERSITY ADVANCEMENT General Fund Budget University Advancement(Cabinet) FTE University Advancement(Cabinet) Amount ,000 6,000 $6,014 $5, , , , , , Actuals 2016/17 Budget 2017/18 Actuals 2016/17 Budget 2017/18 Actuals 2016/17 Budget 2017/18 Change from 2016/17 FTE Change from 2016/17 Actuals University Advancement(Cabinet) FTE Amount FTE Amount Amount % Amount % in thousands a b c d c-a (c-a)/a d-b (d-b)/b Salaries Management and Supervisory 30 3, , % % Support Staff 27 1, , % 72 4% Salaries 57 $ 5, $ 5, % 414 8% Operating Expenses (438) -46% University Advancement(Cabinet) 57 $ 6, $ 5, % (23) 0% *Does not include Athletics Program 74 P age
76 ADVANCEMENT COMPUTING PROGRAM General Fund Budget Advancement Computing Program FTE Advancement Computing Program Amount $483 $ Actuals 2016/17 Budget 2017/18 Actuals 2016/17 Budget 2017/18 Actuals 2016/17 Budget 2017/18 Change from 2016/17 FTE Change from 2016/17 Actuals Advancement Computing Program FTE Amount FTE Amount Amount % Amount % in thousands a b c d c-a (c-a)/a d-b (d-b)/b Salaries Management and Supervisory % - 0% Support Staff % 61 22% Salaries 6 $ $ % 61 17% Operating Expenses (42) -36% Advancement Computing Program 6 $ $ % 19 4% DEVELOPMENT General Fund Budget Development FTE Development Amount 35 3,000 $2,818 $2, , ,000 1,500 1, Actuals 2016/17 Budget 2017/18 Actuals 2016/17 Budget 2017/18 Actuals 2016/17 Budget 2017/18 Change from 2016/17 FTE Change from 2016/17 Actuals Development FTE Amount FTE Amount Amount % Amount % in thousands a b c d c-a (c-a)/a d-b (d-b)/b Salaries Management and Supervisory 18 2, , % 182 9% Support Staff (1) -13% (81) -16% Salaries 27 $ 2, $ 2, % 101 4% Operating Expenses (88) -37% Development 27 $ 2, $ 2, % 14 0% 75 P age
77 GOVERN & COMMUNITY RELATIONS General Fund Budget 2 Govern & Community Relations 2 FTE 250 Govern & Community Relations $228 Amount $ Actuals 2016/17 Budget 2017/18 Actuals 2016/17 Budget 2017/18 Actuals 2016/17 Budget 2017/18 Change from 2016/17 FTE Change from 2016/17 Actuals Govern & Community Relations FTE Amount FTE Amount Amount % Amount % in thousands a b c d c-a (c-a)/a d-b (d-b)/b Salaries Management and Supervisory % 75 57% Support Staff (1) -100% Salaries 1 $ $ % 74 56% Operating Expenses % Govern & Community Relations 1 $ $ % 78 52% PUBLIC AFFAIRS General Fund Budget Public Affairs FTE Public Affairs Amount ,400 1,200 1, $1,210 $955 Actuals 2016/17 Budget 2017/18 Actuals 2016/17 Budget 2017/18 Actuals 2016/17 Budget 2017/18 Change from 2016/17 FTE Change from 2016/17 Actuals Public Affairs FTE Amount FTE Amount Amount % Amount % in thousands a b c d c-a (c-a)/a d-b (d-b)/b Salaries Management and Supervisory % (26) -7% Support Staff % 60 16% Salaries 9 $ $ % 35 5% Operating Expenses (290) -62% Public Affairs 9 $ 1,210 9 $ % (255) -21% 76 P age
78 VP UNIVERSITY ADVANCEMENT ADMIN General Fund Budget VP University Adv Admin FTE VP University Adv Admin Amount ,600 1,400 $1,346 $1, , , Actuals 2016/17 Budget 2017/18 Actuals 2016/17 Budget 2017/18 Actuals 2016/17 Budget 2017/18 Change from 2016/17 FTE Change from 2016/17 Actuals VP University Adv Admin FTE Amount FTE Amount Amount % Amount % in thousands a b c d c-a (c-a)/a d-b (d-b)/b Salaries Management and Supervisory % % Support Staff % 32 7% Salaries 15 $ 1, $ 1, % % Operating Expenses (17) -17% VP University Adv Admin 15 $ 1, $ 1, % 126 9% 77 P age
79 ADMINISTRATION & FINANCE General Fund Budget Administration & Finance FTE Administration & Finance Amount ,000 35,000 $33,150 $34, , , , , , , Actuals 2016/17 Budget 2017/18 Actuals 2016/17 Budget 2017/18 Administration & Finance FTE Amount FTE Amount Amount % Amount % a b c d c-a (c-a)/a d-b (d-b)/b Salaries Management and Supervisory 53 6, , % 139 2% Support Staff , , % 881 5% Salaries 349 $ 25, $ 26, % 1,019 4% Operating Expenses 7,962 8, % Administration & Finance 349 $ 33, $ 34, % 1,550 5% Note: Does not include UPM Actuals 2016/17 Budget 2017/18 Change from 2016/17 FTE Change from 2016/17 Actuals 78 P age
80 AUDIT & ADVISORY SERVICES General Fund Budget Audit & Advisory Services FTE Audit & Advisory Services Amount $592 $ Actuals 2016/17 Budget 2017/18 Actuals 2016/17 Budget 2017/18 Actuals 2016/17 Budget 2017/18 Change from 2016/17 FTE Change from 2016/17 Actuals Audit & Advisory Services FTE Amount FTE Amount Amount % Amount % in thousands a b c d c-a (c-a)/a d-b (d-b)/b Salaries Management and Supervisory % 9 7% Support Staff (1) -22% (41) -14% Salaries 5 $ $ 386 (1) -17% (32) -8% Operating Expenses (12) -7% Audit & Advisory Services 5 $ $ 548 (1) -17% (44) -7% BUDGET & RISK MANAGEMENT General Fund Budget Budget & Risk Management FTE Budget & Risk Management 1,200 Amount 10 1,000 $960 $ Actuals 2016/17 Budget 2017/18 Actuals 2016/17 Budget 2017/18 Actuals 2016/17 Budget 2017/18 Change from 2016/17 FTE Change from 2016/17 Actuals Budget & Risk Management FTE Amount FTE Amount Amount % Amount % in thousands a b c d c-a (c-a)/a d-b (d-b)/b Salaries Management and Supervisory (0) 0% - 0% Support Staff % 21 4% Salaries 11 $ $ % 21 2% Operating Expenses (9) -11% Budget & Risk Management 11 $ $ % 12 1% 79 P age
81 BUSINESS OPERATIONS General Fund Budget Business Operations FTE Business Operations Amount ,000 2,500 $2,480 $2, , , , Actuals 2016/17 Budget 2017/18 Actuals 2016/17 Budget 2017/18 Actuals 2016/17 Budget 2017/18 Change from 2016/17 FTE Change from 2016/17 Actuals Business Operations FTE Amount FTE Amount Amount % Amount % in thousands a b c d c-a (c-a)/a d-b (d-b)/b Salaries Management and Supervisory % (8) -1% Support Staff 19 1, , % % Salaries 26 $ 1, $ 1, % 166 9% Operating Expenses (70) -11% Business Operations 26 $ 2, $ 2, % 96 4% CAPITAL PLAN DESIGN & CONSTRUCTION General Fund Budget Capital Plan Design & Construction FTE Capital Plan Design & Construction Amount ,200 1,000 $1,087 $1, Actuals 2016/17 Budget 2017/18 Actuals 2016/17 Budget 2017/18 Actuals 2016/17 Budget 2017/18 Change from 2016/17 FTE Change from 2016/17 Actuals Capital Plan Design & Construction FTE Amount FTE Amount Amount % Amount % in thousands a b c d c-a (c-a)/a d-b (d-b)/b Salaries Management and Supervisory % 84 19% Support Staff (1) -8% (132) -26% Salaries 10 $ $ % (48) -5% Operating Expenses (14) -10% Capital Plan Design & Construction 10 $ 1, $ 1, % (63) -6% 80 P age
82 FACILITIES & SERVICE ENTERPRISE General Fund Budget Facilties & Services Enterprise FTE Facilties & Services Enterprise Amount ,000 12,000 10,000 8,000 6,000 4,000 2,000 - $10,586 $11,794 Actuals 2016/17 Budget 2017/18 Actuals 2016/17 Budget 2017/18 Actuals 2016/17 Budget 2017/18 Change from 2016/17 FTE Change from 2016/17 Actuals Facilties & Services Enterprise FTE Amount FTE Amount* Amount % Amount % in thousands a b c d c-a (c-a)/a d-b (d-b)/b Salaries Management and Supervisory % % Support Staff 134 6, , % 60 1% Salaries 140 $ 7, $ 7, % 174 2% Operating Expenses 3,255 4,289-1,034 32% Facilties & Services Enterprise 140 $ 10, $ 11, % 1,208 11% *Including 2.3M for Repair and Maintenance FISCAL AFFAIRS / CONTROLLER General Fund Budget Fiscal Affairs/Controller FTE Fiscal Affairs/Controller Amount ,500 3,000 2,500 2,000 $3,012 $3, , , Actuals 2016/17 Budget 2017/18 Actuals 2016/17 Budget 2017/18 Actuals 2016/17 Budget 2017/18 Change from 2016/17 FTE Change from 2016/17 Actuals Fiscal Affairs/Controller FTE Amount FTE Amount Amount % Amount % in thousands a b c d c-a (c-a)/a d-b (d-b)/b Salaries - Management and Supervisory 9 1, , % 36 4% Support Staff 32 1, , % 117 7% Salaries 40 $ 2, $ 2, % 154 5% Operating Expenses % Fiscal Affairs/Controller 40 $ 3, $ 3, % 280 9% 81 P age
83 HUMAN RESOURCES General Fund Budget Human Resources FTE Human Resources Amount ,500 3,000 2,500 2,000 $3,262 $2,923 #DIV/0! - #DIV/0! ,500 1, Actuals 2016/17 Budget 2017/18 Actuals 2016/17 Budget 2017/18 Actuals 2016/17 Budget 2017/18 Change from 2016/17 FTE Change from 2016/17 Actuals Human Resources FTE Amount FTE Amount Amount % Amount % in thousands a b c d c-a (c-a)/a d-b (d-b)/b Salaries Management and Supervisory 10 1, , % 73 7% Support Staff 24 1, , % % Salaries 34 $ 2, $ 2, % % Operating Expenses % Human Resources 34 $ 2, $ 3, % % INFORMATION TECHNOLOGY General Fund Budget Information Technology FTE Information Technology Amount ,000 9,000 8,000 7,000 6,000 5,000 4,000 3,000 2,000 1,000 - $8,989 $9,040 Actuals 2016/17 Budget 2017/18 Actuals 2016/17 Budget 2017/18 Actuals 2016/17 Budget 2017/18 Change from 2016/17 FTE Change from 2016/17 Actuals Information Technology FTE Amount FTE Amount Amount % Amount % in thousands a b c d c-a (c-a)/a d-b (d-b)/b Salaries Management and Supervisory 7 1, , % 41 4% Support Staff 60 5, , % 400 7% Salaries 68 $ 6, $ 7, % 441 7% Operating Expenses 2,356 1,966 - (390) -17% Information Technology 68 $ 8, $ 9, % 51 1% 82 P age
84 PHYSICAL PLANNING & DEVELOPMENT General Fund Budget Physical Planning Development FTE Physical Planning Development Amount 12 1, , $892 $ Actuals 2016/17 Budget 2017/18 Actuals 2016/17 Budget 2017/18 Actuals 2016/17 Budget 2017/18 Change from 2016/17 FTE Change from 2016/17 Actuals Physical Planning Development FTE Amount FTE Amount Amount % Amount % in thousands a b c d c-a (c-a)/a d-b (d-b)/b Salaries Management and Supervisory (1) -22% (95) -20% Support Staff % % Salaries 8 $ $ % 97 12% Operating Expenses % Physical Planning Development 8 $ $ % % VP ADMIN & FINANCE General Fund Budget VP Admin & Finance FTE VP Admin & Finance Amount ,800 1,600 1,400 1,200 1, $1,630 $1, Actuals 2016/17 Budget 2017/18 Actuals 2016/17 Budget 2017/18 Actuals 2016/17 Budget 2017/18 Change from 2016/17 FTE Change from 2016/17 Actuals VP Admin & Finance FTE Amount FTE Amount Amount % Amount % in thousands a b c d c-a (c-a)/a d-b (d-b)/b Salaries Management and Supervisory (0) -2% (116) -18% Support Staff (0) -5% (159) -46% Salaries 7 $ $ 697 (0) -3% (275) -28% Operating Expenses (159) -24% VP Admin & Finance 7 $ 1,630 7 $ 1,196 (0) -3% (435) -27% 83 P age
85 OFFICE OF THE PRESIDENT General Fund Budget Office of the President FTE Office of the President Amount ,400 1,200 1, $1,279 $1, Actuals 2016/17 Budget 2017/18 Actuals 2016/17 Budget 2017/18 Actuals 2016/17 Budget 2017/18 Change from 2016/17 FTE Change from 2016/17 Actuals Office of the President FTE Amount FTE Amount Amount % Amount % a b c d c-a (c-a)/a d-b (d-b)/b Salaries Management and Supervisory % 17 3% President % - 0% Support Staff % 4 2% Salaries 7 $ 1,062 8 $ 1, % 21 2% Operating Expenses % Office of the President 7 $ 1,279 8 $ 1, % 36 3% 84 P age
86 AUXILIARY AND SELF SUPPORT UNITS ATHLETICS Mission The mission of the Athletic Department at SF State is to provide a broad-based NCAA Division II intercollegiate athletics program that fosters the physical, intellectual, social and emotional development of student athletes. The Gators athletics includes seven women's sports and five men's sports. Women's sports are volleyball, basketball, softball, soccer, cross country, indoor track and field and outdoor track and field. Men's sports are basketball, baseball, soccer, cross country and wrestling.' All sports except wrestling are members of the California Collegiate Athletic Association; wrestling is a member of the Rocky Mountain Athletic Conference. Source: SF State website Strategic/Sustainability Initiatives: Plan in process for conversion of Athletics IRA Fee to Category II Mandatory Athletic Fee Discussion of annual renewal with Sodexo Corporation for future support of Athletics Scholarships Financial support of $75,000 annually by President s Office for the department scholarship program 85 P age
87 San Francisco State University SFCMP Athletics: Budget Summary by Dept ID, FY Actual Actual Revised Budget Actual Original Budget Changes from 2016/17 Actuals in thousands FY FY FY FY FY Amount Percent a b c d e e-d (e-d)/d General Fund Allocation 1,700 1,550 1,735 1,734 1,722 (12) -1% Higher Ed Fees 3,246 3,232 3,284 3,139 3,033 (106) -3% Contribution (583) -100% Sales & Services of Aux (25) -100% Interest-Rmp (2) -17% Other Financial Sources (157) -97% Revenue Adjustments Revenue $ 3,553 $ 3,611 $ 3,294 $ 3,923 $ 3,050 $ (874) -22% Revenues / Other Sources. $ 5,254 $ 5,160 $ 5,029 $ 5,657 $ 4,772 $ (885) -16% Salary & Wages. 1,817 1,638 1,704 1,715 1,693 (22) -1% Benefits (63) -7% Operating Expenses. 1,527 1,175 1,152 1,349 1,015 (334) -25% Risk Pool (0) -3% Financial Aid (606) -100% Work Study All Expenses. $ 4,613 $ 4,391 $ 3,830 $ 4,644 $ 3,619 $ (1,025) -22% Net Transfers. $ (1,192) $ (1,345) $ (1,199) $ 370 $ (1,152) $ (1,522) -411% Operating Income (Loss). $ (552) $ (576) $ - $ 1,382 $ - $ (1,382) -100% Ending Fund Balance $ 317 $ (260) $ - $ 1,117 (1,117) FTE Notes: Ending Fund Balance includes balances from IRA, Endowment, Scholarships, and Fundraising Trust. 86 P age
88 STUDENT HEALTH CENTER Mission The mission of SF State Student Health Services (SHS) is to provide accessible and cost-effective quality medical care for all registered students at SF State. SHS strives to work with students to enhance lifelong health and wellness, facilitate retention and graduation, and to reduce systematic health disparities related to human and cultural diversity. By providing accessible quality health care services, SHS strives to create an environment for all students to learn the skills to manage their own health and become informed future health care consumers. The primary goal of is to serve SF State students to the best of the Student Health Services' capabilities. Source: SF State website Consolidated Budget 87 P age
89 San Francisco State University SFCMP Student Health Fund: Budget Summary by Dept ID FY Actual Actual Revised Budget Actual Original Budget Changes from 2016/17 Actuals in thousands FY FY FY FY FY17-18 Amount Percent a b c d e e-d (e-d)/d Student Health Fee 8,300 8,951 9,274 8,976 9, % Student Support Admin Fee/Facilities (0) -3% Allowance doubtful higher ed fees (11) (38) (16) (15) % Facility Fee (10) -6% Allowance doubtful health fee campus (0) (1) (0) (0) % Ticket Sales Interest-Rmp (0) 0% Sales And Serv Educ Act (3) (5) (3) Misc Revenue 1,792 1,735 1,570 1,430 1, % Other Non-Operating Revenue (0) 0% Cost Recovery From Other Csu F Allowance doubtful other operating revenues (13) (38) (9) (4) % Cost Recovery-Revenue Revenue 11,158 11,362 11,300 10,640 10, % Revenues / Other Sources. $ 11,158 $ 11,362 $ 11,300 $ 10,640 $ 10, % Salary & Wages. 4,956 4,938 6,279 5,433 6, % Benefits. 2,455 2,468 3,412 2,770 3, % Operating Expenses. 3,287 3,012 2,472 1,988 2, % Utilities % Risk Pool % Carry-Forward: Other Expenses - - (549) - (1,060) (1,060) - All Expenses. $ 10,911 $ 10,617 $ 11,828 $ 10,343 $ 10,806 $ 464 4% Net Transfers. $ (274) $ (255) $ - $ 366 $ - $ (366) -100% Operating Income (Loss). $ (27) $ 490 $ (528) $ 663 $ 86 $ (577) -87% Ending Fund Balance $ 4,497 $ 4,470 $ - $ 5,142 FTE Student Health includes (TH100, TH201, TH202, TH205, TH302, TH303, TH304, TH305, TR640, TR641, TT541, TT543) Excludes Dept ID Capital Projects Net Transfers is "Transfers in" minus "Transfers out". In other words, if Net Transfers is a negative number there is more transfering out than in. 88 P age
90 CHILDREN S CAMPUS Mission Children s Campus opened in January 2009 with a three-fold mission: 1. To provide high-quality early care and education for infants, toddlers, and preschool children of SF State faculty/staff and the community; 2. To offer on-site work, observation, and internship opportunities for SF State students from a variety of disciplines including Child and Adolescent Development, Consumer Family Science, Education, Kinesiology, Psychology, and Special Education and Communicative Disorders; and, 3. To support faculty and graduate student research that aims to improve best practices in early care and education and child development theory. Children's Campus is staffed with highly qualified early childhood professionals. The center is supported by an Advisory Council of parents, faculty, and staff. Source: SF State website Consolidated Budget San Francisco State University 8117-Children's Campus Children's Campus Fund: Budget Summary by Dept ID, FY17-18 Actual Actual Actual Orginal Budget Changes from 2016/17 Actuals in thousands FY FY FY FY17-18 Amount Percent a b d e e-d (e-d)/d Sales & Services fo Aux 1,271 1,442 1,588 1, % Misc Revenue No Program % Revenues / Other Sources. $ 1,271 $ 1,453 $ 1,604 $ 1,735 $ 131 8% Salary & Wages % Benefits (26) -7% Operating Expenses % Utilities % Risk Pool (0) -2% Carry-Forward: Other Expenses 117 All Expenses. $ 978 $ 1,264 $ 1,442 $ 1,632 $ % Net Transfers. $ (0) $ (0) $ - $ - $ - - Operating Income (Loss). $ 293 $ 189 $ 162 $ 103 $ (59) -36% Ending Fund Balance $ 189 $ 366 $ 510 FTE 21 5 (16) Childrens Campus; TR153, TR154 and Dept 8117 Net Transfers is "Transfers in" minus "Transfers out". In other words, if Net Transfers is a negative number there is more transfering out than in. Ending Fund Balance amounts reflect the balance of the total fund for all Dept IDs for end of the stated fiscal year. 89 P age
91 UNIVERSITY PARKING SERVICES Consolidated Budget San Francisco State University SFCMP Parking Fund: Budget Summary by Dept ID, FY Actual Actual Revised Budget Actual Orginal Budget Changes from 2016/17 Actuals in thousands FY FY FY FY FY17-18 Amount Percent a b c d e e-d (e-d)/d Parking Revenue % Parking Coin Gates 1,517 1,580 1,517 1,520 1, % Parking Fines % Allowance doubtful aux enterprise (1) 0 - (0) % Sales & Services of Aux 2,496 2,720 2,587 2,684 2, % Interest-Rmp % Sale Of Fixed Assets Cost Recovery from Auxiliaries (3) -100% Cost Recovery From Other Csu F Cost Recovery-Revenue (0) -1% Citations Revenue Other Financial Sources (3) -6% Revenues / Other Sources. $ 2,556 $ 2,811 $ 2,660 $ 2,768 $ 2,827 $ 59 2% Salary & Wages (35) -7% Benefits (12) -4% Operating Expenses. 1,394 1,545 1,424 1,216 1, % Utilities % Risk Pool. y (1) -7% Expenses All Expenses. $ 2,190 $ 2,400 $ 2,343 $ 2,064 $ 2,498 $ % Net Transfers. $ (321) $ (328) $ (317) $ (305) $ (329) $ (24) 8% Operating Income (Loss). $ 44 $ 84 $ - $ 399 $ - $ (399) -100% Ending Fund Balance $ 16,612 $ 1,695 $ - $ 2,095 FTE 11 8 (3) Parking Fund: TP001-TP004, TP021-24, TP026,TP204 Net Transfers is "Transfers in" minus "Transfers out". In other words, if Net Transfers is a negative number there is more transfering out than in. 90 P age
92 CAMPUS RECREATION AND MASHOUF WELLNESS CENTER Mission The Campus Recreation Department strives to meet the dynamic needs and interests of students by providing programs and services that promote positive physical and mental health, encourage lifetime interest in active, healthy lifestyles and provide student leadership opportunities that complement the academic experience. We promote an environment that values, embraces, and enriches individual differences by providing students, faculty, and staff with programs that reflect the diversity of San Francisco State University. Source: SF State website Consolidated Budget San Francisco State University SFCMP TU004-STUDENT REC AND WELLNESS CTR: Budget Summary by Dept ID, FY Mashouf Wellness Center Actual Actual Revised Budget Actual Orginal Budget Changes from 2016/17 Actuals in thousands FY FY FY FY FY17-18 Amount Percent a b c d e e-d (e-d)/d Sales & Services of Aux 8,191 8,191 - Revenue from Interest Revenue from Investments Miscellaneous Revenue Revenue $ - $ - $ - $ - $ 8,584 $ 8,584 - Revenues / Other Sources. $ - $ - $ - $ - $ 8,584 $ 8,584 - Salary & Wages ,911 1,911 - Benefits Operating Expenses ,461 1,461 - Utilities Risk Pool All Expenses. $ - $ - $ - $ - $ 4,186 $ 4,186 - Net Transfers. $ - $ - $ - $ (3,151) $ (3,151) - Operating Income (Loss). $ - $ - $ - $ - $ 1,247 $ 1,247 - Ending Fund Balance $ 3,058 FTE Net Transfers is "Transfers in" minus "Transfers out". In other words, if Net Transfers is a negative number there is more transfering out than in. 91 P age
93 San Francisco State University 4017-Campus Recreation Campus Recreation Fund: Budget Summary by Dept, FY Actual Actual Revised Budget Actual Original Budget Changes from 2016/17 Actuals in thousands FY FY FY FY FY17-18 Amount Percent a b c d e g-e (g-e)/e Higher Ed Fees % Rental of State Property % Misc Revenue (12) -100% Allow doubtful other opn revenes - (1) Cost Recovery-Revenue Other Financial Sources (5) -22% Revnue Adjustments (11) -100% Revenue $ 551 $ 633 $ 611 $ 605 $ 590 $ (16) -3% Revenues / Other Sources. $ 551 $ 633 $ 611 $ 605 $ 590 $ (16) -3% Salary & Wages (482) -100% Benefits (135) -100% Operating Expenses % Risk Pool (8) -100% Carry-Forward: Other Expenses - - (107) - (14) (14) - All Expenses. $ 556 $ 669 $ 611 $ 742 $ 590 $ (152) -20% Net Transfers Operating Income (Loss). $ (5) $ (36) $ - $ (136) $ (0) $ % Ending Fund Balance $ 269 $ 265 $ - $ 236 FTE 13 - (13) Campus Rec Fund includes: TA050, TR700, TT784, TT787 Only Dept 4017 Ending Fund Balance amounts reflect the balance of the total fund for all Dept IDs for end of the stated fiscal year. Net Transfers is "Transfers in" minus "Transfers out". In other words, if Net Transfers is a negative number there is more transfering out than in. 92 P age
94 COLLEGE OF EXTENDED LEARNING (CEL) Mission The College of Extended Learning at San Francisco State University (SF State) offers a wide variety of continuing adult education courses and programs to prepare you for career advancement, career change, or personal growth. We offer nationally-acclaimed curricula and faculty; weekend, evening, and online courses; plus access to thousands of transferable degreecredit University classes. Source: SF State website Consolidated Budget San Francisco State University SFCMP CEL Fund: Budget Summary by Dept ID, FY Actual Actual Revised Budget Actual Orginal Budget Changes from 2016/17 Actuals in thousands FY FY FY FY FY17-18 Amount Percent a b c d e e-d (e-d)/d Continung ed-s/s Degree Prgm 990 1,641 2,902 2,839 3, % Continung ed-cert Prgm 4,414 3,345 4,415 3,213 3, % Continung ed-contract Prgm (5) -100% Continung ed-open University 2,548 3,519 3,816 3,269 3, % CE-Special Session-Other 2,413 2,287 2,903 2,686 2,352 (334) -12% Self Support Summer 2,137 - (0) 90 - (90) -100% CE-Contract Extension CE-Regular Non Credit 1,557 1,631 1, , % CE - CEU Credits 1,605 1,515 2,148 1,411 2, % Allowance doubtful continung ed fees (182) (17) (0) (46) % Continuing Education Fees 15,499 13,932 18,033 14,320 16,165 1,844 13% Rev from Investments (4) -6% Other Financial Sources , % Revenue $ 16,152 $ 14,613 $ 18,880 $ 14,961 $ 17,385 $ 2,423 16% Revenues / Other Sources. $ 16,152 $ 14,613 $ 18,880 $ 14,961 $ 17,385 $ 2,423 16% Salary & Wages. 10,438 6,959 7,174 7,095 7, % Benefits. 2,299 2,079 2,596 2,093 2, % Operating Expenses. 5,654 5,049 4,581 3,415 4,736 1,321 39% Risk Pool % All Expenses. $ 18,620 $ 14,225 $ 14,583 $ 12,715 $ 14,746 $ 2,030 16% Net Transfers. $ (3,425) $ (1,471) $ (4,297) $ (1,494) $ (4,125) $ (2,631) 176% Operating Income (Loss). $ (5,893) $ (1,084) $ - $ 752 $ (1,486) $ (2,238) -298% Ending Fund Balance $ 1,099 $ 16 $ - $ 768 FTE (19) Includes TC001, TC003, TC004, TC005 Net Transfers is "Transfers in" minus "Transfers out". In other words, if Net Transfers is a negative number there is more transfering out than in. 93 P age
95 UNIVERSITY PROPERTY MANAGEMENT Mission University Property Management contributes to the educational mission of the University by delivering quality housing accommodations and related business and facilities services to our student residents, business partners, and the campus community. The department strives to engage in planning and decisions that build upon the shared values within Physical Planning & Development (PP&D): Collaborative and Supportive Integrity and Trust Professional and Diverse Safe and Responsible Sustainable and Healthy Source: SF State website Consolidated Budget 94 P age
96 San Francisco State University FY SFCMP Housing Fund: Budget Summary by Dept ID Actual Actual Revised Budget Actual Orginal Budget Changes from 2016/17 Actuals in thousands FY FY FY FY FY17-18 Amount Percent a b c d e e-d (e-d)/d General Fund Allocation (134) -100% Revenue Contribution - 3, (100) -100% Rental Revenue 40,718 42,737 43,416 45,139 45, % Facility Rental Revenue % Food Services Revenue 1,253 8,618 8,028 9,605 10, % Allow and doubtful aux enterprise - (263) (192) - (379) - Housing Revenue - Others (0) % Sales & Services of Aux 42,113 51,562 51,785 54,752 55,915 1,162 2% Interest - Rmp (161) -48% Other Financial Sources 1,861 2,275 2,047 1,575 1,321 (254) -16% Revenue Adjustments - (4) - (89) % Revenue $ 44,143 $ 57,736 $ 53,983 $ 56,673 $ 57,410 $ 736 1% Revenues / Other Sources. $ 44,143 $ 57,736 $ 53,983 $ 56,807 $ 57,410 $ 603 1% Salary & Wages. 7,346 8,262 9,103 9,230 9, % Benefits. 3,196 3,387 4,411 4,170 5, % Operating Expenses. 10,092 15,257 17,227 14,719 18,538 3,819 26% Utilities. 4,287 4,133 4,770 5,048 5, % Risk Pool % Carry-Forward: Other Expenses - - 1,054-2,382 2,382 - All Expenses. $ 25,081 $ 31,188 $ 36,726 $ 33,317 $ 41,244 $ 7,927 24% Net Transfers. (19,075) (16,442) (17,257) (20,684) (16,166) 4,518-22% Operating Income (Loss). $ (13) $ 10,105 $ 0 $ 2,806 $ - $ (2,806) -100% Ending Fund Balance $ 7,897 $ 18,002 $ - $ 20,808 FTE (6) Funds included: TD , TR560 Net Transfers is "Transfers in" minus "Transfers out". In other words, if Net Transfers is a negative number there is more transfering out than in. Net transfers include debt payment and student residential life. Carry-forward: Other Expenses- fund balance 95 P age
97 ASSOCIATED STUDENTS Mission For the students --A portion of each student s tuition fee goes to the Associated Students, making enrolled students automatic members. This means that SF State students can enjoy many of the events and programs provided by fellow students that might have cost them even more without this one time semester fee. Explore our website and find out what Associated Students can do for you. Programs -- Associated Students fund and administer 14 student initiated and led programs and services that are unique to SF State. Programs are focused but not limited to providing services that enrich and improve student life, such as live shows, movie nights, festivals, crafts fair, etc. By the students --Associated Students serves as the voice of student interests and promotes an enriched co-curricular university life experience. We are dedicated to the empowerment of SF State s diverse student body with the combined efforts of various programs and departments throughout campus, providing student services and programs, while encouraging external advocacy efforts. Source: SF State website 96 P age
98 Associated Students of San Francisco State University Years Ended June 30, 2017 (with comparative totals for June 30, 2016) Statements of Activities and Changes in Net Assets Unrestricted 2017 General Children's Center Facility Student Organization Banking Temporarily Restricted 2016 Revenue and Supports: Student activity fees $ 6,801,618 $ - $ - $ - $ 6,801,618 $ 6,652,796 Programs fees 971, ,128-1,227,416 1,302,404 Investment income, net 159, , ,217 Contribution and grants 730,857-6, ,247 1,011, ,507 Net assets related from restrictions: Satisfaction of program restrictions 347, (347,954) - - revenue and support 9,011, ,982 (73,707) 9,200,676 9,020,924 Expenses: Student services 3,146, ,146,994 3,314,788 Student government 368, , ,168 Community services 310, , ,726 Student organizations 111, , ,050 53,695 Management and general 3,495,978 42,019-3,537,997 3,682,567 expenses 7,433,998 42, ,151-7,603,168 7,568,944 Change in Net Assets 1,577,403 (42,019) 135,831 (73,707) 1,597,508 1,451,980 Other Net Asset Transfers (374,074) 374, Net Assets - Beginning of year 12,274,948 3,693, ,422 16,140,147 14,688,167 Net Assets - End of the Year $ 13,478,277 $ 4,025,832 $ 135,831 $ 97,715 $ 17,737,655 $ 16,140,147 Source: Financial Statements Grant Thorton LLP 97 P age
99 FOUNDATION The San Francisco State University Foundation (the Foundation) is a non-profit corporation that raises and manages gifts from individuals, foundations and corporations solely for the benefit of San Francisco State University. The Foundation is comprised of business and civic leaders who care about the University and who advance its mission by seeking and securing private support for its programs. Established in 2007, the Foundation is the catalyst and conduit through which gifts and endowment income flow. The Foundation is governed by board members who comprise a powerful network of business and civic leaders who share their exceptional expertise on a vast range of topics, from sustainability to investment management, from marketing to government relations. They evangelize on behalf of the University and help raise funds to support scholarships and facilities, as well as an array of exciting programs that help create promising futures for students. We engage with alumni, parents, friends and businesses to secure and deepen support for San Francisco State. The Foundation works with its investment management firm, Cambridge Associates to manage the University s growing endowment by determining acceptable risks in the portfolio, maximizing investment returns, minimizing investment expenses and improving endowment reporting and stewardship. The Foundation s $83.7 million endowment is comprised of over 330 individual endowment funds. In FY , the Foundation board approved up to 4% of the endowment or $2,445,715 to the campus for scholarships, endowed chair, campus programs, fellowships and other purposes. The Foundation s goal is to increase the endowment to $100 million by 2020 to expand its support to students and the campus community. Source: SF State Foundation 98 P age
100 SAN FRANCISCO STATE UNIVERSITY FOUNDATION Budget for FY All Funds Revenue Program Revenue (1,567,846) (1) Non-operating Revenue (5,262,413) (2) Revenue (6,830,259) Expenditures Management and General 733,235 (3) Non-operating expenses 805,703 (4) Transfer to University Corporation, SF State 2,445,715 (5) Expenditures 3,984,653 Operating (Gain)/Loss (2,845,606) Net Assets, end of year (86,589,117) Footnotes: (1) Program revenue entails Admin fee earned by the Foundation managing the endowments (2) Non-operating Revenue represents projected contribution based 3 year average of contributions received by the Foundation the last 3 fiscal years (3) Management and General includes general unrestricted operating expenses of the Foundation (4) Non-operating expenses include investment fees covered by admin fee earned by the Foundation and other campus support provided by the Foundation to SF State (5) Projected endowment pay out for associated spending accounts held at UCorp Source: SF State Foundation (Increase)/Decrease in Net Assets (2,845,606) Net Assets, Beginning of the year, as previously reported (83,743,511) Prior Period Adjustment - Net Assets, beginning of the year, as restated (83,743,511) 99 P age
101 UNIVERSITY CORPORATION The University Corporation, San Francisco State (UCorp) is a not-for-profit, public benefit corporation devoted to furthering the educational mission of San Francisco State University. UCorp provides resources to the University that enrich the SF State experience for its students, faculty, and staff. In fulfilling its mission, UCorp performs a variety of services for the campus community. Specifically, it oversees commercial operations, administers various educational grants and contracts for the University, and oversees the fiscal administration of numerous University programs. UCorp also provides accounting services to the other auxiliary corporations on campus. All of these services are coordinated with the campus community to enhance the educational and cultural environment of the University and the surrounding community it serves. As the University s key business partner, U Corp manages programs and reduces risk to the University. Additionally, U Corp works with the campus community to advance real estate projects through unique delivery strategies in support of a robust capital planning program aimed at providing additional housing for the campus community. UCorp is lead by a board of directors, which works closely with its staff and advisors to ensure that its activities further the university s mission and that its assets are prudently managed in the best interest of the university community. Its assets, derived from commercial operations, administrative fees, and investment income, are a valuable resource and further the university s needs. The corporation s assets are managed in a manner that reflects the values and aspirations of the university community, and provides a dependable revenue stream to further its efforts. Source: UCorp 100 P age
102 The University Corporation San Francisco State Budget for FY All Funds Operating Revenue: Grants and Contract revenue 1,614,186 (1) Program Revenue 4,009,114 (1) Retail Revenue 1,881,742 Rental Income 2,078,080 Other Revenue 100,000 Non-operating Revenue 3,231,695 (2) Revenue 12,914,817 Expenses: UCorp Unrestricted Operating Expenses Retail Expenses 758,756 Rental Expenses 1,704,087 Management and General 2,104,353 Depreciation 222,998 4,790,194 Restricted Operating Expenses Grant and Contracts 1,357,956 Campus Programs 5,099,833 Student Scholarships 1,254,780 7,712,569 (3) Expenses 12,502,762 Operating Gain/(Loss) 412,055 Footnotes: (1) Represents restricted revenue that is received by UCorp to support colleges, departments and provide services. Restricted Revenue presented here is based on the avg of 3year actuals as Ucorp does not actually budget these funds as it does not have discrectional authority over these funds. Through out the year the programs operate on a cash operating basis. (2) Non-operating income is from sources not part of UCorp's primary business function such as interest and investment income, gains in the fair value of UCorp investment portfolio, and donations and contributions supporting restricted programs. (3) Restricted Operating Expenses are support activities whose source of funds come from donations & contributions, Grants and Contracts, and fee for service type programs. These expenses are for activities of support programs of SF State colleges and departments Source: UCorp Net Income 412, P age
103 GRANTS AND CONTRACTS in thousands Revenues Federal Grants & Contracts 20,773 State Grants & Contracts 2,121 Local Grants & Contracts 1,755 Non Governmental Grants & Contracts 2,362 Revenues 27,011 Expenses Salary & Wages 9,264 Benefits 2,919 Salary & Benefits 12,183 Contractual Services 778 Honorarium 130 IT Equipment & Supplies 140 Rental 77 Stipends 3,684 Subrecipient 2,658 Supplies & Service 2,373 Travel 535 Tuition & Fees 539 Other Operation Expenses 120 Operating Expenses 11,033 Facilities & Administrative Costs 3,795 Expenses 27,011 Net Revenue (Expenses) (0) 102 P age
104 LOTTERY FUND in thousands Revenues CSU Allocation 2,091 Revenues 2,091 Educational Equity Program: Outreach High School 25 Outreach-Community College 50 Community Access-Student Affairs 23 EOP Summer Bridge / Mentor Program 82 SSS / Trio Program 32 Future Scholars Program 30 Student Affairs & Enrollment Management 242 Teach Diversity-Math & Science Initiative 237 Campus Academic Resource Program 190 Academic Affairs 427 Educational Equity Program 669 Discretionary Expenditures: Academic Affairs Instructional Equipment 1,422 Expenses 2,091 Net Revenues (Expenses) - Prior Year fund Balance-Undesignated 649 Projected Ending Fund Balance P age

105 104 P age CAPITAL PLAN AND FY17-18 CAPITAL BUDGET
106 FRAMEWORK The capital budget s core function is to help control expenditures. Spending limits are set by the University through the adoption of the capital budget and through the authorization for individual capital projects. Just like an annual operating budget, a multi-year capital budget can require difficult decisions and involves the balancing of scarce resources with apparently unlimited demands. All the preliminary work will make decisions easier, and not everything has to be accomplished and paid for in a single year. Within fiscal constraints, the nature and importance of individual projects will dictate which ones will be accomplished in year one and which ones will be accomplished in years two, three, four, and beyond. The capital budget is, in general, adopted at the same time as the University's annual consolidated budget and may either be a section of that budget or attached as a separate document. The capital budget's financial overview lists the capital projects to be funded in the current year and the funding source, as well as expenditure projections. A detailed description of each project should be listed in the capital budget, along with a statement of purpose, the method of financing, and a schedule for completion. FUNDING Capital projects and acquisitions can consume large amounts of financial resources. A multiyear capital plan helps manage this consumption by scheduling expenditures over a number of years and by creating a financial plan to meet those expenditures. A long-term schedule of capital projects gives organizers time to arrange for sufficient financing. A financing strategy should balance expected project requirements with good fiscal practices. Adhering to established financial policies, establishing accurate cash flow projections, and considering various funding alternatives are just some ways to achieve this balance. There are a number of options for financing capital projects and purchases, especially with several years in advance to arrange for funding. A good plan will allow leadership to examine each of these funding options and pursue the combination that works best for the University. 105 P age
107 Option I: University Resources State Appropriations & Tuition Fees The first option a state university should examine when considering capital project financing is funding all or some of the project by appropriations from the annual operating budget, which is a large component of what is sometimes called pay-as-you-go financing. The most common sources of this funding are state appropriations and tuition fees. Each year's budget may contain provisions for partial or total funding for chosen assets. For example, it could provide funding for a certain number of new work trucks in each year's budget, to be paid for out of current appropriations. Advantages of pay-as-you-go financing include improving the University s overall financial condition by increasing flexibility to adapt to future circumstances and preserving the ability to borrow for other needs. It can also expedite small or recurring projects. For those capital items that are replaced regularly, pay-as-you-go practices can provide an equitable and cost-effective financing option. The benefit of receiving new equipment every year is matched with the annual payments. The major disadvantage of using current appropriations is a potential need to implement a fee increase. Besides being administratively unpopular, increasing fees are not common at this time. Opportunity costs can occur, if resources that could be used for other purposes are tied up in funding capital projects. Fund Balances (Reserve) The University needs to maintain a reasonable fund balance as insurance against unanticipated expenditures or revenue shortfalls. The portion of the fund balance that is allowed for capital financing is the unreserved fund balance. The University s fund balance cannot exceed four months of the budget year s operating revenues. The danger in relying on fund balances for capital financing is that they may decrease or become unavailable in future budget years; therefore, it is important to establish reasonable projections and maintain other financing options. Trust Funds To warrant that the money is available when needed for capital purposes, the University should consider establishing reserve funds. Through proper determination, the University can establish reserve funds earmarking resources for the future acquisition of essential capital assets. For 106 P age
108 example, reserve funds may be funded through an available fund balance or appropriations. The use of such reserve funds would then be listed as a funding source, where applicable, in a multi-year capital plan. The reserve funds, including two types: Designated Campus Reserves Improvements (Campus-I) and Designed Campus Reserves Maintenance (Campus-M). Enterprise Program Funds Enterprise programs/activities/fund sources include those that furnish facilities, goods or services to students, faculty, staff, or incidentally to the general public. An enterprise typically charges a user fee, rent, or other charge directly related to, although not necessarily equal to, the cost of the facilities, goods or services. These funds consist of all revenues received from operations of dormitories, housing facilities, health facilities, student union or activity facilities, parking facilities acquired or constructed by the Trustees, and self-support instructional programs. Through proper determination, the University Enterprise can establish reserve funds (construction earmarking resources for the future acquisition of essential capital assets. For example, reserve funds may be funded through an available fund balance or appropriations. The use of such reserve funds would be listed as a funding source, where applicable, in a multiyear capital plan. Option II: State and Federal Assistance State and federal assistance may come in the form of grants and/or low-interest or zerointerest loans for qualified projects. A good source for updated information on grants offered by the state of California is Grants.gov ( which lists funding administered by state agencies. Additional useful online resources include the following: For information on state contracts, which can allow a local government substantial savings on the purchase of equipment, see For details regarding federal assistance, visit the Catalog of Federal Domestic Assistance (CFDA) at: CFDA is a government-wide compilation of federal programs, projects, services and activities that provide benefits to the public. It contains financial and non-financial assistance programs administered by departments of the federal government. An option allowing visitors to search for programs administered under the American Recovery and Rehabilitation Act (ARRA) is available at: major portion of funding, according to the site, is shifting to long-term economic opportunities in transportation, energy and community development. 107 P age
109 Option III: Private Funding Donations and grants (DON/GRA) are at the head of any financing wish list. The University should examine financing from federal and state sources and take advantage of any private gifts or services available to help acquire equipment or to reduce a project's cost. CSU /UC cooperative arrangements may also be possible, depending on the particular terms and conditions, often subject to negotiation. There also may be instances when private firms or individuals can provide funding for capital projects or acquisitions, and that funding source should not be overlooked. Public-private partnerships (PPP) work best for large-scale projects in which the private entity receives a tangible (or, sometimes, intangible) benefit. For example, corporations may bid on naming rights to an athletics stadium or performing arts venue, providing the University with significant funds. Philanthropic organizations may be the source of grants or gifts. A community or fraternal organization may contribute money or labor to a project that will enhance the community as a whole. The limited state and CSU revenues available for cogeneration and other major capital outlay energy projects, the legislature has permitted alternative financing arrangements, including taxexempt bond financing for energy projects and third party financing. The Board of Trustees has encouraged campuses to seek alternative means of financing energy efficiency projects in keeping with the CSU program to conserve energy. This is the impetus behind the Statewide Solar Energy, Phase 4 project approved by the board in This program enables campuses to enter into Energy/Power Purchase Agreements (ENG) or solar leases with service providers that will fund, install, own, and operate solar energy installations that will sell carbonfree electricity to CSU campuses for a period of 20 years and reduce carbon emissions from electricity purchases without impacting CSU s credit capacity. Option IV: Financed Funding Issuing debt allows a university to pay for capital infrastructure and equipment that it might not otherwise be able to afford. Below is a brief overview of types of debt that can be issued for capital projects: Statewide Revenue Bond (SRB). SRBs are a form of long-term borrowing the state uses to finance public improvements, including state office buildings, state universities, prisons, and food and agricultural facilities. Like a GO bond, a SRB is, in effect, an IOU. Unlike GO bonds, however, SRBs are not backed by the full faith and credit of the state, and may be authorized by law without voter approval. Revenue bonds are a form of long-term borrowing state agencies use to finance an income-generating project, such as water projects, higher education facilities, or other public facilities built with the proceeds of the 108 P age
110 financing. Income generated by the project goes first toward meeting debt service on the bonds (i.e., paying interest to bondholders) and retiring the bonds at maturity. Unlike GO bonds, revenue bonds are not backed by the state s full faith and credit or its taxing authority. Commercial Paper (CP). CP is an unsecured form of promissory note that pays a fixed rate of interest. It is typically issued by large banks or corporations to cover short-term receivables and meet short-term financial obligations, such as funding for a new project. Lease-Purchases (also known as Installment Purchases). Typically secured by the property or equipment being financed, these are purchases with payments occurring over time. Regardless of the type of debt used to finance a capital project, the principal and interest payments to retire the debt must be planned for in each year's budget for the life of the obligation. Similarly, periodic lease-purchase payments must be accounted for in the capital plan. 109 P age
111 THE CAPITAL PLAN BUDGETING PROCESS a. San Francisco State University maintains a five-year capital plan, which includes a one-year capital budget and a plan for the next four years. b. Each February, the management center will ask departments and schools for project proposals to be considered for funding as the next fiscal year's capital budget is developed. The Capital Planning, Design and Construction (CPDC) office consolidates capital budgets for review by the management center. c. Each school or department must prioritize requests internally and identify funding sources in their submission. d. The CPDC office will receive all department and school project requests, estimated and consolidated for CPDC review, estimation, and submission to the management center for further review. d. Capital budget requests are coordinated through the appropriate management center, which must review and approve them before they are submitted to the vice president (VP) for Administration and Finance. e. When necessary, the VP for Administration and Finance will request a meeting to discuss project details. f. Capital projects expected to span more than one fiscal year require a cash flow analysis prepared by the CPDC. g. In addition, the management center analyzes the annual capital plan's impact on debt ratios (i.e., expendable resource ratio, interest expense to operations, and debt service coverage ratio). h. Each May through August, the University submits the five-year capital improvement plan to the Chancellor s Office for projects that are classified as Capital Improvement projects (CIMP), state or non-state funded projects, and includes the capital budget for the next fiscal year and recommends approval to the BOT. The University president will review and approve the submittal. The detailed process is outlined in the system wide State University Administrative Manual (SUAM Section VII -Five-Year Capital Improvement Program Procedures and Formats for the capital outlay submission Sections ), available online at: I. Each year in November, the Board of Trustees will approve the final five-year capital improvement plan. h. Only the VP for Administration and Finance may modify the capital budget, which is the first year of the five-year capital plan. However, schools and departments may continue to update out-year plans (i.e., plans for years two through five) with the most current information. 110 P age
112 THE CAPITAL PLAN, FY17-18 TO FY22-23 OVERVIEW This chapter provides an overview of the capital planning process, describes current strategic initiatives, presents the FY17-18 to FY22-23 Capital Plan (CP) and related constraints, and discusses the FY17-18 Capital Budget (CB). SF State s FY17-18 to FY22-23 Capital Plan and FY17-18 Capital Budget are based on projections of the major capital projects that the university will pursue in support of its academic mission. The rolling Capital Plan includes projects that are in progress or are expected to commence during the five years it covers. The Capital Budget represents the anticipated capital expenditures in the first of these years. Both the Capital Plan and the Capital Budget are subject to change based on funding availability, budget affordability, and university priorities. The CP is a short-range plan, usually four to 10 years, which identifies projects intended to implement campus plans, facilities plans, and the Master Plan. The SF State campus has one of the oldest building stocks of all CSU campuses, and this fiveyear plan begins to address updating the campus in the critical areas of life and safety, new facilities, and modernization. Since the CP includes estimates of all capital needs, it provides the basis for setting priorities, reviewing schedules, developing funding policies for proposed improvements, monitoring and evaluating the progress of capital projects, and informing the public of projected capital improvements and unfunded needs. Projects included in the CP are Non-Recurring Maintenance/Repair (NRMR) and Capital Improvement Projects (CIMP), real estate leases and leasehold improvements, equipment purchase have a long service life, are generally over $50,000 and will be under-way from FY17-18 to FY Although the Capital Plan covers a five-year planning period, it is updated annually to reflect ongoing changes as new projects are added, existing projects are modified, and completed projects are removed from the program document. 111 P age

113 CAPITAL PLAN FY17-18 TO FY22-23 PRESENTED BY FUNDING TYPE SF State CP By Fund Type FINANCED 53% STATE APPROPRIATION 10% RESERVE 16% ENTERPRISE PROGRAM 21% Thousands SF State CP To By Fund Type STATE APPROPRIATION TRUST RESERVE PRIVATE FINANCED ENTERPRISE PROGRAM - Approved FY Planning FY Planning FY Planning FY Planning FY Planning FY Funds to complete Fund Type Approved FY Planning FY Planning FY Planning FY Planning FY Planning FY Funds to complete ENTERPRISE PROGRAM 13, ,150 FINANCED 33,892 43, , , , ,087 - STATE APPROPRIATION 6, PRIVATE 2 23, ,839-10,000 97,180 RESERVE 10,266 16,162 14,591 10,650 8,759 8,113 30,000 TRUST GRAND TOTAL $ 63,647 $ 83,182 $ 355,958 $ 490,417 $ 129,150 $ 255,200 $ 131, P age
114 CAPITAL PLAN FY17-18 TO FY22-23 PRESENTED BY CABINET SF State CP By Cabinet ACADEMIC AFFAIRS 59% CAMPUS WIDE 19% ADMINISTRATION & FINANCE 8% ASSOCIATED STUDENTS 10% STUDENT UNION 1% STUDENT AFFAIRS 1% U-CORP 2% Thousands SF State CP To By Cabinet Approved FY Planning FY Planning FY Planning FY Planning FY Planning FY Funds to complete ACADEMIC AFFAIRS ADMINISTRATION & FINANCE ASSOCIATED STUDENTS STUDENT AFFAIRS STUDENT UNION U-CORP CAMPUS WIDE Cabinet Approved FY Planning FY Planning FY Planning FY Planning FY Planning FY Funds to complete ACADEMIC AFFAIRS 37,518 67,298 27, , , ,900 - ADMINISTRATION & FINANCE 4, , , ,000 ASSOCIATED STUDENTS 6, STUDENT AFFAIRS STUDENT UNION U-CORP 1, ,330 CAMPUS WIDE 12,210 15,884 11,512 11,512 11,512 11,300 30,000 GRAND TOTAL $ 63,647 $ 83,182 $ 355,958 $ 490,417 $ 129,150 $ 255,200 $ 131, P age

115 CAPITAL PLAN FY17-18 TO FY22-23 PRESENTED BY PROJECT CATEGORY NEW FACILITIES/INFRASTRU CTURE 10% SF State CP By Category MODERNIZATION/RENOVATION 59% PLANNING 7% AMERICAN DISABILITY ACT 1% CRITICAL INFR/DEFICIENCIES 11% FIRE/LIFE SAFETY 4% INFRASTRUCTURE IMPROVEMENTS 7% EQUIPMENT LEASE 1% Thousands SF State CP To By Category Approved Planning Planning Planning Planning Planning FY FY FY FY FY FY Funds to complete PLANNING NEW FACILITIES/INFRASTRUCTURE MODERNIZATION/RENOVATION EQUIPMENT LEASE INFRASTRUCTURE IMPROVEMENTS FIRE/LIFE SAFETY CRITICAL INFR/DEFICIENCIES AMERICAN DISABILITY ACT Category Approved FY Planning FY Planning FY Planning FY Planning FY Planning FY Funds to complete AMERICAN DISABILITY ACT CRITICAL INFR/DEFICIENCIES 7,202 37,144 11,300 11,300 11,300 11,300 - FIRE/LIFE SAFETY 2, ,000 INFRASTRUCTURE IMPROVEMENTS 4, EQUIPMENT LEASE MODERNIZATION/RENOVATION 37,793 45,525 27, , , ,900 3,000 NEW FACILITIES/INFRASTRUCTURE 6, , , PLANNING 4, ,330 GRAND TOTAL $ 63,647 $ 83,182 $ 355,958 $ 490,417 $ 129,150 $ 255,200 $ 131, P age
116 Fund Type Project Name ( Bldg. -Title) CAPITAL PLAN FY17-18 TO FY22-23 BY PROJECT DETAIL Yr (Cfw+New) FINANCED BUS-Heating System Replacement - 2, ,070 RESERVE BUS-Heating System Replacement BUS-Heating System Replacement - $ 2, $ 2,300 RESERVE CA- BECA Bldg. / 800 Seat Concert hall Conceptual Design RESERVE CA- BECA Bldg. Site& Programming Selection Study RESERVE CA- BECA Replacement - Planning STATE APPROPRIATION CA-BECA Replacement Building 1, ,667 PRIVATE CA-BECA Replacement Building - 23, ,080 FINANCED CA-BECA Replacement Building / C Ph 27,834 12,099 15, ,933 FINANCED CA-BECA Replacement Building / W Ph CA-BECA Replacement Building $ 29,907 $ 35,179 $ 15, $ 80,086 RESERVE CW-Campus Master Plan 15/ RESERVE CW-Campus Master Plan 16/17 1, ,484 RESERVE CW-Campus Master Plan 17/18 1, ,000 CW-Campus Master Plan $ 2, $ 2,498 FINANCED CW-Central Plant/Campus Utility Risk Projects - 1, ,575 RESERVE CW-Central Plant/Campus Utility Risk Projects CW-Central Plant/Campus Utility Risk Projects - $ 1, $ 1,750 FINANCED CW-Cox Stadium, CA, BUS ADA Restroom Upgrade - 1, ,436 RESERVE CW-Cox Stadium, CA, BUS ADA Restroom Upgrade CW-Cox Stadium, CA, BUS ADA Restroom Upgrade - $ 1, $ 1,596 RESERVE CW-Data Center Electrical Upgrades FINANCED CW-Data Center-Emergency Power and Condenser RESERVE CW-Data Center-Emergency Power and Condenser CW-Data Center-Emergency Power and Condenser - $ $ 968 FINANCED CW-Fire Alarm System Repair (ADA) RESERVE CW-Fire Alarm System Repair (ADA) CW-Fire Alarm System Repair (ADA) - $ 1, $ 1,097 FINANCED CW-Fire Hydrants - Ph RESERVE CW-Fire Hydrants - Ph CW-Fire Hydrants - Ph. 2 - $ 1, $ 1,000 STATE APPROPRIATION CW-Gas Line Replacement FINANCED CW-Gas Line Replacement - 1, ,311 RESERVE CW-Gas Line Replacement CW-Gas Line Replacement $ 691 $ 1, $ 2,148 FINANCED CW-Infrastructure Improvements - - 8,910 8,910 8,910 8,910-35,640 RESERVE CW-Infrastructure Improvements CW-Infrastructure Improvements - - $ 9,000 $ 9,000 $ 9,000 $ 9,000 - $ 36,000 FINANCED CW-LED Streetlight Retrofit, Ph. 2-1, ,080 RESERVE CW-LED Streetlight Retrofit, Ph CW-LED Streetlight Retrofit, Ph. 2 - $ 1, $ 1,200 FINANCED CW-Portable Generator Quick Connects - 1, ,697 RESERVE CW-Portable Generator Quick Connects CW-Portable Generator Quick Connects - $ 1, $ 1,886 FINANCED CW-Sanitary Sewer/Storm/Domestic Water Projects - 2, ,176 RESERVE CW-Sanitary Sewer/Storm/Domestic Water Projects CW-Sanitary Sewer/Storm/Domestic Water Projects - $ 2, $ 2,418 Planning FY Planning FY Planning FY Planning FY Planning FY Funds to Complete Budget Impact 115 P age
117 Fund Type Project Name ( Bldg. -Title) Yr (Cfw+New) ENTERPRISE PROGRAM Dining Center & 7 Hills Improvement 2, ,278 ENTERPRISE PROGRAM Dining Center & 7 Hills Improvement Dining Center & 7 Hills Improvement $ 2, $ 2,578 FINANCED Electrical Substation Replacement 3, ,930 RESERVE Electrical Substation Replacement Electrical Substation Replacement $ 3, $ 3,967 RESERVE ES-PSY New Elevator and Elevator Modernization FINANCED ES-PSY New Elevator and Elevator Modernization - 2, ,706 ES-PSY New Elevator and Elevator Modernization $ 315 $ 3, $ 3,322 FINANCED FA-Fire Alarm Replacement RESERVE FA-Fire Alarm Replacement FA-Fire Alarm Replacement - $ 1, $ 1,022 FINANCED HH Sprinkler System and Fire Alarm - 3, ,698 RESERVE HH Sprinkler System and Fire Alarm HH Sprinkler System and Fire Alarm - $ 4, $ 4,109 ENTERPRISE PROGRAM Holloway Student Housing PRIVATE Holloway Student Housing ,180 97,180 Holloway Student Housing $ $ 97,180 $ 97,465 FINANCED HSS- North Classroom Replacement Bldg ,748-74,748 RESERVE HSS- North Classroom Replacement Bldg ,126 2,152-4,278 HSS- North Classroom Replacement Bldg $ 2,126 $ 76,900 - $ 79,026 FINANCED HSS- South Classroom Replacement Bldg.(Seismic) , ,429 RESERVE HSS- South Classroom Replacement Bldg.(Seismic) ,125 4,243 2,571-10,939 HSS- South Classroom Replacement Bldg.(Seismic) $ 4,125 $ 4,243 $ 156,000 - $ 164,368 FINANCED Lower Valley Housing. Ph , ,245 FINANCED Lower Valley Housing. Ph , ,830 Lower Valley Housing - - $ 317,245 $ 204, $ 522,075 RESERVE North Campus District Plan (Formerly Winston) TRUST North Campus District Plan (Formerly Winston) North Campus District Plan (Formerly Winston) $ $ 113 FINANCED RTC-Seismic, Infrastructure, ADA, and Modernization Upgrade - 5, ,418 RESERVE RTC-Seismic, Infrastructure, ADA, and Modernization Upgrade RTC-Seismic, Infrastructure, ADA, and Modernization Upgrade - $ 6, $ 6,020 FINANCED SCI-Replacement Building , ,976 PRIVATE SCI-Replacement Building ,839-10, ,839 RESERVE SCI-Replacement Building - 9,846 8, ,052 RESERVE SCI-Replacement Building - Preliminary Phase SCI-Replacement Building $ 242 $ 9,846 $ 8,206 $ 265,815 - $ 10,000 - $ 294,109 FINANCED TH Renovation , ,269 RESERVE TH Renovation ,995 4,135-1,000-9,630 TH Renovation - $ 500 $ 3,995 $ 4,135 $ 111,269 $ 1,000 - $ 120,899 FINANCED TH Sprinkler System and Fire Alarm - 3, ,423 RESERVE TH Sprinkler System and Fire Alarm TH Sprinkler System and Fire Alarm - $ 3, $ 3,803 FINANCED TH-ADA Restroom Upgrade - 1, ,361 RESERVE TH-ADA Restroom Upgrade TH-ADA Restroom Upgrade - $ 1, $ 1,512 Planning FY Planning FY Planning FY Planning FY Planning FY Funds to Complete Budget Impact 116 P age
118 Fund Type Project Name ( Bldg. -Title) Yr (Cfw+New) RESERVE ADM- H&V RESERVE ADM-1st Floor Ceiling & Lighting RESERVE ADM-Roof Replacement TRUST Alumni Visitors Center RESERVE BH & Gym-Sewerage Repairs RESERVE BH -Elevator C Modernization RESERVE BH-Hallway Floor Replacement RESERVE BH-Replace Roofing System RESERVE BH-Sewer Pipe Replacement RESERVE CA-Replace Roofing System at McKenna ENTERPRISE PROGRAM CCSC- Sustainability (LED Lighting) ENTERPRISE PROGRAM CCSC-Gold Coast Dining Seating & Plaza View Seating Booths ENTERPRISE PROGRAM Children Center-Exterior Painting TRUST Children's Campus Roof Gutter Replacement TRUST Children's Campus Roof Joints & Vents Repairs RESERVE Corp. Yard Emergency Transfer Switches ENTERPRISE PROGRAM Crossroads Neighborhood Study STATE APPROPRIATION CW-Redundant 12kV Feeders at Main Station RESERVE CW-Rekeying BUS, HSS, & Old ADM Bldgs STATE APPROPRIATION CW-Replacement of 12kV Feeders RESERVE CW-Main Electrical maintenance-testing RESERVE CW-Landscape Master Plan FINANCED CW-Increase Fire Hydrant Coverage-Main Campus 1, ,010 RESERVE CW ADA Pathways / Roadways Maintenance RESERVE CW AED Installation RESERVE CW Door Replacement RESERVE CW- Door replacement RESERVE CW Elevator Door Upgrade RESERVE CW- Elevators Improvement RESERVE CW- Fire Sprinkler System RESERVE CW- Install low flow toilet fixture RESERVE CW-Accessible Path RESERVE CW-ACM & Lead Removal RESERVE CW-Deferred Maintenance - 2,300 2,300 2,300 2,300 2,300-11,500 RESERVE CW-Door Replacement STATE APPROPRIATION CW-Emergency Phones RESERVE CW-Fire Alarm / Sprinkler - (WD Phase) 1, ,000 31,033 RESERVE CW-Fleet Electric Vehicles Leasing ,136 TRUST DTC Frame Opening Installation ENTERPRISE PROGRAM DTC-Gender Neutral Restroom ENTERPRISE PROGRAM ECEC-Forced Air Heating System RESERVE FA-Window System Replacement RESERVE FA- Fire Alarm Redesign/Repair RESERVE FA- Gallery Museum Project RESERVE Hensill Hall-Chiller Replacement RESERVE HSS- Ext Window Replacement RESERVE LCA Theatre Safety Upgrade RESERVE Library - Emergency Phone ENTERPRISE PROGRAM Mary's Tripling Study ENTERPRISE PROGRAM Mashouf Wellness Center 6, ,476 RESERVE Old ADM-HVAC Improvements Planning FY Planning FY Planning FY Planning FY Planning FY Funds to Complete Budget Impact 117 P age
119 Fund Type Project Name ( Bldg. -Title) Yr (Cfw+New) RESERVE RTC - Building 30 Roofing System Replacement RESERVE RTC - Sewer System Upgrade STATE APPROPRIATION RTC- Electrical System Upgrade FINANCED RTC Emergency Seismic Repairs RESERVE RTC Master Plan RESERVE RTC Site Assessment TRUST RTC-Nielson Lab Renovation STATE APPROPRIATION RTC-Seismic Upgrade Ph. 1 (Bldg 49 and 50 Seismic Repairs) 2, ,148 PRIVATE SCI - Room 395 Data Outlets RESERVE Science- Roof AHU 1&2 Replacement ENTERPRISE PROGRAM SHC- Atrium Phase I ENTERPRISE PROGRAM Site CC1 Student Housing RESERVE SSB- Elevator Improvements ENTERPRISE PROGRAM Station Café Replacement ,150 1,200 RESERVE TH-Fire Marshal Corrections ENTERPRISE PROGRAM University Club Renovation 1, ,200 RESERVE UP-Head End Security System Replacement ENTERPRISE PROGRAM UPM-Emergency Wiring Repairs to Fire Alarm Voice Annunciation System ENTERPRISE PROGRAM UPN- Garden Unit Exterior Repairs FINANCED UPN Toilets Upgrade ENTERPRISE PROGRAM UPN-Garden Unit Exterior Repairs and Painting ,000 3,740 Grand $ 63,647 $ 83,182 $ 355,958 $ 490,417 $ 129,150 $ 255,200 $ 131,330 $ 1,508,883 Planning FY Planning FY Planning FY Planning FY Planning FY Funds to Complete Budget Impact 118 P age
120 THE CAPITAL BUDGET, FY17-18 The Year One FY17-18 Capital Plan contains 82 projects, including 19 projects that are new this year. Of the new projects about $6.5 million are from different funding sources this year, 12 projects in $2.3 million for Deferred Maintenance (DM), $2.1 million for RTC Seismic Upgrade Phase 1 Project, and $2.1 million for the others capital projects. Of this total, 74 projects are fully funded and seven are partially funded (a funded project is one that has identified specific funding to implement the program. An unfunded project is one that has been identified in the Capital Plan as a need, but has no funding secured to implement the program). The full fiveyear program is summarized according to funding status. Of the Campus $1.5 billion five-year need, $64 million or four percent is funded. This document includes project details for the major projects, capital budget process, schedule, and glossary of funding sources. At $64 million, the Capital Plan reflects the significant investment SF State continues to make in its facilities, driven by the academic priorities for teaching, research, and related activities, and the initiatives of the administrative and auxiliary units that support the academic mission. With the completion of the FY16-17 projects, SF State will have invested at least $85 million in its facilities, infrastructure, and commercial real estate since In addition to the many projects currently under way and previously forecasted, the Capital Plan now includes the following new projects and programs: BECA that is approximately 5% out of the total financed projects, RTC and electrical substation, and campus master plan. The following three significant projects make up 64% of the University s Capital Plan: 1. Lower Valley Housing Phase 1 and 2 estimated total costs $522 million. 2. Science Replacement Building estimated total costs $294 million 3. Health and Social Sciences South Classroom Replacement Building (Seismic) estimated total costs $164 million 119 P age

121 IN PROGRESS CAPITAL CARRYFORWARD BUDGET Fund Type Carryforward Budget (in thousands) ENTERPRISE PROGRAM 3,814 FINANCED 5,916 STATE APPROPRIATION 3,477 PRIVATE 12 RESERVE 14,529 TRUST 435 GRAND TOTAL $28,182 SF State In Progress Capital CFW Budget RESERVE 52% TRUST 2% FINANCED 21% ENTERPRISE PROGRAM 13% STATE APPROPRIATION 12% Summary below provides detail of capital projects that were approved in prior fiscal years,did not receive additional funding in FY ,are currently in progress and not yet completed. Fund Type Category Cabinet Project No. Project Name ( Bldg. -Title) Budget STUDENT HEALTH Modernization/Renovation Student Affairs SHC- Atrium Phase I 600 CEL American Disability Act Academic Affairs DTC-Gender Neutral Restroom 250 CCSC Critical Infrastructure/Deficiencies Student Union CCSC- Sustainability (LED Lighting) 170 CCSC Modernization/Renovation Student Union DM16CCSC7 CCSC-Gold Coast Dining Seating & Plaza View Seating Booths 160 ASI Planning Associated Students Children Center-Exterior Painting 8 ASI Critical Infrastructure/Deficiencies Associated Students DM16ECEC1 ECEC-Forced Air Heating System 185 HOUSING Planning University Wide DM16CN001 Crossroads Neighborhood Study 150 HOUSING Modernization/Renovation Administration & Finan UPN- Garden Unit Exterior Repairs 100 HOUSING Planning Administration & FinanDM16LV001 Site CC1 Student Housing 300 HOUSING Planning Administration & FinanDM16MTS01 Mary's Tripling Study 150 HOUSING Fire/Life Safety Administration & FinanDM16UPM01 UPM-Emergency Wiring Repairs to Fire Alarm Voice Annunciation Syst 41 HOUSING Modernization/Renovation Administration & FinanDM16UPN01 UPN-Garden Unit Exterior Repairs and Painting 1,700 ENTERPRISE PROGRAM FUNDING $ 3,814 SRB Critical Infrastructure/Deficiencies University Wide Electrical Substation Replacement 4,280 SRB Infrastructure Improvement University Wide DM16CW003 CW-Increase Fire Hydrant Coverage-Main Campus 1,048 SRB Modernization/Renovation Academic Affairs DM16RTC03 RTC Emergency Seismic Repairs 508 SRB Modernization/Renovation Administration & FinanMC16UPN01 UPN Toilets Upgrade 80 FINANCED FUNDING $ 5, P age
122 Fund Type Category Cabinet Project No. Project Name ( Bldg. -Title) Budget CSU FUNDING - DM Critical Infrastructure/Deficiencies Academic Affairs RTC- Electrical System Upgrade 982 CSU FUNDING - DM Fire/Life Safety University Wide DM15CW001 CW-Emergency Phones 385 CSU FUNDING - DM Critical Infrastructure/Deficiencies University Wide MC16CW001 CW-Replacement of 12kV Feeders 960 CSU FUNDING - DM Critical Infrastructure/Deficiencies University Wide MC16CW002 CW-Redundant 12kV Feeders at Main Station 350 CSU FUNDING - DM Critical Infrastructure/Deficiencies University Wide MC16CW003 CW-Gas Line Replacement 800 STATE APPROPRIATION $ 3,477 GRANT Modernization/Renovation Academic Affairs MC16SCI01 SCI - Room 395 Data Outlets 12 PRIVATE FUNDING $ 12 RESERVE - CIMP Critical Infrastructure/Deficiencies University Wide Electrical Substation Design 232 RESERVE - CIMP Critical Infrastructure/Deficiencies Academic Affairs RTC - Sewer System Upgrade 1,000 RESERVE - CIMP Modernization/Renovation Academic Affairs FA- Gallery Museum Project 1,655 RESERVE - NRMR Fire/Life Safety Academic Affairs BH -Elevator C Modernization 450 RESERVE - NRMR Critical Infrastructure/Deficiencies University Wide CW-Data Center Electrical Upgrades 159 RESERVE - NRMR Fire/Life Safety University Wide CW-Fire Alarm / Sprinkler - (WD Phase) 1,136 RESERVE - NRMR Fire/Life Safety Student Affairs SSB- Elevator Improvements 150 RESERVE - NRMR Critical Infrastructure/Deficiencies University Wide CW- Install low flow toilet fixture 228 RESERVE - NRMR Modernization/Renovation University Wide CW- Elevators Improvement 150 RESERVE - NRMR Fire/Life Safety Academic Affairs DM15CW008 CW AED Installation 30 RESERVE - NRMR Critical Infrastructure/Deficiencies Academic Affairs DM15RTC00 RTC - Building 30 Roofing System Replacement 254 RESERVE - NRMR Fire/Life Safety Academic Affairs DM15RTC02 RTC Site Assessment 110 RESERVE - NRMR Fire/Life Safety Administration & FinanDM16LIB01 Library - Emergency Phone 68 RESERVE - Planning Planning University Wide Winston Drive Site Study 300 RESERVE - Planning Planning University Wide CW-Landscape Master Plan 175 RESERVE - Planning Planning University Wide CW-Campus Master Plan 3,000 RESERVE - DM Fire/Life Safety University Wide DM15CW005, CW-Main Electrical maintenance-testing 874 RESERVE - DM Critical Infrastructure/Deficiencies University Wide DM15CW007, CW- Door replacement 449 RESERVE - DM Infrastructure Improvement Administration & Finan Old ADM-HVAC Improvements 737 RESERVE - DM Fire/Life Safety Academic Affairs Burk Hall -Elevator C Modernization 17 RESERVE - DM Modernization/Renovation Academic Affairs HSS- Ext Window Replacement 305 RESERVE - DM Critical Infrastructure/Deficiencies University Wide CW- Fire Sprinkler System 124 RESERVE - DM Fire/Life Safety Academic Affairs FA- Fire Alarm Redesign/Repair 453 RESERVE - DM Fire/Life Safety University Wide CW-ACM & Lead Removal 322 RESERVE - DM Critical Infrastructure/Deficiencies Academic Affairs DM15SCI00 Science- Roof AHU 1&2 Replacement 413 RESERVE - DM Modernization/Renovation Academic Affairs DM16BH002 BH-Replace Roofing System 418 RESERVE - DM Modernization/Renovation Academic Affairs DM16CA001 CA-Replace Roofing System at McKenna 412 RESERVE - DM Fire/Life Safety Academic Affairs DM16CA002 LCA Theatre Safety Upgrade 65 RESERVE - DM Fire/Life Safety University Wide DM16CW002 CW-Door Replacement 184 RESERVE - DM Infrastructure Improvement Academic Affairs DM16FA001 FA-Window System Replacement 336 RESERVE - DM Infrastructure Improvement Academic Affairs DM16HH001 Hensill Hall-Chiller Replacement 83 RESERVE - DM American Disability Act University Wide MC16CW000 CW-Accessible Path 240 RESERVE FUNDING $ 14, P age
123 Fund Type Category Cabinet Project No. Project Name ( Bldg. -Title) Budget TRUST Planning University Wide North Campus District Plan (Formerly Winston) 100 TRUST Critical Infrastructure/Deficiencies Student Affairs DM16CCG01 Children's Campus Roof Gutter Replacement 25 TRUST Modernization/Renovation Student Affairs DM16CCG02 Children's Campus Roof Joints & Vents Repairs 20 TRUST Modernization/Renovation Academic Affairs DM16DTC01 DTC Frame Opening Installation 15 TRUST Modernization/Renovation Academic Affairs DM16RTC01 RTC-Nielson Lab Renovation 176 TRUST Planning Administration & FinanMC15AVC00 Alumni Visitors Center 100 TRUST FUNDING $ 435 Grand $ 28, P age

124 FY17-18 NEWLY APPROVED CAPITAL BUDGET Fund Type Newly Approved Budget (in thousands) SF State Newly Approved Capital Budget ENTERPRISE PROGRAM 1,260 FINANCED 289 STATE APPROPRIATION 2,148 RESERVE 2,865 GRAND TOTAL $6,562 RESERVE 44% STATE APPROPRIATION 33% ENTERPRISE PROGRAM 19% FINANCED 4% Report below provides detail of capital projects scheduled for funding in Yr 1,or FY , of the Capital Planned Budget. Fund Type Category Cabinet Project No. Project Name ( Bldg. -Title) Budget U-Corp Modernization/Renovation U-Corp MC16UC001 University Club Renovation 335 U-Corp Planning U-Corp MC17SC001 Station Café Replacement 50 STUDENT BODY CENTER New Facilities/Infrastructure Associated Students Mashouf Wellness Center 575 HOUSING (Sodexo) Modernization/Renovation Administration & Finance MC16DC001 Dining Center & 7 Hills Improvement 300 ENTERPRISE PROGRAM FUNDING $ 1,260 RESERVE Equipment Lease University Wide TBD CW Fleet Electric Vehicles Leasing 289 FINANCED FUNDING $ 289 CSU FUNDING Infrastructure Improvement Academic Affairs MC17RTC01 RTC-Seismic Upgrade Ph. 1 (Bldg 49 and 50 Seismic Repairs) 2,148 STATE APPROPRIATION $ 2,148 RESERVE - NRMR Fire/Life Safety Academic Affairs MC15ESP00 ES-PSY New Elevator and Elevator Modernization 115 RESERVE - Planning Planning Academic Affairs RTC Master Plan 450 RESERVE - DM Infrastructure Improvement Academic Affairs DM17BH003 BH & Gym-Sewerage Repairs 203 RESERVE - DM Infrastructure Improvement Academic Affairs DM17BH002 BH Sewer Pipe Replacement 308 RESERVE - DM Modernization/Renovation Academic Affairs DM17BH001 BH Hallway Floor Replacement 100 RESERVE - DM Fire/Life Safety Academic Affairs DM17TH001 TH Fire Marshal Corrections 100 RESERVE - DM Infrastructure Improvement Student Affairs MC17UPD01 UP Head End Security System Replacement 200 RESERVE - DM Modernization/Renovation Administration & Finance MC17ADM02 ADM 1st Floor Ceiling & Lighting 300 RESERVE - DM Modernization/Renovation Administration & Finance MC17ADM01 ADM Roof Replacement 400 RESERVE - DM Modernization/Renovation Administration & Finance DM17CY002 Corp. Yard Emergency Transfer Switches 15 RESERVE - DM Fire/Life Safety University Wide DM17CW003 CW Rekeying BUS, HSS, & Old ADM Bldgs 146 RESERVE - DM Modernization/Renovation University Wide MC17CW001 CW Elevator Door Upgrade 60 RESERVE - DM Modernization/Renovation University Wide DM17CW002 CW Door Replacement 223 RESERVE - DM American Disability Act University Wide DM17CW001 CW ADA Pathways / Roadways Maintenance 246 RESERVE FUNDING $ 2,865 Grand $ 6, P age
125 CAPITAL BUDGET IMPACT ON FY17-18 OPERATIONS In , SF State will incur about $8.6 million of incremental O&M costs related to the newly constructed Mashouf Wellness center. Capital projects requiring debt are funded from State Revenue Bond programs that are amortized over the asset life in equal installments (principal and interest).the budgeted interest rate (BIR) used to calculate the internal debt service is a blended rate of interest expense on debt issued for capital projects, bond issuance, and administrative costs. 124 P age
 program, interdisciplinary lecture and active learning classrooms, and administrative space for the College")
126 PROJECT SHOWCASE Creative Arts (CA) Boardcast and Electonic Communication Arts (BECA) Replacement Building Start Date 1/1/2015 End Date 1/1/2020 Description The project will create a new Creative Arts replacement building to house the Broadcast and Electronic Communication Arts (BECA) program, interdisciplinary lecture and active learning classrooms, and administrative space for the College of Liberal & Creative Arts. The building will replace the BECA space in the existing Creative Arts Building which is 50-years old and plagued by serious building code, way-finding, and accessibility deficiencies. It will add much needed contemporary classrooms and office space. BECA instructional space, including radio, television, and multimedia production facilities, will be designed to accommodate current and evolving technology in broadcast and electronic media. Two television studios and observation classrooms, a music recording studio, a radio station, broadcast newsroom, and video and audio post-production rooms will serve as laboratories for hands-on learning within a variety of media production Estimated Project Costs requirements. Interdisciplinary lecture and active learning classrooms will provide right-sized, contemporary, Construction Costs Annual O&M Costs and flexible learning space. Planning 350 Utilities Status Preliminary Design 4,586 Maintenance 100% design development submittal October 3, Construction 59,789 Personnel Construction Related 8,734 Other Equipment 8,035 Cost $ 81,494 Cost Source Of Funds Fund Prior Year(s) Expenses Carry Forward Proposed New Funding Yr 1 Yr Projected Requirements Yr Yr Yr Five Year Future Year RESERVE PC FINANCED DC505 1,185 28,076-28,076 12,099 15, ,175-56,360 STATE APPROPRIATION PC ,667-1, ,667-1,704 PRIVATE , ,080-23,080 s 1,409 29,906-29,906 35,179 15, ,085-81,494 Project Operating & Maintenance Costs Year One Impact P age

127 Mashouf Wellness Center Start Date 8/28/2015 End Date 9/30/2017 Description The Mashouf Wellness Center is a significant addition to the SF State campus, providing a major new student activity center close to the academic core and student housing. Located at the corner of Font and Lake Merced Boulevards, the new 118,700-gross-square-foot facility and a new recreation field are organized around the existing softball field. The Mashouf Wellness Center building will include a two-court gym, multi-activity court (MAC) gym, elevated jogging track, weight and fitness space, natatorium with lap and recreation pools, climbing wall, racquetball courts, multipurpose/group fitness studios, and locker rooms, storage and support space. The project is funded through a student fee. The Mashouf Wellness Center project is on track for LEED Platinum certification. Status Completion Phase - Punchlist. Close-out in process. Estimated Project Costs Construction Costs Annual O&M Costs Planning 310 Utilities 400 Preliminary Design 7,398 Maintenance 1,386 Construction 68,997 Personnel 2,320 Construction Related 7,357 Other 81 Equipment 3,000 Cost $ 87,062 Cost $ 4,186 Source Of Funds Fund Prior Year(s) Expenses Carry Forward Proposed New Funding Yr 1 Yr Projected Requirements Yr Yr Yr Five Year Future Year ENTERPRISE PROGRAM TU006 23,846 6,475-6, ,475-30,321 FINANCED DC400 56, ,741 s 80,587 6,475-6, ,475-87,062 Project Operating & Maintenance Costs Year One Impact - 4,186 4,186 4,186 4,186 4, P age

128 Holloway Student Housing Start Date 1/2/2017 End Date 8/31/2019 Description The Holloway Revitalization Project will construct new student housing, neighborhood-serving retail, and student support services on the south side of Holloway Avenue. The proposed residential program will include apartment style student housing. The redevelopment of the block will allow for a more compact and dense configuration to increase the supply of on-campus housing in conformance with the campus master plan objectives. The retail and support services space will include uses such as neighborhoodserving retail, student support services, bike storage, study rooms, copy center, and retail dining. It will also provide a modest amount of underground parking to replace parking being removed elsewhere on campus in the vicinity of the project. The retail and student support services space will serve SF State affiliates, as well as neighbors, in the immediate vicinity of the campus. Status Planning phase: provide mechanical systems review services, electrical systems review services, plan check, DSA review, seismic review, and disability access review. Estimated Project Costs Construction Costs Annual O&M Costs Planning 300 Utilities Preliminary Design - Maintenance Construction 74,984 Personnel Construction Related 22,195 Other Equipment - Cost $ 97,480 Cost n/a Source Of Funds Fund Prior Year(s) Expenses Carry Forward Proposed New Funding Yr 1 Yr Projected Requirements Yr Yr Yr Five Year Future Year Year One Impact AO PRIVATE ,180 97,180 s ,180 97,480 Project Operating & Maintenance Costs Year One Impact P age

129 Electrical Substation Replacement Start Date 1/1/2015 End Date 12/20/2017 Description This project will install a new 12KV main electrical substation adjacent to the existing substation and phased cutover of the incoming utility service and outgoing campus distribution feeders. Design will include construction sequencing and temporary power arrangements to maintain electrical service to the campus buildings. Status Construction in progress. 50% complete Estimated Project Costs Construction Costs Annual O&M Costs Planning - Utilities Preliminary Design 232 Maintenance Construction 3,475 Personnel Construction Related 805 Other Equipment - Cost $ 4,512 Cost n/a Source Of Funds Fund Prior Year(s) Expenses Carry Forward Proposed New Funding Yr 1 Yr Projected Requirements Yr Yr Yr Five Year Future Year FINANCED DC ,189-3, ,189-3,475 FINANCED DC RESERVE NG s 545 3,967-3, ,967-4,512 Project Operating & Maintenance Costs Year One Impact P age

130 Science Replacement Building Start Date 1/1/2015 End Date 11/30/2022 Description The 105,300 assignable square feet (ASF) /162,000 gross square fee (GSF) Science Replacement Building would provide contemporary instructional and research space to allow SF State s programs in science and engineering, particularly in the applied sciences, to engage in best practice. Conceived as a non-departmental building to ensure flexibility over time, the building would collocate disciplines with natural affinities, such as computer science, computational physics, chemistry, and engineering, to foster interdisciplinary work and promote innovation. Importantly, the building would provide suitable space for upper division and graduate students to carry out relevant research and complete capstone courses, leading to student retention and success. Wet labs would serve chemistry, biochemistry, physics, and mechanical engineering; dry labs would serve physics and engineering. The proposed site for the project is on 19th Avenue at the intersection of Buckingham Way, a highly visible corner site, close to Hensill and Thornton Halls. Status Feasibility study completed November Project submitted to CSU for 2018/19 through 2022/23 Five-Year Capital Improvement Plan, with design proposed in 2018/19, pending funding. Planning Preliminary Design Construction Construction Related Estimated Project Costs Construction Costs 900 Utilities 17,052 Maintenance 232,665 Personnel 34,150 Other Equipment 10,000 Cost $ 294,767 Cost Annual O&M Costs Proposed Projected Requirements Source Of Funds Fund Prior Year(s) Expenses Carry Forward New Funding Yr 1 Yr Yr Yr Yr Five Year Future Year Project RESERVE NG001/ PC ,846 8, ,294-18,952 PRIVATE , ,839 10, ,839 FINANCED ,976-96,976-96,976 s ,846 8, , ,109 10, ,767 Operating & Maintenance Costs Year One Impac P age
131 Ethnic Studies-Psychology (ES-PSY) New Elevator and Existing Elevator Modernization Start Date 11/1/2017 End Date 3/31/2019 Description This project will install one new elevator at the North side of ES-PSY Building. Relocate fire water lines as needed. After installation of new elevator, modernize existing elevator to meet current standards. Status Pre-con proposal received. Contract for design will be issued October Design process scheduled to start in Fall Estimated Project Costs Construction Costs Annual O&M Costs Planning - Utilities Preliminary Design 315 Maintenance Construction 2,526 Personnel Construction Related 481 Other Equipment - Cost $ 3,322 Cost n/a Source Of Funds Fund Prior Year(s) Expenses Carry Forward Proposed New Funding Yr 1 Yr Projected Requirements Yr Yr Yr Five Year Future Year RESERVE PC FINANCED , ,706 2,706 s , ,322-3,322 Project Operating & Maintenance Costs Year One Impact P age


132 Fine Arts (FA) Gallery Museum Start Date 1/1/2016 End Date 7/15/2017 Description *Museum/Storage/Restrooms: Floor Area= 3577 sf. Remove plumbing fixtures from T247. Divide T246 into two restrooms. Paint walls and ceiling; replace lighting; modify HVAC system and add humidifier; new security system; new fire alarm. *Museum Storage/Classroom: Floor Area= 3138 sf. Remove partition walls in 124a, 124b, 124c, and 124d. Paint walls and ceiling; new flooring; replace lighting; modify HVAC system and add humidifier; new security system; new fire alarm; new ceiling. *Renovate studio classrooms in Fine Arts 115, 117, and 119. Install new fire rated glass entrance doors, corridor window, casework, flooring, lighting, modify HVAC system. Floor Area= 3,795 sf. Status Completed. Certificate of Occupancy issued by State Fire Marshal on 8/15/17. Estimated Project Costs Construction Costs Planning Preliminary Design Construction Construction Related Equipment Annual O&M Costs Utilities Maintenance 1,200 Personnel 455 Other Cost $ 1,655 Cost n/a Proposed Projected Requirements Source Of Funds Fund Prior Year(s) Expenses Carry Forward New Funding Yr 1 Yr Yr Yr Yr Five Year Future Year Project RESERVE PC001 1, ,655 s 1, ,655 Operating & Maintenance Costs Year One Impact P age

 Expenses Carry Forward New Funding Yr 1 Yr 2 2018-19 Yr 3 2019-20 Yr 4 2020-21 Yr 5 2021-22 Five Year Future Year")
133 University Club Renovation Start Date 9/1/2016 End Date 6/30/2018 Description Renovate approximately 3,431 sf in Student Center to provide new lounge space, conference room, flexible space/assembly area, office and storage. Provide new ventilation unit and, electrical and data upgrade. Status Design process continuing into Fall Estimated Project Costs Construction Costs Annual O&M Costs Planning - Utilities Preliminary Design - Maintenance Construction 1,000 Personnel Construction Related 200 Other Equipment - Cost $ 1,200 Cost n/a Proposed Projected Requirements Source Of Funds Fund Prior Year(s) Expenses Carry Forward New Funding Yr 1 Yr Yr Yr Yr Five Year Future Year Project ENTERPRISE PROGRAM ST , ,200-1,200 s , ,200-1,200 Operating & Maintenance Costs Year One Impact P age
134 Romberg Tiburon Center (RTC) Sewer Project Start Date 1/1/2015 End Date 12/27/2017 Description This project will abandon the existing onsite wastewater treatment system. A new sewer lateral system will be installed to collect and transport wastewater to a new sanitary sewer pump station, adjacent to building 36. The new on-site pressurized sewer lateral will be utilized and connected to Tiburon sanitary sewer district. Status Construction in progress. 70% complete Estimated Project Costs Construction Costs Annual O&M Costs Planning Utilities Preliminary Design Maintenance Construction 1,000 Personnel Construction Related Other Equipment Cost $ 1,000 Cost n/a Proposed Projected Requirements Source Of Funds Fund Prior Year(s) Expenses Carry Forward New Funding Yr 1 Yr Yr Yr Yr Five Year Future Year Project RESERVE PC ,000 s ,000 Operating & Maintenance Costs Year One Impact P age
135 RTC Electrical System Upgrade Project Start Date 1/1/2015 End Date 11/20/2017 Description This project will underground a portion of the existing 12Kv overhead power from PG&E meter to buildings 36 & 50. Additional electrical improvements includes installation of a new 250 Kw generator, 500 Kva transformer, electrical vaults, and automatic transfer switch. Status Construction is 90% complete. Estimated Project Costs Construction Costs Annual O&M Costs Planning - Utilities Preliminary Design - Maintenance Construction 982 Personnel Construction Related - Other Equipment - Cost $ 982 Cost n/a Source Of Funds Fund Prior Year(s) Expenses Carry Forward Proposed New Funding Yr 1 Yr Projected Requirements Yr Yr Yr Five Year Future Year STATE APPROPRIATION GC s Project Operating & Maintenance Costs Year One Impact 134 P age
136 RTC Emergency Seismic Repairs Start Date 10/17/2017 End Date 12/10/2017 Description Emergency seismic repairs and demolition work at Romberg Tiburon Center per Chancellor's Office instruction. Picture Status Bids received. Construction to start 10/17/2017. Estimate completion date 12/10/2017 Estimated Project Costs Construction Costs Annual O&M Costs Planning - Utilities Preliminary Design - Maintenance Construction 508 Personnel Construction Related - Other Equipment - Cost $ 508 Cost n/a Source Of Funds Fund Prior Year(s) Expenses Carry Forward Proposed New Funding Yr 1 Yr Projected Requirements Yr Yr Yr Five Year Future Year FINANCED DC s Project Operating & Maintenance Costs Year One Impact P age

137 RTC Seismic Upgrade Phase One Start Date 8/1/2017 End Date TBD Description Provide critical seismic upgrades to RTC Building 49 and 50. Picture Status Construction will start in Estimated Project Costs Construction Costs Annual O&M Costs Planning - Utilities Preliminary Design - Maintenance Construction 2,148 Personnel Construction Related - Other Equipment - Cost $ 2,148 Cost n/a Source Of Funds Fund Prior Year(s) Expenses Carry Forward Proposed New Funding Yr 1 Yr Projected Requirements Yr Yr Yr Five Year Future Year STATE APPROPRIATION PC ,148 2, ,148-2, s - - 2,148 2, ,148-2,148 Project Operating & Maintenance Costs Year One Impact P age
138 Campus Wide (CW) Fire Alarm Upgrade Start Date 4/15/2016 End Date 6/30/2018 Description Install additional devices and upgrades to the existing fire alarm control units and systems. There are multiple buildings on campus that have existing fire alarm control units and devices that are still being sold and supported by Simplex and do not necessarily need to be replaced. However, the fire alarm system may be deficient for detection coverage: audibility is lacking throughout the building, strobe coverage may not be adequate, manual fire alarm stations do not comply with ADA requirements, or devices in the building are several generations and models. By adding the required devices or upgrades, existing fire alarm systems can be brought up to current code and still be cost-effective to the University. Status Design in progress. Establishing base design and budget. Estimated Project Costs Construction Costs Annual O&M Costs Planning - Utilities Preliminary Design 1,136 Maintenance Construction 30,000 Personnel Construction Related - Other Equipment - Cost $ 31,136 Cost n/a Proposed Projected Requirements Source Of Funds Fund Prior Year(s) Expenses Carry Forward New Funding Yr 1 Yr Yr Yr Yr Five Year Future Year Project RESERVE PM ,033-1, ,033 30,000 31,136 s 103 1,033-1, ,033 30,000 31,136 Operating & Maintenance Costs Year One Impact P age

139 CW Increase Fire Hydrant Coverage - Main Campus Start Date 10/13/2017 End Date 12/27/2017 Description Add 27 fire hydrants to increase building coverage for HSS, Business, Science, Hensill Hall, and Thornton Hall; Library, Student Center, Gymnasium, Psychology, Burk Hall, Fine Arts, and Creative Arts; Humanities, Centennial Village, and Student Services Building; Mary Ward Hall, Mary Park Hall, Children's Center; Towers, Dining Center, Central Plant. Provide secondary fire water feed to Centennial Village. Status Construction expected October Estimated Project Costs Construction Costs Annual O&M Costs Planning - Utilities Preliminary Design 87 Maintenance Construction 961 Personnel Construction Related - Other Equipment - Cost $ 1,048 Cost n/a Source Of Funds Fund Prior Year(s) Expenses Carry Forward Proposed New Funding Yr 1 Yr Projected Requirements Yr Yr Yr Five Year Future Year FINANCED DC ,010-1, ,010-1,048 - s 38 1,010-1, ,010-1,048 Project Operating & Maintenance Costs Year One Impact P age
140 CW Replacement of 12kV Feeders Start Date 1/1/2015 End Date 6/30/2018 Description This project will replace 12KV high voltage electrical cables that are over 30 years old. Provide two additional sets of redundant, dual radial feeder pairs: 4A / 4B, 5A / 5B after new main 12kV substation is installed. Status Construction in progress. 50% complete. Estimated Project Costs Construction Costs Annual O&M Costs Planning - Utilities Preliminary Design - Maintenance Construction 960 Personnel Construction Related - Other Equipment - Cost $ 960 Cost n/a Proposed Projected Requirements Source Of Funds Fund Prior Year(s) Expenses Carry Forward New Funding Yr 1 Yr Yr Yr Yr Five Year Future Year Project STATE APPROPRIATION GC s Operating & Maintenance Costs Year One Impact P age

141 CW Redundant 12kV Feeders at Main Station Start Date 11/15/2015 End Date 6/30/2018 Description This project will install 12kV feeders from PG&E meter to Campus electrical substation to provide redundancy. Picture Status Construction in progress. 25% complete. Estimated Project Costs Construction Costs Annual O&M Costs Planning - Utilities Preliminary Design - Maintenance Construction 350 Personnel Construction Related - Other Equipment - Cost $ 350 Cost n/a Source Of Funds Fund Prior Year(s) Expenses Carry Forward Proposed New Funding Yr 1 Yr Projected Requirements Yr Yr Yr Five Year Future Year STATE APPROPRIATION GC s Project Operating & Maintenance Costs Year One Impact P age

142 CW Emergency Phones Start Date 11/15/2015 End Date 10/31/2017 Description There is insufficient emergency phone coverage on campus. The project conducts a comprehensive safety and nighttime lighting survey and develops an emergency phone plan to address safety concerns. Picture Status Project completed. Testing and punch list in progress. Estimated Project Costs Construction Costs Annual O&M Costs Planning - Utilities Preliminary Design - Maintenance Construction 385 Personnel Construction Related - Other Equipment - Cost $ 385 Cost n/a Source Of Funds Fund Prior Year(s) Expenses Carry Forward Proposed New Funding Yr 1 Yr Projected Requirements Yr Yr Yr Five Year Future Year STATE APPROPRIATION GC s Project Operating & Maintenance Costs Year One Impact P age
 line. Status Construction expected October 2017.")
143 CW Gas Line Replacement Start Date 10/12/2017 End Date 12/27/2017 Description This project will evaluate and replace gas lines that are over 30 years old. Replace existing 4-inch coated steel gas line serving campus from 19th Avenue with an HPDE (high density polyethylene) line. Status Construction expected October Estimated Project Costs Construction Costs Annual O&M Costs Planning - Utilities Preliminary Design - Maintenance Construction 800 Personnel Construction Related - Other Equipment - Cost $ 800 Cost n/a Proposed Projected Requirements Source Of Funds Fund Prior Year(s) Expenses Carry Forward New Funding Yr 1 Yr Yr Yr Yr Five Year Future Year Project STATE APPROPRIATION GC s Operating & Maintenance Costs Year One Impact P age


144 University Park North (UPN) Garden Unit Exterior Repairs & Painting Start Date 1/1/2015 End Date TBD Description Exterior painting of all garden units at University Park North. This project is intended to provide paint and exterior building repairs to the UPM low-rise units. The repair scope includes lead paint mitigation (as necessary), wood/siding repairs, repairs to flashing and gutters. These buildings last paint job date back to the late 80's and much of the paint is flaking off. Status Phase I Exterior Painting is complete. Phase II Landscaping Design in progress. Phase II construction start pending direction from Housing. Estimated Project Costs Construction Costs Planning Preliminary Design Construction Construction Related Equipment Annual O&M Costs Utilities 500 Maintenance 4,200 Personnel Other Cost $ 4,700 Cost n/a Proposed Projected Requirements Source Of Funds Fund Prior Year(s) Expenses Carry Forward New Funding Yr 1 Yr Yr Yr Yr Five Year Future Year Project ENTERPRISE PROGRAM TM ,000 4,700 s ,000 4,700 Operating & Maintenance Costs Year One Impact P age

145 Dining Center & 7 Hills Improvement Projects Start Date 3/21/2017 End Date Multi-phased Description Renovation of Dining Center and 7 Hills is intended to provide a modern facility, including kitchen renovation, equipment replacement and related infrastructure work. The scope of work for the Dining Center consists of capital projects and deferred maintenance projects, including but not limited to; - Address accessibility and life safety items that are not current to today's building codes and requirements. - Improve accessibility pathways, landscaping and exterior lighting, including UPD emergency blue lights. - Address large deferred maintenance items that will enhance the overall functionalities of the building systems in the Dining Center, including roof replacement and mechanical, electrical and sewer system upgrades. - Interior upgrades including painting and new furniture, fixtures and equipment. - Modernize elevator to meet current code requirements. - Future improvements may include, Dining Center exterior new facade, windows, and patio dining areas. Estimated Project Costs Construction Costs Planning Annual O&M Costs Utilities Preliminary Design Maintenance Status Construction 16,800 Personnel Construction and punch list complete for original roofing replacement contract. Change order for exhaust fan Construction Related Other replacement pending (unforeseen condition). Equipment - Mechanical Equipment Upgrades (aka: Boiler Project) construction in progress. All remaining projects are in design phase with vendor, Sodexo. Cost $ 16,800 Cost n/a Source Of Funds ENTERPRISE PROGRAM (SODEXO) Prior Year(s) Expenses Carry Forward Proposed New Funding Yr 1 Yr Projected Requirements Yr Yr Yr Five Year Future Year Fund TD500/ TD ,278 2,900 5, ,178 4,850 10,250 ENTERPRISE PROGRAM TM ,500 6,550 s 222 2,278 2,950 5, ,228 11,350 16,800 Project Operating & Maintenance Costs Year One Impact P age
146 Cesar Chavez Student Center (CCSC) - Sustainability (LED Lighting Upgrade) Start Date 4/9/2016 End Date TBD Description Replace existing high energy use lighting with LED light at Cesar Chavez Student Center. Picture Status Project is on hold - pending ASI funding. Estimated Project Costs Construction Costs Annual O&M Costs Planning - Utilities Preliminary Design - Maintenance Construction 170 Personnel Construction Related - Other Equipment - Cost $ 170 Cost n/a Source Of Funds Fund Prior Year(s) Expenses Carry Forward Proposed New Funding Yr 1 Yr Projected Requirements Yr Yr Yr Five Year Future Year ENTERPRISE PROGRAM TU s Project Operating & Maintenance Costs Year One Impact P age
. Picture Status Project is on hold - pending ASI funding.")
147 CCSC-Gold Coast Dining Seating & Plaza View Seating Booths Start Date 11/1/2016 End Date TBD Description Replace Tables & Chairs in the Gold Coast Dining Area (approx. 8,500 sq. ft.). Re-upholster dining booth chairs in Plaza View (approx. 10 seating benches). Picture Status Project is on hold - pending ASI funding. Estimated Project Costs Construction Costs Annual O&M Costs Planning - Utilities Preliminary Design - Maintenance Construction 160 Personnel Construction Related - Other Equipment - Cost $ 160 Cost n/a Source Of Funds Fund Prior Year(s) Expenses Carry Forward Proposed New Funding Yr 1 Yr Projected Requirements Yr Yr Yr Five Year Future Year ENTERPRISE PROGRAM TU s Project Operating & Maintenance Costs Year One Impact P age

148 Early Childhood Education Center (ECEC) -Forced Air Heating System Start Date 11/1/2016 End Date 8/15/2017 Description Survey existing condition of 11 forced air heating units and 14 exhaust fans, and require to repair and replace. Picture Status Construction completed mid August Estimated Project Costs Construction Costs Annual O&M Costs Planning - Utilities Preliminary Design - Maintenance Construction 185 Personnel Construction Related - Other Equipment - Cost $ 185 Cost n/a Source Of Funds Fund Prior Year(s) Expenses Carry Forward Proposed New Funding Yr 1 Yr Projected Requirements Yr Yr Yr Five Year Future Year ENTERPRISE PROGRAM SP s Project Operating & Maintenance Costs Year One Impact P age

149 Downtown Campus (DTC) Gender Neutral Restroom Start Date 11/1/2015 End Date TBD Description Convert storage room 599 to gender neutral restroom, with optional shower & lactation room. Picture Status Project placed on hold due to alternate location required. Estimated Project Costs Construction Costs Annual O&M Costs Planning - Utilities Preliminary Design - Maintenance Construction 250 Personnel Construction Related - Other Equipment - Cost $ 250 Cost n/a Source Of Funds Fund Prior Year(s) Expenses Carry Forward Proposed New Funding Yr 1 Yr Projected Requirements Yr Yr Yr Five Year Future Year ENTERPRISE PROGRAM TC s Project Operating & Maintenance Costs Year One Impact P age

150 Student Health Center (SHC) - Atrium Phase 1 Start Date 11/15/2015 End Date 8/12/2017 Description This project will weatherproof existing open air courtyard. It will provide new glass skylight, permanent louvered side openings. Scope includes replacing existing upper landscape area with new concrete, new waterproofing membrane and drainage system. Picture Status Construction and landscaping complete. Estimated Project Costs Construction Costs Annual O&M Costs Planning - Utilities Preliminary Design - Maintenance Construction 600 Personnel Construction Related - Other Equipment - Cost $ 600 Cost n/a Source Of Funds Fund Prior Year(s) Expenses Carry Forward Proposed New Funding Yr 1 Yr Projected Requirements Yr Yr Yr Five Year Future Year ENTERPRISE PROGRAM TH s Project Operating & Maintenance Costs Year One Impact P age

151 150 P age APPENDIX
152 APPENDIX A: GLOSSARY OF TERMS Academic Year: Refers to the time period beginning with the Fall Semester and ending with the Spring Semester. Annualized Full Time Equivalency Students (FTES): Fall FTES added to Spring FTES divided by two plus ½ Summer FTES. Equivalent to College Year FTES. Average Unit Load (AUL): This number indicates the of average course load for students. While a Full Time Equivalent student is considered any student with a unit load of 6.1 or greater, the financial implications of a student taking 6.1 units versus 15 units is significant. The greater the AUL on campus, the more likely a student is to be on track to graduate within CSU targeted graduation dates. Base Budget: Permanent operating budget given to a unit to continuously carry out the basic, ongoing SF State mission from one fiscal year to another. Benefits: Commonly known as staff or employee benefits, i.e.: Social Security (OASDI), retirement (PERS), health coverage, dental coverage, vision, etc. The benefits available to an individual depends upon the negotiated contract of each employee's collective bargaining unit. Revenue Funds: Funds generated by campus entities that provide a service to students, faculty, or staff that charge a fee directly related to, although not necessarily equal to, the cost of the service. Campus Revenue Funds are managed as self-supporting activities. Examples include University Housing, Athletics, Lottery, Parking and Student Health. Capital Projects/Capital Outlay Program: The erection, construction, alteration, painting, repair, improvement of any structure, building, road, or other improvement of the grounds or facilities of any kind, including campus utility systems. Capital projects may be subdivided into a variety of categories based on the size of the project in dollars or the source of funds. Refer to Major Capital Outlay and Minor Capital Outlay. Deferred Maintenance: Funding allocated for specific campus projects that are designed to continue the useful lifespan of a facility. Examples include repainting an exterior of a facility, reroofing, electrical repairs, plumbing repairs, and road repairs. Executive Order (EO): Official memo issued by the CSU Chancellor's Office to campus presidents outlining their authority to take action on their campuses. Federal Work Study: Federal Funds are allocated to the campus for the purpose of hiring students with qualifying financial need. The Federal Work Study Funds cover a percent of the student's salary; the hiring campus department then "matches" the Federal Funds with a smaller percent. Typically, it is a 70/30 or 75/25 split for matching funds. 151 P age
153 Financial Aid Programs: Financial aid available from federal, state and private funding sources to assist students in meeting their educational costs. Some financial aid awards are based on financial need, scholastic achievement, and/or pre-determined attributes. Financial Aid awards at SF State may include the following: Ed.D Program - Education Leadership Grant, Graduate Business Professional Grant (GBPG), Graduate Equity Fellowship (GEF), Kuhlman Loan, Middle Class Scholarship (MCS), State University Grant (SUG), Teacher Education Assistance for College and Higher Education (TEACH) Grant, and Tuition Fee Discount. Fiscal Year (FY): For the State of California, and therefore the CSU and SF State, the fiscal year begins on July 1 and ends on June 30. Fund: Per Executive Order 1000, a "fund" is defined as a fiscal and accounting entity with a selfbalancing set of accounts recording cash and other financial resources, all related liabilities, and residual equities or balances, and changes therein, which are segregated for the purpose of carrying on specific activities or attaining certain objectives. Full time (1.0) employee (FTE): The ratio of the total number of paid hours during a period (part time, full time, contracted) by the number of working hours in that period Mondays through Fridays. The ratio units are FTE units or equivalent employees working full-time. One FTE is equivalent to one employee working full-time. Fulltime Equivalency Students (FTES): A unit of measure equal to 15 semester or quarter units per term. FTES is reached by dividing total semester or quarter hours by 15 for undergraduate students. Graduate students are 12 unit hours. Fund Balance: The remaining funds available of revenues net of expenses. General Fund: Also known as State Appropriation. Expenditure authority from the State based upon its collected and/or estimated collection of revenues. On an annual basis, a portion of the State of California General Fund revenues is identified by the governor for use by the CSU system. The Office of the Chancellor then redistributes CSU's appropriation funding to the 23 CSU campuses along with an estimate of the student fee revenues each campus is expected to collect based upon their projected student enrollment. Head count: an inventory of staff, faculty or students in a group taken by counting individuals. Incremental Budgeting: An incremental budget is a budget prepared using a previous period's budget or actual performance as a basis with incremental amounts added for the new budget period. Labor Cost Distribution: An Oracle/PeopleSoft process that distributes payroll expenditures made in the Human Resources system to designated funding sources in the Finance system. Reports can then be generated that provide employee compensation data, including the chartfield string where this data is posted in PeopleSoft Finance as expenses. 152 P age
154 Lottery Fund: A portion of the California State Lottery proceeds is directed to the CSU and is then distributed by the Chancellor's Office to campuses. Major Capital Outlay: Construction project where the estimated total project cost for all phases, including design and construction, is over $656,000. State site acquisition projects, regardless of cost, are funded in major capital outlay. Minor Capital Outlay: Construction project where the estimated total project cost is below $656,000 for all phases, including design and construction. Non-resident Fee: Fee paid by domestic and international non-resident students. The fee is assessed on a per-unit basis. One-Time Funding: Funds allocated on a one-time basis, often for a designated project or use. Funds may be allocated in subsequent fiscal years but the funds are not intended to become a permanent addition to the recipient's base budget. Operating Fund: Consists of the State Appropriation, as allocated from the Chancellor's Office, University Fees, and other student fees. Revenue Funds: Self-supporting funds that generate their own revenue independent of the State's appropriation to the campus. These funds operate under the direct supervision of the campus Vice Presidents. Examples are Student Health Services, Continuing Education, University Housing, and Parking operations. Shortfall: When a historic funding level is identified as insufficient to cover projected expenditures. State University Grant (SUG): A grant program that provides need-based awards to cover a portion of the Tuition Fee for eligible undergraduate and graduate California residents who have an expected family contribution of $5,000 or less. University Wide: Resources essential to the operation of the campus and independent from any particular division's core activities. For example, benefits, utilities, risk pool, etc. 153 P age
155 APPENDIX B: 2 YEARS UNIVERSITY STATEMENT OF ACTIVITIES UNIVERSITY STATEMENT OF ACTIVITIES FY to This budget report presents the statement of activities for 2016/17 results in a format consistent with Generally Accepted Accounting Principles, as reported in the university s annual financial report. The projected Statement of Activities shows a $ 14 million decrease. Comparison of Statement of Activities, to vs Increase (Decrease) Ref. Revenues: Actuals Actuals Dollar Percent Operating revenues: Student tuition and fees (net of scholarship allowances) $ 129,985,080 $ 132,543,847 $ (2,558,767) 0-1.9% Section 1 Grants and contracts, noncapital: Federal 20,748,967 18,832,081 1,916, % State 2,129,148 2,004, , % Local 1,780,648 1,650, , % Nongovernmental 2,381,528 1,986, , % Sales and services of educational activities 136, ,172 17, % Sales and services of auxiliary enterprises, gross 62,323,119 58,457,081 3,866, % Scholarship allowances - aux ent (enter as negative) (6,129,549) (5,388,076) (741,473) % Sales and services of auxiliary enterprises (net of scholarship allowances) 56,193,570 53,069,005 3,124, % Other operating revenues 11,184,411 10,644, , % operating revenues $ 224,539,598 $ 220,850,480 $ 3,689, % Expenses: Operating expenses: Instruction 190,606, ,346,990 25,259, % Section 3 Research 14,282,750 11,225,566 3,057, % Public service 2,341,099 3,781,893 (1,440,794) % Academic support 45,101,581 49,373,916 (4,272,335) 0-8.7% Student services 35,911,937 33,964,756 1,947, % Institutional support 52,808,746 43,209,788 9,598, % Operation and maintenance of plant 36,403,128 36,714,559 (311,431) 0-0.8% Student grants and scholarships 45,477,448 48,902,191 (3,424,743) 0-7.0% Auxiliary enterprise expenses 42,499,166 38,775,124 3,724, % Depreciation and amortization 28,204,271 28,559,772 (355,501) 0-1.2% operating expenses $ 493,636,882 $ 459,854,555 $ 33,782, % Operating income (loss) $ (269,097,284) $ (239,004,075) $ (30,093,209) % Nonoperating revenues (expenses): State appropriations, noncapital $ 163,962,386 $ 145,251,293 $ 18,711, % Federal financial aid grants, noncapital 53,595,167 58,264,319 (4,669,152) 0-8.0% State financial aid grants, noncapital 36,439,899 37,314,747 (874,848) 0-2.3% Local financial aid grants, noncapital % Nongovernmental and other financial aid grants, noncapital % Other federal nonoperating grants, noncapital % Gifts, noncapital 2,106,141 9,425,972 (7,319,831) % Investment income (loss), net 1,351,402 2,411,821 (1,060,419) % Endowment income (loss), net 5,515 6,403 (888) % Interest expense (9,068,423) (8,936,166) (132,257) 0 1.5% Other nonoperating revenues (expenses) - excl. interagency transfers 936,928 12,873,944 (11,937,016) % Other nonoperating revenues (expenses) - interagency transfers 5,409,876-5,409, % Net nonoperating revenues (expenses) $ 254,738,891 $ 256,612,333 $ (1,873,442) 0-0.7% Income (loss) before other revenues (expenses) $ (14,358,393) $ 17,608,258 $ (31,966,651) % State appropriations, capital 2,110,000 1,367, , % Grants and gifts, capital 6, ,432 (278,766) % Additions (reductions) to permanent endowments (2,430,082) - (2,430,082) % Transfers from (to) other CSU campuses, net % Increase (decrease) in net position $ (14,671,809) $ 19,260,690 $ (33,932,499) % 154 P age
156 Section 1: Student tuition and fees University University Variance Percent Student tuition and fees, gross $ 214,807,668 $ 219,962,500 $ (5,154,832) 0-2% Scholarship allowances (enter as negative number) (84,822,588) (87,418,653) 2,596, % student tuition and fees, net $ 129,985,080 $ 132,543,847 $ (2,558,767) 0-2% Scholarship allowance as a % of tuition and fees 39.49% 39.74% The student tuition revenue has decreased year over year due to an approximate four percent drop in enrollment to the CO target of 24,099FTE, which has had an impact over all the campus fees Section 2: Operating expenses by natural classification University University Variance Percent Salaries $ 224,430,805 $ 210,982,438 $ 13,448, % Benefits 110,099,469 92,026,769 18,072, % Scholarships and fellowships 45,477,448 48,902,191 (3,424,743) 0-7% Supplies and other services 85,424,889 79,383,385 6,041, % Depreciation and amortization 28,204,271 28,559,772 (355,501) 0-1% operating expenses $ 493,636,882 $ 459,854,555 $ 33,782,327 7% Increase in salaries is due to the general salary increases for faculty by 5% on June 30, 2016 and an additional 2% on July 1, In addition, more than 40 faculty positions had been hired compared to prior year. The benefits rate are increasing year over year mostly due to the retirement rates adjustments. Section 3: Operating expenses by function for each natural classification type: Salaries University University Instruction $ 124,436,773 $ 113,992,268 10,444, % Research 5,554,155 5,322, , % Public service 1,357,478 1,441,291 (83,813) % Academic support 25,005,716 23,630,940 1,374, % Student services 20,343,199 18,988,001 1,355, % Institutional support 23,398,500 23,877,081 (478,581) % Operation and maintenance of plant 13,646,345 13,870,677 (224,332) % Student grants and scholarships % Auxiliary enterprise expenses 10,688,639 9,859, , % Depreciation and amortization % $ 224,430,805 $ 210,982,438 13,448, % 155 P age
157 Footnote: There are four different categories of funds: 1) Current Funds, which include revenue to be used for operating activities e.g., tuition revenue, sponsored research support, endowment payout, and other investment income; 2) Restricted Funds, which include all of university s endowment funds, both those restricted by the donor, and those designated as endowment funds by university management; 3) Capital Funds, which include all funds to be used for capital projects, such as construction of new facilities or debt service; and 4) Student Loan Funds, which include those funds to be lent to students. The Consolidated Budget for Operations includes only current funds and reflects the sources and uses of those funds on a modified accrued basis that more closely matches the way the university is managed internally. Within these current funds, specific funds are further classified by their purpose and level of restriction. The Consolidated Budget for Operations also reflects the transfer of current funds for investment in other fund groups: funds functioning as endowment, student loan funds, and plant funds. For example, an auxiliary enterprise or college can choose to transfer operating revenue to fund a future capital project. In both these instances, these funds are no longer available to support operations, so they decrease the Consolidated Budget for Operations operating results. These transfers, however, have no impact on the Statement of Activities operating results, as the net assets of the university have not changed (one form of asset has been converted into another type of asset). TRANSLATING THE CONSOLIDATED BUDGET OF OPERATIONS INTO THE STATEMENT OF ACTIVITIES To translate the Consolidated Budget of operations to the Statement of Activities under GAAP, certain revenue and expense reclassifications, transfers, and adjustments are necessary. The following adjustments are made to the Consolidated Budget to align it with the GAAP basis Statement of Activities: a) Eliminate Fund Transfers. The Consolidated Budget includes transfers of current funds to other fund groups, including plant, student loans, and funds functioning as endowment. The transfers out are added back for the Statement of Activities. b) Remove Capital Equipment purchases. The Consolidated Budget includes the projected current year s purchases of capital equipment as expense. For GAAP purposes, the cost of capital equipment is recorded as an asset on the Statement of Financial Position. c) Record Depreciation expense for the current year s asset use. The Statement of Activities includes the current year s depreciation expense related to capital assets. Depreciation expense 156 P age
158 includes the depreciation of capital equipment and other capital assets, such as buildings and land improvements d) Adjust Fringe Benefit expenses. The Consolidated Budget reports the fringe benefits cost based on the fringe benefits rate charged on all salaries; the rate may include over- or underrecovery from prior years. The Statement of Activities reflects actual expenses for fringe benefits, so the over- or under-recovery amount has to be removed from Salaries and Benefits. The Statement of Activities also includes accruals for certain benefits, such as pension and postretirement benefits that are required by GAAP to be shown as expense in the period the employee earns the benefit. e) Reclassify Financial Aid. GAAP requires that the tuition portion of student financial aid be shown as a reduction of student revenue. In the Consolidated Budget, financial aid is reported as an operating expense. Accordingly, $90 million of student financial aid expense is reclassified as a reduction of student revenues in the Statement of Activities. h) Adjust for Debt Service. The Consolidated Budget includes all internal debt service. It reflects the use of funds to amortize principal and interest. On a GAAP basis, interest expense is reported in the Statement of Activities and repayment of debt principal is reported as reductions in Notes and Bonds Payable in the Statement of Financial Position. i) Eliminate Net Internal Revenue/Expense. The Statement of Activities includes the activity of all fund types, while the Consolidated Budget does not include plant funds. 157 P age
159 APPENDIX C: CAPITAL PROCESS-SUPPLEMENTAL INFORMATION Project Budget Development a. All project budgets are developed by CPDC project managers on the total project budget development sheets and then entered onto the SF State Project Charter Form (PCF) available online at: State.edu/forms. b. Project budgets evolve over time and solidify as the design progresses. Larger projects go through four stages of cost estimates: 1) a "place holder" estimate included in early planning; 2) a preliminary estimate after scope definition; 3) a more refined cost estimate after a feasibility study, and 4) a firm construction estimate, after design and bidding. c. The total project budget includes: construction costs, consulting expenses, 7% project construction management fees as endorsed in SUAM , the initial complement of furniture and fixtures, expenses related to relocation of utilities and non-utility infrastructure, contingency, and any other major expense. d. Related capital construction projects, such as utility infrastructure that is not a part of the project budget, should be disclosed as supplemental information on the PCF form to keep the CPDC and the Fiscal Affairs Department informed about the full cost of the construction project. The CPDC will report significant utility infrastructure costs separately from the total project budget. e. Every project budget, regardless of the type, must include a contingency budget line. A contingency is required for the following: design, program, owner, and construction. The contingency must be, at minimum, 10% of the project construction cost. This amount will vary depending on the nature and scope of the project. f. The sponsoring department or project champion must develop a financial plan for funding the construction and future operational costs. This plan must be included with the PCF form. g. The project accountant will regularly review and distribute to senior administration a capital projects financial report, to include approved budgets, actual-to-date information, expense/funding projections, contingency report, unsolved issues, and project milestones. h. CPDC department is responsible to issue the project charter amended and follow the project approval requirements. An amended project charter is required for the following instances: 1) Any ($) value change increase or decrease to its original allocation; 2) Original project scope change with no ($) value of the original allocation; 158 P age
160 3) Project cancellation/close; 4) Project title change; 5) Project scope merge i. Any capital project cost savings will be reimbursed after project closing process to the project requestor with the exception of projects funded from campus reserve. Project Types Description There are several types of capital projects that are reported in the Capital Plan, and they follow stipulations of SUAM Section I [Capital Outlay and Public Works Contracts Section , and Legal Manual Chapter 15.] The SF State capital improvement includes the following types of projects: Capital Improvement Projects (CIMP): An activity which improves or alters an existing space or creates new space. New construction of facilities, buildings, equipment, roads, sidewalks, sewer and water systems, utility infrastructure, and grounds are all capital expenditures, as distinguished from maintenance/repair. Major Capital Projects: Major capital projects include major capital improvement; capital outlay projects that cost over $656,000 are considered major projects. These may include new facilities/infrastructure and existing facility/infrastructure with critical deficiencies or modernization/renovation. State site acquisitions projects, regardless of the amount, are funded in major capital outlay. Minor Capital Projects: Minor capital projects are composed of construction projects whose estimated cost is less than or equal to $656,000. Minor capital projects, whose scope of work includes any remodeling or additions, require conformance with guidelines for accommodating disabled individuals. An American with Disabilities Act (ADA) Transition Plan was prepared for each campus to address access deficiencies. ADA compliance projects of the University are funded primarily through the operating budget. Facility Services Enterprise (FSE) and CPDC prioritize these projects according to need and funds availability. The approval of the capital budget authorizes facility renewal/ada projects in aggregate. Non-Recurring Maintenance/repair (NRMR) -Deferred Maintenance (D/M): Work required to restore facilities, buildings, equipment, roads, sidewalks, sewer and water systems, utility infrastructure, and grounds to their original condition or to such condition that they can be effectively used for their intended purpose, ensuring ongoing operation of the campus. Typically, this work occurs in cycles greater than one year (and is not funded as part of the new space budget allocation). Some campuses budget non-recurring maintenance separately and, for example, may establish (1) use of one-time funds for such expenditures, or (2) set aside permanent base funds to address non-recurring maintenance and deferred maintenance. 159 P age
161 Acquisition of Real Property The transaction of property purchase must acquire the Direction Department of Finance (DOF), Direction Department of General Services (DGS) approval. Real Estate Leases and Leasehold Improvements Real Estate Leases and Leasehold Improvements include any lease (operating or capital) for space, as well as up-front costs of tenant up fit, leasehold improvements, and fixed equipment. A Short Term lease ++- Less than 20 years or involving an annual payment of less than $1 million requires Campus President Approval. A Long Term Lease ++20 years or greater or one involving annual payment over $1 million requires Chancellor Office (CO) approval. Equipment equipment purchase for major /minor construction equipment group II and equipment substitutions. Group II equipment is programmatic-specific but generally is movable and does not require significant utility connections. Group II items are not a part of the construction contract and are budgeted in a separate budget phase. Examples: tables, chairs, microscopes, hand-held electric tools, computers, cameras. Reference SUAM Section X Project Approval Requirements The following approvals are required prior to initiation of work and/or commitment of funds to a project. Any exceptions must be approved by the VP & CFO of Administration and Finance. a. A funding plan for multiyear projects must be established prior to a project being considered for approval. b. The project ID must be issued on every project for which CPDC provides a project estimation. No funds are to be spent or committed prior to the issuance of a project code and the project charter approval. c. Related contracts or Notices to Proceed require appropriate approval in addition to the approval of a project. d. The requesting department is responsible for ensuring that adequate funding is available and transferred regularly to the project code to prevent overdrafts. For projects funded from multiple sources, funding details must be clearly documented and understood by all parties with clear agreement as to the timing, amount and person responsible for such funding transfers. The Fiscal Affairs Office (FA) is authorized to transfer funds from the designated funding source to cover such overdrafts. e. Recurring maintenance/repairs (RMR) Projects and Capital Projects Less Than $100,000 Cost: Less than $100,000 Funding sources: Operating budget, departmental reserves, gifts/grants 160 P age
162 Required approvals: Dean, director or department head, associate vice president (AVP) of CPDC, senior AVP of Physical Planning and Development (PP&D) VP of University Enterprises (UE) and executive director of Budget Administration & Operations. Planning: Non-capital construction projects less than $100,000 are not included in the annual capital budget. Funding should be included in the operating budget or as a budgeted use of departmental/betterment reserves for non-capital and departmental reserves, central reserves, gifts/grants for capital projects less than $100,000. f. Level I Minor Capital Projects (CIMP & NRMR) Cost: Between $100,000 and less than or equal to $656,000 Funding sources: Departmental reserves, central reserves, gifts/grants Required approvals: Dean, director or department head, AVP of CPDC, senior AVP of PP&D VP of UE, FA/BOT, and VP of Administration and Finance Planning: The VP of Administration & Finance approves these projects in aggregate in the annual capital budget, where they are presented according to area of financial responsibility (e.g., Academic, Athletics, Housing, Parking and CCCS). An actual/budget comparison will be reported quarterly. Any unfavorable variance to the aggregate budget (by financial responsibility) requires a written explanation from the appropriate department budget official. g. Level II Major Non-Recurring Maintenance and Repair Projects-(NRMR) Cost: More than $656,000 (NRMR) and does not require BOT approval (except if debt financing is needed) Funding sources: Departmental reserves, central reserves, internal loans, gifts/grants, or external debt. The VP of Administration & Finance must approve any external debt financing by resolution. Required approvals: Dean, director or department head, AVP of CPDC, senior AVP of PP&D VP of UE, FA/BOT, VP of Administration & Finance, and President. Planning: An aggregate amount (by financial responsibility) will be included for approval in the annual capital budget. An actual/budget comparison will be reported quarterly. Any unfavorable variance to the aggregate budget (by financial responsibility) requires a written explanation from the appropriate management center budget official. h. Level III Major Capital Improvement Projects (CIMP) Cost: More than $656,000 (CIMP) require BOT approval Funding sources: Departmental reserves, central reserves, internal loans, gifts/grants, external debt financing. 161 P age
163 Required approvals: Capital Projects Executive Committee and BOT. Planning: A Level III Capital Project report will be included in Campus Planning Committee materials at each of the committee s regular meetings. Level III Capital Projects will follow the SUAM (Section VII Five-Year Capital Improvement Program Procedures and Formats for the capital outlay submission Sections ), available for review at: The VP of Administration &Finance must approve the budget, and each stage of the project budget, for each Level III project. Capital Plan Approvers and Members 1. Capital Planning Design and Construction (CPDC) Responsible for review of all capital projects to: 1) develop and review the PCF form for completeness, 2) ensure that the technical reviews were completed, 3) recommend approval, disapproval, or approval with modification to the CPMC, and 4) review for compliance with the approved capital budget. Members: AVP of Capital Planning Design and Construction, AVP of Housing, and AVP of Facilities & Service Enterprises. 2. Capital Planning Management Center (CPMC) Responsible for managing the boardapproved capital budget and prioritizing projects Members: Fiscal Affairs, Budget Administration & Operation, and VP of Administration & Finance. 3. Capital Project Executive Committee (CPEC) Responsible for approving the projects. 4. Board of Trustees (BOT) Members: VP of Administration & Finance, Senior AVP of PP&D, VP of University Enterprise, and President. 162 P age
164 Capital Improvement Plan Timeline July August September October November December January February March April May June Five-Year Capital Improvement Program to Governor / Board of Trustees (BOT) Governor's Budget Proposal for Legislative Committee hearings on the budget BOT approves draft Five- Year Plan BOT approves the Final budget, capital financing requests and Five-Year Plan San Francisco State University (SFSU) / Budget Office Campuses submit their final project proposal and Five- Year Plan to CO Campuses submit their Draft Five-Year Plan to CO Publish SFSU Capital Budget and Plan Book Annual call for SFSU Capital Project Budget Process Q1 Financial Review Q2 Financial Review Q3 Financial Review Department of Finance (DOF) / Treasury Financing and Treasury approves financial plan to be bond funded for the action year DOF provides preliminary list approved CSU projects to Legislature DOF submits final list of approved projects to CSU 163 P age

165 Accounting, Reporting and Controls a. All SF State capital projects must use the following PeopleSoft (PS) chart combination: b. Fund-unique department ID Capital Projects Capital outlay object code account and mandatory/unique project identifier. CSU Fund Matrix for Capital Projects: 164 P a g e
166 For all NRMR and CIMP projects, it is recommended to use the series of 607xxx or other FOC accounts- available information at: Additional information about project attribute is available at Legal Manual Chapter 15 Capital Projects-Academic Facilities: c. For multi-funded projects, the expenditures must be recorded in the source fund at the voucher level. All claims must be processed within 30 days on bond-funded expenditures. The spending will be according to the hierarchy to meet spending benchmarks as follows: Optional #1a Planning and design costs: Pay-as-you-go funding for up front project costs not to exceed 10% of the total estimated project cost until proceeds are available. Required #1b Bond Funding: Once proceeds are available, these funds should be spent first. Required #2 General Fund (CSO fund 0001) funding: Evaluate if appropriation (s) has earlier available to or reversion date than bond funds. Optional #3 Supplemental funding: Donor, Reserve, Interest and Enterprise funds. Optional #4 Pay-as-you-go funding Optional #5 Auxiliary funding The project ID format will follow the Oracle financial project chart of accounts format of nine digits. A Project charter is submitted to the Accounting Office for review. Based upon GAAP regulations on capital assets, Accounting Office will determine the project ID appropriately. PROJECT ATTRIBUTE TYPE CIMP-CAPITAL IMPROVEMENT; NRMR- NON RECURRING MAINTENANCE/REPAIR PROJECT ID MC/DM FY Fiscal year that runs July 1 to June 30, two digits BUILDING Three digits LAST TWO DIGITS 00 SAMPLE: MC17ADM00 OR DM17ADM P age
167 d. A comprehensive capital projects report updated after the close of each fiscal month reflects funding and expenditures and projected expenses and revenues. e. The current financial information is taken from the University s financial system, Oracle Financial, SF State s official ledger of record. Each month, the project manager projects expenditures; the project accountant reconciles and reviews the BI financial statements, and the accounting department projects financing costs (if the project is funded by debt). f. Direct salaries should never be charged to capital construction projects. Project management fees are recorded as internal professional fees, not as a payroll expenses. Only project expenses within the approved budget may be charged to the project. The VP of Administration & Finance must approve any exceptions to this procedure. g. Without prior approval, projects do not run in overdraft. Departmental reserves are the first source of funding for any unauthorized overdrafts. h. The project accountant will close out the capital project code no later than one year after occupancy of the facility, or when it is declared substantially completed. If invoices or other payments remain outstanding, the project manager must contact accounting to request a delay, closing of the project code. i. The status and financial position of capital projects will be reviewed regularly with the project owner, chaired by the management center. j. Project Funding: The project champion department is responsible for ensuring that adequate funding is available and transferred regularly to the project code to prevent overdrafts. k. Project managers with the support of the project accountant maintain the total project budget and track expenditures, prepare projections, estimate cash requirements, and account for the use of contingencies. The project manager reviews project estimates with the AVP of CPDC. The project accountant reviews monthly accounting system statements from BI for discrepancies. Project managers, financial owners, and the members of management center meet quarterly to discuss the financial status of all major capital projects. l. After the capital fund is approved the only new projects that will be included as amendments will be projects that qualified as emergency projects. m. Capital project contingency funds should be tightly controlled to deal with unexpected project developments and should be included in the original estimated cost (no less than 10% to the construction estimated cost). All significant programmatic and owner controlled scope changes that occur during the design or construction phase, which significantly impact the contingency or total project budget, must be approved by the appropriate 166 P age
168 department project requestor, and a new project charter change order must be issued and approved. The project manager will track all uses of project contingencies. n. Project managers monitor all project schedules and keep all interested parties informed of changes to the anticipated schedules. 167 P age

169 APPENDIX D: ORGANIZATIONAL CHARTS 168 P age
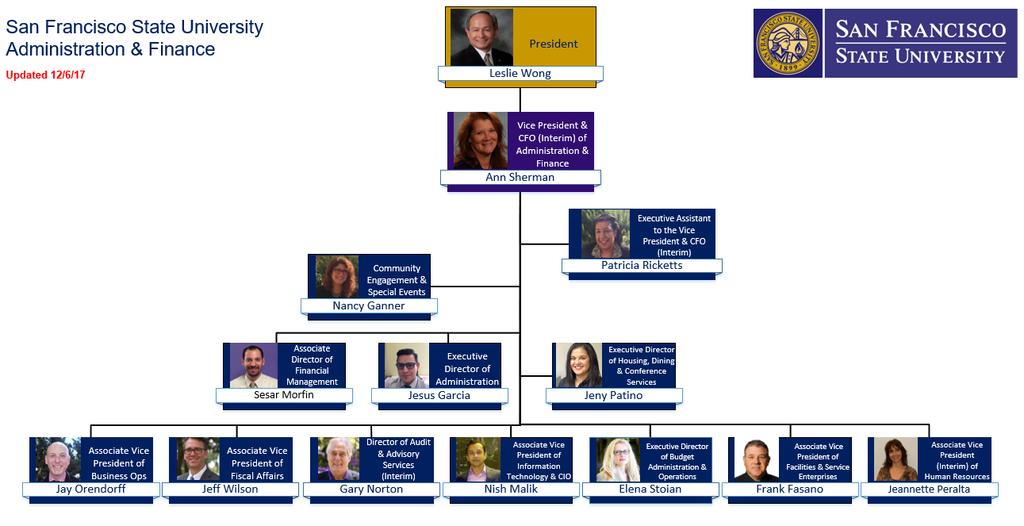
170 169 P age

171 Pending Request 170 P age

172 Updated: 11/ P age
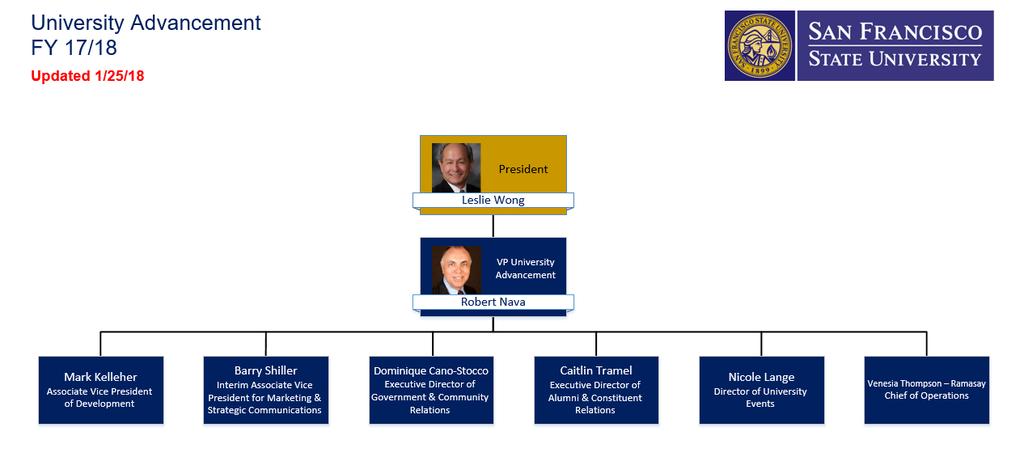
173 172 P age
Budgeting and Planning Process as of FY17
 Budgeting and Planning Process as of FY17 Summary The budget is an important annual planning document for the university and reflects choices, priorities and tactics set forth as the result of intensive
CSUF CALIFORNIA STATE UNIVERSITY, FULLERTON
 CSUF CALIFORNIA STATE UNIVERSITY, FULLERTON Budget Report Fiscal Year 2014-2015 Table of Contents I. Foreword II. University Resources a. Fiscal Year Budget 1 b. Highlights: 2014-15 Operating Fund Budget
Budget Manual FISCAL YEAR SAN FRANCISCO STATE UNIVERSITY BUDGET ADMINISTRATION AND OPERATIONS OFFICE
 Budget Manual FISCAL YEAR 2019 20 SAN FRANCISCO STATE UNIVERSITY BUDGET ADMINISTRATION AND OPERATIONS OFFICE Date Created: 4/27/18 Date Revised: 04/19/19 Table of Contents CAMPUS BUDGET FRAMEWORK... 3
Fiscal Year 2017 (FY17) Operating Budget Amendment October 20, 2016
 Operating Budget Amendment October 20, 2016") Fiscal Year 2017 (FY17) Operating Budget Amendment October 20, 2016 The following provides an amendment to the FY17 budget approved by President Rush in June 2016. Subsequent to President Rush s approval
Fiscal Year 2017 (FY17) Operating Budget Amendment October 20, 2016 The following provides an amendment to the FY17 budget approved by President Rush in June 2016. Subsequent to President Rush s approval
California State University. Fullerton. Budget Report Fiscal Year
 California State University Fullerton Budget Report Fiscal Year 2016-17 Table of Contents I. Foreword II. University Resources a. Fiscal Year Budget 1 b. Highlights: 2016-17 Operating Budget 2 c. Operating
Fiscally Responsible Management Practice Change
 San Francisco State University Fiscally Responsible Management Practice Change NEW GUIDELINES FOR CSU FUNDS 485, 491 AND 496 Budget Administration & Operations & Fiscal Affairs Offices 3-12-2018 0 P a
This budget is the first to incorporate our university community s shared goals as expressed in our new strategic plan, Building on Excellence.
 Office of the President San Diego State University 5500 Campanile Drive San Diego, CA 92182 8000 Tel: 619 594 5201 Fax: 619 594 8894 September 30, 2014 Members of the university community: San Diego State
Campus Budget & Funding Basics
 Campus Budget & Funding Basics CALIFORNIA STATE UNIVERSITY, CHICO March 2018 Campus Budget & Funding Basics 2 What funding sources are available? How are funds allocated? Who do I call for help or additional
Joseph Trubacz Senior Vice President for Finance and Administration
 TO: FROM: Board of Trustees Joseph Trubacz Senior Vice President for Finance and Administration DATE: May 21, 2011 SUBJECT: FY 2013 Budget I. BACKGROUND INFORMATION Fiscal Year 2013 Operating Budget Summary
UNTHSC. Annual Budget Development Process Fiscal Year 2019 Guidelines & Instructions - Spring 2018
 UNTHSC Annual Budget Development Process Fiscal Year 2019 Guidelines & Instructions - Spring 2018 INTRODUCTION: The budgeting process at the University of North Texas Health Science Center (UNTHSC) assigns
San Francisco State University. We Make Great Things Happen. University Budget Committee July 2017
 San Francisco State University We Make Great Things Happen University Budget Committee July 2017 Agenda 1. Call to Order 2. Welcome and Announcements (Ann Sherman) a. Approval of April 21 st, 2017 Meeting
California State University. Fullerton. Financial Report Fiscal Year Budget Report Fiscal Year
 California State University Fullerton California State University Fullerton Financial Report Fiscal Year 2017-18 Budget Report Fiscal Year 2016-17 Table of Contents I. Foreword II. Fiscal Year Budget 1
Welcome to the Spring 2018 Budget Forum! Hosted by the President s Budget Advisory Committee
 Welcome to the Spring 2018 Budget Forum! Hosted by the President s Budget Advisory Committee Campus Budget Spring 2018 Budget Forum Sonoma State University March 13, 2018 Budget Basics About My Unit Laura
Financial Management Guidelines and Procedures
 The financial position and future of the Colorado School of Mines is dependent on several variables including enrollment, research growth, changes in industry demand, and competing institutions at the
University Resources & Planning Committee
 University Resources & Planning Committee Date: June 15, 2016 TO: FROM: RE: President Rossbacher, Humboldt State University University Resources & Planning Committee (URPC) URPC Recommendation to the President
San Francisco State University. We Make Great Things Happen
 San Francisco State University We Make Great Things Happen Fiscal Year 2015/16 November 2015 University Budget Committee 2 Summary of the Governor s 2015/16 Budget Summary of the Governor s 2015/16 State
California State University Chico Budget Plan
 California State University Chico 201213 Budget Plan Executive Session Approved November 26, 2012 CONTENTS 201213 Budget Plan General Fund, Lottery, Capital Outlay and Auxiliary Funds Page General Fund
UW-Platteville Pioneer Budget Model
 UW-Platteville Pioneer Budget Model This document is intended to provide a comprehensive overview of the UW-Platteville s budget model. Specifically, this document will cover the following topics: Model
San Francisco State University. We Make Great Things Happen. University Budget Committee September 12, 2017
 San Francisco State University We Make Great Things Happen University Budget Committee September 12, 2017 Welcome to the new Academic 2017-2018 Year! Today s Agenda Welcome and Announcements (President
San Francisco State University. We Make Great Things Happen
 San Francisco State University We Make Great Things Happen Fiscal Year 2015/16 November 2015 Academic Senate 2 Summary of the Governor s 2015/16 Budget Budget Highlights Summary of the Governor s 2015/16
Budget Manual FISCAL YEAR SAN FRANCISCO STATE UNIVERSITY BUDGET ADMINISTRATION AND OPERATIONS OFFICE
 Budget Manual FISCAL YEAR 2018-19 SAN FRANCISCO STATE UNIVERSITY BUDGET ADMINISTRATION AND OPERATIONS OFFICE Date Created: 4/27/18 Date Revised: 6/19/18 Table of Contents INTRODUCTION... 3 BUDGET CYCLE...
University Town Hall Budget Presentation 2016
 University Town Hall Budget Presentation 2016 Presenters Robert Fenning, VP Administration and Finance Stephen Mastro, AVP Administration and Finance Homaira Masoud, University Budget Director March 17,
California State University Chico Budget Plan
 California State University Chico 21718 Budget Plan Cabinet Approved September 5, 217 CONTENTS 21718 Budget Plan General Fund, Lottery, Capital Outlay and Auxiliary Funds General Fund Allocation Exhibits
California State University, Long Beach
 California State University, Long Beach 2008-2009 Annual Management Report A Supplement to the Annual Audited Financial Report Foreword September 18, 2009 Dr F King Alexander President The Annual Management
California State University, Long Beach Annual Management Report A Supplement to the Annual Audited Financial Report
 California State University, Long Beach 2009-2010 Annual Management Report A Supplement to the Annual Audited Financial Report Foreword August 9, 2010 Dr. F. King Alexander President The Annual Management
STATE FUNDING REQUESTED VS. GOVERNOR S PROPOSAL. Proposed by the Governor
 2 STATE FUNDING REQUESTED VS. GOVERNOR S PROPOSAL CSU Request $216.6M Proposed by the Governor $119.5M Funding Gap $97.1M 3 ENROLLMENT PLAN 2013/14 2014/15 2015/16 Base Surplus Total Base Surplus Total
University Cabinet Outline of Budget Reduction Decisions February 22, 2018
 Priorities in Budget Planning Student success Equity and diversity Fiscal stability and good stewardship of resources Shared responsibility and accountability Values (These are summarized from the Values
MIDDLE GEORGIA STATE UNIVERSITY Budget Stakeholder Report Fiscal Year 2016
 MIDDLE GEORGIA STATE UNIVERSITY Budget Stakeholder Report Fiscal Year 2016 Dear MGA Stakeholder: Thank you for your interest in the MGA budget process. Whether you are an employee, student or just an interested
New Jersey Institute of Technology
 New Jersey Institute of Technology Budget Presentation to the Faculty Senate FY17 Budget Highlights FY17 Budget Status Status of Business Process Improvements Budget Development Calendar November 10, 2016
Approval of Fiscal Year 2019 Operating Budget UM
 Approval of Fiscal Year 2019 Operating Budget UM The Board will review the Fiscal Year 2019 University of Missouri System budget for approval at the meeting. The FY 19 all funds revenue budget is $3.2
Town Hall: FY18 Final Budget. Grand Salon Monday, September 25, :00 am
 Town Hall: FY18 Final Budget Grand Salon Monday, September 25, 2017 10:00 am Agenda 1. 2017/18 Approved Budget (System-wide and campus-level overview) 2. Strategic Initiatives Steering Committee 3. 2018/19
Campuswide Benefit Decentralization Implementation Process
 DRAFT--ISSUE REPORT January 18, 2012 Campuswide Benefit Decentralization 2012-13 Implementation Process TERMINOLOGY Unless otherwise stated, the term unit is intended to refer to the primary campus organizational
Fiscal Year 2019 Annual Operating Budget Executive Summary
 EXECUTIVE SUMMARY Fiscal Year 2019 Annual Operating Budget Executive Summary The University of Illinois System s consolidated Fiscal Year 2019 (FY19) budget recommendation is the culmination of a two year
EASTERN WASHINGTON UNIVERSITY BUDGET PRIMER
 EASTERN WASHINGTON UNIVERSITY BUDGET PRIMER STATE BIENNIAL BUDGET CYCLE OFM issues budget instructions EVEN YEARS JUN EWU BIENNIAL BUDGET CYCLE ONGOING Agency Strategic Planning Agencies submit budget
Erica Bowers, Ed.D. Chair, Planning, Resource, and Budget Committee (PRBC)
") MEMORANDUM Date: May 5, 2016 To: From: Mildred García, Ed.D. University President Erica Bowers, Ed.D. Chair, Planning, Resource, and Budget Committee (PRBC) Subject: PRBC Recommendations for FY 2016-17
MEMORANDUM Date: May 5, 2016 To: From: Mildred García, Ed.D. University President Erica Bowers, Ed.D. Chair, Planning, Resource, and Budget Committee (PRBC) Subject: PRBC Recommendations for FY 2016-17
Campus Budget & Funding Basics CALIFORNIA STATE UNIVERSITY, CHICO
 Campus Budget & Funding Basics CALIFORNIA STATE UNIVERSITY, CHICO October 20, 2016 & March 20, 2017 Campus Budget & Funding Basics 2 What funding sources are available? How are funds allocated? Who do
Budget Plan Cabinet Approved
 2018-19 Budget Plan Cabinet Approved AUGUST 29, 2018 CONTENTS 2018-19 Budget Plan General Fund, Lottery, Capital Outlay and Auxiliary Funds Page General Fund Allocation Exhibits I. Budget Planning Summary
New Mexico Highlands University Annual Operating Budget Process. approved Fall 2016
 New Mexico Highlands University Annual Operating Budget Process approved Fall 2016 Appendix I added Spring 2017 2 Table of Contents Introduction... 3 NMHU Budget Values and the NMHU Strategic Plan... 4
UH-Clear Lake Budget
 FY2016 Total Budget $ Millions Operating Budget $ 131.5 Capital Facilities 23.1 Total $ 154.6 Operating Budget Source of Funds Other Operating, $2.0M 2% Tuition & Fees $71.1M 54% Contracts & Grants *,
LEHIGH University. Financial Planning Report With Budget
 LEHIGH University Financial Planning Report With 2012-2013 Budget L E H I G H U N I V E R S I T Y 2 0 1 2-1 3 B U D G E T ------------------------- T A B L E O F C O N T E N T S PAGE I. COMMENTARY 1-9
THE CITY UNIVERSITY OF NEW YORK. Basic Financial Statements and Supplementary Schedules and Management s Discussion and Analysis
 Basic Financial Statements and Supplementary Schedules and Management s Discussion and Analysis (With Independent Auditors Report Thereon) Table of Contents Management s Discussion and Analysis 1 Independent
University Budget Committee Meeting
 University Budget Committee Meeting DATE: Thursday, September 1, 2016 LOCATION: NEC Room Administration Building, room 560 Members present: Les Wong Ronald Cortez Shannon Deloso Jennifer Summit Robert
Cleveland State University (a component unit of the State of Ohio) Financial Report Including Supplemental Information June 30, 2015
 Financial Report Including Supplemental Information June 30, 2015") Cleveland State University (a component unit of the State of Ohio) Financial Report Including Supplemental Information June 30, 2015 Contents Report of Independent Auditors 1-3 Management s Discussion
Cleveland State University (a component unit of the State of Ohio) Financial Report Including Supplemental Information June 30, 2015 Contents Report of Independent Auditors 1-3 Management s Discussion
SUBJECT: Campus Operating Fund Budget Call for Fiscal Year 2018/19
 February 22, 2018 M E M O R A N D U M TO: Provost Ching-Hua Wang Vice President Ming-Tung Mike Lee Vice President Phil Garcia Vice President Christine Lovely Vice President Christine Miller Vice President
LETTER FROM THE EXECUTIVE VICE CHANCELLOR, CHIEF FINANCIAL OFFICER
 LETTER FROM THE EXECUTIVE VICE CHANCELLOR, CHIEF FINANCIAL OFFICER The California State University is a remarkable institution that is comprised of 23 campuses offering an outstanding education to 438,157
California State University, Long Beach
 California State University, Long Beach 2011-2012 Annual Management Report A Supplement to the Annual Audited Financial Report Foreword August 15, 2012 Dr. F. King Alexander President The Annual Management
USF System Annual Strategic Budget Planning Process
 USF System Annual Strategic Budget Planning Process University budget strategy, planning and development should be led by the Provost to assure that the budget reflects USF s strategic priorities The President
Carry Forward of Year End Funds
 University of California, Merced Carry Forward of Year End Funds Responsible Official: Veronica Mendez, Vice Chancellor Finance and Admin Romi Kaur, Executive Director, Financial Planning & Analysis Responsible
University of Houston Student Leadership Forum Budget and Legislative Processes
 University of Houston Student Leadership Forum Budget and Legislative Processes June 13, 2012 Overview of the Planning and Budget Process 2 Multiple Cycles January 2012 February 2012 March 2012 April 2012
A New Academic Business Model for UMass Dartmouth
 Resourcing the Mission A New Academic Business Model for UMass Dartmouth Budgetary Planning Council 2016 Public Higher Ed in the 21 st C The situation The social compact has been compromised Resulting
Fiscal State of the University. Fall Semester October 16, 2008
 Fiscal State of the University Fall Semester 2008 October 16, 2008 1 Charge From Academic Senate BL 07-03 At a Senate meeting as close as possible to the beginning of the spring and dfll fall semesters,
Budget Planning Update. Academic and Business Administrators
 Budget Planning Update Academic and Business Administrators March 5, 2013 Budget Planning Updates State and UC Budget UCSD Budget and Planning Sources & Uses Budget Planning Process for 2013/14 Assumptions
University of Houston-Clear Lake Appendix A - Allocation of New FY 2014 Resources
 Appendix A - Allocation of New FY 2014 Resources Revenue Changes A Reallocations/Reductions B Appropriations Bill 1 Reallocations $ (920,892) 1 General Revenue $ 1,310,875 2 Reductions (985,000) 2 State
DRAFT Fiscal State of the University Spring 2010
 DRAFT Fiscal State of the University Spring 2010 May 20, 2010 2005 2010 Electrical Consumption 04/05 05/06 06/07 07/08 08/09 09/10 KWH (Million) 50 53.8 51.4 55.5 52.7 50 Campus SF (Million) 3.87 3.98
Hostos Community College Budget Process
 Hostos Community College Budget Process Note: The following is largely excerpted from the 2017 MSCHE Periodic Review Report The Budget Components and Financial Planning Process The primary source of annual
Financial Report to the Board of Trustees
 Financial Report to the Board of Trustees February 28, 2012 FY11 Closeout and FY12 Six Month Update University of Connecticut Health Center FY11 Closeout 2 University of Connecticut Health Center FY 2011
Campus Budget Open Forum. October 5, 2017
 Campus Budget Open Forum October 5, 2017 2 Agenda WSCUC Accreditation Area of Inquiry URPC membership and role Budget update Public facing budget dashboards Achieved budget savings (Spring 2017 - Phase
Budget Forum February 2, 2018
 Budget Forum February 2, 2018 Open Forum on Budget 2/2/18 Goals Have a common understanding of our current budget challenges Appreciate the urgency of addressing our fiscal situation See that we have a
PRBC Budget Update April 29, Willie J. Hagan Vice President for Administration and Finance/CFO
 PRBC Budget Update April 29, 2011 Willie J. Hagan Vice President for Administration and Finance/CFO First, We Have To Lock All The Doors and Hide All The Children This will be Painful! Agenda Quick Reminder
Annual Budget Report. Charlie Faas VP Administration & Finance/CFO
 2018-19 Annual Budget Report Charlie Faas VP Administration & Finance/CFO Facilities Special Year Student Recreation & Aquatic Center (SRAC) Interdisciplinary Science Building (ISB) Mubadala Silicon Valley
CALIFORNIA STATE UNIVERSITY, HAYWARD. Combined Financial Statements. June 30, (With Independent Auditors Report Thereon)
") Combined Financial Statements (With Independent Auditors Report Thereon) Three Embarcadero Center San Francisco, CA 94111 Independent Auditors Report Dr. Norma S. Rees President California State University,
Combined Financial Statements (With Independent Auditors Report Thereon) Three Embarcadero Center San Francisco, CA 94111 Independent Auditors Report Dr. Norma S. Rees President California State University,
WESTERN KENTUCKY UNIVERSITY. REPORT ON AUDIT OF INSTITUTION OF HIGHER EDUCATION IN ACCORDANCE WITH OMB CIRCULAR A-133 June 30, 2010 and 2009
 REPORT ON AUDIT OF INSTITUTION OF HIGHER EDUCATION IN ACCORDANCE WITH OMB CIRCULAR A-133 REPORT ON AUDIT OF INSTITUTION OF HIGHER EDUCATION IN ACCORDANCE WITH OMB CIRCULAR A-133 CONTENTS REPORT OF INDEPENDENT
West Virginia Higher Education Policy Commission
 West Virginia Higher Education Policy Commission Financial Statements and Additional Information for the Year Ended June 30, 2002, and Independent Auditors Reports WEST VIRGINIA HIGHER EDUCATION POLICY
University Budget Committee. April 13, 2018
 University Budget Committee April 13, 2018 1 Agenda I. Welcome II. Review and Approve Minutes from March 23, 2018 III. IV. UBC Feedback on Academic Senate Resolution on Increasing Faculty Involvement in
BUDGET AND FINANCIAL PLANNING OFFICE
 BUDGET AND FINANCIAL PLANNING OFFICE THE UNIVERSITY S BUDGET Unrestricted Tuition & Fees State Appropriation General Obligation Debt Service Restricted Federal Student Grants & Loans Auxiliaries/Enterprises
Today Decides Tomorrow
 Today Decides Tomorrow California State University, Chico Combined Financial Statements Table of Contents Presentation Letter 2 Independent Auditors Report 3 Combined Balance Sheet 4 Combined Statement
Supporting the educational mission of California s State Universities. Prepared by Auxiliary Organizations Association
 Prepared by Association February 2012 Overview What are they? Why were they created? What are the authorized function/roles? How they operate? Current issues impacting auxiliary organizations Association
FY 2011 BUDGET (MAY 5, 2010)
") Approved by Chancellor Spakes May 11, 2010 FY 2011 BUDGET (MAY 5, 2010) INTRODUCTION Taking into account a constrained resource environment, the FY 2011 budget recommendation supports the mission of the
Approved by Chancellor Spakes May 11, 2010 FY 2011 BUDGET (MAY 5, 2010) INTRODUCTION Taking into account a constrained resource environment, the FY 2011 budget recommendation supports the mission of the
Dean s RCM Workshops January 2015
 Dean s RCM Workshops January 2015 Agenda General overview of RCM Overview of the model and college budget composition Education s view of RCM Engineering s view of RCM Group Activity: Scenarios 2 General
Five-year Financial Plan Orientation
 Five-year Financial Plan Orientation Agenda Budget Overview Five-year Financial Plan Initiative Budget Overview Financing the Future The Financial Challenge Ahead Operating budget history Projects for
Connecticut State University System (The System Office, Central Connecticut State University, Eastern Connecticut State University, Southern
 Connecticut State University System (The System Office, Central Connecticut State University, Eastern Connecticut State University, Southern Connecticut State University, Western Connecticut State University,
Financial Report to the Board of Governors
 2007 2008 Financial Report to the Board of Governors McGill University, Montreal, Quebec, Canada H3A 2T5 D 08-09 www.mcgill.ca GD 08-05 The Mission of McGill University is the advancement of learning through
UNIVERSITY OF CALIFORNIA, BERKELEY. Annual Financial Report
 UNIVERSITY OF CALIFORNIA, BERKELEY Annual Financial Report 2008-09 TABLE OF CONTENTS Management's Discussion and Analysis 1 Financial Statements: Statements of Net Assets at June 30, 2009 and 2008 11 Statements
2013/14 University Budget Presentation. Josee Larochelle Associate Vice President for Finance
 2013/14 University Budget Presentation Josee Larochelle Associate Vice President for Finance 1 Agenda Prop 30 Impacts FTES Target and Projection Base Operating Fund Budget Sources & Uses of Funds Budget
The Stanford University Budget Plan
 i The Stanford University Budget Plan 2000/01 Submitted for Action to the Board of Trustees June 8-9, 2000 This publication can also be found on the World Wide Web at: http://www.stanford.edu/dept/pres-provost/budget/plans/plan01.html
Illustrated Guide to the Financial Statements FY2016/17
 Illustrated Guide to the Financial Statements FY2016/17 Table of Contents Contents Introduction 1 Definitions 2 Balance Sheet: Assets 5 Balance Sheet: Liabilities 8 Balance Sheet: Net Position 12 Income
Five-Year Financial Plan (FY2019 FY 2023) 02/23/18
 02/23/18") Five-Year Financial Plan (FY2019 FY 2023) 02/23/18 Renewing Our Vow to the Commonwealth Six years ago, we committed to a bold vision for UK- rebuild our campus, grow funds, support faculty and staff, and
Five-Year Financial Plan (FY2019 FY 2023) 02/23/18 Renewing Our Vow to the Commonwealth Six years ago, we committed to a bold vision for UK- rebuild our campus, grow funds, support faculty and staff, and
Budget Reform Update. Paul Ellinger, Associate Chancellor & Vice Provost Budget and Resource Planning
 Budget Reform Update Paul Ellinger, Associate Chancellor & Vice Provost Budget and Resource Planning February 2018 Outline Brief budget model overview Communication plan Principles Major components Timeline
Fiscal Years Financial Plan
 Fiscal Years 2017-2022 Financial Plan 1 FY 2017 Operating Budget Highlights FY2017 Operating Budget Highlights FY2017 budget ended with a surplus of $1.6M, most of which will be used to fund the multi-year
ALL FUNDS OPERATING BUDGET FY2016. Institutional Budget Document Page 1
 ALL FUNDS OPERATING BUDGET FY2016 Institutional Budget Document Page 1 Table of Contents Introduction... 3 Budget Highlights... 4 General Fund Changes... 4 Tuition & Fees Rate Increase %... 4 Enrollments...
Prepared by the Office of the Treasurer
 Prepared by the Office of the Treasurer 0 February 24, 2015 Agenda 1. Budget Principles & Model 2. Operating Budget Highlights 3. Enrollment & Housing 4. Investments & Reserves Overview 5. Debt & Capital
For Yale Faculty, Staff, and Students only
 For Yale Faculty, Staff, and Students only Budget Book Fiscal Year 2017 Cover photo: Brandon Boyer YC 15 Analyst, Office of Financial Planning & Analysis, Yale University FY17 Operating and Capital Budget
Cleveland State University (a component unit of the State of Ohio) Financial Report Including Supplemental Information June 30, 2017
 Financial Report Including Supplemental Information June 30, 2017") Cleveland State University (a component unit of the State of Ohio) Financial Report Including Supplemental Information June 30, 2017 Contents Report of Independent Auditors 1-3 Management s Discussion
Cleveland State University (a component unit of the State of Ohio) Financial Report Including Supplemental Information June 30, 2017 Contents Report of Independent Auditors 1-3 Management s Discussion
AGENDA COMMITTEE ON FINANCE
 AGENDA COMMITTEE ON FINANCE Meeting: 1:00 p.m., Tuesday, September 11, 2018 Glenn S. Dumke Auditorium John Nilon, Chair Peter J. Taylor, Vice Chair Jane W. Carney Douglas Faigin Emily Hinton Jack McGrory
CALIFORNIA STATE UNIVERSITY, HAYWARD. Combined Financial Statements. June 30, (With Independent Auditors Report Thereon)
") Combined Financial Statements (With Independent Auditors Report Thereon) Independent Auditors Report Dr. Norma S. Rees President California State University, Hayward: We have audited the accompanying combined
Combined Financial Statements (With Independent Auditors Report Thereon) Independent Auditors Report Dr. Norma S. Rees President California State University, Hayward: We have audited the accompanying combined
BGSU FY P ropose ed Bu dgets
 Office of Finance & Administration June 2013 BGSU FY 20 014 P ropose ed Bu dgets BGSU FY 2014 Proposed Budgets Educational & General Budgets (Bowling Green & Firelands Campus) General Fee & Related Auxiliary
CALIFORNIA STATE UNIVERSITY, HAYWARD. Combined Financial Statements. June 30, (With Independent Auditors Report Thereon)
") Combined Financial Statements (With Independent Auditors Report Thereon) Independent Auditors Report Dr. Norma S. Rees President California State University, Hayward: We have audited the accompanying combined
Combined Financial Statements (With Independent Auditors Report Thereon) Independent Auditors Report Dr. Norma S. Rees President California State University, Hayward: We have audited the accompanying combined
Budget Flint Campus
 2016-2017 Budget Flint Campus This page left blank intentionally. Table of Contents The University of Michigan - Flint Section One - Summary of Budgeted Revenues and Expenditures Schedule A: Summary by
CALIFORNIA STATE UNIVERSITY, FULLERTON. Financial Statements. June 30, (With Independent Auditors Report Thereon)
") Financial Statements (With Independent Auditors Report Thereon) Table of Contents Page Independent Auditors Report 1 Management s Discussion and Analysis (Unaudited) 3 Financial Statements: Statement of
Financial Statements (With Independent Auditors Report Thereon) Table of Contents Page Independent Auditors Report 1 Management s Discussion and Analysis (Unaudited) 3 Financial Statements: Statement of
BUDGETING FOR A FUNDS. Education and General Unrestricted Operating Funds
 BUDGETING FOR A FUNDS Education and General Unrestricted Operating Funds What is a budget? Why have a budget? Planning Controlling spending Identifying funding sources Good budgeting does not set priorities
SUBJECT: Campus Operating Fund Budget Call for Fiscal Year 2017/18
 February 3, 2017 M E M O R A N D U M TO: Provost Ching-Hua Wang Vice President Ming-Tung Mike Lee Vice President Phil Garcia Vice President Christine Lovely Interim Vice President Christine Miller Vice
SAN FRANCISCO STATE UNIVERSITY. Financial Statements. June 30, (With Independent Auditors Report Thereon)
") Financial Statements (With Independent Auditors Report Thereon) Table of Contents Page(s) Independent Auditors Report 1 2 Management s Discussion and Analysis (Unaudited) 3 14 Financial Statements: Statement
Financial Statements (With Independent Auditors Report Thereon) Table of Contents Page(s) Independent Auditors Report 1 2 Management s Discussion and Analysis (Unaudited) 3 14 Financial Statements: Statement
Informational Session for Fiscal Year Budget
 Informational Session for Fiscal Year 2016-2017 Budget PRESENTED BY Angela M. Poole, CPA Acting Vice President for Finance and Administration Florida Agricultural and Mechanical University Budget and Finance
MONITORING REPORT CHANCELLOR LIMITATIONS FINANCIAL CONDITION AND ACTIVITIES; FINANCIAL PLANNING AND BUDGETING
 MONITORING REPORT CHANCELLOR LIMITATIONS FINANCIAL CONDITION AND ACTIVITIES; FINANCIAL PLANNING AND BUDGETING Governing Board Agenda Meeting Date: 3/27/2018 Item Number Item Title Responsible Agents Budget
Frequently Asked Questions (FAQs) about NKU s New Budget Model
 about NKU s New Budget Model") Frequently Asked Questions (FAQs) about NKU s New Budget Model Philosophy and guiding principles Why did NKU need a new budget model? Internal and external factors pointed to the need for a more flexible,
Frequently Asked Questions (FAQs) about NKU s New Budget Model Philosophy and guiding principles Why did NKU need a new budget model? Internal and external factors pointed to the need for a more flexible,
Louisiana State University System
 Louisiana State University System 2013-2014 Quarter Operating Budget Report LSU and A&M College 1 Paul M. Hebert Law Center 10 Pennington Biomedical Research Center 18 LSU Agricultural Center 27 LSU in
q. PLANNING, RESOURCE, AND BUDGET COMMITTEE CURRENT
 q. PLANNING, RESOURCE, AND BUDGET COMMITTEE CURRENT 1) Composition. Vice President for Academic Affairs, Vice President for Administration and Finance, Vice President for Human Resources, Equity and Inclusiveness,
FY 2012 Revised Budget Document
 University of Tennessee, Knoxville Trace: Tennessee Research and Creative Exchange Budget Documents Office of Budget and Finance 2012 Revised Budget Document University of Tennessee Follow this and additional
University of California, Merced Final and Preliminary All-Funds Base Budget
 University of California, Merced 201516 Final and 201617 Preliminary AllFunds Base Budget FINAL Division of Planning and Budget Finance Group 1 WE WELCOME YOUR COMMENTS Division of Planning and Budget
I. Background. Budget Advisory Council
 Office of the Vice President for Finance & Business Operations 330.941.1331 Fax 330.941.1380 University Budget Process Updated 1/17/18 I. Background Youngstown State University s annual operating budget