Regional Transportation District 1600 Blake Street, Denver, Colorado rtd-denver.com ADOPTED BUDGET 2017
|
|
|
- Barrie Dorsey
- 5 years ago
- Views:
Transcription

1 Regional Transportation District 1600 Blake Street, Denver, Colorado rtd-denver.com ADOPTED BUDGET 2017
2 The Government Finance Officers Association of the United States and Canada (GFOA) presented an award of Distinguished Presentation to the Regional Transportation District for its annual budget for the fiscal year beginning January 1, In order to receive this award, a governmental unit must publish a budget document that meets program criteria as a policy document, as an operations guide, as a financial plan, and as a communications device. This award is valid for a period of one year only. We believe our current budget continues to conform to program requirements, and we are submitting it to GFOA to determine its eligibility for another award. RTD 2017 Adopted Budget Page i
3 RTD 2017 Adopted Budget Page ii
4 TABLE OF CONTENTS PART I. INTRODUCTION... 1 Summary... 2 General Manager s Budget Message... 3 PART II. ORGANIZATION AND GOVERNANCE Authority and Government District Map Officials Organization Chart Organization PART III. SERVICE, RIDERSHIP, AND COMMUNITY Service Ridership Customer Profile Local Economy Population PART IV BUDGET SUMMARY PART V GOALS AND PERFORMANCE MEASURES Goals and Performance Measures Performance Report PART VI REVENUES Base System Revenue Summary Base System Capital Sources Summary PART VII OPERATING EXPENDITURES RTD Operating Assumptions Operating Expenditures by Department Bus Operations Rail Operations Planning Capital Programs Safety, Security & Asset Management General Counsel Finance & Administration Communications Executive Office Board Office Non-Departmental PART VIII CAPITAL EXPENDITURES RTD Capital Program Assumptions RTD 2017 Adopted Budget Page iii
5 2016 Capital Accomplishments Capital Expenditure Summary Chart by Program Capital Expenditures Impact of Capital Program on Future Year Budgets PART IX FUND BALANCES PART X DEBT SERVICE DETAIL Overview of 2017 Annual Debt Service Debt Coverage Ratios Detail of Outstanding Debt Issues Legal Debt Limits PART XI. APPENDICES Budget Process Operating Budget Flow Chart Capital Budget Flow Chart Budget Preparation Calendar RTD Long Range Planning Process Fiscal Policies Line Item Detail of Operating Expenditures Glossary of Terms and Abbreviations List of Acronyms Map of FasTracks Project Index RTD 2017 Adopted Budget Page iv
6 Part I. Introduction RTD 2017 Adopted Budget Page 1
7 Summary This budget document is meant to provide the reader with a description of the 2017 Adopted Budget as approved by the Board of Directors of the Regional Transportation District (RTD) on November 29, The budget is developed based on departmental budgets, which are based on approved goals and objectives. This system seeks to allocate resources among related and at times competing activities and to optimize those resources in a manner consistent with defined organizational goals and objectives. The document is divided into three sections: Introduction and Organizational Structure The introductory section outlines the organization and its budgetary issues, describes the region and the customers served by the District, and provides the layout of the document Budget Summary Organizational and summary information is provided relating to the District s 2017 operating budget, capital budget, and fund balance in the Introduction (this section); Organization and Governance; Service, Ridership and Community; and Budget Summary. The 2016 Amended Budget serves as a reference for the development of the 2017 Adopted Budget Budget Review The final section is broken into six parts, each focusing in detail on a particular aspect of the 2017 Budget. Goals and Performance Measures, Revenues, Operating Expenditures, Capital Expenditures, Fund Balances, and Debt Service Detail are presented to provide the reader with access to all fundamental portions of the Budget. This final section provides detail on revenues and expenditures for both the operating and capital budget. Also, the approved goals, objectives, and performance measures are included as well as a list of planned projects for A personnel summary documents changes in staffing levels. Summary schedules have been rounded; therefore, minor differences may exist in totals. An Appendix has been added to aid the reader. For a complete listing of the contents of this document, please refer to the Table of Contents, Glossary, and Index. RTD 2017 Adopted Budget Page 2
8 General Manager s Budget Message March 1, 2017 It is my honor to once again provide this annual message as the General Manager and CEO of the Regional Transportation District. It is a privilege to lead the RTD staff, in partnership with our Board of Directors, of the finest transit agency in the nation. In a fourteen-month period RTD has successfully delivered four FasTracks projects, including: the Flatiron Flyer Bus Rapid Transit line along US 36 between Boulder and Denver; the University of Colorado A Line the region s first commuter rail line between Denver Union Station (DUS) and Denver International Airport (DIA); the B Line commuter rail from DUS to Westminster as the first leg of Northwest Rail and the R Line light rail through Aurora. With the opening of the G Line scheduled for later this year that will be five major FasTracks rapid transit projects opened for business in a very short period. With the opening of the University of Colorado A Line, we not only opened the most iconic line to date, it also marked the first major naming rights deal, which will bring to RTD $5 million over the life of the five-year deal. We are on target with the ridership projections for the new line, with more than 18,000 passenger trips each weekday. We ve achieved this despite challenges with crossing gates timing that has required our concessionaire, Denver Transit Partners, to place and pay for flaggers and signals at the at-grade crossings to ensure that auto traffic properly interacts with the crossing gates, which sometimes come down a few seconds early and stay down a few seconds longer than our operational goal. The most important thing to emphasize is that the system is operating in a completely safe manner. The B Line commuter rail line already exceeds the projected ridership for year 2020, and continues to grow. This line is the first segment of the Northwest Rail line that will one day extend through Boulder to Longmont. The R Line light rail provides a critical linkage between the previous end-of-line station at Nine Mile through Aurora Metro Center, the Veterans Administration Hospital, Fitzsimons Medical Campus and the Anschutz Medical Center, connecting with the University of Colorado A Line at the Peoria Station for the quick trip to DIA. Among the numerous RTD highlights for 2016, RTD was one of only three national APTA 2016 AdWheel Grand Prize Winners, for RTD s pre-opening marketing campaign. But that wasn t the only recognition for the agency. RTD was awarded $92 million in Small Starts grant funding from the Federal Transit Administration (FTA) for our Southeast Rail Extension project. Also RTD has continued to receive national attention for many of our employee development and recruitment programs, including the Workforce Initiative Now (WIN) program, Leadership Academy, and MAX programs. Our WIN Program is now serving nearly 500 participants and we are proud of the fact that we are putting people to work in some of the most impoverished areas of the metro area. Among our top priorities is the successful completion of the FasTracks program of projects by engaging our stakeholders and the private sector to seek collaborative and innovative methods of project development and funding mechanisms. As we ve seen, despite the fact the greatest recession since the Great Depression had a massive, unforeseen global RTD 2017 Adopted Budget Page 3
9 economic impact, by the end of 2017 we will have completed the West Rail Line, Denver Union Station, US 36 Bus Rapid Transit, the University of Colorado A Line (East Rail), the G Line (Gold Rail), the I-225 R Line (I-225 Rail) and the first segment of Northwest Line s B Line (Northwest Rail) as parts of the FasTracks program of projects. We will also complete the first phase of the North Metro Rail Line in 2018/2019, and shortly thereafter the Southeast Rail Line Extension, if we receive federal funds as anticipated. While these are major accomplishments of which we can all be proud, we know we still have more to do before the FasTracks vision becomes a complete reality. Along with these major accomplishments, the 2017 Adopted Budget Document reflects the critical policy decisions, operational goals, and financial plans made by the RTD Board of Directors for the coming year. This document details the contents of the budget for the Board of Directors, the State of Colorado, and the residents of the District. This budget message provides a description of the principles behind budget decisions and information regarding considerations that influenced budget development. Despite the stronger economy, we are continuing to slightly lag in sales and use tax collections. While collections have come close to last year s numbers, they still fall below what is needed to fully fund RTD s transportation services and capital programs at the optimal levels. The RTD Board of Directors and staff have once again made tough choices and eliminated or deferred the completion of many of our operating and capital projects in order to balance our 2017 budget, while ensuring that our existing service levels will not be reduced. We have actively and extensively worked with RTD s stakeholders throughout the budgeting process to seek input as those budget choices have been developed. The key drivers of the 2017 Budget have changed and will continue to change even as this Budget Document is completed. This document serves to chronicle RTD s initial adopted plan for 2017, which was approved by the Board of Directors in November As in years past, the Budget Document and its components will be reviewed and revised as necessary to meet the challenges of 2017 and future years as they arise. As outlined in the budget process flowchart, development of the annual budget is an extensive undertaking. The RTD Board of Directors approves a mission statement and goals and objectives. The Board then establishes its priorities for operating expenditures and capital requirements to meet these goals and objectives based on projected revenues. The RTD staff develops departmental budgets allocating the necessary resources to achieve the Board adopted goals. The Board adopted a vision statement, mission statement, and seven overall goals. RTD Vision Statement, Mission Statement and Goals The District's vision is "to deliver regional multimodal transportation services and infrastructure improvements that significantly and continually increase transit market share". The District s mission is "to meet our constituents present and future public transit needs by providing safe, clean, reliable, courteous, accessible, and cost-effective service RTD 2017 Adopted Budget Page 4
10 throughout the District". This vision and mission are expressed through the following goals: To meet the present transportation needs of the District by providing safe transportation service. To meet the present transportation needs of the District by providing clean transportation service. To meet the present transportation needs of the District by providing reliable transportation service. To meet the present transportation needs of the District by providing courteous transportation service. To meet the present transportation needs of the District by providing accessible transportation service. To meet the present transportation needs of the District by providing cost-effective transportation service. To meet the future transportation needs of the District. Each goal has several related action items and performance measures. A complete copy of the Goals and related Performance Measures is included in Part V of this document Board-Adopted Agency Strategic Goals Fiscal Sustainability Workforce/Human Capital Operations and Maintenance/State of Good Repair 2016 Accomplishments The past year was a very busy one for the Regional Transportation District. Below is a partial list that highlights some of the events that took place during 2016: Successfully opened three major transit lines in 2016 and o Opened US 36 Bus Rapid Transit Flatiron Flyer Service between Denver and Boulder o Opened the University of Colorado A Line between Denver Union Station and Denver International Airport o Completed construction and testing on the B Line, G Line, and I-225 project (R Line) in order to meet advertised revenue service opening o dates in Provided legal support to staff regarding agreements for 2016 openings including events, service changes, operations and maintenance agreements Implemented restructured bus service to accompany rail openings Awarded $92 million Southeast Rail Extension Small Starts Grant Agreement, Southeast Rail Extension project was included in President s FY 2016 New RTD 2017 Adopted Budget Page 5
11 Starts Funding Recommendations and received FTA approval to enter New Starts Engineering phase Implemented new fare structure following more than one year of the Fare Study public process resulting in Board approval Commenced the renovation and reconstruction of Civic Center Station Implemented several state of good repair projects for the existing light rail corridors and bus system Continued to replace transit fleets that have reached the end of their useful life including Mall Shuttles and 40-foot transit coaches One of only three national APTA 2016 AdWheel Grand Prize Winners, for RTD s pre-opening marketing campaign. Completed nearly 3000 tablet-based surveys on the 16th Street Mall to measure the effect of 16th Street Free Mall Ride detours for Meet in the Street events in conjunction with the City and County of Denver and the Downtown Denver Partnership. Publicly released Real Time Information (RTD website and 3rd party apps) Ensured that RTD was well represented at all levels of government federal, state, local as well as at stakeholder meetings and kept the RTD Board of Directors and RTD staff apprised of pertinent information Successfully launched the new trip planner, replacing the old planner used by Customer Care and the RTD website Continue to provide technological advances while ensuring the underlying information technology infrastructure is well maintained and kept up-to-date Developed expertise in FRA regulated rail services including safety, labor, and equipment related issues Initiated procurement of a consultant team for the detailed planning, NEPA and Preliminary Engineering process for arterial BRT on State Highway 119 Purchased and installed advance warning safety system for Wayside Workers Completed system upgrades on selected system infrastructure elements to assure maximum operational safety, efficiency and on-time service delivery Completed the Security Command Center at the Commuter Rail Maintenance Facility Analyzed accident data and evaluate current programs to reduce accidents and injuries Continued to award and administer contracts to support RTD Base System and FasTracks Maintained District-wide Stock out level below 1.5% (Performance Measure Goal) Increased DBE/SBE participation in the area of Operations and Maintenance goods and services Hosted a DBE/SBE recognition event for the Primes who exceeded expectations and DBE/SBE firms who performed work on the FasTracks corridors Continued focus on employee engagement, recruitment and retention Continued work with private sector regarding technology and FasTracks Maintained financial stability by managing competing priorities Maintained the agency s position as a transparent and collaborative partner throughout the region Maintained service levels without reductions Maintained state of good repair throughout the District RTD 2017 Adopted Budget Page 6
12 Created significant additional social media presence coordinated with opening of the University of Colorado A Line resulting in a 42% Increase in Twitter followers and a 214% increase in Twitter engagements; with a 15% Increase in Facebook followers and a 94% increase in Facebook engagements. During the 2016 session of the Colorado General Assembly, reviewed 776 bills and resolutions, monitored 11 bills with potential significant impacts to RTD, and monitored an additional 78 bills with less significant impacts Selected vendor for replacement of Mall shuttle buses that are beyond their useful life, with all-electric Zero Emission Vehicles which began delivery in 2016 Awarded a design-build contract for the Southeast Rail Extension and issued Notice to Proceed for final design Formally executed first major naming rights contract to the University of Colorado for the CU A Line that will gross $5 million in additional revenue for RTD over five-year contract period Isolated SCADA from the corporate network with a dedicated firewall significantly improving our cyber security Implemented tactics to improve recruitment and retention of bus operators, light rail operators, and mechanics Provided significant legal assistance to capital programs in contracts, intergovernmental agreements, change orders and issues resolution for ongoing capital projects Participated in ongoing negotiations and successful resolution of significant ATU 1001 Health and Welfare contract and trust issues Provided legal support and advice for RTD fare and pass program development Finalized Fare Study recommendations and received Board approval of recommended 2016 new fare structure and policies 2017 Planned Projects Implement restructured bus service network to accompany the opening of the G Line commuter rail service between Wheat Ridge, Arvada and DUS Complete the replacement of the 16th Street Mall shuttle buses with BYD allelectric Mall shuttle buses Develop draft service plan, seek public comment and seek Board approval of restructured bus services to accompany the opening of the N Line commuter rail service in 2018 Increase mobility options with the five new major services implemented in two years Place the G Line and R Line in service and institute Quiet Zones on the commuter rail lines Continue to work with CCD and the Downtown Stakeholders on developing solutions for the 16th Street Mall Finish drafting and implementing a comprehensive 5-year plan to make RTD proactive in information governance and enterprise content management. Develop and implement web-based Colorado Open Records Act intake procedures and accident/incident report processing Implement Mobile Ticketing. RTD 2017 Adopted Budget Page 7
13 Develop SBP, APE, Financial Plan and 2018 Budget that address Board goals of building reserves, meeting service needs, and address State of Good Repair and CBA wages/trust needs Initiate the Pass Program Study and convene the Pass Program Working Group Install and implement the advance railway safety warning system for Wayside Workers. Complete system upgrades on selected system infrastructure elements to assure maximum operational safety, efficiency and on-time service delivery Continue to implement state of good repair projects for the existing light rail corridors, bus system and facilities as outlined in the current SBP Complete the integration of light rail and commuter rail Command Centers for full redundancy and enterprise control from either location Initiate transition of RTD System Safety Plan to FTA mandated Safety Management System; provide oversight of FRA mandated Part 270 System Safety Plan Transition for commuter rail Begin implementation of new Enterprise-wide Hazard/Close Call Reporting System for light rail and commuter rail Implement a robust revised ADA complaint procedure, and partner and coordinate an inter-agency collaborative Small Business Event ADA committee structure review and revision Continue focus on employee engagement, recruitment and retention Continue work with private sector regarding technology and FasTracks Maintain financial stability by managing competing priorities Maintain the agency s position as a transparent and collaborative partner throughout the region Maintain service without reductions Maintain state of good repair This is just a partial listing of the many, many accomplishments and milestones the Regional Transportation District achieved and the goals and challenges RTD is working to complete by working together as a team and with our partners in the community. RTD 2017 Adopted Budget Page 8


14 Total operating budget: $626.1 million Total capital budget: $1,165.1 million Total appropriation: $2,169.2 million Unrestricted fund balance: $14.3 million Overview of the 2017 RTD Budget The 2017 Adopted Budget program includes an operating budget of $626.1 million, an interest expense budget of $160.9 million, capitalized interest of $33.0 million, new capital expenditures of $301.0 million, debt payments of $58.9 million, a FasTracks management reserve of $15.9 million, a FasTracks Internal Savings Account of $40.6 million, a Board appropriated fund of $29.7 million, a capital replacement fund of $15.0 million, an unrestricted operating reserve of $9.7 million, and an estimated unrestricted fund balance of $14.3 million. A carryforward of $864.1 million from previously approved capital projects also has been appropriated, resulting in a total capital budget of $1,165.1 million (excluding capitalized interest), and a total appropriation of $2,169.2 million. Total revenue (both Base System [non- FasTracks] and FasTracks) of $1,258.2 million is expected to increase $174.0 million (16.1%) in 2017 from the projected year-end The increase is due to 1) an increase in farebox revenue of $20.2 million, 2) an increase in sales and use tax revenue of $38.5 million, 3) an increase in grant revenue of $122.1 million, and 4) an increase in investment income of $0.4 million, offset by a decrease in other income of $7.2 million. Sales and use tax revenue, RTD s major revenue source, is expected to increase to $608.3 million in 2017 or 6.7% over the 2016 projected level according to the September semi-annual forecast by the University of Colorado-Leeds School of Business. Farebox revenue of $150.4 million is budgeted to increase $20.2 million or 15.5% over 2016 projected. On the Base System, fare revenue is budgeted to remain flat in 2017 and ridership growth as well is expected to be flat to minimal. For FasTracks, fare revenue is budgeted at $32.9 million, an increase of $20.2 million over 2016 projected, due to the full-year operation of the FasTracks service Sales and use tax revenue, RTD s major revenue source, is budgeted to increase by 6.7% in 2017 over 2016 projected per the CU-Leeds School September forecast. Farebox revenue is projected to increase $20.2 million or 15.5% over 2016 due to full-year operation of FasTracks service corridors launched in 2016 and more to open in Growth in ridership will come from FasTracks as ridership on the Base System is expected to be flat. corridors brought on-line in 2016 (East Rail and Northwest Rail B Line electrified segment) and those to be opened in 2017 (Gold Rail and I-225 Rail). Grant revenue overall (both operating and capital grants) is budgeted to increase $122.1 million over the 2016 Amended Budget to $477.0 million. Base System grants are projected to increase $30.4 million while FasTracks grants will increase $91.7 million largely due to significant carryforward grant funding. Investment income is budgeted to increase slightly by $0.4 million due to the impact of continued low in short-term interest rates coupled with deployment of invested funds; an expected small uptick in interest rates will stabilize investment income. RTD 2017 Adopted Budget Page 9


 other miscellaneous one-time increases. Increases to FasTracks generally consist of full allocation from Base System to FasTracks of costs of operating the new service corridors.")
15 Operating expenditures are budgeted to decrease 1.9% from the 2016 Amended Budget largely due to completion of several of the new FasTracks service lines offset by annual adjustments to ongoing operating costs and other one-time expenses. Diesel fuel is budgeted and locked at $1.69/gallon for Gasoline is budgeted at $2.65/gallon. Operating expenditures of $626.1 million on a combined basis are budgeted to decrease 1.9% or $12.2 million in 2017 compared to the 2016 Amended Budget. The decrease is primarily due to a $44.0 million decline in FasTracks project expenses due to completion of several FasTracks projects. This decline is offset by increases to the Base System for: 1) health insurance increases for salaried personnel, 2) costs for material salvage, 3) light-rail vehicle spare parts, 4) wages and salary adjustments, and 5) other miscellaneous one-time increases. Increases to FasTracks generally consist of full allocation from Base System to FasTracks of costs of operating the new service corridors. The expense project carryforward to 2017 is $15.0 million for the Base System and $21.4 million for FasTracks. Diesel fuel is budgeted at a locked price of $1.69 per gallon in 2017, compared to a price of $2.23 per gallon in 2016, for a savings of $5.3 million. Prior to 2017 Budget adoption, RTD locked its diesel fuel requirements in the commodities market at $1.69/gallon for all of 2017 which provided budget certainty. Gasoline, used mainly in ADA service, is budgeted at $2.65/gallon for a $600,000 savings from 2016 in which the budgeted price was $3.00/gallon. The budgeted amounts also reflect substantial reductions made to departmental operating budgets to align them with the Strategic Budget Plan target. Interest expense of $160.9 million in 2017 is budgeted to increase $43.6 million from 2016 projected. The increase is due to the inclusion of passthrough interest expense of $41.0 million for the first time in 2017 as part of the Denver Transit Partners service payment to pay DTP s Private Activity Bonds, and new interest expense for the full year from the 2016 FasTracks bond issuance. Interest expense is budgeted to increase $43.6 million in 2017 due to pass-through interest on bond financing for RTD s Eagle P3 project partner, and full-year debt service on a 2016 bond issuance for FasTracks. Principal payments on debt will be $58.9 million. No new debt issuances are planned for This increase is offset by a reduction to total interest expense from the favorable benefit of bond refinancing. Of total interest expense, $25.5 million is budgeted for Base System and $135.4 million is budgeted for FasTracks. Capitalized interest on a combined basis is budgeted at $33.0 million, the majority of which will occur in FasTracks. Capitalized interest will be part of the actual cash outlay for interest payments in Principal payments on debt are budgeted at $58.9 million in 2017, $2.8 million lower than the 2016 Amended Budget due to scheduled principal amortization on current debt. No new debt issuances are planned in 2017 for either the Base System or FasTracks. Both will draw from previously issued debt to fund major capital purchases and construction in In 2017, the FasTracks management reserve is estimated to be $15.9 million in support of FasTracks continuing construction, deemed sufficient to fund adjustments to the FasTracks construction schedule. In total the construction reserve has been budgeted at $81.3 million, split between the construction reserve at $56.3 million and a start-up operations reserve at $25.0 million. The start-up operations reserve was established in the FasTracks financial plan for the years in order to meet the required 1.2x RTD 2017 Adopted Budget Page 10

16 debt service coverage requirement if needed. In 2017, this reserve will be reduced to $0 from $25 million in order to meet debt service coverage, while the construction reserve will be maintained at $56.3 million. FasTracks contributed capital of $95.4 million will consist of concessionaire contributed capital on the Eagle project and Southeast Rail Extension (SERE) project and third-party betterments on the I-225 Rail and North Metro Rail construction projects that continue through New capital expenditures in 2017 of $301.0 million are budgeted to decrease $175.8 million for FasTracks and decrease $43.2 million for the Base System from the 2016 budget. The combined capital carryforward is $864.1 million. Capital expenditures are comprised of both the capital carryforward from 2016, arising from timing of project completion, and new capital for The combined capital carryforward will be $864.1 million made up of $166.1 million on the Base System and $698.0 million on FasTracks. New capital spending of $301.0 million on a combined basis in 2017 is budgeted to decrease $219.0 million from the 2016 Amended Budget due mainly to project completion in FasTracks. For FasTracks, new capital spending will decrease $175.8 million to $234.4 million in 2017 due to ongoing project completion on the Commuter Rail Maintenance Facility, Eagle project, US36 BRT, Northwest Rail, and I-225 Rail line, offset by increases to North Metro Rail. For the Base System, new capital spending will decrease $43.2 million to $66.6 million. Of this amount, the Base System will spend $6.0 million more in facilities construction and maintenance (primarily Customer Care Center relocation), $1.5 million more on park-n- Rides, and $4.1 million more on systems planning (mostly Colfax Avenue Transit Priority project). These increases will be offset by $1.0 million less on bus infrastructure, $49.4 million less on fleet modernization/expansion (bus and rail), and $5.3 million less in capital support projects (primarily IT support for the District). The Base System new capital was approved as part of the Strategic Budget Plan in September Notable designated reserve fund balance changes in 2017 include an increase of $2.9 million in the unrestricted year-end fund balance from the 2016 Amended Budget for a total unrestricted fund balance of $14.3 million. The increase consists of $2.9 million on FasTracks offset by a nominal decrease on the Base System. Also, on a combined basis, RTD is budgeting increases to all of its reserve funds in The objective is for the total of all funds excluding the capital replacement fund to equal three months of operating expenses for both the Base System and FasTracks. the Board-appropriated fund is projected to increase by $9.9 million to $29.7 million, and the capital replacement fund is projected to increase by $5.6 million to $15.0 million. An unrestricted operating reserve will be established for the first time in 2017 at $9.7 million on the Base System. The establishment of these fund reserves is in accordance with fiscal policies adopted by the RTD Board in 2012 and renewed annually. The objective is for the total of these funds excluding the capital replacement fund to equal approximately three months of operating expenses excluding depreciation for both the Base System and FasTracks. RTD 2017 Adopted Budget Page 11

17 The total of these unrestricted fund balances for 2017 is projected at $68.7 million on a District-wide basis, which equates to 11.0% of operating expense and 5.5% of total revenue. The 2017 Adopted Budget meets the cost recovery ratio mandated by the Colorado General Assembly. The estimated SB 154 recovery ratio, (all non-tax revenue except ADA farebox revenues divided by all expenditures, including depreciation, except ADA expenditures and expenditures incurred for long-term planning and development of rapid transit infrastructure) exceeds the annual target of 30% mandated by the Colorado General Assembly. Issues In the District s preparation of the 2017 annual budget, several challenges were encountered. RTD sales and use tax revenue combined recorded strong growth of 8.3% in 2012, demonstrating a rebound in consumer spending after the recessionary years. The rate of growth slowed in 2013 increasing 4.2% above 2012 levels, but the growth rate surged in 2014 increasing 9.8% over In Sales and use tax growth in 2017 is budgeted at 6.7% over 2016 projected. But in 2017, we expect to see signs of more cautious spending and saving behavior by households going forward. Sales and use tax is RTD s primary revenue source. 2015, tax revenue growth slowed to a more sustainable pace of 5.2%. At this writing, the latest forecast for RTD s total 2016 sales and use tax collections will be $569.8 million, a 5.2% increase over 2015 revenue. Strong growth is expected in 2017 at a rate of 6.7% to $608.3 million. RTD taxable sales are impacted in part by both retail marijuana sales and HB (see below), as well as strong overall economic conditions in the state and the District. In 2017, the Colorado unemployment rate is projected to remain low, personal income is projected to grow moderately, and retail sales will outpace the nation. In the short term, Colorado employment will continue to expand in the 2%-3% range. However, in the 2017 projection, the scenario indicates heightened household spending cautiousness which is a product of slower than baseline wage increases. Retail sales growth rates are projected to be lower than the rates of change in personal income, implying more cautious spending and saving behavior on the part of households going forward. In the 2017 Budget, RTD sales and use tax is budgeted to increase 6.7% over 2016 based on September forecasts of a belowtrend long-term growth scenario used at the time of preparation of the 2017 Budget. In 2013, Colorado House Bill was signed into law, which makes the RTD tax base the same as the state s tax base beginning Bringing RTD s tax base to parity with the state impacts the amount of use tax generated for RTD from the exclusion of machinery and machine tools and food sold through vending machines, and impacts sales taxes with the inclusion of cigarettes, candy and soda, and food containers in RTD s tax base. For 2017, the impact of HB has not been explicitly estimated, but the impact is inherent in 2017 revenues. RTD 2017 Adopted Budget Page 12


18 Beginning in 2014, there was another sales tax shift. Recreational marijuana was legalized under Amendment 64, and select jurisdictions within Colorado began allowing retail marijuana sales beginning January 1, As a result, RTD sales tax revenues from retail marijuana totaled $2.1 million in 2014 and grew to $3.7 million in RTD sales tax revenues from medical marijuana totaled $2.5 million and $2.6 million in those same periods. Through October 2016, RTD collected $4.4 million in retail marijuana sales, a 50% increase over the same period in 2015, and $2.3 million in medical marijuana sales, an 8% increase over the same period in Sales and use tax collections continue to be monitored closely as such taxes are RTD s primary operating revenue source. RTD receives its sales and use tax from the State of Colorado at the beginning of every month, and actual collections are evaluated against forecasts to identify shortfalls and the need for potential corrective actions to maintain the budget as early as possible. RTD has also received updated statewide sales and use tax forecasts from the University of Colorado Leeds School of Business on a quarterly basis; beginning in 2016, these forecasts were produced semiannually. The forecasts are used to update RTD s short-term and medium-term sales and use tax forecasts as well as update the FasTracks long range plan, and they also help to project the need for budget changes. Actions necessary to balance the 2017 Budget included elimination or deferral of $52.3 million in non-mission-critical projects from all projects initially requested. In order to balance the 2017 Budget, it will be necessary for RTD to continue implementation of: 1) cost control and on-going fiscal conservatism, 2) use of previously-issued COP financing proceeds and grant funding for transit buses and new light rail vehicles as part of scheduled fleet replacement, 3) elimination or deferral of non-mission-critical capital and operating projects (totaling $52.3 million), and 4) a lock price on diesel fuel of $1.69/gallon. RTD is not anticipating drawing on its reserve balances or reducing service in 2017 in order to maintain a balanced budget. Fluctuating fuel costs remain an issue that has been addressed for both the 2016 and 2017 budgets. RTD was faced with the choice of either 1) locking in the price per gallon of diesel fuel in order to avoid market price runs, or 2) riding the market float to see if benefits could be obtained if the market price were to drop. In 2014, a year of continued price fluctuation, diesel fuel consumption for the year was locked in at $3.12/gallon. For 2015, prices moved favorably and RTD s diesel fuel cost was locked at $2.95/gallon. In mid-year 2015, RTD took advantage of a The passage of legalized retail marijuana in 2014 added $3.7 million to RTD s sales tax revenue in 2015, on top of $2.1 million collected on the sale of medical marijuana in Sales tax collected on retail marijuana through October of 2016 showed 50% growth over the same period in RTD contracts with the University of Colorado-Leeds School of Business for sales and use tax forecasting. Updated forecasts are produced semi-annually. Prior to approval of the 2017 Budget, RTD locked its diesel fuel price for 2017 at $1.69/gallon, $0.54 less than the 2016 lock price for a savings of $5.3 million. RTD 2017 Adopted Budget Page 13


19 favorable opportunity to lock its diesel fuel price for 2016 at $2.23 per gallon. In late 2016, prior to approval of the 2017 Budget, diesel prices again moved favorably and RTD s diesel fuel was locked at $1.69 per gallon for This action was important because it guaranteed RTD a reasonable price and provided budget certainty for the year. The 2017 lock yielded savings of $5.3 million from RTD has not historically locked in a gasoline price as gasoline consumption is far less than diesel fuel. Two new rail lines and RTD s first Bus Rapid Transit line opened in 2016, including the University of Colorado A Line providing service to/from DIA. In 2017, two additional rail lines are scheduled to open. The FasTracks expansion program is changing transportation in the region. RTD continues its progress on the FasTracks expansion program. FasTracks is RTD's multi-billion-dollar comprehensive transit expansion plan to build 122 miles of commuter rail and light rail, 18 miles of bus rapid transit service, add 21,000 new parking spaces, redevelop Denver Union Station and enhance bus service to better connect the eight-county District. In 2016, RTD added two new rail lines: the University of Colorado A Line (or East Line) commuter rail serving Denver International Airport and downtown, and the Northwest Rail electrified segment (B Line). RTD also added the Flatiron Flyer, a Bus Rapid Transit System along US36 between Denver and Boulder. In 2017, final stages of construction work will continue on two additional rail lines, both of which are scheduled to open in These are the Gold Line to Arvada and the I-225 light rail line connecting the A Line to Nine Mile. Also in 2017, construction activity will increase along the North Metro Rail Line which will open in 2018, and on the Southeast Rail Extension which will open in 2019 to provide additional connections to the busy I-25. The budget staff has developed a full cost allocation methodology for the FasTracks system elements. The organization is in transition from construction build-out to operations and maintenance. A challenge for RTD s budgeting staff has been to develop appropriate cost allocation methodologies that accurately recognize the varied costs involved in operating and maintaining these unique facilities and bus and rail lines. The budget and planning staff will continue its work in developing the most accurate and relevant cost allocation method possible. In 2017, per FTA requirements and internal policy, costs of FasTracks operations will be allocated to FasTracks on the general ledger using a full allocation model in contrast to previous years partial allocation method. RTD s transition from a construction build-out organization to one of primarily operations and maintenance presents not only budgeting but cultural challenges as well to the organization. RTD reached a major milestone in the comprehensive FasTracks program in 2010 with the award of the contract for the Eagle project to Denver Transit Partners (DTP). The Eagle project, which includes the East (A Line) and Gold Line Corridors, a commuter rail maintenance facility, and a short electrified segment of the Northwest Rail Corridor, is the largest publicprivate partnership (P3) transit project in the United distinction of being the largest The Eagle project has the States. RTD has contracted with DTP to design, public-private partnership build, and finance the initial construction of the (P3) transit project in the U.S. project, and to operate and maintain all project assets through the year RTD will make annual service payments to DTP based on RTD 2017 Adopted Budget Page 14

20 their performance of the operation and maintenance of the project. Through this contract, RTD will realize savings over its internal estimated construction costs, and RTD will establish its operating and maintenance costs for the first 30 years of corridor operations. RTD has also harnessed the innovation of the private sector to help deliver two additional FasTracks corridor projects. In 2012, RTD received an unsolicited proposal to construct and finance the I-225 light rail line, resulting in a contract to complete the line by early 2017, with RTD issuing sales tax bonds to finance the project. In 2013, RTD received an unsolicited proposal to construct and finance the North Metro commuter rail line, resulting in a contract to construct the line to the 124 th Avenue station by 2018, with an option to complete the line to 162 nd Avenue as funding becomes available. This project was the first FasTracks project to use COP financing for infrastructure, with the line itself serving as collateral for the COP. Additionally, in 2015 RTD obtained a funding match from local stakeholders of 16.5% towards completion of the Southeast Rail Extension project. This local funding match is unprecedented and is far more than the 2.5% RTD asked from its local partners. Partnerships like these focused on ways to make progress on FasTracks projects that still need to be completed will continue to be a priority for RTD in the year ahead. Despite its success with the projects currently nearing completion, implementation of the entire FasTracks plan continues to present challenges to RTD. Since the FasTracks vote in 2004, the program has encountered a number of challenges outside of RTD s control, namely a significant increase in the cost of construction materials and a significant decrease in sales tax revenues. Due to these economic challenges, it will require additional revenues from what was originally planned to complete FasTracks sooner rather than later. Given ever changing market conditions, it is a challenge to identify a finite budget for the building out of FasTracks. That is why RTD conducts a comprehensive program evaluation each year. Although numbers continue to fluctuate based on economic volatility, FasTracks will be funded by a combination of region-wide sales tax, federal funds, public-private partnerships and local contributions. Every year staff conducts a comprehensive evaluation of the entire FasTracks program called the Annual Program Evaluation (APE). Staff examines the scope, schedule, costs The Annual Program Evaluation is the annual evaluation of the FasTracks program and provides the opportunity to address trends and modify financial assumptions. The FasTracks plan continues to challenge RTD from a cost perspective. RTD is moving forward with the remaining FasTracks projects in the best ways possible. and revenues to modify the program as necessary to meet goals. The APE allows the agency to address trends and to make necessary modifications to the program while keeping our commitment to be fiscally responsible, efficient and cost effective. The process allows RTD to be proactive in making prudent management decisions and establishing strategies for cost containment, value engineering and innovation to complete the program as soon as possible. RTD 2017 Adopted Budget Page 15
21 The current adopted Regional Transportation Plan (RTP) identifies funding to complete only two additional FasTracks projects within its time horizon of 2040, and those projects are expected to be completed by RTD will continue to re-examine its financial plan for the completion of FasTracks to identify other opportunities to complete additional projects within the extended time horizon of the RTP. Finally, part of my continuing vision for the organization is that we all continue to realize the tremendous public safety responsibility we have and that we seek to become the safest transit agency in the country, and that we continue to carry out the policies of the RTD Board in an outstanding fashion. I thank each staff member who helped to prepare and present the 2017 Budget. Respectfully, David Genova General Manager and CEO RTD 2017 Adopted Budget Page 16
22 Part II. Organization and Governance RTD 2017 Adopted Budget Page 17
23 Authority and Government The Regional Transportation District (RTD) provides public mass transit service to the Denver Metro area. In 1969, the Colorado General Assembly found that public transit was a necessary part of the growing Denver Metropolitan Region and that public sector involvement was the best method to ensure the continuation of this vital component; thus, the Regional Transportation District was created as a political subdivision of the State effective July 1969 to develop, maintain, and operate a public mass transportation system for the benefit of the inhabitants of the District. District boundaries include all of Denver, Boulder, Broomfield, and Jefferson counties, the urbanized portions of Adams, Arapahoe, Douglas Counties, and a portion of Weld County. Approximately 3.0 million people, or 55% of the population of Colorado, reside within RTD s 2,340 square mile area. This service area is shown in the map on the facing page. Since 1983, the District has been governed by a fifteen-member Board of Directors who are elected by their constituents to serve four-year terms. There are over 175,000 voters per director district. The District s Board is responsible for setting District policy, adopting the agency s annual budget, and establishing short and long-range transit goals and plans in concert with local, state, and federal agencies. The financial reporting entity includes all the financial activities of the Regional Transportation District, as well as those activities of its component unit, the RTD Asset Acquisition Authority, Inc., a nonprofit corporation established to implement the financing and acquisition of certain District projects financed through Certificates of Participation. The Authority has been included in the reporting entity as a blended component unit. RTD 2017 Adopted Budget Page 18


24 District Map RTD 2017 Adopted Budget Page 19
25 Officials Board of Directors RTD s governing body is a 15-member elected Board of Directors, with each member elected from one of the fifteen districts comprising RTD s service area. Each district is apportioned equally by population and most districts cross county boundaries. The districts are assigned letter designations from A to O. The following are the members of the Board of Directors as of January 2017: District A Kate Williams Denver/Arapahoe Counties District B Barbara Deadwyler, Second Vice Chair Denver/Adams Counties District C Ernest Archuleta Denver/Adams/Jefferson Counties District D Jeff Walker, Secretary Denver/Jefferson/Arapahoe Counties District E Claudia Folska Denver/Arapahoe Counties District F Bob Broom Arapahoe County District G Ken Mihalik Arapahoe/ Douglas Counties District I Judy Lubow Boulder/Broomfield/Adams/Weld Counties District J Larry Hoy, Chair Adams/Jefferson/Broomfield Counties District K Paul Solano Adams County District L Lorraine Anderson Jefferson/Boulder/Broomfield Counties District M Natalie Menten, Treasurer Jefferson County District N Tina Francone, First Vice Chair Jefferson/Denver Counties District O Charles Sisk Boulder County District H Doug Tisdale Arapahoe/ Douglas Counties RTD 2017 Adopted Budget Page 20
26 Organization Chart Taxpayers and Customers Board of Directors General Manager Executive Office Bus Operations Safety, Security & Asset Management Planning General Counsel Rail Operations Capital Programs Finance & Administration Communications Department Officials General Manager David Genova AGM*, Bus Operations Bruce Abel AGM, Rail Operations Terry Emmons AGM, Capital Programs Henry Stopplecamp AGM, Planning Bill Van Meter General Counsel Rolf Asphaug AGM, Finance & Administration/CFO Heather Copp AGM, Communications Scott Reed AGM, Safety Security & Asset Management/Chief Safety Officer Mike Meader *Assistant General Manager RTD 2017 Adopted Budget Page 21
27 Organization RTD employs over 2,700 individuals, making it one of the largest employers in the eight county area. Besides its administrative headquarters in Denver, RTD has three bus operating facilities including one in Denver, one in Aurora, and one in Boulder. There is one central shop facility in Denver, one light rail maintenance facility in Denver and one in Englewood, and one commuter rail maintenance facility in Denver. RTD also has four walk-in customer service centers: two on the Sixteenth Street Mall in Denver, one at Denver International Airport, and two in Boulder. Cost Recovery Ratio The 2017 Adopted Budget meets the cost recovery ratio mandated by the Colorado General Assembly. The estimated SB 154 recovery ratio, (all non-tax revenue except ADA farebox revenues divided by all expenditures, including depreciation, except ADA expenditures and expenditures incurred for long-term planning and development of rapid transit infrastructure), is 34.9%, which exceeds the annual target of 30% mandated by the General Assembly. The RTD operating revenue recovery ratio (operating revenues except ADA farebox revenues divided by the same cost basis as defined by the Colorado General Assembly) is estimated at 21.5%. RTD 2017 Adopted Budget Page 22
28 Part III. Service, Ridership, and Community RTD 2017 Adopted Budget Page 23
29 Service RTD provides service on 137 fixed routes operating within its boundaries. These include local bus services along major streets, express and regional bus routes providing nonstop services along longer distances, bus service to Denver International Airport, a free shuttle on the Sixteenth Street Mall in downtown Denver, a free shuttle service on Eighteenth and Nineteenth Streets through downtown Denver, light rail service serving Denver and its southern and western suburbs and a commuter rail line service serving Denver International Airport as well as Denver s northern suburbs. In addition to the fixed route services, RTD provides services to sporting events and other special events, special services for the disabled and senior citizens, and door-to-door services in limited areas of the District. RTD provides these services through a network of 9,751 bus stops and 77 park-n-ride facilities. Route, fare structure, schedule, and other system access information is available through route brochures, at all transfer stations and walk in customer service centers, at the RTD website ( and from the Telephone Information Center, The following two tables provide a summary of the RTD fare structure which reflects the fare increase and restructure effective January 1, 2016: Single Trip Fares Mode Fare Senior/Disabled/ Student 1 Mall Shuttle Free Free Metro Ride Free Free Local Bus - Local Rail 2 $2.60 $1.30 Day Pass $5.20 $2.60 Regional Bus - Regional Rail 3 $4.50 $2.25 Day Pass $9.00 $4.50 Bus - Rail Airport 4 $9.00 $ Seniors include age 65 and older. Student patrons include elementary, middle school, and high school students, ages 6 19 years of age. 2 Trips consisting of one or two zones. 3 Trips consisting of three fare zones. 4 Airport zone. Day pass is included in Regional/Airport Day Pass. Mode Local Bus Local Rail Multiple Trip Fares 10-Ride Ticket Book 5-Day Pass Book Regular Monthly Other Monthly 5 ValuPass (Annual) $26.00 $23.50 $99.00 $49.00 $1, Regional Bus Regional Rail $45.00 $40.50 $ $85.00 $1, Bus Rail Airport $45.00 $ $ $85.00 $1, Includes monthly fares for student, disabled, and senior patrons. 6 Travel to DIA requires upgrade. RTD 2017 Adopted Budget Page 24
30 Ridership In 2016, there were million boardings on RTD service vehicles. This translates to approximately 333,000 boardings on an average weekday. The chart below shows RTD boarding trends for the past ten years. RTD Annual Boardings (millions) RTD experienced an overall ridership decrease of 1.6% from 2015 to Light Rail ridership experienced a 3.7% decrease while ridership on bus service decreased 5.1%. The Mall Shuttle and FreeMetro Ride experienced a decline in ridership of 12.0% due to 5 weekends in 2016 called Meet in the Street during which the City and County of Denver suspended all bus service on the 16 th Street Mall to encourage community engagement and consumer spending. RTD 2017 Adopted Budget Page 25
31 RTD System Ridership Twelve Month Comparison Service Class Difference Boardings Percent Total Revenue Bus Service 59,005,677 62,193,254 (3,187,577) (5.1%) LRT (Light Rail) 24,585,082 25,518,578 (933,496) (3.7%) CRT (Commuter Rail) 4,317, , % Total Revenue Service Boardings 87,908,164 89,711, , % Mall Shuttle and Free MetroRide 12,340,052 14,017,760 (1,677,708) (12.0%) Total Fixed Route Service Boardings 100,248, ,729,592 (1,481,376) (1.5%) access-a-ride 886, ,082 (17,893) (2.0%) Vanpools 205, ,244 (123,265) (37.4%) TOTAL SYSTEMWIDE BOARDINGS 101,322, ,944,918 (1,622,534) (1.6%) Customer Profile In a 2014 Customer Satisfaction Survey conducted by RTD, weekday riders of RTD s bus service, light rail, skyride (airport service), and call-n-ride were polled through questionnaire. The results indicate that the majority of RTD s ridership is in professional, managerial, sales, or clerical service. The questionnaire revealed that more women ride RTD than men, except on skyride and Light Rail. The annual household income of riders varies widely depending on the location and type of service. Per the customer satisfaction questionnaire, 51% of the bus riders surveyed had annual household incomes less than $35,000. Respondents riding light rail indicated 42% having household incomes less than $35,000. RTD 2017 Adopted Budget Page 26
32 Annual Household Income Bus Total (Excluding skyride) Light Rail call-n- Ride skyride 1 Under $15,000 22% 20% 17% 6% $15,000-$24,999 15% 13% 11% 11% $25,000-$34,999 14% 9% 8% 11% $35,000-$49,999 12% 9% 14% 15% $50,000-$74,999 13% 14% 23% 18% $75,000-$99,999 10% 11% 13% 14% $100,000 or more 14% 23% 14% 25% According to the 2014 Customer Satisfaction Survey conducted by RTD. Surveyed weekday riders reported the following reasons for taking RTD. Weekday Trip Purpose Bus Total (Excluding skyride) Light Rail call-n- Ride skyride 1 Commuting (work) 75% 59% 78% 71% Personal Business 7% 12% 2% 24% Social/Entertainment 2% 6% 3% Shopping/Eating Out 3% 5% 6% School/College 6% 14% 2% Medical appointment 4% 3% 2% Other 2% 1% 6% 5% According to the 2014 Customer Satisfaction Survey conducted by RTD. The RTD 2014 Customer Satisfaction Survey also showed that 43% of weekday bus passengers were transit dependent due to not owning a vehicle, because of having a mental or physical disability that prevented operating a vehicle, or not having a valid driver s license. Further details are provided below: Transit Dependency Bus Total (Excluding skyride) Light Rail call-n- Ride skyride 1 Transit Dependent 59% 41% 57% 22% According to the 2014 Customer Satisfaction Survey conducted by RTD. 1 Majority of service discontinued with opening of University of Colorado A Line in RTD 2017 Adopted Budget Page 27
33 Local Economy Metro Denver experienced job growth in each super sector in 2016 for the fourth consecutive year, leading to a gain of 45,400 jobs across the seven-county area. Employment growth in Metro Denver continued to outpace the nation and the state. In 2017, job gains will continue to be broad-based but at a slower 2.4% pace as labor markets tighten and unemployment remains low. The three fastest growing super sectors in 2016 will likely be among the fastest growing in 2017 including natural resources and construction, education and health services, and leisure and hospitality. Financial services is also expected to re-emerge as one of the fastest growing super sectors in The unemployment rate in Metro Denver is expected to average about 3.6% in 2017, an increase from 2016 but still one of the lowest rates since Metro Denver s expanding economy will continue to be supported by a strong entrepreneurial environment, business friendly policies, and a talented workforce. Employment growth, increased income, and strong consumer confidence will contribute to healthy consumer spending activity, higher retail sales, and increased sales and use tax revenue for local governments in the Metro Denver region. Demographic changes will boost markets related to housing and healthcare, while some markets will continue to struggle with competition from e-commerce and changing consumer preferences. Consumer spending will also be shaped by increased labor force participation and earnings of the 65 years and over demographic, boosting work-related consumer expenditure categories such as apparel and transportation. Strong net migration and positive economic activity will continue to push home prices higher. However, 2017 will mark the first year since 2010 that the population in Metro Denver will not increase at a faster pace than the state. Continued residential construction activity, slower sales activity of existing homes, and potential interest rate increases will ease home price pressures. In 2016, multi-family comprised the majority of the new residential units in the market. However, the balance will shift back to single-family detached units in 2017, which is more indicative of historic norms. All four commercial property types (office, industrial, flex, and retail) recorded strong fundamentals in 2016, reporting low vacancy rates and rising average lease rates. While commercial construction will continue at a brisk pace in 2017, much of the activity will be the completion of projects already under construction, with a more limited number of new projects announced. The strength and diversity of the Metro Denver economy will ensure that the region continues to thrive in Ongoing development of the FasTracks rail system is opening up new opportunities for housing and nonresidential development. This investment, along with continued improvements at Denver International Airport, recently passed bond issuances for some of the region s public K-12 school districts, and a keen focus on entrepreneurship and small business development, provide pieces of the important infrastructure that supports Metro Denver s vibrant economy. Metro Denver received several accolades in 2016, including: Forbes ranked Denver as the nation s best place for business and careers for the second year in a row. RTD 2017 Adopted Budget Page 28
34 U.S. News and World Report named Denver the best place to live in the country based on a healthy job market, cost of living, and perception as a desirable place to live. Yahoo! Finance ranked Denver among the five best cities to start a career after college graduation. The Brookings Institute found the Denver MSA had the sixth-highest employment rate for young adults between the ages of 20 and 24. MoneyRates.com ranked the Denver MSA as the ninth best city for young entrepreneurs. BankRate.com ranked the Denver MSA as the eighth-best region for building wealth. In summary, Metro Denver will experience strong employment growth in the natural resources and construction, financial activities, education and health services, and the leisure and hospitality super sectors in Strong construction activity and home prices will characterize the residential real estate market. Low inventory will continue to challenge the market and slightly slower demand and higher interest rates will moderate price appreciation. With all indicators considered, Metro Denver s employment growth will slow to a rate closer to the national average as the labor market tightens and net migration tapers. Source: Metro Denver Economic Development Corporation RTD 2017 Adopted Budget Page 29
35 2016 Employment by Industry Government Other Services Leisure & Hospitality Education & Health Services Professional & Business Services Financial Activities Information Trade, Transportation & Utilities Manufacturing Mining, Logging & Construction 0% 5% 10% 15% 20% Denver Metro Area U.S. Source: U.S. Department of Labor, Bureau of Labor Statistics Metro Denver is one of the top ten metro areas for young workers. In 2016, more than 43% of residents had a bachelor s degree or higher. Colorado will be among the top 10 states for employment growth during 2016 and will post a 2.2% increase in employment for the year. The 10 largest private employers in Metro Denver in 2016 are listed in the table below. Largest Private Employers Company Product/Service Employees HealthONE Corporation Healthcare 11,960 Centura Health Healthcare 9,450 SCL Health System Healthcare 9,060 Lockheed Martin Corporation Aerospace & Defense Related Systems 7,460 UCHealth Healthcare, Research 6,770 Comcast Corporation Telecommunications 6,760 Kaiser Permanente Healthcare 6,420 Children's Hospital Colorado Healthcare 6,100 CenturyLink Telecommunications 5,840 United Airlines Airline 5,500 Note: This list does not include retail or public/governmental organizations Source: Metro Denver Economic Development Corporation RTD 2017 Adopted Budget Page 30
36 Population The seven-county Metro Denver area is now home to over 3.1 million people. Metro Denver s population growth averaged 1.8% per year between 2006 and 2016, maintaining a stable growth rate through most of the recent recession and recovery due to strong positive net migration. Forecasters with the State Demography Office expect the region s population growth rate will decrease slightly to 1.8% in 2017, which would be significantly faster than the projected U.S. growth rate of 0.8% in Based on forecasts, 2017 will mark the first year since 2010 that the population in Metro Denver will not increase at a faster pace than the state. Population growth in the region is expected to average 1.5% per year through The Regional Transportation District contains approximately 95% of the population in the region. Source: Metro Denver Economic Development Corporation 2017 based on projected figures RTD 2017 Adopted Budget Page 31
37 This page intentionally left blank. RTD 2017 Adopted Budget Page 32
38 Part IV Budget Summary RTD 2017 Adopted Budget Page 33


39 RTD 2017 Adopted Budget Page 34

40 RTD 2017 Adopted Budget Page 35
41 COMBINED Regional Transportation District 2017 Adopted Budget Combined (In Thousands) 2015 Actual 2016 Re- Amended Budget 2016 Projected 2017 Adopted Budget $ Change 2017 Adopted Budget vs Re- Amended Budget % Change 2017 Adopted Budget vs Re- Amended Budget Operating Revenue Farebox Revenues $ 120,530 $ 130,173 $ 130,173 $ 150,411 $ 20, % Advertising Revenues 4,161 3,300 3,300 3, % Joint Venture Revenue % Other Operating Revenues ,700 1, % Total Operating Revenue 125, , , ,434 21, % Operating Expenses (excluding Depreciation) Bus Operations 160, , , , % Rail Operations 48, , , ,393 (4,621) -3.7% Private Carrier Operations 83, , , ,285 1, % Access-a-Ride 30,711 41,614 41,614 43,497 1, % Planning 3,902 9,690 9,690 8,275 (1,415) -14.6% Capital Programs 73, , ,374 57,104 (53,270) -48.3% Safety, Security and Asset Management 15,445 23,712 23,712 28,105 4, % General Counsel 11,832 12,473 12,473 11,532 (941) -7.5% Finance and Administration 37,004 46,908 46,908 51,603 4, % Communications 11,325 19,533 19,533 14,737 (4,796) -24.6% Executive Office 5,036 7,481 7,481 6,342 (1,139) -15.2% Board Office 1,121 1,536 1,536 1,361 (175) -11.4% Other Non-Departmental Expenditures 3, ,889 4, % Less: FasTracks Service Increases % FasTracks Internal Savings Account (FISA) Contribution % Allocated Expenditures % Expense Projects Carry-forward - - (36,349) 36,349 36, % Total Operating Expenses (excluding Depreciation) 486, , , ,076 (12,178) -1.9% Operating Income/(Loss) (360,892) (503,284) (466,935) (469,642) 33, % Non-Operating Revenues Sales Tax 495, , , ,205 36, % Use Tax 46,009 52,742 52,742 55,069 2, % Grant Revenue - Operating 73,383 96,767 85,274 90,428 (6,339) -6.6% Grant Revenue - Capital 157, ,089 93, , , % Investment Income 3,165 3,840 3,840 4, % Other Income 11,317 20,200 20,200 12,328 (7,872) -39.0% Total Non-Operating Revenues 786, , ,036 1,101, , % Income Before Debt Service and Cap Ex 426, , , , , % Debt and Reserves Debt Payments (65,688) (61,698) (61,698) (58,898) 2, % Interest Expense (81,018) (117,313) (117,313) (160,912) (43,599) 37.2% Financing Proceeds 421, , ,811 - (228,375) % Drawdown/(Increase) in FasTracks Debt Service Reserve - - (28,811) 9,315 9, % Drawdown/(Increase) in FasTracks Construction Reserve - 18,700 18,700 - (18,700) % Drawdown (Increase) in FasTracks Internal Savings Account - 15,995 (16,998) 2,942 (13,053) -81.6% Contributed Capital 6, ,416 3,628 95,361 (102,055) -51.7% Increase / (Decrease) in Debt and Reserves 281, ,475 26,319 (112,192) (393,667) % Capital Expenditures Prior Year Approved Capital Carryforward 88, , , ,089 20, % Capitalized Interest - 32,981 32,981 32, % Facilities Construction & Maintenance ,998 5, % Bus Infrastructure - 7,473 7,473 6,434 (1,039) -13.9% Park-n-Rides ,544 1, % Capital Support Projects - 2,327 2,327 3, % Rail Construction % Rail Transit - 37,016 37,016 2,059 (34,957) -94.4% Fleet Modernization & Expansion - 57,114 57,114 42,710 (14,404) -25.2% Capital Support Equipment - 5,583 5, (5,259) -94.2% Systems Planning ,127 4, % Unallocated Capital (1) -0.4% Fastracks Program 710, , , ,395 (175,838) -42.9% Net Capital Expenditures 798,324 1,396,223 1,396,223 1,198,090 (198,133) -14.2% Current Activity $ (90,961) $ (669,373) $ (1,063,803) $ (678,122) $ (8,749) 1.3% RTD 2017 Adopted Budget Page 36


42 RTD 2017 Adopted Budget Page 37
43 NET POSITION Regional Transportation District Fiscal Year 2017 Recommended Budget - Fund Balance Combined (In Thousands) 2015 Actual 2016 Re- Amended Budget 2016 Projected 2017 Adopted Budget $ Change 2017 Adopted Budget vs Re- Amended Budget % Change 2017 Adopted Budget vs Re- Amended Budget COMBINED BEGINNING NET POSITION $ 3,300,400 $ 3,447,505 $ 3,447,505 $ 3,830,395 $ 382, % Income Before Debt Service and Cap Ex 439, , , , , % Debt and Reserves 281, ,475 26,319 (112,192) (393,667) % Net Capital Expenditures (798,324) (1,396,223) (1,396,223) (1,198,090) 198, % Current Activity (77,236) (668,800) (1,063,230) (678,122) (9,322) 1.4% Depreciation and Amortization (142,160) (221,857) (221,857) (251,868) (30,011) 13.5% Other 1 360,297 1,202,814 1,443,628 1,746, , % Contributed Capital & Deferred Interest 6, , , ,603 (102,055) -44.8% Total Change in Net Position 147, , , , , % ENDING NET POSITION $ 3,447,505 $ 3,987,320 $ 3,830,395 $ 4,772,628 $ 785, % NET POSITION Net Investment in Capital Assets 3,274,663 3,683,522 3,483,522 4,429, , % Nonspendable Net Assets 3,274,663 3,683,522 3,483,522 4,429, , % Debt Service Reserves 2 114, , , ,976 19, % Other Designated Reserves 2 3,918 3,918 3,918 3, % Tabor Reserve 20,284 18,678 21,880 23,438 4, % FasTracks Management Reserve 3 30,000 15,890 15,890 15, % FasTracks Start-up Operations Reserve 40,000 25,000 25,000 - (25,000) % FasTracks Construction Reserve 4 (145,531) 56,300 56,300 56, % Restricted Net Position 63, , , ,522 (744) -0.3% FasTracks Internal Savings Account (FISA) 27,007 28,927 43,556 40,614 11, % Board Appropriated Fund 27,877 19,780 18,592 29,716 9, % Capital Replacement Fund 20,677 9,380 8,192 15,016 5, % Unrestricted Operating Reserve ,700 9, % Unrestricted Fund 34,215 11,442 10,254 14,316 2, % Unrestricted Net Position 109,776 69,530 80, ,362 39, % TOTAL NET POSITION $ 3,447,505 $ 3,987,320 $ 3,830,395 $ 4,772,628 $ 785, % Notes: Reconciling items reflect cash activity in capital projects, inventory, accounts receivable and prepaids, accruals and capitalized interest. 2 Reserves include funds that are legally restricted by bond covenants, other contracts, Board designation and policy guidelines. 3 Reserves are an appropriated reserve which is available to fund unforseen projects expenses (such as a contingency reserve). 4 Reserves respresent revenues that are designated to be spent in future years for the construction of the FasTracks capital program. RTD 2017 Adopted Budget Page 38
44 Part V Goals and Performance Measures RTD 2017 Adopted Budget Page 39
45 2017 Goals and Performance Measures Introduction Each year the RTD Board of Directors adopts a mission statement, goals, objectives, and specific performance measures. These measures provide a framework in which RTD can determine how well it provides service to its passengers and the citizens of the District. A report detailing year-to-date performance on each of these measures is presented to the Board of Directors at the end of each quarter. In the preparation of the 2017 Budget, the goals and performance measures for 2017 were reviewed and updated to reflect changes to project-specific objectives. These performance measures are presented here. The Board of Directors reviewed the mission statement, goals, objectives, and performance measures for the year 2017 and adopted final performance measures in April RTD Vision and Mission Statement The District's vision is "to deliver regional multimodal transportation services and infrastructure improvements that significantly and continually increase transit market share". The District s mission is "to meet our constituents present and future public transit needs by providing safe, clean, reliable, courteous, accessible, and cost-effective service throughout the District". RTD Goals, Objectives, and Performance Measures The RTD Board of Directors adopted seven specific goals in support of this vision and mission statement: Goal 1: Goal 2: Goal 3: Goal 4: Goal 5: To meet the present transportation needs of the District by providing safe transportation service. To meet the present transportation needs of the District by providing clean transportation service. To meet the present transportation needs of the District by providing reliable transportation service. To meet the present transportation needs of the District by providing courteous transportation service. To meet the present transportation needs of the District by providing accessible transportation service. RTD 2017 Adopted Budget Page 40
46 Goal 6: Goal 7: To meet the present transportation needs of the District by providing costeffective and efficient transportation service. To meet the future transportation needs of the District. The following pages present the objectives and specific performance measures associated with these goals. RTD 2017 Adopted Budget Page 41
47 2017 PERFORMANCE REPORT VISION TO DELIVER REGIONAL MULTI-MODAL TRANSPORTATION SERVICES AND INFRASTRUCTURE IMPROVEMENTS THAT SIGNIFICANTLY AND CONTINUALLY INCREASE TRANSIT MARKET SHARE. MISSION STATEMENT TO MEET OUR CONSTITUENTS PRESENT AND FUTURE PUBLIC TRANSIT NEEDS BY OFFERING SAFE, CLEAN, RELIABLE, COURTEOUS, ACCESSIBLE, AND COST-EFFECTIVE SERVICE THROUGHOUT THE DISTRICT. Objectives: GOAL 1: TO MEET THE PRESENT TRANSPORTATION NEEDS OF THE DISTRICT BY PROVIDING SAFE TRANSPORTATION SERVICE. Reduce vehicle accident ratio Increase preventive maintenance Reduce passenger accident ratio Improve light rail safety Improve employee safety PERFORMANCE MEASURES: 1.1 Reduce the number of safety incidents. (Department: Bus Operations) 2014 Actual 2015 Actual 2016 Goal rd Qtr 2017 Goal Vehicle Accident Involvements per 100,000 miles Preventable RTD First Transit - Commerce City Veolia First Transit Denver* First Transit Longmont* Passenger Accident Ratio per 100,000 miles System-wide RTD First Transit - Commerce City Veolia First Transit Denver First Transit Longmont Operator-Passenger Assault Ratio per 100,000 boardings An accident is considered preventable any time the operator was not driving in full compliance with all applicable laws and regulations and in such a manner as to avoid involvement despite adverse conditions of road, weather or traffic or the errors of pedestrians or other drivers. 2 Of the total 17 passenger accidents reported by the contractors through Q3, 3 were preventable RTD 2017 Adopted Budget Page 42
48 1.2 Percentage of Preventive Maintenance inspections incurred as scheduled every 6,000 miles. 1 (Department: Bus Operations) 2014 Actual 2015 Actual 2016 Goal rd Qtr Percentage of Preventive Maintenance inspections incurred as scheduled every 6,000 miles system wide 99.6% 99.9% 98% 99.9% 98% RTD 99.3% 99.8% 98% 99.9% 98% First Transit - Commerce City 100% 100% 98% 100.0% 98% Veolia 99.5% 99.8% 98% 99.7% 98% First Transit Denver 100% 99.7% 98% 100.0% 98% First Transit Longmont 100% 99.8% 98% 100.0% 98% 1 Inspections are scheduled 600 miles prior to 6,000 miles or 600 miles after 6,000 miles Goal 1.3 Improve response time to emergency dispatch calls. (Department: Bus Operations) 2014 Actual 2015 Actual 2016 Goal rd Qtr 2017 Goal Average Response Time 18 sec. 19 sec. 20 sec. 19 sec. 20 sec. 1.4 Reduce the number of light rail accidents. (Department: Rail Operations) 2014 Actual 2015 Actual 2016 Goal rd Qtr 2017 Goal Reportable Light Rail Auto Accidents per 100,000 miles Preventable An accident is considered preventable any time the operator was not driving in full compliance with all applicable laws and regulations and in such a manner as to avoid involvement despite adverse conditions of road, weather or traffic or the errors of pedestrians or other drivers. 1.5 Reduce the number of commuter rail accidents. (Department: Rail Operations) 2014 Actual 2015 Actual 2016 Goal rd Qtr 2017 Goal Reportable Commuter Rail Accidents per 100,000 miles Preventable 3 N/A N/A N/A N/A An accident is considered preventable any time the operator was not driving in full compliance with all applicable laws and regulations and in such a manner as to avoid involvement despite adverse conditions of road, weather or traffic or the errors of pedestrians or other drivers. RTD 2017 Adopted Budget Page 43
49 GOAL 2: TO MEET THE PRESENT TRANSPORTATION NEEDS OF THE DISTRICT BY PROVIDING CLEAN TRANSPORTATION SERVICE. Objectives: Prompt graffiti removal Prompt bus interior and exterior cleaning Prompt shelter cleaning PERFORMANCE MEASURES: 2.1 Prompt response to facility complaints. (Department: Safety, Security, and Facilities) 2014 Actual 2015 Actual 2016 Goal rd Qtr 2017 Goal Average Response Time Public Complaints <4 hours 4 hours 4 hours < 4 hours 4 hours Average Graffiti Complaints per Month Average Facilities Maintenance Complaints per Month Elevator Snow/ice Shelter Other The proposed goal was increased in 2015 to reflect system growth in facilities. 2 The majority of Other is potholes and lighting issues. 2.2 Prompt response to vehicle complaints. (Department: Bus Operations) 2014 Actual 2015 Actual 2016 Goal rd Qtr 2017 Goal Average Overdue Bus Interior Cleaning per Month RTD First Transit - Commerce City Veolia First Transit Denver First Transit Longmont RTD 2017 Adopted Budget Page 44
50 GOAL 3: TO MEET THE PRESENT TRANSPORTATION NEEDS OF THE DISTRICT BY PROVIDING RELIABLE TRANSPORTATION SERVICE. Objectives: Improve on-time performance Improve miles between lost service road calls Decrease number of missed trips PERFORMANCE MEASURES: 3.1 Maintain system-wide on time performance. (Departments: Bus Operations, Rail Operations) 2014 Actual 2015 Actual 2016 Goal rd Qtr 2017 Goal Local On-Time Service System-wide % 85.9% 88.0% 85.7% 88.0% RTD Local 84.0% 84.4% 88.0% 84.3% 88.0% First Transit - Commerce City 83.7% 83.8% 88.0% 83.3% 88.0% Veolia 88.3% 88.3% 88.0% 87.2% 88.0% First Transit Denver 87.1% 88.4% 88.0% 87.4% 88.0% First Transit Longmont 87.9% 88.3% 88.0% 89.2% 88.0% Regional & Express On-Time Service % 91.9% 94.0% 91.3% 94.0% Light Rail - On-Time Service % 93.9% 90.0% 93.1% 90.0% Light Rail - Service Available 1 N/A N/A N/A 99.9% 90.0% Commuter Rail On-Time Service 2 N/A N/A N/A N/A 90.0% 1 Bus and Light Rail are considered on-time if a departure from a location is no more than 1 minute early or 5 minutes after the scheduled departure time. 2 Commuter Rail is considered on-time if a departure from a location is no more than 0 minutes early or 5 minutes after the scheduled departure time. RTD 2017 Adopted Budget Page 45
 2014 Actual 2015 Actual 2016 Goal 2016 3rd Qtr Light Rail Service Available 1 99.9% 99.9% 99.0% 100% 99.0% Bus Service Available 1 N/A N/A 99.0% 100% 97.")
51 Local Service On Time Performance % 90% 85.7% 85.9% 85.7% 88.0% 80% 70% 60% 50% 40% 30% 20% 10% 0% Q Goal 3.2 Maintain system-wide service availability. (Department: Bus Operations, Rail Operations) 2014 Actual 2015 Actual 2016 Goal rd Qtr Light Rail Service Available % 99.9% 99.0% 100% 99.0% Bus Service Available 1 N/A N/A 99.0% 100% 97.0% Commuter Rail Service Available 2 N/A N/A 99.0% 100% 97.0% 1 Calculated as total operating hours minus service delay hours, divided by total scheduled hours. 2 Calculated as actual car miles operated divided by total scheduled car miles Goal 3.3 Adherence to scheduled Revenue Service trip start time. (Department: Bus Operations) 2014 Actual 2015 Actual 2016 Goal rd Qtr 2017 Goal Adherence to scheduled Revenue Service trip start time system wide 100% 100% 99.0% 99.0% 99.0% RTD 100% 100% 99.0% 99.0% 99.0% First Transit - Commerce City 100% 100% 99.0% 99.0% 99.0% Transdev (fka Veolia) 100% 100% 99.0% 99.0% 99.0% First Transit Denver 100% 100% 99.0% 99.0% 99.0% First Transit Longmont 100% 100% 99.0% 99.0% 99.0% RTD 2017 Adopted Budget Page 46
52 3.4 Improve miles between road calls. (Departments: Bus Operations) 2014 Actual 2015 Actual 2016 Goal rd Qtr 2017 Goal Mileage Between Lost Service Maintenance Road Calls (District) 1,3 31,587 36,382 28,000 51,318 30,000 RTD 30,728 36,767 28,000 64,338 30,000 Transit Bus 27,990 47,393 59,189 Medium Bus N/A N/A 64,452 Articulated Bus 19,311 37,245 74,291 Intercity Bus 51,640 19,689 47,815 First Transit - Commerce City 37,345 41,269 28,000 48,813 30,000 Transit Bus 37,817 41,647 9,888 Medium Bus 35,923 42,917 30,811 Veolia 30,131 30,925 28,000 40,497 30,000 Transit Bus 24,706 25,729 19,975 Medium Bus 51,209 45,556 40,784 First Transit Denver 37,207 36,225 28,000 41,924 30,000 Transit Bus 39,838 37,233 32,993 Medium Bus 24,824 29,676 61,346 Cutaway Bus N/A N/A 116,360 First Transit Longmont 61,463 44,908 28,000 36,131 30,000 Transit Bus 68,495 71,185 N/A Medium Bus 61,908 29,424 2,301 Cutaway Bus 27,599 30,483 30,843 Hours Between Lost Service Maintenance Road Calls (Mall) 2 2,175 2, , District-wide mileage between lost service maintenance road calls excludes the Mall Shuttles. 2 Maintenance effectiveness of the Sixteenth Street Mall Shuttle is measured in terms of service hours. 3 Average age of the fleet follows: 2015 Quantity 2015 Average Age 2016 Quantity 2016 Average Age 2017 Quantity 2017 Average Age Fleet Average Number of Buses and Average Age 1,071 N/A N/A N/A N/A RTD - Boulder N/A N/A N/A N/A RTD Platte (including Mall Shuttle) N/A N/A N/A N/A RTD East Metro N/A N/A N/A N/A First Transit - Commerce City N/A N/A N/A N/A First Transit - Denver N/A N/A N/A N/A First Transit Longmont N/A N/A N/A N/A Transdev (fka Veolia) N/A N/A N/A N/A Mall Shuttles N/A N/A N/A N/A RTD 2017 Adopted Budget Page 47
53 55,000 50,000 Mileage Between Lost Service Road Calls ,318 45,000 40,000 36,382 35,000 30,000 31,587 30,000 25,000 20,000 15,000 10,000 5, Q Goal GOAL 4: TO MEET THE PRESENT TRANSPORTATION NEEDS OF THE DISTRICT BY PROVIDING COURTEOUS TRANSPORTATION SERVICE. Objectives: Reduce customer response time Limit customer complaints Decrease average wait time for telephone information Complete installation of shelter boards by date of service change PERFORMANCE MEASURES: 4.1 Reduce average customer response time. (Department: Communications) 2014 Actual 2015 Actual 2016 Goal rd Qtr 2017 Goal Average TIC Speed of Answer (in seconds) In 2015, the measure is changed from Average TIC Call Wait Time to Average Speed of Answer. RTD 2017 Adopted Budget Page 48
54 Average TIC Speed of Answer Q Goal RTD 2017 Adopted Budget Page 49
55 4.2 Improve level of customer complaints. (Departments: Bus Operations, Communications) Avg. Response Time to Customer Complaints Actual 2015 Actual 2016 Goal rd Qtr Average Cycle Time 2 business 7.5 days 10 days 7.4 days 10 days days RTD Transportation (Bus and Rail) RTD All Other Departments First Transit Commerce City First Transit - Denver First Transit - Longmont Veolia Complaints per Boardings (District) RTD Local Express First Transit - Commerce City Local Express Veolia Local Express First Transit Denver Local Express N/A First Transit Longmont Local Express N/A N/A 1 The measure reports on resolution of customer complaints across all subject matter throughout the District and the number includes all departments utilizing TrapezeCOM system for commendation and complaint research. 2 The measure was changed in 2015 from Initial Response and Final Resolution to Average Cycle Time, which measures the average number of days between when a customer contract is entered for action and when the action is completed (closed). The categories were also added in Goal 4.3 Complete installation of shelter boards by date of service change. (Department: Customer Services) Implementation scheduled for January 2017, May 2017, and August 2017 dates. RTD 2017 Adopted Budget Page 50
56 GOAL 5: TO MEET THE PRESENT TRANSPORTATION NEEDS OF THE DISTRICT BY PROVIDING ACCESSIBLE TRANSPORTATION SUPPORT SERVICE. Objectives: Improve on-time performance standards Improve ADA trip availability Improve ADA courtesy PERFORMANCE MEASURES: 5.1 Improve ADA on-time performance. (Department: Bus Operations) 2014 Actual 2015 Actual 2016 Goal rd Qtr 2017 Goal Access-a-Ride On-time Service 94.9% 95.1% 96.0% 95.3% 96.0% Access a Ride On Time Performance % 94.9% 95.1% 95.3% 96.0% 80% 60% 40% 20% 0% Q Goal RTD 2017 Adopted Budget Page 51
57 5.2 Improve ADA trip availability. (Department: Bus Operations) 2014 Actual 2015 Actual 2016 Goal rd Qtr 2017 Goal Adherence to ADA mandate to have zero denials to service request 100% 100% 100% 100% 100% 5.3 Improve ADA courtesy. (Department: Bus Operations) 2014 Actual 2015 Actual 2016 Goal rd Qtr 2017 Goal Average ADA complaints per boarding Objectives: GOAL 6: TO MEET THE PRESENT TRANSPORTATION NEEDS OF THE DISTRICT BY PROVIDING COST-EFFECTIVE AND EFFICIENT TRANSPORTATION SERVICE. Maintain cost recovery ratios Increase ridership Increase farebox and EcoPass revenue Improve route efficiency Monitor selected internal functions for efficiency Maintain cost effective and efficient transportation services Hire and train competent personnel PERFORMANCE MEASURES: 6.1 Maintain all required recovery ratios. 1 (Department: Finance) 2014 Actual 2015 Actual 2016 Goal rd Qtr 2017 Goal Operating Cost Recovery Ratio 33.2% 27.6% 20% 28.0% 20% SB154 Cost Recovery Ratio Yes 1 Operating cost recovery ratio is defined as farebox revenues (excluding ADA), advertising revenues, and other operating revenues divided by operating and administrative costs, depreciation on bus operations assets, excluding ADA costs, rapid transit planning costs, and interest payments on rapid transit assets. SB 154 Cost Recovery ratio is defined as farebox revenues (excluding ADA), advertising revenues, federal operating grants, federal formula bus grants, other operating revenues, and investment income divided by operating and administrative costs, depreciation on bus operations assets, excluding ADA costs, rapid transit planning costs, and interest payments on rapid transit assets. The required ratio is 30% and the calculation will be provided with the Financial Status Reports at the end of each calendar quarter only. Goal here is whether ratio is met by yes/no indication. RTD 2017 Adopted Budget Page 52
 2014 Actual 2015 Actual 2016 Goal 2016 3rd Qtr 2017 Goal Overall Ridership Increase 3.2% (1.9%) 1.5% 1 (2.6%) 6.8% 2 1 Established with the 2016 Amended Budget.")
58 40% Operating Revenue Recovery Ratio % 33.2% 30% 27.6% 28.0% 25% 20% 20.0% 15% 10% 5% 0% Q Goal 6.2 Increase ridership. (Department: Finance) 2014 Actual 2015 Actual 2016 Goal rd Qtr 2017 Goal Overall Ridership Increase 3.2% (1.9%) 1.5% 1 (2.6%) 6.8% 2 1 Established with the 2016 Amended Budget. Reflects FasTracks expansion lines in Established with the 2017 Budget. RTD 2017 Adopted Budget Page 53
59 Ridership Increase Over Prior Year % 8% 6.8% 6% 4% 3.2% 2% 0% 2% 4% 1.9% 2.6% Q Goal 6.3 Increase in fare revenue and total revenue. (Departments: Finance, Communications) 2014 Actual 2015 Actual 2016 Goal rd Qtr 2017 Goal Fare Revenue 1 2.3% 0% 8.0% 1 9.5% 15.5% 2 Total Operating Revenue 1.5% 0.7% 7.2% 1 9.3% 15.9% 2 1 Established with the 2016 Amended Budget. Reflects fare restructure and FasTracks expansion lines in Established with the 2017 Budget. RTD 2017 Adopted Budget Page 54
60 30% Farebox Revenue Increase % 20% 15% 15.5% 10% 9.5% 5% 0% 2.3% 0.0% Q Goal 6.4 Monitor selected internal functions for efficiency. (Department: Communications) 2014 Actual 2015 Actual 2016 Goal rd Qtr 2017 Goal 1 Audits % 1 Goal changed for 2017 from number of audits to percentage completion of the Annual Audit Plan per Board approval on 11/29/ Maintain bus operator/mechanic headcount within authorization. 2 (Department: Bus Operations) 2014 Actual 2015 Actual 2016 Goal rd Qtr 2017 Goal Bus Operator Vacancies 3 2.4% 5.9% 5.0% 2.9% 5.0% Bus Operator Over Headcount 0.0% 0.0% 4.0% 0.0% 4.0% Bus Mechanic Vacancies 9.5% 10.9% 7.5% 2.4% 7.5% Bus Mechanic Over Headcount 0.0% 0.0% 0.0% 0.0% 0.0% 2 Authorized headcount represents the level of personnel required to meet service demands in the current runboard. 3 Human Resources has been authorized to exceed authorized headcount to compensate for operator attrition. 6.6 Maintain stock-out level. (Department: Administration) 2014 Actual 2015 Actual 2016 Goal rd Qtr 2017 Goal Stock-Out Level % 1.1% 1.5% 1.3% 1.5% 4 Calculated as number of stock-out occurrences divided by number of requests. RTD 2017 Adopted Budget Page 55
61 GOAL 7: TO MEET THE FUTURE TRANSPORTATION NEEDS OF THE DISTRICT. PERFORMANCE MEASURES: 7.1 Deliver civic and neighborhood presentations to communicate with the public regarding service issues. (Departments: Communications, Executive Office, Bus Operations, Planning) 2014 Actual 2015 Actual 2016 Goal rd Qtr Communications General Manager Service Change Route and Service Planning Local Government Planning Workshops Community Advisory Committee Meetings Info Rides The Board of Directors does not adopt goals for these performance measures; for reporting purposes only Goal 7.2 Accurate Financial Analysis (Department: Finance) 2016 Actual 2017 Goal Distinguished Budget Presentation Award Certificate of Achievement for Excellence in Financial Reporting Received Distinguished Budget Presentation Award from the Government Finance Officers Association in the third quarter. Received Certificate of Achievement for Excellence In Financial Reporting from the Government Finance Officers Association in the fourth quarter. Receive Distinguished Budget Presentation Award from the Government Finance Officers Association by year-end. Receive Certificate of Achievement for Excellence In Financial Reporting from the Government Finance Officers Association by year-end. RTD 2017 Adopted Budget Page 56
62 Part VI Revenues RTD 2017 Adopted Budget Page 57
 -32.")
63 2017 Base System Revenue Summary ($ in 000 s) Source $ Change % Change Actual Amended Projected Adopted 16 Amend 16 Amend 17 Adopt 17 Adopt Sales Tax $ 297,306 $ 310,212 $ 310,212 $ 331,923 $ 21, % Use Tax 27,605 31,645 31,645 33,041 1, % Fed/State Grants - Operating 14,286 31,879 84,765 21,681 (10,198) -32.0% Carryforward (Expense) Grants 6,138 5, ,467 4, % Federal Grants ,275 57, ,793 (980) -1.7% Farebox Revenues 115, , , , % Investment Income 396 1,300 1,300 1, % Advertising Revenues 4,161 3,300 3,300 3, % Other Operating Revenues 1,186 1,497 1,497 1, % Other Income 3,033 11,979 11,979 3,107 (8,872) -74.1% TOTAL $ 519,863 $ 572,685 $ 562,218 $ 580,793 $ 8, % Base System Sales Tax Sales Tax, which has been imposed and collected since January 1, 1974, is collected upon all transactions specified by the Colorado General Assembly. As of 2014, RTD s tax base became the same as that on which the State of Colorado collects its own sales tax. While bringing RTD s tax base to parity decreases the amount of use tax generated for RTD from certain items, parity generates additional sales taxes with the inclusion of cigarettes, candy and soda, and food containers in RTD s tax base. Sales tax must be collected at the time of the transaction. The State of Colorado is responsible for collecting and processing all RTD sales tax revenues, and it retains a small amount of sales tax revenues to cover its incremental service costs. The maximum amount to be retained by the State is specified by statute and is partially offset by any interest income that accrues to the State between the receipt of the revenues from the vendors and their disbursement to RTD. As of January, 1, 2005, RTD collects a 1% tax on total sales in the District; 0.6% goes to the Base System and 0.4% goes to FasTracks. FasTracks Revenues section, entitled FasTracks Sales Tax. Prior to January 1, 2005, the statutory sales tax rate was 0.6%. The FasTracks ballot initiative that was passed by the voters of the District on November 2, 2004 raised the sales tax rate to 1.0%, with the requirement that the portion attributable to the additional 0.4% be used to fund the FasTracks transit expansion program. Therefore, these additional funds generated by the increased sales tax are budgeted under a separate line item in the RTD 2017 Adopted Budget Page 58


64 RTD s estimated future sales tax revenues are based on state-wide sales tax growth forecasts issued by the University of Colorado-Leeds School of Business adjusted for RTD tax structure and geographic differences. RTD contracted with the CU-Leeds School in 2011 for the production of quarterly sales tax data forecasts. RTD relies solely on the CU-Leeds School forecasts for its estimates of future sales tax revenue and incorporates the CU- Leeds School September 2016 forecast in the 2017 Adopted Budget. The frequency of these forecasts from CU-Leeds School was reduced to semi-annually starting in Sales tax collections have increased every year since 2010 due to a rebound in consumer spending. Sales tax is projected to grow 4.9% in 2016 and 6.4% in 2017 from continued low unemployment in Colorado and the District and retail sales that will outpace the nation. RTD projects sales tax revenue solely from data forecasts provided by the CU- Leeds School of Business. The following chart shows the trend in RTD Base System sales tax revenues over the past ten years (plus budget year). Growth was stable in 2007 and 2008, but at slower-than-projected rates. In 2009, sales tax collections declined 9.4% from the prior year due to the onset of the severe recession which dramatically impacted the region. As the economy began to recover and consumer spending rebounded, sales tax collections increased in each successive year beginning in In 2015, collections increased 5.8% over the prior year. Per the CU-Leeds School September 2016 quarterly forecast, 2016 collections are projected to increase 4.9% over 2015 and the 2017 Adopted Budget reflects an increase of 6.4% over the 2016 projected level. Fueling this 2017 increase are continued strong economic conditions in Colorado including a continued low unemployment rate, moderate growth in personal income, and retail sales that will outpace the nation. However, projections of retail sales growth rates below growth rates in personal income imply more cautious spending and savings behavior on the part of households going forward. RTD 2017 Adopted Budget Page 59

65 $400 Base System Sales Tax Revenues (millions of dollars) $350 $300 $280.9 $297.3 $311.9 $331.9 $250 $200 $229.4 $225.9 $204.7 $217.8 $225.7 $244.7 $256.6 $150 $100 Base System Use Tax RTD also has authority to levy a 1% use tax in the District. not been collected. In 1989, the Colorado Supreme Court ruled that RTD was allowed to levy a use tax on items purchased for use inside the District. This ruling complements the existing authority to levy a sales tax. Use tax is payable to the State by individuals and businesses when sales tax is due but has As is the case with RTD s sales tax, the statutory use tax rate was 0.6% before January 1, The FasTracks ballot initiative that was passed by the voters of the District on November 2, 2004 raised the use tax rate to 1.0%, with the requirement that the portion due to the additional 0.4% be used to fund the FasTracks transit expansion program. Therefore, these additional funds generated by the increased use tax are budgeted under a separate line item in the FasTracks Revenues section, entitled FasTracks Use Tax. RTD s estimated future use tax revenues are based on statewide use tax growth forecasts issued by the University of Colorado-Leeds School of Business. RTD contracted with the CU-Leeds School in 2011 for the production of quarterly use tax data forecasts. RTD relies solely on the CU-Leeds School forecasts for its estimates of future use tax revenue. Beginning in 2014, RTD s tax base became the same as that on which the State of Colorado collects its own use tax. While bringing RTD s tax base to parity decreases the amount of use tax generated for RTD from machinery and machine tools and food sold through vending machines, parity generates new sales taxes with the inclusion of other items in RTD s tax base. RTD 2017 Adopted Budget Page 60

66 The chart below shows the trend in RTD use tax revenues over the past ten years (plus budget year). As with the sales tax, use tax revenues declined during the recession of The profound effect of the recession caused a 16.5% decline in 2009 use tax collections from As the economy began to recover, use Use tax collections on balance continue its upward growth trend after falling significantly in Use tax is projected to grow 8.7% in 2016 and 10.0% in tax growth on balance increased over the period, with small declines in 2013 and The 2016 projection from CU-Leeds School shows a strong gain of 8.7% and the 2017 Adopted Budget reflects growth of 10.0% over the 2016 projected level. As with sales tax, use tax collections will be driven by strong economic factors in Colorado and the Denver metropolitan area in It should be noted that use tax receipts are inherently volatile and RTD has experienced dramatic swings in historical use tax collections. $40 Base System Use Tax Revenues (millions of dollars) $35 $33.0 $30 $27.9 $27.6 $30.0 $25 $21.7 $21.8 $20.8 $23.4 $25.1 $24.5 $20 $18.2 $15 $10 With 90% of RTD tax revenues coming from sales tax, the yearly changes in total tax revenues closely track those for sales tax revenue. The total of sales and use tax revenue is projected to grow 5.2% in 2016 and 6.7% in 2017 per the CU-Leeds School September 2016 forecast. RTD taxable sales have been outpacing state sales tax growth, and both the District and the state are outpacing national growth in retail sales, impacted by a stronger economy in Colorado and, in small part, to retail marijuana sales. RTD 2017 Adopted Budget Page 61

67 Federal/State Grant Revenue RTD is a designated recipient of federal funds from the Federal Transit Administration (FTA). FTA provides financial assistance to transit agencies for provision and delivery of public transportation systems, capital investments in transit systems and facilities, as well as maintenance and repair of public transit systems. Federal grant income is applied in the form of operating assistance for use on operating projects, planning assistance, and capital assistance. Grant income is awarded through a proposal process. Formula grant programs are funded based on formulas of population, and discretionary grant programs are awarded based on meeting application requirements based on criteria specific to each. RTD competes with other transportation organizations for these discretionary funds each fiscal year. Section 5307 formula funds for the years 1999 through 2003, a portion of which is collected from Federal fuel taxes, were allocated to all eligible areas in the Transportation Efficiency Act for the 21 st Century (TEA-21) legislation passed by Congress in The Safe, Accountable, Flexible, and Efficient Transportation Equity Act-A Legacy for Users (SAFETEA-LU) legislation passed by Congress in 2005 reauthorized such federal transportation grant programs for Upon expiration in 2012, SAFETEA-LU was replaced by the Moving Ahead for Progress in the 21 st Century (MAP-21) program reauthorizing surface transportation programs through fiscal Upon expiration in 2016, MAP-21 was replaced by the Fixing America s Surface Transportation Act (FAST Act) program reauthorizing surface transportation programs through fiscal Also reauthorized with the FAST Act are the Section 5337 State of Good Repair and 5339 Bus and Bus Facilities formula funds. As of the adoption of the 2017 Budget, the federal government had not approved a final budget for fiscal year However, FTA had published estimates of grant funding to be made available to eligible areas, and these estimates were used to forecast grant receipts in the 2017 Adopted Budget. Other operating grant revenues are forecast based on specific projects that have been identified for funding through the District s planning process. RTD uses as much of Section 5307 formula funding as possible for capital maintenance projects. The chart below shows the trend in federal operating and capital maintenance grant revenues over the past ten years (plus budget year) for the Base System. The FTA in 1997 began to allow certain expenditures classified by RTD as operating expenditures to be programmed for Section 5307 capital grants under a new category of grants called "Capital Maintenance". In 1998, the FTA expanded the range of projects considered eligible for these capital maintenance funds. As a result, RTD has chosen to use as much of its Section 5307 funding as possible for capital maintenance projects and the total revenues from these sources increased substantially between 2010 and 2016 (see the chart below). In 2017, Section 5307 grant funding is budgeted at $56.8 million of total federal operating grant revenue of $88.9 million. RTD 2017 Adopted Budget Page 62
 of 2009, RTD was designated eligible to receive approximately $72.")

68 $120 Base System Federal/State Operating and Capital Maintenance Grant Revenue (millions of dollars) $110 $100 $90 $92.7 $89.6 $88.2 $84.8 $88.9 $80 $70 $68.2 $68.9 $76.0 $70.7 $60 $50 $40 $30 $20 $10 $47.0 $50.8 With the U.S. Congress adoption of the American Recovery and Reinvestment Act (ARRA) of 2009, RTD was designated eligible to receive approximately $72.8 million in new funding for its operating and capital projects. Of the total ARRA funds made available for RTD, approximately $28.8 million was allocated for FasTracks projects. These FasTracks funds were used to help fund the $487.7 million innovative renovation of Denver Union Station in downtown Denver. Of the ARRA funds made available for Base System, the majority were expended in capital maintenance in 2010, which accounts for the sharp rise in 2010 grant revenue in the chart. In , funds from this source significantly declined due to changes in priorities at the federal level due to the recovering economy. Beginning in 2015, RTD did not budget for any ARRA operating grants and this grant source is no longer available. Total federal/state operating grant revenue in the 2017 Adopted Budget including the carryforward is expected to increase $4.1 million from 2016 projected to $88.9 million. New grant funding is projected for 2017 based on identified increases primarily in STAMPS (Station Area Master Plans) grants, Federal Highway Administration CMAQ (Congestion Mitigation and Air RTD is budgeting for increases in operating grants in 2017 from STAMPS and CMAQ grant programs as well as FTA-funded grants. Federal grant revenue received for Capital Maintenance (Section 5307) will remain about the same from last year. Quality) grants, and FTA Ladders of Opportunity funding. Section 5307 Capital Maintenance grant funding from the FTA is budgeted to remain the same. Effective 2013, the JARC (Job Access and Reverse Commute) and New Freedom programs have been replaced by other programs, including MAP-21. The Moving Ahead RTD 2017 Adopted Budget Page 63

69 for Progress in the 21 st Century (MAP-21) program was legislated to take effect in The passage of this bill allowed reauthorization of surface transportation programs through fiscal year 2016, followed by the FAST Act reauthorization through Separate appropriations will no longer be available for the JARC and the ADA New Freedom Program as both programs are now options within the 5307 and 5310 grants, respectively. In addition to $56.8 billion budgeted in Section 5307 grant funds in 2017, other grants budgeted include $14.1 million in Fixed Guideway (also Section 5337), $9.7 million in CMAQ, and $3.0 in FASTER (state funds) as well as various other carryforward grants. Farebox Revenue Farebox revenue includes all revenues collected on behalf of passengers using RTD services. These include cash collected from passengers on a vehicle, multiple-ride tickets, monthly passes sold at approximately 250 outlets throughout the RTD service area, and several prepaid pass programs including the new SmartCard. Fares are charged for all RTD bus and rail services, whether operated by RTD or its private contractors, with the exception of the free 16th Street Mall shuttle service in downtown Denver and the Free MetroRide (a FasTracks service) introduced in 2014 also in downtown Denver. The District s policy incorporates in its fare structure discount programs to assist both transit dependent, seniors, and economically disadvantaged customers and other groups. RTD s Board of Directors approved a new fare structure effective January 1, 2016 that effectively incorporated a 10% fare rate increase. The new fares are designed to simplify the way passengers pay for trips across RTD s expanding transit system. A summary of the District s fare structure is included in Part III of this document. In prior years, RTD has forecast its farebox revenue based on projected fares and future service levels. The impacts of service changes are forecast based on the amount and type of service to be provided. RTD s 2017 farebox revenue on the Base System is Both farebox revenue and ridership on the Base System are budgeted to be flat in Any growth in fare revenue will occur in FasTracks due to system expansion. A new fare structure and 10% fare rate increase was implemented in However, positive benefit for the Base System is offset by retention of transfers and flat year-over-year ridership. projected to increase 0% over Although the fare rate increase from 2016 is expected to add benefit, any dollar increase in fare revenue is expected to be offset by retention of transfers and flat year-over-year ridership. Any unbudgeted increase to actual farebox revenue on the Base System in 2017 would come from growth in ridership. No service reductions were necessitated in 2016 and none are required in the 2017 Budget in order to balance the budget. In fact, Base System service was recalibrated and in some cases added to accommodate the impact of the FasTracks expansion. The chart below shows an overall upward trend in RTD farebox revenues over the past ten years (plus budget year). In 2006, RTD implemented a fare rate increase of 20% on its local services and 10% on its Eco Pass program. An additional fare rate increase of 12.8% was budgeted and implemented in 2008, one year ahead of schedule. This was done in order to compensate for slowing sales and use tax collections and increases in system operating costs and higher per gallon fuel costs. RTD 2017 Adopted Budget Page 64


70 For the second year in a row, a fare rate increase was implemented in It increased fares approximately 14% throughout the District and was designed to address the severe loss of sales and use tax revenues caused by a slowing economy. No fare rate increase was introduced in Fare rate increases are planned to occur every three years, but the RTD Board has discretion over the timing and the amount. In 2011, an overall fare rate increase of 12.5% took effect throughout the District. Per current Board policy, fare rate increases of 10% to track inflation are planned to occur at three-year intervals in accordance with the Strategic Budget Plan although the Board maintains discretion over these planned increases. A rate increase was scheduled for 2014 per policy, however, the Board of Directors opted to defer such increase to 2015 and then again to 2016 when it took effect. A 10% fare rate increase at three-year intervals from 2016 forward is assumed in the Strategic Budget Plan in accordance with policy. The new fare structure in 2016 was the first fare rate increase in five years and established a new fare structure for the first time in nearly a dozen years. The roll-out of the smart card fare payment system will continue in For a year-and-a-half beginning in 2014, RTD conducted a fare study with the intent of simplifying the fare structure and making it more equitable across the District. Extensive public input helped shape the fare structure through a dozenplus public meetings as well as 16 formal public hearings to give the public numerous opportunities to provide feedback on proposed fare structure changes. The year 2016 saw not only the first fare rate increase in five years for RTD but also a new fare structure for the first time in nearly a dozen years. Also in 2016, RTD began to phase in a tap-andpay smart card system that enables passengers to purchase and store fares electronically, and receive fare discounts as incentives to migrate away from paper and cash fares. This smart card roll-out will continue in 2017 to as many riders as possible. FasTracks fare revenue is budgeted separately and is, therefore, not included in this section. In contrast to the Base System, fare revenue growth is expected to occur in FasTracks in 2017 due to system expansion and new corridors brought on-line in (see FasTracks farebox revenue below). RTD 2017 Adopted Budget Page 65

71 $150 Base System Farebox Revenue (millions of dollars) $130 $110 $90 $77.1 $88.2 $96.9 $97.9 $108.5 $112.9 $115.1 $116.5 $115.5 $117.5 $117.5 $70 $50 $30 $10 Investment income is earned by investing RTD s investable assets as permitted by Board policy and Colorado State Statutes. Investment income fluctuates based on the amount of funds available for investment and interest rates. The average availability of investable funds for the Base System declined from due to the end of ARRA funding and Investment Income Although the District s investable balances are expected to decline in 2017 due to deployment of such balances in capital purchases and no scheduled new financing, investment income is budgeted to remain stable due to recent and forecasted increases in interest rates. scheduled pay down of debt. Investable funds increased substantially in 2015 due to issuance of Certificates of Participation for bus and rail fleet purchases, but investment income was tempered by historically low interest rates. Despite gradual deployment of these funds and no additional financing scheduled, 2016 investment income is projected to increase to $1.3 million due to higher interest rates. For 2017, investment income is budgeted at the same $1.3 million. While investable balances will be reduced, an expected small increase in interest rates will stabilize investment income for the year. No new debt issuances are planned for The chart below shows the trends in Base System investment income over the past ten years (plus budget year). FasTracks investment income is budgeted separately and is not included in this section. RTD 2017 Adopted Budget Page 66

72 $18 Base System Investment Income (millions of dollars) $16 $14 $15.3 $14.3 $12 $10 $8 $6 $5.0 $4 $2 $1.4 $0.9 $0.8 $0.5 $0.7 $0.4 $1.3 $1.3 $0 Advertising Revenue The District earns revenue from the sale of advertising space on the interior and exterior of its buses and rail cars and from the sale of advertising painted on buses and rail cars whose exteriors are painted with the advertisers messages. RTD contracts with an outside agency that determines the advertisers. In 2016, the advertising contract with an advertising agency for revenue was renegotiated. Under the terms of the contract in effect at the time of budget development, RTD would receive $3.3 million in 2016 and such amount is escalated at the CPI to $3.4 million for This amount is less than the prior contract s minimum guarantee but the difference is expected to be made up by naming rights on system assets. RTD s Board of Directors voted to revise the advertising policy to commercial only and no political advertisements. RTD 2017 Adopted Budget Page 67
73 Other Income Other income includes rents from retail space and parking rentals, legal settlements, and various miscellaneous items. Other operating income includes $1.5 million budgeted in 2017 for joint venture agreements for construction work ($924,000) and various inter-governmental agreements ($618,000) based on historic trends. The District has entered into a partnership agreement with another entity to operate the parking facility located in Civic Center Station. Under the terms of the current agreement, the District receives a monthly fixed fee net of operating costs. An "escalation of fixed fee" clause provides for additional payments to the District if the monthly revenues, net of operating costs, exceed $50,000. The District is forecasting to earn parking fees of $643,000 in An additional $694,000 from miscellaneous rentals is budgeted in 2017 based on historic trends. RTD has entered into lease agreements for other properties it owns at various locations in the District but does not currently use for transit purposes. An additional $1.2 million in miscellaneous non-operating income is budgeted in 2017 based on historic trends. This includes $300,000 for the 16 th Street mall maintenance which will be reimbursed by the City & County of Denver. Denver Union Station Revenues RTD purchased the historic Denver Union Station (DUS) in 2001 for the purpose of longterm development of the property as a transportation hub serving the needs of District residents, commuters, business travelers and tourists. In 2014, the fully-renovated Denver Union Station opened to the public. The facility includes an underground bus complex constructed and operated by RTD, and the privately-developed Union Station retail and hotel complex. A partnership is responsible for the ongoing retail and hotel operations of the facility and RTD has contracted with the partnership to receive revenues from the tenants of the facility for its continued use. A contract between RTD and the partnership managing the DUS retail operations took effect in RTD will be paid by the partnership on March 31 of each year the greater of minimum rent or percentage rent based on a formula applied against a gross revenue threshold of $12,000,000. For 2017, $540,000 is budgeted in DUS rental revenue. This amount is expected to become more substantial in 2018 and beyond when the gross revenue threshold is anticipated to be met and exceeded. Excess Property Sales When the RTD Board of Directors has authorized the sale of surplus properties, estimated revenues are budgeted. There were no material sales of excess property recognized in 2016, and none is anticipated for RTD 2017 Adopted Budget Page 68
74 Drawdown from Working Capital Drawdown from working capital represents the local share of expense projects above budget and not completed in the year the funds were originally budgeted. No drawdown is anticipated in RTD 2017 Adopted Budget Page 69

75 2017 Base System Capital Sources Summary ($ in 000 s) Source $ Change % Change Actual Amended Projected Adopted 16 Amend 16 Amend 17 Adopt 17 Adopt New Capital Revenue Federal-New Capital Base System Capital $ 2,425 $ 997 $ 997 $ 6,575 $ 5, % State-New Capital Base System Capital ,055 8, % Local and Private Funds-New Capital Base System Capital ,000 1, % Capital Carryforward Revenue Federal-Capital Carryforward Base System Capital-Carryforward 0 13,001 13,001 25,068 12, % CMAQ Non-Corridor Grant-Carryforward % SOGR Capital Grant-Carryforward 0 3,596 3,596 4, % State-Capital Carryforward Base System Capital-Carryforward 0 4,754 4,754 12,978 8, % Financing Proceeds 145, % TOTAL $ 148,857 $ 22,348 $ 22,348 $ 59,097 $ 36, % Federal/State Grants Capital This group of line items represents capital grants for a variety of projects, including rapid transit corridors, bus facilities funding, bus and light rail fleet, State of Good Repair projects, Park-n-Rides, light rail vehicle overhauls, and other projects. These grants include new grants appropriated in the current budget year and carryforward grants for projects not completed in prior years. Budgeted federal and state grants for capital projects consist of new money and carryforward grants. Federal Capital Grants: These federal new capital line items represent federal grants, including Sections 5309 and 5339 discretionary grants and other discretionary capital grants used for the acquisition of assets other than new rapid transit corridors. In 2017, RTD is budgeting to receive $0.6 million for CMAQ operating assistance for pass-through bus purchases for a municipality, $1.8 million in FTA Ladders of Opportunity grant for transit signal priority, queue jumps, bypass lanes, enhanced lighting and bus stop amenities (5309), and $4.1 million for bus facilities funding under the FAST Act (5339). (RTD will elect to use all of its eligible Section 5307 formula grant funds in 2017 for capital maintenance projects, which are considered operating revenues in the RTD budget.) State/Local Capital Grants: New FASTER grants (state) are budgeted for light-rail vehicle midlife overhaul and for ongoing 16 th Street Mall paver repairs. Local new capital will be received for environmental assessment work on SH 119. RTD 2017 Adopted Budget Page 70
76 Federal Capital Carryforward Grants: In 2017, federal carryforward capital revenue from 2016 is estimated to total $30.5 million and will include $12.2 million in continuing work to rebuild the Civic Center downtown bus station, $5.2 million in Section 5339 funds for bus purchases, $0.6 million in FTA Ladders of Opportunity (5309) continuing work, and $7.1 million in FTA Livability funds for 16 th Street mall paver repair. In addition, the CMAQ carryforward is estimated at $0.9 million for bus purchases, and $4.4 million is budgeted for Civic Center station reconstruction work under a State of Good Repair grant (FTA). State/Local Capital Carryforward Grants: State/local grant carryforward revenue is budgeted at $12.9 million in 2017 to include CDOT funding for bus purchases, and FASTER grants for Civic Center reconstruction, park-n-ride expansions, and the Colfax Avenue bus route transit signal study. Financing Proceeds These line items represent proceeds of bonds, COPs, or commercial paper issued to fund elements of the Base System operations. All amounts are for Certificates of Participation (COPs) issued for bus fleet and light rail vehicle purchases. In 2015, $193.9 million in new COPs were issued to cover current and future fleet needs. These funds will be used in in combination with previously issued debt proceeds and internal reserve funds to acquire ft. transit buses, 35 medium transit buses, 57 call-n-ride cut-away buses, and 405 ADA cut-away buses. Due to this large debt issuance, no new financing occurred in 2016 and none is planned in 2017 for the Base System. Local and Private Funds This represents contributions pledged by local governments and private interests toward the design and construction of rapid transit projects. No such local funds are anticipated or budgeted in Drawdown from Capital Acquisition Reserve The 2016 projection and 2017 Adopted Budget reflect no anticipated draw down from the capital acquisition reserve. RTD 2017 Adopted Budget Page 71
 -3.")
77 2017 FasTracks Revenue Summary ($ in 000 s) Source $ Change % Change Actual Amended Projected Adopted 16 Amend 16 Amend 17 Adopt 17 Adopt FasTracks Sales Tax $ 198,203 $ 206,809 $ 206,809 $ 221,282 $ 14, % FasTracks Use Tax 18,404 21,097 21,097 22, % FasTracks Operating Grant Revenue 2,684 1, ,487 (48) -3.1% FasTracks Farebox Revenue 5,053 12,653 12,653 32,891 20, % FasTracks Investment Income 2,769 2,540 2,540 2, % FasTracks Other Income 8,284 8,793 8,793 10,303 1, % TOTAL $ 235,397 $ 253,427 $ 252,401 $ 290,868 $ 37, % FasTracks Sales Tax In 2004, the voters of the RTD District authorized an increase in the RTD sales and use tax to finance the FasTracks transit program. This authorization increased the total sales and use tax rates from 0.6% to 1.0%, effective January 1, RTD budgets and accounts for the 0.4% sales and use tax for FasTracks separately from the Base System sales and use tax collections in order to ensure that the proceeds are used for the FasTracks program, as anticipated by the voters of the District. RTD uses forecast data from CU-Leeds School of Business for FasTracks projections of sales tax revenue, same as the Base System. RTD forecasts revenues from the FasTracks sales and use tax for the budget year using the same methodology as used for the Base System from forecasts provided by the CU-Leeds School of Business. FasTracks sales tax for 2016 is projected to increase 4.9% over 2015 actuals. In the 2017 Adopted Budget, sales tax revenue is forecast to increase 6.4% over the 2016 projection. These increases mirror the budgeted increases on the Base System per the CU-Leeds School September 2016 semi-annual forecast. FasTracks sales tax is budgeted in a separate line item entitled FasTracks Sales Tax in the FasTracks Revenues section. The chart below shows sales tax collections for FasTracks at 0.4% of total RTD sales tax collections. RTD 2017 Adopted Budget Page 72

78 $300 FasTracks Sales Tax Revenues (millions of dollars) $250 $200 $150 $152.9 $150.6 $136.5 $145.2 $150.4 $163.2 $171.1 $187.3 $198.2 $207.9 $221.3 $100 $50 FasTracks Use Tax RTD also has authority to levy a 1% use tax in the District. FasTracks share is 0.4%. In 1989, the Colorado Supreme Court ruled that RTD was allowed to levy a use tax on items purchased for use inside the District. This ruling complements the existing authority to levy a sales tax. Use tax is payable to the State by individuals and businesses when sales tax is due but has not been collected. As is the case with RTD s sales tax, the statutory use tax rate was 0.6% before January 1, The FasTracks ballot initiative that was passed by the voters of the District on November 2, 2004 raised the use tax rate to 1.0%, with the requirement that the portion due to the additional 0.4% be used to fund the FasTracks transit expansion program. These additional funds generated by the increased use tax are budgeted in a separate line item entitled FasTracks Use Tax in the FasTracks Revenues section. The FasTracks historic and projected use tax mirror the budgeted increase on the Base System per the CU-Leeds School September 2016 semi-annual forecast. The 2016 projection from CU-Leeds School shows a strong gain of 8.7% and the 2017 Adopted Budget reflects growth of 10.0% over the 2016 projected level. As with sales tax, use tax collections will be driven by strong economic factors in Colorado and the Denver metropolitan area in The chart below shows use tax collections for FasTracks at 0.4% of total RTD use tax collections. RTD 2017 Adopted Budget Page 73

79 $30 FasTracks Use Tax Revenues (millions of dollars) $25 $22.0 $20 $18.6 $18.4 $20.0 $15 $14.5 $14.5 $13.8 $15.6 $16.8 $16.3 $12.1 $10 $5 As noted earlier, with 90% of RTD tax revenues coming from sales tax, the yearly changes in total tax revenues closely track those for sales tax revenue. The total of sales and use tax revenue is projected to grow 5.2% in 2016 and 6.7% in 2017 per the CU-Leeds School September 2016 forecast. Operating Grant Revenue RTD has received funding for the FasTracks projects West Corridor, North Metro Corridor, East Corridor, Gold Line Corridor, I-225 Corridor, and US 36 Corridor, and most recently, the Southeast Rail Line Extension. The majority of FasTracks grant revenue is capital, but some operating grant revenue is received although it is far less than that received by the Base System. FasTracks Operating Grant Revenue in 2017 is composed of a CMAQ Metro Ride grant and Station Area Master Plan grant funding. In past years, FasTracks has received operating grants including New Start funds, Federal Homeland Security funds, CMAQ 5309 grant funding, and State funds. RTD 2017 Adopted Budget Page 74

 and Northwest Rail Line electrified segment (B Line) both of which opened in 2016, plus")
80 FasTracks Federal/State Operating Grant Revenue (millions of dollars) $20 $18.1 $12.0 $10 $9.1 $7.2 $4.7 $0 $0.1 $0.4 $0.0 $2.7 $0.5 $1.5 FasTracks Farebox Revenue FasTracks farebox revenue materialized for the first time in 2013 with the opening of the West Line, the first rail line of the FasTracks expansion. Fare revenue has continued to increase with the follow-on system elements opening in In 2017, fare revenue is budgeted to increase $20.2 million over 2016 projected due to full-year operation of the University of Colorado A Line (East Line) and Northwest Rail Line electrified segment (B Line) both of which opened in 2016, plus partial year operation of the Gold Line and I-225 Rail Line which are anticipated to open in Combined fare revenue is budgeted to increase 15.5% in 2017, all of which is attributed to FasTracks. Growth in FasTracks fare revenue will offset flat fare revenue on the Base System. Farebox revenue growth in 2017 is budgeted to come from FasTracks and not the Base System Full-year operation of lines opened in 2016 and new lines opening in 2017 will drive this increase. Per current Board policy, for FasTracks as with the Base System fare rate increases of 10% to track inflation are planned to occur at three-year intervals although the Board maintains discretion over these planned increases. A 10% fare rate increase at threeyear intervals is assumed in the Annual Program Evaluation in accordance with policy. RTD 2017 Adopted Budget Page 75


81 $40 FasTracks Farebox Revenue (millions of dollars) $35 $32.9 $30 $25 $20 $15 $12.7 $10 $5 $2.7 $4.0 $5.1 $0 FasTracks Investment Income FasTracks investment income is earned by investing any unspent revenues from the FasTracks program as permitted by Board policy and Colorado state statutes. This investment income is to be used to fund expenditures related to the FasTracks program. Investment income for FasTracks is derived from generally higher investable balances than the Base System. Investment income fluctuates based on the amount of funds available for investment and interest rates. In the early years of FasTracks construction, large amounts of debt were issued to support program costs and coupled with 0.4% sales and use tax income these funds produced sizable investment income. As these funds were deployed and interest rates declined, investment income fell to nominal levels. Residual investable funds from more recent FasTracks debt issuances are projected to remain at the end of These funds plus new debt proceeds in 2016, less FasTracks program costs, should produce $2.9 million of investment income in An influx of FasTracks cash was generated in 2016 from the issuance of $228.8 million in new debt to support FasTracks capital projects (see FasTracks Financing Proceeds below). Although these funds will be deployed, an expected small increase in interest rates is expected to stabilize investment income in RTD 2017 Adopted Budget Page 76

82 $50 FasTracks Investment Income (millions of dollars) $45 $42.2 $40 $38.2 $35 $30 $25 $24.4 $20 $15 $10 $5 $0 $6.7 $5.6 $1.8 $1.5 $0.0 $2.8 $2.5 $2.9 FasTracks Other Income Other income consists of the Build America Bonds subsidy, naming rights on the A Line, and parking revenue. Build America Bonds are taxable municipal bonds that carry special tax credits and federal subsidies for either the bond issuer or the bondholder. Build America Bonds were created under Section 1531 of American Recovery and Reinvestment Act (ARRA) created in The subsidy is a percentage of the interest paid on the bonds. Although the program expired at the end of 2010, the subsidy to RTD will continue as long as the bonds remain outstanding (scheduled 2050). Other income also includes University of Colorado naming rights on the A Line paid by CU at the rate of $1.0 million annually for five years, and parking revenue from Park-n-Rides attributed to FasTracks. RTD 2017 Adopted Budget Page 77
83 2017 FasTracks Capital Sources Summary ($ in 000 s) Source $ Change % Change Actual Amended Projected Adopted 16 Amend 16 Amend 17 Adopt 17 Adopt FasTracks Federal-New Capital Capital 5, % Eagle FFGA 150, , , , % CMAQ/Metro 0 4, ,678 8, % SERE Small Starts 0 46,887 14,992 45,113 (1,774) -3.8% State-New Capital 0 1, (1,875) % FasTracks Capital Carryforard Revenue 0 32, ,688 86, % FasTracks Financing Proceeds 276, , ,811 0 (228,375) % Drawdown-FasTracks Debt Service Reserve 0 0 (28,811) 9,315 9, % Drawdown-FasTracks Construction Reserve 0 18,700 18,700 0 (18,700) % Drawdown-FasTracks Working Capital/FISA 0 15,995 (16,998) 2,942 (13,053) -81.6% FasTracks Contributed Capital 5, ,416 3,628 95,361 (102,055) -51.7% TOTAL $ 436,721 $ 696,227 $ 320,408 $ 435,097 $ (261,130) -37.5% Federal/State Grants Capital Federal New Capital Grants: These federal new capital line items consist of the following: Capital includes all other federal corridor grants and state grants not elsewhere identified. Eagle FFGA represents drawdowns of the Eagle project Full Funding Grant Agreement. In 2011, the U.S. Department of Transportation and FTA awarded RTD a $1.03 billion FFGA for construction of the East Rail Line to Denver International Airport and the Gold Rail Line to Arvada and Wheat Ridge. This was the largest transit grant awarded by the Obama Administration and a historic milestone for RTD. Drawdowns began in In 2017, $150 million is budgeted to be drawn. CMAQ/Metro consists of CMAQ/Metro grant funding for the Eagle project and Southeast Rail Extension (SERE). SERE Small Starts funding is $45.1 million in 2017 for the SERE project. State grants have consisted of FASTER funding for US36 BRT. No new funds are budgeted in 2017 although there is a carryforward of such funds to Federal Capital Carryforward Grants: In 2017, federal carryforward capital revenue from 2016 is estimated to total $119.7 million and will include $36.9 million in CMAQ funding for the Eagle project, $50.0 million in New Starts funding for the Eagle project, $31.9 million in Small Starts funding for SERE, with the remaining in state funds for US36. RTD 2017 Adopted Budget Page 78


84 FasTracks Financing Proceeds These line items represent proceeds of bonds, COPs, or commercial paper issued to fund elements of the FasTracks rapid transit plan. These funds are legally restricted for use on the identified FasTracks projects or for required debt service reserves. A recent history of such debt issuance follows. Sales Tax Revenue Bonds: As of September 2016, RTD had issued approximately $1.4 billion in sales tax revenue bonds to fund capital investments in the FasTracks program. In 2015, over $200 million in revenue bonds were issued for future FasTracks construction, including the Southeast Rail Extension. In 2016, $228.8 million was realized on the issuance of revenue bonds for continued construction of FasTracks projects, including the Southeast Rail Extension. To be completed in 2019, the Southeast Rail Extension is a 2.3-mile-long extension to the highly successful Southeast Rail Line that will bring the total line to 21.4 miles. In addition to the planned bond issuance, RTD is receiving $92 million in New Starts federal funding, and local business associations along the corridor are contributing $25 million in cash and $15 million in right-of-way permits and other in-kind contributions towards the project s total cost of $233.1 million. Certificates of Participation: A Certificate of Participation (COP) issuance yielded $440.9 million of proceeds in 2014, to be used to support costs of construction of the North Metro RTD realized nearly $230 million in new revenue bonds issued in A portion of these proceeds will be used towards completion of the Southeast Rail Line Extension which will be completed in 2019 at a total project cost of $233.1 million. RTD issued $440.9 million in Certificates of Participation (COPs) in 2014 to finance construction of the North Metro Rail Line. These were the firstever COPs issued for rail line construction. electric commuter rail line. This was the first COP issuance in the country for rail line construction. RTD will make annual rent payments on the certificates until they mature in 2044 at which time RTD will assume ownership of all the assets. The 18.5-mile North Metro Rail Line will serve Denver s northern suburbs through Colorado Highway 7 in North Adams County with a target opening date of RTD has in place a construction partnership to design and build the first phase of North Metro Rail through 124 th Avenue with options to extend it farther as funds become available. Ground-breaking occurred in March No new debt issues are scheduled for FasTracks in the 2017 Budget. TIFIA Loan: RTD received a federal loan RTD began to draw down the TIFIA through the U.S. Department of Transportation loan in 2013 for the FasTracks Infrastructure Finance and Innovation Act Eagle project. The loan has been (TIFIA) for up to $280 million which was used drawn in full and used entirely on the FasTracks Eagle project. RTD used the towards Eagle project construction. TIFIA loan to fund a portion of its contribution to the Eagle project and began drawing on the funds in The full $280 million has now been spent on construction of the Eagle RTD 2017 Adopted Budget Page 79
85 project. The advantage of this loan is that it has given RTD greater flexibility to finance the project during the construction period. FasTracks Reserves Debt service reserves are derived from proceeds of COPs or bonds issued prior to the beginning of a budget year. These funds are legally restricted for use on the projects for which COPs or bonds were issued. In 2017, the balance is drawn down by one year of interest payment. In 2016, the FasTracks Construction Reserve was split between the construction reserve at $56.3 million and a start-up operations reserve at $25.0 million. The start-up operations reserve was established for the years in order to meet 1.2x debt service coverage if needed. In 2016, draws totaling $18.7 million were made against the construction reserve for FasTracks continuing construction. In 2017, no amounts are anticipated to be drawn down against the construction reserve. It is assumed projects will be built out with FFGA funds rather than from the construction reserve. However, the timing of completion of various projects is difficult to forecast. During the amended budget process in mid-2017, the construction reserve will be reassessed and re-budgeted as necessary. The FasTracks working capital account is also known as the FasTracks Internal Savings Account and is derived from contributions made largely by the Base System to help offset FasTracks project costs. Drawdowns have been made to date but these amounts were replenished. In 2017, a drawdown of $2.9 million is budgeted. FasTracks Contributed Capital FasTracks contributed capital represents funding received from an entity other than RTD to fund assets that ultimately are owned by RTD. The FasTracks program contributed capital comes from three sources: The Eagle project public-private partnership includes private financing of a portion of the project costs. The Denver Union Station project includes funding from the Denver Union Station Project Authority (DUSPA) to cover project costs that are not covered by RTD funding or grants. Outside entities also contribute funds to RTD to provide corridor amenities and betterments beyond the basic scope of the corridor projects. These could include items such as additional amenities at stations or connecting bike paths, and could be funded by other local governments or private entities. RTD has identified such projects and budgeted funds for the Eagle project, I-225 Rail and North Metro Rail projects in The Southeast Rail Extension project includes private local financing from local business associations and businesses along the corridor. RTD has budgeted for such contributions in RTD 2017 Adopted Budget Page 80
86 The 2015 contributed capital amount includes private financing for the Eagle project. The 2016 projected amount includes private financing for the Eagle project, I-225 Rail project, North Metro Rail project and Southeast Rail Extension. The 2017 projected amount includes private financing for the same. Excess Property Sales When the RTD Board of Directors has authorized the sale of surplus properties, estimated revenues are budgeted. There were no material sales of excess property recognized in 2016, and none is anticipated for RTD 2017 Adopted Budget Page 81
87 This page intentionally left blank. RTD 2017 Adopted Budget Page 82
88 Part VII Operating Expenditures RTD 2017 Adopted Budget Page 83
89 RTD Operating Assumptions Service Levels RTD provides five primary types of service to its 2,340 square mile District: Bus service is provided along major streets, freeways, and designated high-occupancyvehicle (HOV) lanes using vehicles that hold between 14 and 70 seated passengers. Service typically follows a fixed route on a regular schedule, with designated pickup and drop-off points at on-street bus stops and park-n-ride lots. Some service is provided to sporting events and other special events as well. Bus service is available to any passenger who arrives at a designated bus stop or who calls a vehicle in certain areas. call-n-ride service is demand responsive, shared ride, curb-to-curb service in designated geographic areas, using small, wheelchair accessible vehicles. Customers may book their rides up to two weeks in advance through their vehicle operators. Light Rail service is provided along light rail lines, and it uses rail cars powered by overhead catenary electric lines. Light rail cars hold 64 seated passengers each and currently can be operated in trains of up to four cars. Passengers board trains at designated stations, most of which have park-n-ride lots. Light rail service is available to any passenger who arrives at a station, and ramps are available at all stations to serve passengers with disabilities. Commuter Rail service is provided along commuter rail lines. It uses rail cars powered by overhead catenary electric lines and hold 91 seated passengers each. Trains are operated in pairs of two or four cars and passengers board trains at designated stations. access-a-ride service is curb-to-curb demand responsive service for people with disabilities, as required by the Americans with Disabilities Act (ADA) of Service is provided on an advance reservation basis to passengers who are certified as unable to use either regular bus or LRT service. The following table presents an overview of the service hours assumed in the development of the 2017 Budget. The sections below present further details on the types of service provided. RTD Service Hours 2016 and Change % Change Bus Service 3,086,649 2,983,432 (103,217) (3.3%) call-n-ride Service 126, ,826 (5,662) (4.5%) Rail Service 291, ,127 71, % access-a-ride 625, ,500 10, % SUBTOTAL 4,129,839 4,102,885 (26,954) (0.7%) Other Purchased Services 32,655 19,140 (13,515) (41.4%) TOTAL 4,162,494 4,122,025 (40,469) (1.0%) RTD 2017 Adopted Budget Page 84
90 Bus Service RTD provides an extensive network of fixed route bus services throughout its district. Much of this service is operated by RTD employees. To comply with Colorado State law, since 2005 and as revised in 2008, not more than the statutory 58% of all vehicular service, including bus, call-n-ride, and access-a-ride service has been operated by private contractors under contract to RTD. In addition to its regular scheduled bus service, RTD also operates call-n-ride service. This service provides door-to-door service in limited areas. Passengers in those areas may call the bus operator directly to arrange a pickup and drop off within the identified service area. All call-n-ride service is operated by private providers under contract to RTD. The following tables detail the bus service assumptions used to build the 2017 Budget. The first table shows services to be provided by RTD directly, and the second table shows the service to be provided by private contractors. RTD Directly Operated Service Hours 2016 and Change % Change Regular Route Service 1,683,716 1,591,121 (92,595) (5.6%) Unscheduled Service Hours 40,000 50,000 10, % skyride Service 66,508 64,306 (2,202) (3.3%) DASH and STAMPEDE 9,195 7,358 (1,837) (20.0%) Bus Service Maintenance / Increases % TOTAL RTD-OPERATED BUS 1,799,419 1,712,785 (86,634) (4.8%) Private Carrier Operated Bus Service Hours 2016 and Change % Change Fixed Route Bus Service Regular Route Service 1,229,413 1,212,758 (16,655) (1.2%) JUMP/BOUND** 51,691 51, % Englewood art Shuttle 6,126 6, % Bus System Maintenance / Increases % Subtotal - Fixed Route Bus Service 1,287,230 1,270,647 (16,583) (1.3%) call-n-ride Bus Service Base System 126, ,826 (5,662) (4.5%) Subtotal - call-n-ride Bus Service 126, ,826 (5,662) (4.5%) TOTAL PRIVATE CARRIER BUS 1,413,718 1,391,473 (22,245) (1.6%) RTD 2017 Adopted Budget Page 85
91 Light Rail Service RTD opened its first light rail line, the Central Corridor, in This 5.3-mile line serves downtown Denver, the three-college Auraria Campus, and major transfer centers in Northeast Denver and South Central Denver. In 2000, RTD opened its Southwest Corridor light rail line. This 8.7-mile line extended the Central Corridor line southwest from I-25 and Broadway to Mineral Avenue, serving the suburban communities of Englewood, Sheridan, and Littleton, as well as Denver. A third line, the Central Platte Valley light rail extension, which connects with the Central Corridor near Colfax Avenue and runs from that point to Union Station in Lower Downtown opened in In 2006, RTD opened its fourth light rail line, the Southeast light rail line. This 19.1-mile line extends from I-25 and Broadway along I-25 to Lincoln Avenue. It also provides service from Nine Mile Station in Aurora to I-225 and I-25. RTD increased its light rail service levels to accommodate this new line. The Southeast line provides access to the central downtown and lower downtown areas from the Denver Tech Center and Southwest Aurora as well as access from Central Denver to the Denver Tech Center and other employment centers in the Southeast Corridor. In 2013, RTD opened the West Rail Line, providing 12.1 miles of light rail service connecting Union Station with West Denver, Lakewood and Golden. In early 2017, RTD will be opening the I-225 Rail Line (R Line), a 10.5-mile extension from the current Nine Mile Station to the Peoria Station on the University of Colorado A Line (East Rail Line) commuter rail. Commuter Rail Service In April 2016, RTD opened its first commuter rail line, The University of Colorado A Line (East Rail Line), which runs 23 miles from Union Station to Denver International Airport. In July of 2016, the B Line (Northwest Rail Line) opened, providing service from Union Station to Westminster over 6 miles, and in the spring of 2017 RTD will be opening the G Line (Gold Rail Line), which will travel 11 miles from Union Station to Arvada and Wheatridge. The table below details the rail service assumptions used to prepare the 2017 Budget: Rail Service Hours* 2016 and Change % Change Scheduled Service 285, ,527 71, % Unscheduled Service 5,600 5, % TOTAL RAIL SERVICE 291, ,127 71, % * Service hours are equivalent to train hours. Trains may consist of up to four cars. Other Assumptions In addition to the service level assumptions, other economic assumptions were made in the preparation of the 2017 Budget. These are detailed below: RTD 2017 Adopted Budget Page 86
92 The rate of inflation was assumed at 3.0%, based on inflation forecasts by Moody s, and was applied to certain operating and capital costs. Diesel fuel cost was assumed at $1.69 per gallon. Salaried benefits were assumed at a rate of 35% of salary. RTD 2017 Adopted Budget Page 87
93 RTD District Summary of Program Costs Cost Category 2015 Actual 2016 Amended 2016 Projected 2017 Adopted Change /16 Amended % Change /16 Amended Salaries and Wages $ 150,807,615 $ 163,905,835 $ 163,841,917 $ 174,675,855 $ 10,770, % Fringe Benefits 54,343,943 59,129,828 59,105,130 61,836,915 2,707, % Materials and Supplies 58,884,056 60,145,066 59,743,066 53,952,649 (6,192,417) (10.3%) Services 79,749, ,672, ,829, ,539,075 (17,133,779) (11.9%) Utilities 13,672,650 19,306,601 19,291,269 22,220,914 2,914, % Insurance 8,102,221 7,740,000 7,740,000 7,315,000 (425,000) (5.5%) Purchased Transportation 113,216, ,810, ,810, ,550,536 (5,259,981) (3.0%) Leases and Rentals 3,462,073 3,557,390 3,557,390 3,789, , % Other Expenses 4,531,123 4,986,039 4,986,039 5,196, , % Sub Total $ 486,769,310 $ 638,254,130 $ 601,904,937 $ 626,077,579 $ (12,176,551) (1.9%) Interest Expense 81,018, ,313, ,313, ,912,000 43,599, % Depreciation and Amortization 142,160, ,857, ,857, ,868,000 30,011, % Grand Total $ 709,947,310 $ 977,424,130 $ 941,074,937 $ 1,038,857,579 $ 61,433, % Trend Analysis of Program Costs (millions of dollars) $700 $600 $500 $400 $300 $200 $100 $ Actual 2016 Amended 2017 Adopted RTD 2017 Adopted Budget Page 88
94 Personnel Summary Regional Transportation District Personnel Summary (Measured in Full Time Equivalents) Salaried 2015 Adopted '15-16 Change 2016 Adopted '16-17 Change 2017 Adopted Bus Operations Rail Operations Planning Capital Programs Safety, Security and Asset Management General Counsel Finance and Administration Communications Executive Office Board Office Total Salaried Represented 2015 Adopted '15-16 Change 2016 Adopted '16-17 Change 2017 Adopted Bus Operations 1, , ,242 Rail Operations Capital Programs Finance and Administration Communications Executive Office Total Represented 1, , ,875 Grand Total 2, , ,789 RTD 2017 Adopted Budget Page 89
95 Salaried Changes to Personnel from 2015 Adopted to 2016 Adopted (Measured in Full Time Equivalents) Bus Operations Technical Trainer 2 Capital Programs Engineer II, Construction 1 Engineer I 1 Engineer IV Construction 1 Safety, Security and Asset Management State of Good Repair Inspectors 2 Public Safety Supervisor 1 Video Investigations Specialist 1 Finance and Administration Senior Oracle Developer 1 Enterprise Systems Architect 1 Communications Sales and Information Representative 1 Public Relations Specialist 1 Smart Card Data Analyst 2 Supervisor, Market Development 1 Total Salaried 16 RTD 2017 Adopted Budget Page 90
96 Changes to Personnel from 2015 Adopted to 2016 Adopted (Measured in Full Time Equivalents) Represented Bus Operations Body Shop Mechanics (1) Bus Operator 35 General Repair Mechanic (5) Helper 10 Parts Clerk 2 Service Person 5 Service Worker 3 Service/Vault (3) Sign Fabricator 1 Support Vehicle Mechanic 1 Unit Shop Technician (1) Rail Operations Train Operator 40 Electro Mechanic 2 Laborer 5 Signal/Traction Power Maintainer 4 Capital Programs Certified FM Electrician 2 Certified FM Mechanic 1 Custodian 1 FM Mechanic 3 Facility Maintenance (2) Finance and Administration Revenue Technician 5 Communications Bilingual Information Specialist 2 Information Specialist 1 Total Represented 111 Total Personnel Changes 127 RTD 2017 Adopted Budget Page 91
97 Salaried Changes to Personnel from 2016 Adopted to 2017 Adopted (Measured in Full Time Equivalents) Bus Operations ADA Specialist 1 Rail Operations Instructor/Supervisor LRV Maintenance 1 Lightrail Supervisor 1 Concessionaire Liaison, Commuter Rail 1 Senior Budget Analyst 1 Senior Engineer/Supervisor, Track Maintenance 1 Planning Continuous Improvement Manager 1 Project Manager, Planning 1 Manager, Corridor Planning 1 Capital Programs Engineering Construction Manager 1 Safety, Security and Asset Management Data Analyst 2 Safety Regulatory Compliance Officer 1 Executive Office ADA Specialist 1 Program Specialist, WIN 1 Finance and Administration Senior Accountant, Commuter Rail 1 Security Analyst 1 Physical Therapist 1 Communications Digital Customer Relations Liaison 1 Manager, Community Engagement 1 Senior Safety Communications Specialist 1 Total Salaried 21 RTD 2017 Adopted Budget Page 92
98 Changes to Personnel from 2016 Adopted to 2017 Adopted (Measured in Full Time Equivalents) Represented Bus Operations Bus Operator, Full Time (25) Bus Operator, Part Time (16) General Repair Mechanic (2) Rail Operations Train Operator 4 Finance and Administration Revenue Technician 1 Communications Bilingual Information Specialist (1) Information Specialist 2 Total Represented (37) Total Personnel Changes (16) RTD 2017 Adopted Budget Page 93
99 Operating Expenditures by Department o o o o o o o o o o o Bus Operations Rail Operations Safety, Security & Facilities Planning Capital Programs General Counsel Finance & Administration Communications Executive Office Board Office Non-Departmental The following segment, Operating Expenditures by Department, is designed to aid the reader in understanding each major area of departmental expenditure and operations. Each departmental breakdown includes: Organizational chart General description of activities for each division Budget summary and trend analysis for each department Major changes between 2016 and 2017 budgets 2016 accomplishments Planned projects for 2017 RTD 2017 Adopted Budget Page 94

100 Bus Operations Transportation Street Operations Vehicle Maintenance Contracted Services Service Development RTD 2017 Adopted Budget Page 95
101 Bus Operations General Description The Bus Operations Department consists of five functional groups whose mission is to meet our constituents present and future public transit needs by offering safe, clean, reliable, courteous, accessible, and cost-effective fixed-route bus service throughout the District. Transportation provides all activities related to the training and supervision of the District s bus operators. This group includes all of the District s bus operators providing service from the three bus operating divisions: East Metro, Platte, and Boulder. The Transportation Training area provides training and retraining for all of RTD s Commercial Motor Vehicle Operators. Street Operations provides coordination of daily bus service, both RTD and the private contractors, on the street and liaison activities with light rail operations. Special services such as BroncosRide, SeniorRide, and RockiesRide are coordinated by Street Operations as well. Vehicle Maintenance is responsible for all activities related to the maintenance of the District s revenue bus fleet and support vehicles. In addition to day-to-day maintenance, servicing, and cleaning of RTD s vehicles at the three bus operating divisions, the unit shop provides component overhauls and rebuilds while the body shop handles all body, paint, glass, and upholstery work. Vehicle Maintenance coordinates all vehicle purchases for the District as well as retrofit programs to maintain an up-to-date, efficient bus fleet. Contracted Services consists of three groups that administer and oversee all RTD services provided by private contractors. Together, these three (3) groups oversee the provision of approximately 57% of RTD s rubber tire services. o Competitive Services administers and oversees all fixed-route RTD bus services provided by private contractors as originally mandated by Senate Bill , and revised in 1999 under HB99-103, in 2003 by HB , and in 2008 by Senate Bill o Paratransit Services administers and oversees all transportation services provided as a result of the requirements established by the Americans with Disabilities Act (ADA) of This division administers and coordinates all activities related to the access-a-ride and access-a-cab programs, including certification of eligibility for service, contract administration, service monitoring, and community involvement. o Special Services administers and oversees all non-traditional and alternative services provided by or financially supported by RTD. This division administers and coordinates RTD s call-n-ride program, SeniorRide program, and sporting event programs, such as Broncos Ride and Rockies Ride. It coordinates RTD s involvement with regional vanpool programs and administers RTD contracts for RTD 2017 Adopted Budget Page 96
102 financial support of non-traditional services provided by RTD partner organizations. Service Development plans and develops efficient and effective routes and operating schedules for all bus and light rail service provided by RTD, including identification of services to be provided by private contractors. This division also develops short and medium-range service plans, incorporating fixed-route bus, light rail, and new types of services to serve emerging needs throughout the District and participates in long range planning activities. This division also provides information regarding system schedule adherence and passenger counts through the Service Monitoring group. RTD 2017 Adopted Budget Page 97


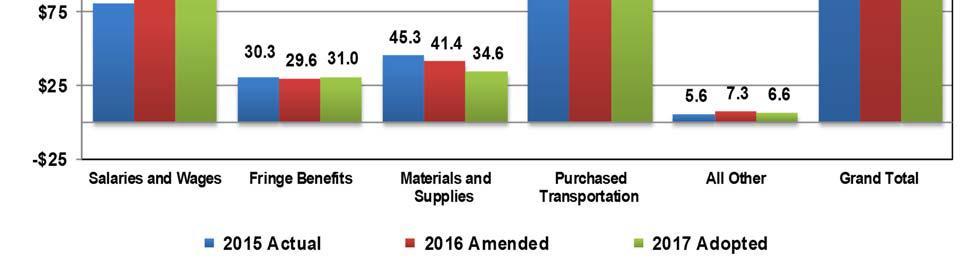
103 RTD 2017 Adopted Budget Page 98
104 Major Changes Between 2016 and 2017 Budgets Salaries and Wages/Fringe Benefits Increase in Salaries and Wages/Fringe Benefits due to contractual wage and fringe increases for represented personnel and merit increases for salaried staff Materials and Supplies Decrease in Materials and Supplies due to a reduction in diesel fuel and gasoline expense related to lower fuel prices and lower lock price on diesel Insurance Decrease in Insurance due to decrease in subrogation activity Purchased Transportation Increase in Purchased Transportation due to contractual rate increases for private carriers Other Expenses Decrease in Other Expenses due to decrease in: o other outside services related to a reduction in operating projects o reduction in costs of Access-A-Cab contracts o decrease in revenue vehicle repair parts RTD 2017 Adopted Budget Page 99
105 2016 Accomplishments RTD s Goals Safe Bus Operators completed Refresher Training to enhance operator safety skills Selected vendor for replacement of Mall Shuttle buses that are Clean beyond their useful life, selected an all-electric Zero Emission Vehicle Reliable Implementation of US 36 Bus Rapid Transit (BRT) flatiron Flyer service between Boulder and Denver Courteous Opened new Call-n-Ride in Superior and expanded service at Broomfield Call-n-Ride Implemented restructured bus service network to accompany the Accessible opening of the University of Colorado A Line commuter rail service between Denver Union Station (DUS) and Denver International Airport (DIA) Cost-effective Revised and implemented cost effective service changes Meets Future Needs Procured private charter bus lines for bus bridges for A, B & G commuter rail lines 2017 Planned Projects RTD s Goals Safe Utilize Smart Drive cameras and Refresher training to enhance operator skills Clean Receive Mall Shuttle replacement vehicles and place them into service Improve service delivery to meet growing mobility needs and Reliable improve on-time performance while staying within constrained financial resources Courteous Collaborative, trusting and productive relationship with the Amalgamated Transit Union (ATU) Accessible Implement restructured bus service plan to accompany the opening of the G, R and N-Line commuter rail Cost-effective Award Access-a-Ride and Call-n-Ride contracts Emphasis on Human Capitol meet staffing needs in all of Meets Future Needs operations Address changing technology and its potential for integration into the public transit service offering RTD 2017 Adopted Budget Page 100


106 Rail Operations Rail Transportation Vehicle Maintenance Operations Administration Rail Maintenance of Way SCADA Network Administration Ra RTD 2017 Adopted Budget Page 101
107 Rail Operations General Description The Rail Operations Department consists of five functional groups whose mission is to provide safe, reliable, and efficient light rail transit service to the citizens of the District. Transportation staff provides regular and special event operations and oversees the fare inspection staff whose goal is to ensure compliance with the District s fare policy. Vehicle Maintenance is responsible for ensuring the maintenance and cleanliness of the District s rail fleet. In addition to preventive maintenance, accident repairs, service, and cleaning of the vehicles, this group provides component overhauls and rebuilds as well as all body shop functions including body, paint, glass, and upholstery work. Operations Administration provides the overall management for Rail Operations. This group includes all departmental budgeting, fiscal planning and monitoring, capital project planning, performance monitoring, overall reporting, educational development, and quality assurance. Project management is provided for all rail vehicle procurement. Oversight and technical expertise is provided for corridor rail construction projects. Rail Maintenance of Way is responsible for the maintenance of the District s rail rights of way. Included in this function are traction power substations, overhead catenary systems, signal systems, track, and track rights of way such as rail beds and structures. SCADA Network Administration provides oversight of the fiber optics and information technology to function and maintain the Supervisory Control and Data Acquisition that enables staff to visually track and control the vehicles and wayside equipment, such as substations and track switches, in the District s rail corridors. RTD 2017 Adopted Budget Page 102


108 RTD 2017 Adopted Budget Page 103
109 Major Changes Between 2016 and 2017 Budgets Salaries and Wages/Fringe Benefits Net increase in Salaries and Wages/Fringe Benefits due to contractual wage and fringe increases for represented personnel, increase in the number of represented employees, and merit increases for salaried staff Materials and Supplies Increase in Materials and Supplies due to increase in vehicle repair parts Utilities Increase in Utilities due to anticipated increase in use of electrical service for the new R Line in 2017 Purchased Transportation Decrease in Purchased Transportation due to reclassification from Rail Operations to FasTracks interest expense of certain interest expense included in the Denver Transit Partners service payment RTD 2017 Adopted Budget Page 104
110 2016 Accomplishments RTD s Goals Safe Clean Reliable Courteous Accessible Cost-effective Meets Future Needs Hired, trained, and certified more than 111 Rail Operators Continued improvements to signaling system for safe operation and installed additional train signaling equipment at end of line (tail tracks) to provide additional safety Conducted State of Good Repair infrastructure assessments Investigated concept, tested, and procured contract for a Roadway Worker Protection System Implemented the Roadway Worker Protection Committee (RWPC) Performed regularly-scheduled LRV cleaning Maintained a clean corridor appearance, including trash policing and graffiti removal within 24 hours Managed good housekeeping in the maintenance facilities Revitalization of aging rail car fleet with midlife campaign Successfully rebuilt aging infrastructure with full replacement of NB Speer/Stout and 13th Ave grade crossings, seven overhead wire segments for State of Good Repair rehabilitation Effectively delivered service to all Rockies, Avalanche, Nuggets, and Broncos games, as well as various special events (Broncos Parade, Parade of Lights, CU-CSU football game, concerts, etc.) Continued to serve all RTD customers courteously and efficiently Procured rail track equipment to correct the existing degradation of track ride quality conditions Installed wayside lubricators to provide a friendly environment with neighboring communities by reducing noise emitted from rail squeal in curves and also results in a reduction of rail wear Moved Transit Police, SCADA and LRT Maintenance Training into remodeled Navajo building for expansion to function more effectively and provide a cutting edge training facility Improvements with the ADA customer complaint process and providing timely responses Conducted operator refresher training to keep current with operating changes and refocus on effective operation Completed the design, configuration, and implementation of a new improved fiber optic network system in the West Corridor for better efficiency of the grade crossing operation, reduce staff labor response, and incorporated in the I-225 corridor Startup of the Rail Operations Continuous Improvement Alliance (CIA) to improve departmental staff communications Completed integrated inspection and testing of the new R Line corridor by verifying the contractor has met or exceeded the design Involvement with the criteria and design of the future corridors to include lessons learned (i.e., SERE, CRE & NMRL) Implement and refine training program with the new Operator Training Simulator to better equip Rail Operators and reduce revenue service interruptions RTD 2017 Adopted Budget Page 105
111 2017 Planned Projects RTD s Goals Safe Clean Reliable Courteous Accessible Cost-effective Meets Future Needs Provide annual refresher training to all Transportation staff, continue to test staff members on critical safety Rules and Procedures Complete system upgrades on selected system infrastructure elements to assure maximum operational safety Installation of Wayside Worker protection system (on trains and in field) to alert Train Operators and Wayside Workers of each other as the train approaches Perform regularly-scheduled LRV cleaning Maintain a clean corridor appearance, including trash policing and graffiti removal within 24 hours Manage good housekeeping in the maintenance facilities Implement service & cleaning trains in Peoria Station tail track for R Line Administer the contract for the new LRV procurement activities and monitor the manufacture to meet the RTD requirements in building an acceptable light rail vehicle to deliver service on future corridors Continuation with mid-life rail car rehab campaign to revitalize aging fleet Repair aging infrastructure on the Central Corridor Refine effective interaction and communication with the public by utilizing new technologies Continue with quick response in the Rider Alert notification system, keeping customers advised of service interruptions and planned maintenance activities Administer the operators training simulators to provide more quality time behind the controls in operating a LRV safely and effectively with numerous scenarios encountered Participate in the shorter weeknight (Sunday-Thursday) service hours so more maintenance activity can occur on the infrastructure during hours of no train activity Emphasize/prioritize State of Good Repair and Asset Management in the Rail Operations department Continue to work with Capital Programs, Commuter Rail, and Planning staff to assure that new lines incorporate lessons learned that will reduce ongoing operations expenses due to inefficiencies Prepare Rail Department for future rail openings, staffing, training, oversight, communications, and leadership Opening of the I-225 R Line corridor Execute on-call projects to include upgrade of emergency turnouts and installation of electric heat for the switches in the Mariposa yard Update operators training simulator to include R Line Rebuild of the 19 th & California Grade Crossing RTD 2017 Adopted Budget Page 106

112 Planning Systems Planning Department Administration FasTracks Implementation Planning RTD 2017 Adopted Budget Page 107
113 Planning General Description The Planning Department consists of two functional units responsible for Technical Planning Services and for Transit Oriented Development and Planning Coordination consistent with District goals. The Department coordinates the District s long-range planning activities with local, state and federal agencies and jurisdictions in the planning and environmental clearance of projects, competitive grants applications, and the provision of continued support through project implementation. Systems Planning is responsible for medium and long-range planning and environmental work for RTD transit projects including FasTracks, service, systems, and facilities. This division also is responsible for the District s transit-oriented development activities and for coordinating planning activities with other local governments, the Denver Regional Council of Governments, and the Colorado Department of Transportation. Department Administration is responsible for coordination of planning activities with other jurisdictions and the monitoring and execution of competitive grant opportunities as well as providing support for District initiatives. FasTracks Implementation is responsible for the design and construction of all rapid transit corridor projects in the FasTracks Program. This includes oversight of all design and construction contracts, systems design, and quality assurance for the FasTracks program. This group works closely with all other divisions of the Planning and Capital Programs Departments and all other departments of the District to ensure that FasTracks corridors are completed on schedule and within budget. RTD 2017 Adopted Budget Page 108

114 RTD 2017 Adopted Budget Page 109
115 Major Changes Between 2016 and 2017 Budgets Salaries and Wages/Fringe Benefits Increase in Salaries and Wages/Fringe Benefits due to merit increases for salaried staff Services Decrease in Services due to reduction in Systems Planning projects designed to meet future needs of the organization Other Expenses Increase in Other Expenses due to increase in: o travel costs due to larger number of speaking engagements at conferences o various program studies including continuous improvement program (Lean) o costs related to Title VI compliance RTD 2017 Adopted Budget Page 110
116 2016 Accomplishments RTD s Goals Clean Reliable Accessible Cost-effective Meets Future Needs Continued to monitor and document environmental compliance and to resolve environmental issues as they arose on multiple FasTracks projects Identified and developed continuous improvement lean for government tools to engage employees in improving the way RTD serves the public, leading to the establishment of the E3 Innovation program/continuous Improvement & Innovation Division Engaged more than 300 employees in four-hour E3 101 introduction to process improvement tools and 40 change agents in our week long E3 Boot Camp and offered continued support for employee innovation after initial engagement Completed Rapid Improvement Events and process improvement workshops under the auspices of the E3 Innovation/Continuous Improvement & Innovation program As part of the Welton Corridor TOD Pilot (29 th & Welton), secured Denver commitment to a mixed-income condominium project subsidy and Board of Directors approval for property sale at fair market value if a developer is selected that meets the agreedupon terms Received FTA concurrence on the 2016 Title VI Program Update Completed the FTA Capital Investment Grant process for the Southeast Rail Extension funding with award of a $92 million Small Starts Grant Agreement on April 27, 2016 Completed the Parking Pricing Technical Analysis. Secured over $3.5 million in CDOT FASTER grant funds for various RTD projects Completed rigorous analysis of potential for FTA New Starts/Small Starts grant funding of the Central Rail Extension, Northwest Rail, North Metro Completion and the Southwest Rail Extension Led the facilitation of the internal Parking Working Group which resulted in the adoption of a set of Parking Guiding Principles adopted by the Board of Directors Continued FasTracks operations planning and programming support, including: update of the North Metro Operations Plans, a precursor to the opening day service plan; and establishment of the FasTracks Operations & Maintenance Change Control Board RTD 2017 Adopted Budget Page 111
117 2017 Planned Projects RTD s Goals Safe Clean Reliable Courteous Accessible Cost-effective Meets Future Needs Work with Safety, Security & Asset Management group to develop easy to understand metrics that employees engaged through the E3 Innovation program which can use to identify and eliminate safety concerns Continue to monitor and document environmental compliance, resolve environmental issues, and work towards environmental closeout on multiple FasTracks projects Continue to broaden the reach of continuous improvement tools through rolling out E3 Innovation 101 and Boot Camp to more employees and supporting the development and execution of ideas through Innovation Labs, Workshops and Rapid Improvement Events Conduct at least two Rapid Improvement Events to catalyze improvement on large, cross departmental processes; conduct additional Workshops for smaller, interdepartmental process improvements Recalibrate DRCOG s Compass and Focus regional travel demand models using 2015 onboard survey data Manage expectations for RTD s ongoing role in Transit Oriented Communities issues including affordable housing, first and final mile connections, gentrification and joint development opportunities Initiate the regional Arterial Bus Rapid Transit Feasibility Study Complete negotiations and memorialize strategy for eventual redevelopment of I-25 and Broadway station Initiate the First and Final Mile Strategic Plan Continue the Grants Task Force efforts to track and pursue federal, regional and non-profit funding opportunities (grants, etc.) to support RTD s goals and objectives Initiate the Pass Program Study and convene the Pass Program Working Group Obtain NEPA clearance and advance design of the 15L Route Improvements project on East Colfax Initiate the State Highway 119 Bus Rapid Transit NEPA and Preliminary Engineering study effort Prepare a disseminate the FasTracks Quality of Life full measures annual report RTD 2017 Adopted Budget Page 112


118 Capital Programs Capital Programs Facilities Maintenance FasTracks Implementation FasTracks Corridors Engineering RTD 2017 Adopted Budget Page 113
119 Capital Programs General Description The Capital Programs Department is responsible for project delivery of major capital programs at RTD. The department takes the lead upon completion of planning in the engineering, construction and integration of capital projects. The Capital Programs Department is also responsible for all facilities maintenance issues for the Base System as well as RTD s FasTracks program. Specific areas include all areas of engineering including civil, drainage, structural, track work, utilities, architectural, mechanical, electrical, facilities and systems (traction power, overhead contact systems, train control, communications, corrosion control and system wide electrical). The four divisions include program implementation, engineering, including systems engineering and facilities maintenance. The Capital Programs Department is responsible for the delivery of the project on-time, within budget and with the high quality that meets RTD requirements. The department works closely with all other RTD departments in project delivery. Facilities Maintenance is responsible for maintaining and upgrading all RTD fixed facilities, stations, real estate, and parking management. This group includes three functional units, Facilities Engineering, Facilities Maintenance, and Parking Management. Facilities Engineering is responsible for the design, construction, and renovation of all District facilities, including maintaining and enforcing ADA compliance requirements at the District s facilities. Facilities Maintenance is responsible for maintenance, cleaning, landscaping, and snow removal at all operating and passenger facilities including rail stations, passenger shelters, and park-n-rides. Parking Management is responsible for the development and implementation. FasTracks Implementation and FasTracks Corridors are responsible for the design and construction of all rapid transit corridor projects in the FasTracks Program. This includes oversight of all design and construction contracts, systems design, and quality assurance for the FasTracks program. These groups work closely with all other divisions of the Capital Programs Department and all other departments of the District to ensure that FasTracks corridors are completed on schedule and within budget. Engineering is responsible for the design and construction of capital projects outside the FasTracks Program, including bus and LRT systems, park-n-ride and transfer facilities, renovation and expansion of existing park-n-rides, and construction of enhancements to the existing transit system. It is also responsible for engineering and design support for the FasTracks program, in the areas of utilities, drainage, track work engineering, and structural/civil engineering. This division also is responsible for all District property management activities, including acquisition, leases, joint-use agreements, easements, and license agreements. FasTracks: All divisions of Capital Programs, as well as other departments in the District, carry responsibility for the FasTracks Program. The District has added project positions for the duration of the FasTracks program to carry out the additional work required to implement the program, and these positions are budgeted as part of the FasTracks program. However, other staff performs duties related to the FasTracks program as appropriate. RTD 2017 Adopted Budget Page 114
120 The Capital Programs department is organized along functional lines, with FasTracks and non-fastracks staff reporting through a single organizational structure. However, the FasTracks budget segregates Capital Programs department expenses funded through FasTracks from those paid through RTD s non-fastracks funding. The FasTracks budget also includes FasTracks-related expenses incurred by other departments, as well as interest expense on debt issued for the FasTracks program. RTD 2017 Adopted Budget Page 115

121 RTD 2017 Adopted Budget Page 116
122 Major Changes Between 2016 and 2017 Budgets Salaries and Wages/Fringe Benefits Net decrease in Salaries and Wages/Fringe Benefits due to merit increases for salaried staff offset by planned reduction in project staff due to completion of major FasTracks corridors Services Decrease in Services due to: o progression and/or completion of expense projects for FasTracks components under construction in 2016, primarily the Eagle Project o fewer expense projects associated with the FasTracks program in 2017 than in past years Utilities Decrease in Utilities due to reduction and consolidation in office space for both administrative and project staff Leases and Rentals Decrease in Leases and Rentals due to reduction and consolidation in office space for both administrative and project staff Other Expenses Decrease in Other Expenses associated with overall reduction in FasTracks construction activity RTD 2017 Adopted Budget Page 117
123 2016 Accomplishments RTD s Goals Safe Clean Reliable Courteous Accessible Cost-effective Meets Future Needs Completed installation of CCTV and emergency telephones on the US 36 BRT corridor Administered District bridge inspection programs Began replacement of TREX coping panels Completed PUC review process for the North Metro Rail Line, verifying safety compliance at crossings Complete repainting of pedestrian bridge at US 36 and Sheridan Station Initiated landscaping improvements at 40 th & Airport Station Contracted for services across the District to keep shelters, plazas, platforms, and other passenger facilities clean and free of snow Conducted pavement repairs and replacements at Park-n-Ride locations around the District Completed emergency repairs to the light rail tracks in downtown Denver Continued 16th Street Mall maintenance Collaborated with stakeholders, agencies, consultants and contractors on all projects Installed fare collection equipment on the A, B, G, and R lines, and at Denver Union Station Completed 110 individual street improvement projects around the District Managed all FasTracks corridor projects within the approved schedule and budget Managed design and construction contracts to ensure the District obtains best value Completed the US 36 Managed Lanes from 88 th Street to Table Mesa and began revenue service on the Flatiron Flyer in January 2016 Completed construction and testing for the University of Colorado A Line, B Line and R Line, began revenue service on the University of Colorado A Line in April 2016 and on the B Line in July 2016 Received Small Starts Construction Grant and issued Notice to Proceed for construction of the Southeast Rail Extension Completed corridor design on the North Metro Rail Line Developed graphic user interface to access property records Installed electric charging stations at Central Park Station and Elati Facility and purchased two electric pool cars Completed demolition and started construction on Civic Center Plaza rehabilitation RTD 2017 Adopted Budget Page 118
124 2017 Planned Projects RTD s Goals Complete structural repairs of inspection pits at Boulder Safe operating facility Continue replacement of TREX coping panels Administer District bridge inspection programs Manage contracted services across the District to keep shelters, plazas, platforms, and other passenger facilities clean Clean and free of snow Continue landscaping upgrades at properties around the District Start preliminary design to improve customer experience and reliability of 15L bus route Reliable Complete replacement of in-ground hoists at Platte bus facility Continue to implement State of Good Repair projects for the existing light rail corridors, bus system and facilities Courteous Collaborate with stakeholders, agencies, consultants and contractors on all projects Institute Quiet Zones on the commuter rail corridors Accessible Continue individual street improvement projects Continue to manage all FasTracks corridor projects within the Cost-effective approved schedule and budget Manage design and construction contracts to ensure the District obtains best value Place the G-Line and R-Line into revenue service Continue to work with CCD and the Downtown Stakeholders on developing solutions for the 16th Street Mall Continue construction on North Metro Rail Line Meets Future Needs Continue construction on Southeast Rail Extension Complete rehabilitation and reconstruction of Civic Center Station Complete renovation of 711 Building to provide additional space for Customer Care and Treasury functions RTD 2017 Adopted Budget Page 119
125 This page intentionally left blank. RTD 2017 Adopted Budget Page 120


126 Safety, Security & Asset Management Asset Management Security & Emergency Management Safety & Environmental Safety, Security & Asset Management RTD 2017 Adopted Budget Page 121
127 Safety, Security & Asset Management General Description The Safety, Security & Asset Management Department consists of three divisions whose mission is the asset management, security and emergency management, and safety and environmental management of the District. Asset Management is a strategic capital planning process that supports well informed investments, prioritization, and decisions based on good quality data and clear organizational objectives. Asset Management division's primary function is to support the District in optimizing performance, risks, and costs of RTD assets throughout their life. Another key function is ensuring compliance with Federal Asset Management and State of Good Repair (SGR) regulations and reporting requirements. Security & Emergency Management is responsible for the District's security, emergency management, and emergency preparedness planning. This Division is responsible for physical security including security patrols and coordination with local law enforcement agencies. Additionally, this Division is responsible for the design, installation, and maintenance of RTD s security systems and Security Command Center and serves as the point of contact for emergency management and planning. Safety & Environmental is responsible for the District's occupational safety, system safety, environmental regulatory compliance programs, and site assessments. This division consists of two units, Safety and Environmental Compliance. o Safety encompasses all modes of transportation and maintenance safety and is designed to assure regulatory compliance, prevent accidents, protect lives and property, and reduce costs associated with accidents. o Environmental Compliance includes environmental assessments for property acquisition, hazardous waste minimization and disposal, remediation of contaminated sites, monitoring for environmental hazards during construction, and ensuring compliance with all federal, state, and local environmental laws. RTD 2017 Adopted Budget Page 122

128 RTD 2017 Adopted Budget Page 123
129 Major Changes Between 2016 and 2017 Budgets Salaries and Wages/Fringe Benefits Increase in Salaries and Wages/Fringe Benefits due to merit increases for salaried staff Services Increase in Services due to: o additional contracted security services related to the opening of new rail corridors and overall system-wide increase in security personnel o associated increases in equipment, uniforms, and ammunition Other Expenses Decrease in Other Expenses due to reduction in temporary personnel RTD 2017 Adopted Budget Page 124
130 2016 Accomplishments RTD s Goals Safe Clean Reliable Courteous Accessible Cost-effective Meets Future Needs Opened second Security Command and 911 dispatching center at the commuter rail maintenance facility Expanded the Situator incident management software used to create redundancy and standardize processes within two Security Command Centers Active Shooter Full Scale Exercise on the Commuter Train supported by TSA and DPD Satisfied the Small Unmanned Aerial Vehicle (suav) regulatory requirements to implement a suas Inspection Program, aimed at reducing the number of employees on the rail alignment Awarded TSGP Grant to support K9 explosive detection team Continued to utilize security and police patrols to minimize vandalism/graffiti and crimes on RTD property Expanded employee training on infectious disease prevention and implemented new procedures for cleaning and disinfecting of buses, trains, and facilities Awarded Safety and Security Certification programs more electronic, using less paper than past years Continued to maintain expanded RTD security command systems and equipment in a State of Good Repair Implemented IPhone device for Fare Enforcement with more reliable technology Completed PUC /RTD Joint Audit cycle with no findings Asset Management employees received certification by The Institute of Asset Management (IAM) Maintained customer service and customer focus in all interactions with the public, contractors and employees Tracked and provided prompt and courteous responses to customer and employee safety concerns and issues Passenger Code of Conduct established and approved by Board of Directors Continued to maintain secure access to all RTD facilities ADA compliant emergency egress systems built into R line rail right of way Worked with the ADA Manager on internal and external ADA issues that impacted safety and security Expanded CCTV user base to FM Maintainers for 24/7 visual condition assessments The Environmental staff received training and certifications that allowed them to perform work that was previously performed by vendors Managed over 9,800 requests from outside law enforcement agencies Increased security in support of the A & B Lines opening Utilized RTD aerial vehicle program to record Aurora First Responder and RTD light rail exercise, test bed for future exercise debriefs Fare Task Force created for better enforcement of fare evasion RTD 2017 Adopted Budget Page 125
131 2017 Planned Projects RTD s Goals Safe Clean Reliable Courteous Accessible Cost-effective Meets Future Needs Redesign security access to Blake Street with new doors Develop and implement Safety Management System (SMS) program to enhance safety culture and meet FTA compliance TAM & SMS Connection Asset Management aims to collaborate with the Safety team to ensure the connection between State of Good Repair has been established. Implement visitor management system Continue to utilize security and police patrols to minimize vandalism/graffiti and crimes on RTD property Implement a comprehensive Housekeeping campaign at all operations facilities Complete move to digital Safety and Security certification process Continue to maintain RTD security systems and equipment in a State of Good Repair (Asset Management) Continue Asset Management inspections of all RTD transit coach buses, RTD light rail vehicles and all Park-n-Ride locations, including light rail stations Complete integrated testing on the R-Line Maintain customer service and customer focus in all interactions with the public, contractors and employees Increase local area training for security officers to perform their functions as ambassadors Continue to work with First Responders and local municipalities on SERE project addressing fire and life safety items Evaluate the accessibility and secure access to all RTD facilities Continue to work with the RTD ADA committee to address concerns Contracted with a crime analyst who will improve the patrol functions and quicker response to serious crime issues Review all contracts to determine if there are steps where funds can be utilized more wisely Asset Management acting as consultants to the agency will continue to support projects such as the enterprise data warehouse, GIS locates, labor and resource analysis, and inventory analysis to identify actionable cost savings opportunities Increase security in support of the B, G & R Line opening Asset Risk Register aims to assign physical assets with a risk score used as a supplement to our decision-making processes FTA Requirements Asset Management aims to be compliant with most recent FTA TAM Rule Making RTD 2017 Adopted Budget Page 126


132 General Counsel Information Governance & Management Legal Services Risk Management General Counsel RTD 2017 Adopted Budget Page 127
133 General Counsel General Description The General Counsel Department s mission is to manage legal affairs and risk management for the District. In 2016, Information Governance and Management was added to its responsibilities. Information Governance and Management coordinates responses to Colorado Open Records Act requests, works with staff on legal holds, and monitors the archiving of both hard and soft copies of documents. Legal Services represents RTD in all litigation by or against the District. This includes personal injury, property damage, subrogation, employment litigation including workers' compensation claims, real estate matters, construction litigation, environmental disputes, grievance arbitration, and any miscellaneous lawsuits. Risk Management functions include adjusting personal injury, property damage, and workers' compensation claims; administering the District's self-insured liability and workers' compensation programs; and securing property and other required insurance coverage. RTD 2017 Adopted Budget Page 128

134 RTD 2017 Adopted Budget Page 129
135 Major Changes Between 2016 and 2017 Budgets Salaries and Wages/Fringe Benefits Increase in Salaries and Wages/Fringe Benefits due to merit increases for salaried staff Services Decrease in Services due to reduced need for outside legal services Insurance Decrease in Insurance due to negotiated contract rate for two years on liability insurance that is lower than 2016, offset by general increases in insurance premiums for the District as a whole and an increase in the self-insurance claims program Other Expenses Decrease in Other Expenses due to reduction in taxes, licenses, permits and penalties RTD 2017 Adopted Budget Page 130
136 2016 Accomplishments RTD s Goals Clean Cleaned and overhauled the Document Storage Center Reliable Created and integrated into our department RTD s new Information Governance and Management Division; RTD s information governance and enterprise content management (IG/ECM) consultant recommended creation of this division to lead RTD in effective IG/ECM, including business process improvements, information storage solutions, and training Courteous Spearheaded campaign to create a Code of Conduct for our patrons and passengers, see also Accessible Settled the Colorado Cross-Disability Coalition class action lawsuit Accessible challenging the design and operation of RTD s light rail vehicles; the settlement agreement includes a new working relationship with CCDC to resolve future concerns before they rise to litigation Provided extensive legal work to open the University of Colorado A Line, B Line, and Flatiron Flyer plus several parking garages; and to Meets Future Needs ready the G and R Lines for opening; these efforts included 68 PUC filings plus complicated real estate, construction and regulatory matters 2017 Planned Projects RTD s Goals Safe Reliable Meets Future Needs Year 1 of the IG/ECM plan will include developing and implementing web-based Colorado Open Records Act intake procedures and accident/incident report processing, scanning procedures and training to allow us to throw away paper; and transforming RTD s management directives into policies and procedures that are easy to find, understand, and update Finish drafting and begin steadily implementing through process improvements and training a comprehensive 5-year plan to make RTD a proactive and even transformational organization in information governance and enterprise content management In addition to ongoing litigation, transactions and compliance activities, complete new procedures, training, templates and terms/conditions for technology contracts RTD 2017 Adopted Budget Page 131
137 This page intentionally left blank. RTD 2017 Adopted Budget Page 132

138 Finance & Administration Finance & Administration Finance & Accounting Human Resources Treasury Information Technology RTD 2017 Adopted Budget Page 133
139 Finance & Administration General Description The Finance & Administration Department supports both the RTD Base System and FasTracks and oversees the finances of the entire district. Finance & Administration is comprised of Treasury, Accounting, Budget & Financial Analysis, Debt & Investment Management, Statistics, Human Resources, Information Technology, Financial Reporting. Finance & Accounting is responsible for all accounting, financial planning, budgeting, debt, investments and grant management functions. These include payroll, accounts payable, accounts receivable, fixed asset accounting, ridership reporting, investment and cash management, issuance of long-term debt, budget development and monitoring, financial reporting and forecasting, grant monitoring and associated reports for the Federal Transit Administration. Human Resources is responsible for personnel issues, recruitment and selection of employees, performance management, employee compensation, labor negotiations and administration of the collective bargaining agreement, employee benefits, professional development programs, the employee wellness program, employee travel, office services, and the federally mandated Substance Abuse Program. Treasury is responsible for collection, transportation and depositing of all cash revenue received through fare collection equipment and customer sales outlets. All monies are possessed in accordance with Federal Reserve standards. Additionally, the Treasury provides preventive maintenance and all servicing needs to the District s farebox fleet and rail ticket vending machines. This includes servicing and maintaining change, token, 10-ride book and monthly pass vending machines available for public use at the District s customer service stations. Information Technology (IT) develops, operates, and maintains the District s information and telecommunications systems. IT designs, programs, and maintains software applications that support all business and technical communications processes within the District, including the Enterprise Resource Planning project. Additionally, IT provides RTD riders with useful itinerary and ontime information using the RTD website or RTD Information Kiosks. RTD 2017 Adopted Budget Page 134


140 RTD 2017 Adopted Budget Page 135
141 Major Changes Between 2016 and 2017 Budgets Salaries and Wages/Fringe Benefits Increase in Salaries and Wages/Fringe Benefits due to contractual wage and fringe increases for represented personnel, merit increases for salaried staff Materials and Supplies Decrease in Materials and Supplies due to decreases in: o computer hardware and communication equipment in Information Technology as a result of completing one-time projects o card inventory for Smart Card project in Finance Services Increase in Services due to increases in: o costs related to Smart Card roll-out including card stock, annual expense for hosting of Smart Card web portal and back office systems, and contract maintenance o some software maintenance contracts in IT o in-house training costs o financial services in Debt & Investments o equipment maintenance and software/hardware maintenance contracts in Treasury o cybersecurity services Utilities Increase in Utilities due to increased costs of new telephone services, including upgrades, new phones, and other telecom items Leases and Rentals Increase in Leases and Rentals due to possible relocation of some personnel from an owned property to a leased property and an increase in office space needs Other Expenses Increase in Other Expenses due to: o employee referral program including background checks and medical examinations o costs for Collective Bargaining Agreement negotiations RTD 2017 Adopted Budget Page 136
142 2016 Accomplishments RTD s Goals Safe Reliable Courteous Cost-effective Meets Future Needs Established a cross functional Cybersecurity committee Completed Phase I of the Credit Card processing environment Remediation of PCI related gaps Completed a DHS assessment of SCADA/ICS network Implemented Real Time Passenger Information data feed for Light Rail Implemented IPhone with eforce and SMT programming Implemented financial reporting and controls for web portal Held SBP training and quarterly roundtables with Budget Analysts and Cost Engineers Provided Board Training on SBP/APE/Budget Held quarterly reviews of budget variances and capital projects Eagle Project achieved Federal Grant eligibility Maximized draws and cash flows efficiently on all FasTracks financing sources Coordinated financial and statistical reporting with DTP as lines went into Revenue Service Moved Smart Card to a hosted environment Researched and prepared a business case for Mobile Ticketing Determined financing needs for SERE and FasTracks Completed the financing needs for RTD s Rolling Stock 2017 Planned Projects RTD s Goals Safe Perform Active directory clean up and implement process and procedures to keep Active directory up to date Reliable Implement Real Time predictions for Light Rail Cost-effective Refund the Denver Union Station RTD outstanding bonds to achieve at least a 40% annual savings each year between 2018 and 2040 Reduce time to pay invoices by 20% Meets Future Needs Implement public facing portal for SMT stored value RTD 2017 Adopted Budget Page 137
143 This page intentionally left blank. RTD 2017 Adopted Budget Page 138

144 Communications Public Information Internal Audit Customer Information Marketing Communications RTD 2017 Adopted Budget Page 139
145 Communications General Description The Communications Department consists of four divisions that are responsible for the management of the District s internal and external communications, governmental affairs, customer information and sales, and internal audit. Public Information (Public Relations, Government Relations, and Community Relations) is responsible for maintaining effective media and public relations, including performing official spokesperson duties for the District and overseeing the public information efforts on the FasTracks project. Government Relations works with state and local government agencies in a variety of roles. This office is responsible for directing RTD s state and federal lobbyists in their efforts in introducing and tracking bills in the state legislature and in Congress, for monitoring and reporting on pending state and federal legislation, and for coordinating efforts in securing federal funding for RTD s major projects. Community Relations ensures that stakeholders, customers, and the public at large are informed and educated about RTD and all of its programs, including the FasTracks program. Internal Audit Division is responsible for monitoring internal and external operations for efficiency and adequate controls and supervising contract closeout audits. Customer Information Division is responsible for providing route, schedule, and fare information to our customers through our Telephone Information Center and s received through our website in both English and Spanish. Other responsibilities of the division include: o Translates and records phone mail scripts in Spanish o Receives by phone and customer comments, suggestions/inquiries, and commendations, processes them and responds back to the customer o Responds to external and internal customer requests to furnish staff for presentations o Responds to customer requests for printed material such as route schedules and mails them to the customer o Administers the Special Discount Card program; coordinates the Senior Volunteer Program o Oversees pass sales at all of our sales outlets at our major transit centers o Manages the Lost and Found at our major transit centers o Assists the EcoPass function by taking EcoPass pictures at DIA o Administers the Bike Locker Program at the park-n-ride locations o Works with the IT Division to maintain and update the RTD website and TIC trip planners as well as develop the Google trip planner for use by our customers Marketing is comprised of the Sales, Market Research, Account Services and Design Services groups. Marketing provides prepaid fare products, performs market research, and promotes RTD service through direct mail, print and broadcast advertising, and other activities. This division also is responsible for print production, graphic design, and audio/visual support for all RTD activities and plans special events. RTD 2017 Adopted Budget Page 140


146 RTD 2017 Adopted Budget Page 141
147 Major Changes Between 2016 and 2017 Budgets Salaries and Wages/Fringe Benefits Increase in Salaries and Wages/Fringe Benefits due to merit increases for salaried staff Services Decrease in Services due to non-recurring spending in 2017 for launch marketing and grand opening events for new rail lines opened in 2016 offset by spending on new promotional materials related to RTD s expanded system Other Expenses Increase in Other Expenses due to funds needed for: o repair of vehicle advertising wraps o promotional activities to commemorate the re-opening of Civic Center Station RTD 2017 Adopted Budget Page 142
148 2016 Accomplishments RTD s Goals Safe Clean Reliable Courteous Launched a local version of the internationally acclaimed Dumb Ways to Die transit safety campaign that was introduced across the Denver metro region in early 2016 that included media coverage and a public event at Union Station Took the RTD safety message to dozens of fairs, festivals and other public events across the region Conducted safety outreach to schools near the University of Colorado A Line and B Line prior to openings Promoted the national Dump the Pump initiative with local news media outlets to encourage drivers to use public transit for at least one day to improve air quality and conserve fossil fuels Held a media event to showcase the new fully electric powered MallRide vehicles Held Telephone Town Hall meetings in all 15 RTD Board of Directors districts Interviewed with local media about the agency s efforts to continue providing reliable services during and after snow storms and other weather events During the 2016 session of the Second Regular Session of the 70th General Assembly, reviewed 776 bills and resolutions, closely monitored 11 bills with potential significant impacts to RTD, and monitored an additional 78 bills with less significant impacts to RTD Redesign and new content support structure implemented for The Hub intranet Actively participated in tours for the state Legislative Council staff; as well as other small tours for elected officials or their staff Assisted in arranging and facilitating US Representative Jeff Denham s briefing on Denver Union Station and RTD s Eagle Project Public Private Partnership arrangement Launch of new internal and external trip planner Facilitated several delegation visits and led multiple tours for elected officials and their staff members Launched new open-source Trip Planner with additional features for riders and Customer Care division Launched all new, in-house built NextRide application to show real-time arrival information for bus and rail on rtd-denver.com Conducted media management and public outreach for transit corridor openings Launched new series of press conferences held by GM Provided protocol and guest list advice for the three new transit line opening events Integrated customer care for CollegePass, EcoPass and MyRide into the Telephone Information Center Acquired space, designed and constructed a new sales outlet at the Denver International Airport Transit Center in time for opening of the University of Colorado A Line Created significant additional online presence via social media with opening of the University of Colorado A Line: 42% increase in Twitter followers and 214% increase in Twitter engagements / 15% Increase in Facebook followers and 94% increase in Facebook engagements RTD 2017 Adopted Budget Page 143
149 Accessible Cost-effective Meets Future Needs Collaborated with Denver Transit Operators to design and implement processes for communication of service disruptions, research of customer complaints and processing of lost items Facilitated outreach related to the ADA Symposium held in Denver in June 2016 Provided panel presentations for the ADA Symposium in June 2016 Collaborated with the RTD ADA Office and the Title VI Manager on public engagement designed to increase equity and accessibility prior to the opening of the University of Colorado A Line in April Divided resources among major transit line openings and other crucial projects Shared staffing and resources from FasTracks Public Information to maximize outreach related to opening of new transit lines Completed multi-faceted print and digital marketing campaigns and planned grand opening events for three new rapid transit lines One of only three APTA 2016 Ad Wheel Grand Prize Winners for the pre-opening campaign Completed nearly 3000 tablet-based surveys on the 16th Street Mall to measure the effect of 16th Street Free MallRide detours for Meet in the Street events in conjunction with the City and County of Denver and Downtown Denver Partnership RTD 2017 Adopted Budget Page 144
150 2017 Planned Projects RTD s Goals Safe Clean Reliable Courteous Accessible Cost-effective Continue to implement the internationally acclaimed Dumb Ways to Die transit safety campaign throughout the Denver metro region in until the contract expires Continue to message safety throughout the openings and service provision on two new transit lines and throughout the expanded transit system Continue to message the benefits of electric commuter rail and light rail technology, and usage of clean-burning fuels Promote the annual Dump the Pump Continue to promote the implementation of Free Mall Ride all electric vehicles Launch new Rider Alerts system for more accurate, timely service alert information Staff Civil Rights meetings and assist with communication efforts to build trust with small and disadvantaged businesses, professional associations, advocacy groups and passengers with disabilities Complete 2017 Customer Satisfaction and Utilization Study to provide information on how our new services have changed the customer experiences, service use, payment methods demographics to inform decisions including the next fare study and facilitate compliance with FTA triennial audit Successfully market and support 2017 Railvolution Conference in Denver Establish metrics based on best practices and leading edge technology to measure RTD s public relations efforts Continue public tour and public presentation programs that partner with local community and non-profit organizations Engage with communities and stakeholders along the tow FasTracks-funded rail lines opening in 2017 Organize and staff of community and FasTracks ambassador events, stakeholder meetings, and WIN promotional events in all 15 RTD districts Ensure RTD is well represented at all levels of government and at stakeholder meetings to keep the Board and staff apprised of critical information and developments Effectively market enhanced transit system with limited budget and resources Explore more trades, partnerships, and low-cost alternatives to stretch marketing dollars Divide resources among remaining major transit line openings and other crucial projects Seek ways of staffing community events that do not entail high costs RTD 2017 Adopted Budget Page 145
151 Meets Future Needs Transition communication responsibilities from the FasTracks Public Information (PI) team to the RTD Public Relations (PR) team following the openings of new transit corridors Implement a new Talent Gateway website to increase the quantity and quality of job applicants for RTD jobs Community Engagement team will kick off board district public outreach Continue to ensure that RTD is well represented at all levels of government federal, state, local as well as at stakeholder meetings and to keep the RTD Board of Directors and RTD staff apprised of pertinent information through the following tactics Continue to represent RTD as a member on the Colorado Association of Transit Agencies (CASTA) board and also on the Transit Alliance board of directors Provided protocol and guest list advice for the two new transit line opening events Continue to execute a successful public outreach effort along the Southeast Rail Line Extension project and the North Metro Rail Line project Continue to educate the public on current and upcoming RTD planning and construction projects like the 15L route improvements, State of Good Repair system maintenance projects and Civic Center Station RTD 2017 Adopted Budget Page 146

152 Board of Directors General Manager Executive Office RTD 2017 Adopted Budget Page 147
153 Executive Office General Description The Executive Office is responsible for the leadership and management of the District in support of the goals and objectives of the Board of Directors. Primary duties include the development of program and policy alternatives for consideration by the Board; leadership, administration and management of staff activities; project planning, implementation, and completion; providing an environment for growth and development of staff; maintaining effective internal and external RTD communications; and promoting the understanding and importance of transit needs. In addition, the Executive Office oversees two function units that provide critical support services that enable RTD s operational departments to meet the mission and goals of the District: Materials Management and Civil Rights. Materials Management is responsible for purchasing or contracting for all goods and services that the District requires. These include contracting for construction and professional services in support of approved projects, management of the District's inventory of repair parts and bulk fluids, disposition of excess/surplus District property, and management of the Purchasing Management and Inventory Control Systems. Civil Rights consists of two groups: The Business Opportunity Office and the Equal Employment Opportunity Office. The Business Opportunity Office develops, administers, and implements RTD s and FasTracks overall outreach and utilization plan for Disadvantaged Business Enterprise (DBE) and Small Business Enterprise (SBE) Programs as well as administers the Workforce Initiative Now (WIN) program. The Equal Employment Opportunity Office is responsible for the administration of the District s Equal Employment Opportunity program. RTD 2017 Adopted Budget Page 148


154 RTD 2017 Adopted Budget Page 149
155 Major Changes Between 2016 and 2017 Budgets Salaries and Wages/Fringe Benefits Increase in Salaries and Wages/Fringe Benefits due to merit increases for salaried staff Materials and Supplies Decrease in Materials and Supplies due to: o reclassification of cost of material salvage from Materials Management to Non- Departmental o reduction in materials needed in the WIN Program in Civil Rights Services Increase in Services due to increase in other outside services in the WIN Program Other Expenses Decrease in Other Expenses due to decreases in: o special projects and public events in Civil Rights o software maintenance in Civil Rights o planned travel RTD 2017 Adopted Budget Page 150
156 2016 Accomplishments RTD s Goals Safe Clean Reliable Courteous Cybersecurity assessment was completed to identify potential vulnerabilities and practical mitigations, a number of mitigations have been completed and others are underway, also completed on the SCADA system RTD was recognized as a national industry leader through various national awards including recognition by the US Department of Homeland Security (USDHS/TSA) for excellence in security programs Grand Prize winner of the American Public Transportation Association s (APTA) restructured Ad Wheel Awards as one of only three category winners for our 2016 Transit Project Education Campaign Light Rail operators achieved 1st Place in APTA International Rail Rodeo Received the first new all-electric mall shuttle vehicle, entire fleet should be in service by the end of 2017 Finalist for U.S. Building Green Council s Second Annual Commercial Green Building Achievement Awards for the Greenest Buildings of 2015 (new or existing) for the Commuter Rail Maintenance Facility; finalist for Global AirRail Awards Travelport Project of the Year Provided outstanding and noteworthy service for major special events, including providing service for the Denver Broncos Super Bowl parade which generated a record day for RTD ridership Provided 252 days of special services including such events as: Parade of Lights, New Year s Eve, March Madness, St. Patrick s Day, Five Points Jazz Festival, ComicCon, Taste of Colorado, 5 Meet in the Streets Weekends, sporting events, concerts, etc. Completed the successful opening of three FasTracks 2016 corridors on time and within budget Flatiron Flyer opened two weeks ahead of schedule and within budget and is performing at a ridership level of approximately 45% higher than the previous service plan for the corridor University of Colorado A line and the B line opened on time and within budget and is delivering good ridership numbers; the A line is already close to 1 year projections and the B line is already exceeding 1 year projections RTD was called upon to address national transportation industry issues through presentations at various national conferences, webinars, visits from DOT leadership, and visits from several cities Real-time information for local and regional bus routes was completed; the private sector is using RTD real-time information in a number of 3rd party smart phone apps (TransitApp, TripGo, Transit Tracker, Google, Moovit, ezride, Bing, Swiftly) RTD 2017 Adopted Budget Page 151
157 Accessible Cost-effective Meets Future Needs Continued focus given to the provision of service and mobility improvements for individuals with disabilities, fixed route and ADA paratransit ADA Office o o o o o For the first time, RTD was among the major sponsors of the biggest 4-day National ADA Symposium in the nation which included 72 breakout sessions and 800 attendees U.S. DOT issued a Reasonable Modification Rule to improve access and require public transportation providers to make reasonable modifications to their policies, practices and procedures to avoid discrimination and ensure programs and services are accessible to individuals with disabilities; the RTD ADA Office established a Reasonable Modification process and assisted in the creation of the Reasonable Modification training Civil Rights has worked collectively and diligently to implement a more efficient ADA complaint procedures and process In collaboration with Bus Operations, Facilities, and Capital Programs, an effective checklist was created for bus stop accessibility District-wide which will bring RTD into compliance with FTA regulations Established RTD s first ADA Design Review Panel which is comprised of 9 members from the community who have an interest in ADA transportation and represent respective parts of the community On 4/26/16, RTD was awarded an FTA Small Starts construction grant for the Southeast Rail Extension in the amount of $92 million which was the culmination of a multi-year effort in pursuit of the grant Completed the Parking Pricing Technical Assessment and presented the results to the Board of Directors in summer 2016; study concluded that daily parking charges can be feasibly implemented at RTD facilities and multiple pricing scenarios would be revenue positive, identified pros and cons associated with 3rd party management; based on Board input, staff is developing a set of RTD Parking Guiding Principles for consideration and adoption Continued to work collaboratively with partners and stakeholders to identify possible opportunities to enhance revenue (Boulder bus route advertising) and reduce costs such as rebuilding 262 light rail vehicles in-house Executed the first year of a five year, $5 million naming rights contract for the University of Colorado A Line, the first such naming rights contract for RTD that is among the largest annual amounts in the nation Continued focus on recruitment and retention of operators Awarded an FTA Small Starts construction grant for the Southeast Rail Extension in the amount of $92 million (see Cost-Effective above) RTD 2017 Adopted Budget Page 152
158 2017 Planned Projects RTD s Goals Safe Clean Reliable Courteous Accessible Cost-effective Meets Future Needs Install advance warning safety system for wayside workers Analyze accident data and evaluate current programs to reduce accidents and injuries Safety remains the District s #1 priority Renovation of Civic Center Station Continued emphasis on custodial cleaning and snow removal contracts Open R, G Lines; continue to improve on-time performance on A Line Continue to replace transit fleets that have reached the end of their useful lives including Mall Shuttles and 40-foot transit coaches Implement State of Good Repair projects for the existing light rail corridors and bus system Appropriately staff all Rail Operations divisions to ensure that we are able to operate and maintain existing system properly and support the expansion of the new rail corridors Continue to provide technological advances while ensuring the underlying information technology infrastructure is well maintained and kept up-to-date Increase DBE/SBE participation in the area of Operations and Maintenance goods and services Begin implementation of the Colorado Cross Disability Coalition and light rail agreement Establish and implement RTD Advisory Committee for People with Disabilities (ACPD) to serve in a multi-directional capacity Manage the implementation of new bus stop accessibility procedures Monitor the rollout of the much improved RTD ADA complaint process/procedures Refund the DUSPA RTD outstanding bonds by end of February 2017 to achieve at least a 40% annual savings each year between 2018 and 2040 Develop expertise in FRA regulated rail services including safety, labor, and equipment related issues Complete the renovation of Civic Center Station Continue to award and administer contracts to support RTD Base System and FasTracks Continue focus on employee engagement, recruitment and retention Continue work with private sector regarding technology and FasTracks Open R and G Lines Continue work on SH119 BRT Initiate District-wide BRT Study RTD 2017 Adopted Budget Page 153
159 This page intentionally left blank. RTD 2017 Adopted Budget Page 154

160 Taxpayers Board of Directors Board of Directors Staff Board Office RTD 2017 Adopted Budget Page 155
161 Board Office General Description The Board Office is a support group whose mission is to manage and coordinate all the activities and functions of the Board of Directors. The department is responsible for producing and coordinating accurate, timely material for an orderly decision-making process. This includes planning and organizing efficient Board and committee meetings, documenting and keeping accurate records of all Board actions and policies, and assisting the Board of Directors in maintaining effective community relations with other officials, agencies, and constituents. RTD 2017 Adopted Budget Page 156

162 RTD 2017 Adopted Budget Page 157
163 Major Changes Between 2016 and 2017 Budgets Salaries and Wages/Fringe Benefits Decrease in Salaries and Wages/Fringe Benefits due to realignment of staff offset by merit increases for salaried staff Materials and Supplies Decrease in Materials and Supplies due to reduction in promotional material associated with new rail corridor openings in 2016 Services Decrease in Services due to completing the management services for the General Manager search Other Expenses Decrease in Other Expenses due to reduction in: o temporary personnel o special projects and public events RTD 2017 Adopted Budget Page 158
164 2016 Accomplishments RTD s Goals Implementation of Positive Train Control for all commuter rail Safe lines New Board member Orientation for 4 new Directors and continue Clean Board Member workshops for Board member development Continued steps to insure State of Good Repair Reliable Successful implementation of BRT on US 36 Continued training of the Board Staff to insure the best possible Courteous support of the RTD Directors and provide stellar customer service to all constituents Continue to work with the ADA community to provide Accessible accessibility through effective meeting management Major reduction in staff overtime and cost savings in revamping Cost-effective the Board Office budget Meets Future Needs Dave Genova selected as General Manager of RTD 2017 Planned Projects RTD s Goals Safe 2017 Strategic Goal #3 is State of Good Repair Clean Fare Task force working group looking at overall fare structure Reliable 2017 Goal is successful Workforce and investment in Human Capital Continued roll-out of FasTracks corridors Accessible RTD will host the Rail-Volution Conference in Denver Cost-effective 2017 Goal of Fiscal Sustainability RTD 2017 Adopted Budget Page 159
165 Non-Departmental General Description Non-departmental expenses include all functions and expenses that are not attributable to a specific department within the District organizational structure. These expenses fall into four general categories: Non-departmental expenditures include programs that benefit the District as a whole and do not fall under the jurisdiction of specific departments, including State and external financial audit fees, employee awards, student intern programs, and costs of ballot issue elections required under Article X, Section 20 of the Colorado Constitution. Unallocated expenses are funds available during the budget year to meet needs that were not anticipated at the time the budget was developed. As needs are identified, funds are transferred from this line item into the appropriate departments. Vacancy savings are identified during the development of the budget to account for anticipated salary and benefit savings from vacant positions. Actual savings are posted to the appropriate departments as they occur. Interest expense represents the interest payments due on all outstanding bonds, certificates of participation (COPs), and commercial paper issued by RTD, and any anticipated interest payments or issuance costs for bonds, COPs, or commercial paper expected to be issued in the current year. RTD 2017 Adopted Budget Page 160


166 RTD 2017 Adopted Budget Page 161
167 Major Changes Between 2016 and 2017 Budgets Salaries and Wages/Fringe Benefits Increase in Salaries Wages/Fringe Benefits due to holding account for general salary increases prior to allocation to departments Materials and Supplies Increase in Materials and Supplies due to reclassification of cost of material salvage from Materials Management to Non-Departmental Services Increase in Services due to increase in other outside services for pass-through grants Other Expenses Increase in Other Expenses due to increase in: o interest expense from financing of FasTracks construction o special projects and public events RTD 2017 Adopted Budget Page 162
168 Part VIII Capital Expenditures RTD 2017 Adopted Budget Page 163
169 RTD Capital Program Assumptions Overview RTD's capital program supports the current and future delivery of transit service to its 2,340 square mile district. To this end, RTD provides revenue vehicles and other equipment needed to operate bus and rail service, rapid transit infrastructure such as rail lines and high-occupancy vehicle lanes, and other passenger infrastructure such as parkn-rides, transfer stations, and bus shelters. A capital project is any activity which results in the addition of a tangible asset with a dollar value of $5,000 or greater and an expected useful life greater than one year, such as property, plant or equipment used by the organization in its operations. The resultant new asset is expected to benefit future periods. It is distinguished from major repairs to an existing capital asset that does not expand the capacity of that asset. RTD has one significant non-routine capital expenditure program in the 2017 Adopted Budget which is FasTracks. The RTD FasTracks program is an integration of several transit modes and other programs into a comprehensive region-wide system. FasTracks required voter approval on a ballot issue. FasTracks utilizes both new capital and capital carryforward funding. Fleet Plan RTD will continue but moderate its fleet replacement program in RTD has scheduled the purchase of ft. transit buses to replace the same number of these buses that will be retired. RTD has funding in place for the purchase of these 15 transit buses. No other purchases or retirements of buses are scheduled for There will be no net change in number to the regular bus fleet in RTD will also neither retire nor replace any of the call-n-ride cut-away vehicles and ADA cut-away vehicles (access-a-ride). There will be no net change in number to the paratransit fleet in RTD has not scheduled the purchase of any light rail vehicles and there will be no net change in number to the LRV fleet in Total fleet purchases will be limited in 2017 due to funding constraints. The table on the next page presents the revenue fleet assumptions used in the preparation of the 2017 Budget. RTD 2017 Adopted Budget Page 164
170 RTD Revenue Fleet Assumptions Jan. 1, 2017 Dec. 31, 2017 Change Regular Bus Fleet Transit Articulated Intercity Mall Shuttle Medium Transit (30-foot) BRT Buses Subtotal - Regular Bus Fleet 1,036 1,036 0 Call-n-Ride (22-foot) Light Rail Vehicles access-a-ride Cutaway Subtotal access-a-ride TOTAL REVENUE VEHICLES 1,593 1, Opening balances represent estimates available at time of budget submission. Actual balance at yearend may vary according to adjusted delivery and retirement schedule and other needed changes. FasTracks In November 2004, the voters of the Regional Transportation District approved the financing of the FasTracks multimodal project. The plan calls for new commuter rail and light rail lines in nine major travel corridors, bus rapid transit, an expanded park-n-ride system, enhanced bus service throughout the District, and development of Denver Union Station in downtown Denver as a multimodal transit hub. As of September 2016, when the Board of Directors approved the latest revision to the Annual Program Evaluation, the total cost of the currently-funded FasTracks projects in year of expenditure (YOE) dollars was projected at $5.6 billion. Through 2015, approximately $4.3 billion of this program budget has been spent. Bus and Light Rail Infrastructure RTD in 2017 will continue to fund transit improvements requested by local governments consisting of bus and/or passenger related transit improvement such as bus pads, passenger waiting areas, passenger shelters and benches. At a cost of $6,000,000 RTD will rehabilitate a section of the popular 16 th Street Mall by repairing existing granite pavers in the transit ways, upgrading the electrical and irrigation infrastructure, and replace pedestrian lighting, trees, and urban furniture. RTD will also begin a 6-year project to replace all of the downtown light rail track and infrastructure from 7 th Street to 30 th and Downing, an alignment that is over 20 years old. This work is programmed at $2,000,000 in each of the six years. Finally, as part of the State of Good Repair program, the existing metal halide light fixtures in the pedestrian areas will be replaced with LED fixtures along the Southwest corridor light rail line. RTD 2017 Adopted Budget Page 165
171 Park-n-Rides In 2017, RTD programmed additional capital funding for the reconstruction of the existing US36 & Sheridan Station park-n-ride surface parking area to provide additional bus bays, correct drainage issues, and bring the parking area up to current design standards. This work is programmed at $1.5 million. On-going improvements for various park-n-rides, such as asphalt seal coat and crack-fill, concrete joint sealing and repairs, and landscaping and irrigation improvements will occur in 2017 but these costs are budgeted in repair and maintenance and not capital. Other Capital Projects In addition to the specific programs described above, RTD's 2017 capital budget includes funding for other programs, as listed below: Twelve new police emergency vehicles for contract police, equipped with emergency lights, siren, and two-way radio Suite of equipment and software for cybersecurity assessment, mitigation and monitoring, designed to identify security and compliance gaps in RTD s IT systems Replacement of core information storage units to store mission-critical data Replacement of Oracle engineered systems that run RTD Oracle applications and databases Rider Alert System implementation in order to communicate up-to-the minute service alerts for riders in a timely manner Mobile ticketing application for the purchase and use of fare and parking products, offered to enhance fare products and available from many third parties Radio equipment for the expansion of armed security, police, and other transit police unit employees that will be providing services to the new rail corridors Install new system configuration and replace dated CCTV recorders and cameras on light rail vehicles, retrofit to be completed over 5 years Add redundancy in CCTV storage capabilities for disaster recovery Expansion of Customer Care Telephone Information Center due to expected increase in incoming customer call volume and a requisite increase in the number of agents to handle the volume Portal protection project phase 2 to include redesign work and addition of electric gate arms at each entry portal of Denver Union Station Complex Continuation of Colfax Avenue Transit Priority project to reduce travel time and increase security and ridership for the Colfax Avenue bus route, one of the busiest bus routes in the country; project includes amenity improvements, transit signal priority and bypass lanes/queue jumps Implement recommendations of Northwest Area Mobility Study for implementation of the Northwest Rail project that include Bus Rapid Transit on the key arterial roadways, and environmental assessment Property Survey Records reorganization and expansion of information critical to the RTD system RTD 2017 Adopted Budget Page 166
172 2016 Capital Accomplishments The difference between 2016 Amended Budget Capital Expenditures and 2016 Projected Capital Expenditures is due primarily to capital carry-forward. Capital carry-forward exists when a project, either in whole or in part, is not completed in a single fiscal year. The funds required to complete the project are carried forward to the next fiscal year. Project FasTracks SOUTHEAST CORRIDOR EXTENSION Description Final Design was taken to roughly 95%. Receipt of Small Starts Construction Grant allowed for Notice to Proceed 2 for Construction. Earthwork is at roughly 95%. Bridge substructure for RidgeGate and I-25 bridges completed. RidgeGate Parking structure at roughly 15% completion Projected Expenditure $30,189,489 I-225 CORRIDOR Complete systems integration testing in $117,498,660 Segment 1, Area A, and G, including verifying that all at-grade crossings are functioning properly. Initiated pre-revenue service and train operation testing in Segment 1 and Area A. Continued work on project close out process. Finished miscellaneous on-call work orders, such as the Metro Center Park-n-Ride. I-225 LIGHT RAIL VEHICLE STORAGE Completed construction of tail tracks for vehicle storage at the north end of the I-225 rail line. Rail Operations Building (ROB) to house $5,481,757 LRT operators, Service and Cleaning, and Facilities Maintenance personnel was completed in December NORTH METRO RAIL LINE Design is nearly complete with only a few $95,468,710 station and systems elements lagging. Construction continued on all major structures with several bridges being completed. Utility, grading and station work progressed and rail and systems work began. SOUTHWEST CORRIDOR Updated corridor cost estimates. $117,730 EXTENSION EAST CORRIDOR Completed all remaining civil work and finalized the installation of systems elements; $90,502,875 completed testing and commissioning; completed pre-revenue service proving and began commuter rail operations. GOLD LINE Completed the majority of all civil and systems work elements; positioned the alignment to begin testing and commissioning; completed the majority of the 3 rd Party Project work associated with the GLP; and began the process to re-evaluate the target for the commencement of revenue service. $36,062,015 RTD 2017 Adopted Budget Page 167
173 Project NORTHWEST RAIL U.S. 36 B.R.T. PHASE 2 COMMUTER RAIL MAINTENANCE FACILITY DUS TO CRMF CORRIDOR FASTRACKS ADMIN PROJECTS Description Completed all remaining civil work and finalized the installation of systems elements; completed testing and commissioning; completed pre-revenue service proving and began commuter rail operations. Installed 14 ticket-vending machines (TVMs) and 12 Programmable Information Display (PID)at BRT stations. Installed security equipment (CCTV and emergency telephones) at stations and connected to RTD network. Completed all remaining civil work and finalized the installation of systems elements; completed testing and commissioning; completed pre-revenue service proving and began commuter rail operations. Completed all remaining civil work and finalized the installation of systems elements; completed testing and commissioning; completed pre-revenue service proving and began commuter rail operations. Provided support for the FasTracks program, including program support consultants, quality assurance, and public involvement. DUS ELECTRIFICATION Completed the installation of systems elements; completed testing and commissioning; completed pre-revenue service proving and began commuter rail operations. DUS SYSTEMS EAGLE Completed the installation of systems elements; completed testing and commissioning; completed pre-revenue service proving and began commuter rail operations. PEORIA INTERFACE COORDINATION Completed activities associated with the common operations of the East and I-225 rail lines at Peoria Station. LRV PURCHASE OF VEHICLES Progress payments on two additional light rail vehicles to be delivered in EAGLE ADDITIONAL VEHICLES The balance of the rolling stock was shipped and received; the majority of the vehicles are commissioned and in service on the A and B lines. CRMF TO PECOS Completed all remaining civil work and finalized the installation of systems elements; completed testing and commissioning; completed pre-revenue service proving and began commuter rail operations. Rail Transit LRV PURCHASE OF 27 VEHICLES HEAVY EQUIPMENT FOR LR MAINTENANCE Milestone payment to Siemens on the purchase of the 27 light rail vehicles was made in Delivery expected in Track lubricator vehicle purchased. An additional rail hauler truck, bucket truck and rail truck are in the purchasing process Projected Expenditure $23,037,228 $1,236,717 $5,428,465 $1,915,544 $4,093,793 $173,949 $101,978 $172,147 $2,753,064 $4,662,586 $1,390,676 $33,229,592 $498,475 RTD 2017 Adopted Budget Page 168
174 Project POWER SWITCHING ON EMERGENCY CROSSOVERS Description In 2016 the Systems Engineering Division prepared construction plans, specifications and a cost estimate for the Walnut Street Crossover. This is one of the crossovers selected for upgrading to power switches under this line item. We expect to put this project out to bid as an RFP in early 2017 and expect to have it completed in Projected Expenditure $431,282 Transfer Stations Contract awarded to Mortenson Construction. CIVIC CENTER STATION REBUILD All permits have been acquired. Construction $1,959,289 is approximately 30% complete at this time. MALL CHARGING UNITS Project completed in $141,700 Park n-ride STAPLETON Capital Support Equipment ADMIN/POOL/SUPERVISOR VEHICLES Completed the remaining site work and utilities installations. Pedestrian access components were also completed to support the April 2016 opening of the University of Colorado A Line. Purchased several vehicles for Street Supervision. SUPPORT /SERVICE VEHICLES Purchased several vehicles for Support/Service. RADIO SYSTEMS/SOFTWARE - CAD/AVL RTD purchased additional equipment for fleet expansion and integrated with new printers. The vendor is working on outstanding issues for system performance. JOBS AUTOMATION Configured and installed Middleware application software on Oracle engineered systems. TRIP PLANNER ENHANCEMENTS RTD released the new Open Trip Planner on December 21, This new application provides the Rider and customer care staff the same suite of powerful tools including real-time information on bus / light rail vehicle location. The overall contract (warranty, documentation, etc.) will be completed in early REAL TIME INFORMATION DELIVERY In 2016, RTD launched Real-Time Passenger Information (RTPI) for regional buses and light rail location information. RTD developed Application Program Interfaces (APIs) for the NextRide web portal application and launched the NextRide beta site. SMT STORED VALUE CARD IMPLEMENTATION The stored value pilot program went live on January 1, As part of this program, this application was moved to a new hosted environment which was completed on time. New iphones with new eforce and SMT programming to replace the aging HSMRs were implemented as part of this program in June. $1,708,350 $104,884 $258,110 $347,938 $282,838 $407,423 $803,603 $1,325,692 RTD 2017 Adopted Budget Page 169
175 Project VIRTUAL SECURITY OPERATIONS CONSOLE (VSOC) Description This funding was utilized to complete phase 1 of the Situator project. Phase 1 including the integration of all security cameras and emergency phones. Other security integrations are simultaneously being integrated Projected Expenditure $239,400 Fleet Modernization & Expansion INTERCITY COACHES 45FT Purchased forty-two (42) Intercity Coaches. $24,825,702 ARTICULATED COACHES Purchased six (6) Articulated Coaches. $4,093,558 CUT AWAY BUSES Purchased two hundred twenty-nine (229) $11,952,963 access-a-ride cutaway buses. CUT AWAY BUSES Purchased four (4) call-n-ride cutaway buses. $263,962 RTD 2017 Adopted Budget Page 170
176 Capital Expenditure Summary Chart by Program 2017 ADOPTED BUDGET PROGRAM CAPITAL ADOPTED BUDGET ADOPTED BUDGET ADOPTED BUDGET 2017 CAPITAL CARRYFORWARD 2017 NEW CAPITAL 2017 TOTAL CAPITAL CAPITAL PROGRAM BY PROJECT LOCAL FEDERAL TOTAL LOCAL FEDERAL TOTAL LOCAL FEDERAL TOTAL FASTRACKS ADA VEHICLES FASTRACKS BURNHAM YARD LEAD & OTHER BUS MAINTENANCE FACILITY CCTV WEST CORRIDOR CENTRAL CORRIDOR CENTRAL CORRIDOR EXTENSION CENTRAL PLATTE VALLEY COLFAX CROSSOVER COMMUTER RAIL MAINTENANCE FACILITY 31,872,701 31,872, , ,642 1,047,851 32,645, ,642 32,920,551 CPV - SWC STATION ENHANCEMENTS CRMF TO PECOS 1,237, ,725 1,677, ,237, ,725 1,677,700 DENVER UNION STATION DENVER UNION STATION-OVERSIGHT 5,570,921 5,570, ,570,921-5,570,921 DOWNTOWN CIRCULATOR 3,347,031 3,347, ,347,031-3,347,031 DUS ELECTRIFICATION 2,127,376 2,127, ,127,376-2,127,376 DUS SYSTEMS-EAGLE 1,100,069 1,100, ,100,069-1,100,069 DUS TO CRMF CORRIDOR 13,327,583 13,327, ,327,583-13,327,583 EAGLE ADDITIONAL VEHICLES 479,173 1,916,693 2,395, ,173 1,916,693 2,395,866 EAST CORRIDOR 59,122,050 65,136, ,258,197 2,176,941 2,398,387 4,575,327 61,298,991 67,534, ,833,524 FAS TRACKS MISC. LIGHT RAIL VEHICLES FASTRACKS ADMIN PROJECTS 9,567,242 9,567, , ,806 9,894,048-9,894,048 FASTRACKS CONTINGENCY 1,000,000 1,000, ,000,000-1,000,000 FASTRACKS EXPANSION BUSES FASTRACKS MISC. IMPROVEMENTS (0) (0) - - (0) - (0) FASTRACKS MISC.LIGHT RAIL VEHICLES GOLD LINE 35,465,166 39,072,804 74,537,970 4,405,817 4,861,783 9,267,600 39,870,983 43,934,587 83,805,570 I-225 CORRIDOR 88,678,343 88,678, ,678,343-88,678,343 I-225 LRT VEHICLE STORAGE TRACKS 3,109,831 3,109, ,109,831-3,109,831 I-225 THIRD PARTY BETTERMENTS 1,614,678 1,614, ,614,678-1,614,678 LIGHT RAIL MAINTENANCE FACILITY LONGMONT STATION 10,023,982 10,023, ,023,982-10,023,982 LRT VEHICLES (2) 5,046,936 5,046, ,046,936-5,046,936 NORTH METRO (0) (0) - - (0) - (0) NORTH METRO COP 152,216, ,216, ,710, ,710, ,926, ,926,258 NORTH METRO ENABLING WORK 867, , , ,924 NORTH METRO NON COP 48,689,006 48,689, ,689,006 48,689,006 NORTH METRO O&M INTERFACE 9,812,918 9,812,918 7,336,455 7,336,455 17,149,373 17,149,373 NORTHWEST ES RAILROAD NORTHWEST RAIL 15,625,613 15,625, ,625,613-15,625,613 NORTHWEST RAIL SEGMENT 2 16,249 16, ,249-16,249 P.P.P. PREPARATION 250, , , ,000 PEORIA INTERFACE COORDINATION 1,757,535 1,757, ,757,535-1,757,535 QUEUE JUMPS STIMULUS SOUTHEAST CORRIDOR ENHANCEMENTS SOUTHEAST CORRIDOR EXTENSION 47,822,255 31,895,285 79,717,540 33,589,412 54,541,100 88,130,512 81,411,667 86,436, ,848,052 SOUTHWEST CORRIDOR ENHANCEMENTS SOUTHWEST CORRIDOR EXTENSION 499, , , ,289 SYSTEM WIDE COMMUNICATIONS U.S. 36 B.R.T. PHASE U.S. 36 B.R.T. PHASE 2 6,985, ,200 7,141, ,985, ,200 7,141,473 U.S. 36 TVMs 26, , , , , ,414 WALNUT STREET CROSSOVER WEST CNPA STIMULUS WEST CORRIDOR WEST FEDERAL PROJECT WEST CNPA STIMULUS FUNDING 253, , , ,466 WEST THIRD PARTY FUNDED PROJECTS WEST CORRIDOR 3RD PARTY BETTERMENTS WEST PARKING GARAGE 1,474,033 1,474, ,474,033-1,474,033 SUBTOTAL - FASTRACKS PROJECTS 558,987, ,723, ,710, ,318,840 62,075, ,394, ,306, ,799, ,105,697 WEST LINE - EQUIPMENT FOR FM 280, , , ,532 PIDS ELECTRONIC SIGNS 30,419 30, ,419-30,419 SUBTOTAL WEST LINE 310, , , ,950 TOTAL FASTRACKS 559,298, ,723, ,021, ,318,840 62,075, ,394, ,617, ,799, ,416,647 - RTD 2017 Adopted Budget Page 171
177 Capital Expenditure Summary Chart by Program (continued) 2017 ADOPTED BUDGET PROGRAM CAPITAL ADOPTED BUDGET ADOPTED BUDGET ADOPTED BUDGET 2017 CAPITAL CARRYFORWARD 2017 NEW CAPITAL 2017 TOTAL CAPITAL CAPITAL PROGRAM BY PROJECT LOCAL FEDERAL TOTAL LOCAL FEDERAL TOTAL LOCAL FEDERAL TOTAL FACILITIES CONSTRUCTION & MAINTENANCE BOULDER BOULDER HOIST REPLACEMENT H.V.A.C., CHILLER, HEATING UPGRADE - DRIVERS PHONE EQUIPMENT RM AC VENTILATOR UPGRADE - MECHANICS BREAK ROOM SUBTOTAL - BOULDER DISTRICT SHOPS BOIL OFF TANK IN RADIATOR SHOP ,368 82,368 82,368-82,368 CNG MONITORING SYSTEM FAC MAINT SPREADER FIRE ALARM UPGRADES - FM STORAGE FIRE PROTECTION - RECORDS STORAGE BLDG FIRE SAFETY UPGRADES - WAREHOUSE SECOND FLOOR MEZZANINE REMODEL 41,163 41, ,163 41,163 SUPPORT VEHICLES CAR WASH REPLACEMENT TRANSMISSION DYNAMOMETER UPGRADE SUBTOTAL - DISTRICT SHOPS 41,163-41,163 82,368-82, , ,531 EAST METRO DIVISION SUPERVISORS OFFICE RELOCATION SUPPLIED AIR UNITS WELLNESS/REHAB CENTER SUBTOTAL - EAST METRO PLATTE CNG MONITORING SYSTEM DRIVERS END REMODEL MOBILE HOIST SUBTOTAL - PLATTE TREASURY SEWAGE LIFT STATION DRAIN LINE RELOCATION SUBTOTAL - TREASURY WELLNESS HEALTH CENTER HVAC UNIT REPLACEMENT SUBTOTAL - WELLNESS HEALTH CENTER OTHER PROJECTS BLAKE COOLING SYSTEM 2,898 2, ,898-2,898 BLAKE ENTRYWAY REMODEL 200, , , ,000 CUSTOMER CARE TELEPHONE CTR 1,452,839 1,452,839 5,401,081-5,401,081 6,853,920-6,853,920 FIRE PROTECTION FOR ZEE & SCC FACILITIES , , , ,800 REDUNDANT COOLING TOWER-POST BLDG SUBTOTAL - OTHER PROJECTS 1,655,737-1,655,737 5,915,881-5,915,881 7,571,618-7,571,618 TOTAL FACILITIES CONSTRUCTION & MAINTENANCE 1,696,900-1,696,900 5,998,249-5,998,249 7,695,149-7,695,149 TRANSFER STATIONS BOULDER CITY OF BOULDER/RTD INTERMODAL FACILITY 476, , , , , ,301 SUBTOTAL - BOULDER 476, , , , , ,301 OTHER AURORA CITY CENTER TRANSIT CENTER CIVIC CENTER STATION REBUILD 7,222,065 20,543,867 27,765, ,222,065 20,543,867 27,765,932 COLFAX & FEDERAL TRANSFER FACILITY DUS SIGNAGE PIDS MALL CHARGING UNITS 381, , , ,433 SOUTHWEST PLAZA BUS TRANSFER STATION 2,263,437 2,263, ,263,437-2,263,437 TREASURY BUILDING EXPANSION 4,009 4, ,009-4,009 US 36TH CORRIDOR REHAB' SUBTOTAL - OTHER 9,870,943 20,543,867 30,414, ,870,943 20,543,867 30,414,810 TOTAL TRANSFER STATIONS 10,347,186 20,660,925 31,008, ,347,186 20,660,925 31,008,111 RAPID TRANSIT DEVELOPMENT SOUTHEAST CORRIDOR BASE PROJECT CONSTRUCTION-OTHER SUBTOTAL - BASE PROJECT DISTRICT-WIDE I.T.S EAST CORRIDOR U.S. 36 CORRIDOR TOTAL RAPID TRANSIT DEVELOPMENT RTD 2017 Adopted Budget Page 172
178 Capital Expenditure Summary Chart by Program (continued) 2017 ADOPTED BUDGET PROGRAM CAPITAL ADOPTED BUDGET ADOPTED BUDGET ADOPTED BUDGET 2017 CAPITAL CARRYFORWARD 2017 NEW CAPITAL 2017 TOTAL CAPITAL CAPITAL PROGRAM BY PROJECT LOCAL FEDERAL TOTAL LOCAL FEDERAL TOTAL LOCAL FEDERAL TOTAL PARK - N - RIDES 104th AVE. & COLORADO BLVD. 1,152,758 1,320,000 2,472, ,152,758 1,320,000 2,472,758 40TH & AIRPORT (FORMERLY GREEN VALLEY RANCH) BROADWAY & EUCLID COLD SPRING DRIVER RELEIF KIOSK COLORADO_ DRIVER RELIEF STATION HWY 287 & NIWOT RD 60, , , , , ,739 I-25 & BROADWAY PNR STRUCTURE LONGMONT/KEN PRATT LONGMONT/KIMBARK BUS DRIVERS RELIEF MONTBELLO-RELEIF KIOSK PARKER INSTALL DRIVER'S KIOSK PINE JUNCTION SH 83 (Parker Rd.) & PINERY PARKWAY SMOKY HILL PICADILLY STAPLETON 617, , , ,258 TABLE MESA 1,346,400 1,346, ,346,400-1,346,400 TANTRA DRIVE 474, , , ,215 THORNTON PNR EXPANSION 253,972 1,015,888 1,269, ,972 1,015,888 1,269,860 LAFAYETTE PNR RECONSTRUCTION 1,031,100 1,031, ,031,100-1,031,100 WESTMINSTER CENTER PNR SOUTHSIDE 103, , , ,110 US-36 & SHERIDAN STATION/PnR (Westminster Center) - - 1,544,400 1,544,400 1,544,400-1,544,400 MOUNTAIN VIEW - STORM & DRAINAGE US-85 & 72 AVE. DRIVER RELIEF STATION WADSWORTH & HAMPDEN DRIVER RELEIF KIOSK WESTMINSTER CNTRE. EAST DRIVER STATION WESTMINSTER CNTRE. WEST DRIVER STATION TOTAL PARK-N-RIDES 5,039,552 2,615,888 7,655,439 1,544,400-1,544,400 6,583,952 2,615,888 9,199,839 CAPITAL SUPPORT PROJECTS BUS SHELTERS BUS SHELTERS BUS SHELTERS BUS SHELTERS BUS SHELTERS BUS SHELTESR BUS SHELTERS BUS SHELTERS BUS SHELTERS BUS SHELTERS BUS SHELTERS SUBTOTAL - BUS SHELTERS STREET IMPROVEMENTS IGA STREET IMPROV. CITY OF BOULDER STREET IMPROVEMENTS STREET IMPROVEMENTS-2008 STREET IMPROVEMENTS STREET IMPROVEMENTS STREET IMPROVEMENTS STREET IMPROVEMENTS STREET IMPROVEMENTS STREET IMPROVEMENTS SUBTOTAL - STREET IMPROVEMENTS OTHER 16TH STREET MALL PAVER REPAIR 2,030,654 7,080,982 9,111,636 1,377,570 4,799, ,176,570 3,408,224 11,879,982 15,288,206 BUS PASSENGER SHELTER RETRO PROGRAM SH119 BUS RAPID TRANSIT - ENVIRONMENTAL 544,400 1,000,000 1,544, ,400 1,000,000 1,544,400 COLFAX AVE./TRANSIT PRIORITY PROJ. FTA LOP 425, , , ,000 COLFAX AVE./TRANSIT PRIORITY PROJ. FTA LOP 494,937 1,979,749 2,474, ,657 1,818,629 2,273, ,594 3,798,377 4,747,971 LOCAL GOVERNMENT REQUESTS 1,575,739 1,575, , ,400 1,833,139-1,833,139 PROPERTY SURVEY RECORDS SYSTEM-WIDE , , , ,880 SUBTOTAL - OTHER 4,526,329 9,060,731 13,587,060 2,942,908 7,617,629 10,560,536 7,469,237 16,678,359 24,147,596 TOTAL CAPITAL SUPPORT PROJECTS 4,526,329 9,060,731 13,587,060 2,942,908 7,617,629 10,560,536 7,469,237 16,678,359 24,147,596 LRT CONSTRUCTION DOWNTOWN TRACK & SWITCHES REPLACEMENT - - 2,059,200-2,059,200 2,059,200-2,059,200 DRIVERS RELIEF STATION COLO BLVD MAINTENANCE OF WAY FACILITY-RIO COURT TOTAL LRT CONSTRUCTION ,059,200-2,059,200 2,059,200-2,059,200 RTD 2017 Adopted Budget Page 173
179 Capital Expenditure Summary Chart by Program (continued) 2017 ADOPTED BUDGET PROGRAM CAPITAL ADOPTED BUDGET ADOPTED BUDGET ADOPTED BUDGET 2017 CAPITAL CARRYFORWARD 2017 NEW CAPITAL 2017 TOTAL CAPITAL CAPITAL PROGRAM BY PROJECT LOCAL FEDERAL TOTAL LOCAL FEDERAL TOTAL LOCAL FEDERAL TOTAL RAIL TRANSIT ADA HIGHBLOCK REPLACEMENT CENTRAL DENVER 31,350 31, ,350-31,350 CROSSOVERS (2 DOUBLE) WEST 92,651 92, ,651-92,651 DOWNTOWN DENVER LOOP EVENT RECORDERS ON SD-100S HEAVY EQUIPMENT FOR LR MAINTENANCE 858, , , ,525 INTRUSION DETECTION SYSTEM-SOUTHWEST-ARRA LRT SAFETY SIGNALS SIGNAGE LRV PURCHASE OF 27 VEHICLES ,318,739 3,256,000 35,574,739 32,318,739 3,256,000 35,574,739 LRV TRAINING SIMULATOR MAINLINE EMERGENCY CROSS-OVER SWITCH HEAT MAINT MGMT(MAXIMUS/OPTRAM) MARIPOSA FACILITY RECONFIGURATION POWER DISTRIBUTION SYSTEM UPGRADE POWER SWITCHING ON EMERGENCY CROSSOVERS 4,048,462 4,048, ,048,462-4,048,462 RAILWAY WORKER PROTECTION EARLY WARNING SYSTEM 1,546,650 1,546, ,546,650-1,546,650 RE-RAILING EQUIPMENT ELATI SHERIDAN LRT CROSSOVER WRL 9,759 9,759-9,759-9,759 SOUTHEAST CORRIDOR SOGR 307, , , ,500 SUBSTATION PLC UPGRADE 2,562,500 2,562, ,562,500-2,562,500 TRACTION POWER SUBSTATION PLC UPGRADE TRAINING (RAIL) FACILITY ELATI YARD ELECTRIC SWITCH HEATERS MARIPOSA 712, , , ,140 TOTAL RAILTRANSIT 10,170,096-10,170,096 32,318,739 3,256,000 35,574,739 42,488,835 3,256,000 45,744,835 FLEET MODERNIZATION & EXPANSION A.D.A. VEHICLES - CUT AWAY ADA VANS WEST CORRIDOR ARTICULATED BUSES 4,613,573 4,613, ,613,573-4,613,573 CALL & RIDE CUT AWAY BUSES 575, , , ,701 CALL & RIDE CUT AWAY BUSES 196, , , ,114 CALL & RIDE VANS REPLACEMENT 65,086 65,086 65,086-65,086 CUTAWAY CALL-N-RIDE BUSES FOR WEST LINE 17,847 17, ,847-17,847 HOP BUSES 411, , , , , ,140 INTERCITY COACHES- 45 FT 98,554 98, ,554-98,554 INTERCITY BUSES INTERCITY BUSES 2012 PROCUREMENT INTERCITY BUSES FOR US36 CORRIDOR 26,218 26, ,218-26,218 INTERCITY BUSES/6/ARRA MALL SHUTTLES EXPANSION 2011 PURCHASE 3,900,000 3,900,000 7,800, ,900,000 3,900,000 7,800,000 MALL SHUTTLES EXPANSION 2012 PURCHASE 19,364,999 19,364, ,364,999-19,364,999 TRANSIT BUSES 40 FT 11,731,023 7,229,134 18,960,157 2,172,942 4,756,592 6,929,534 13,903,965 11,985,726 25,889,691 BUS REPLACEMENT ,254 36, ,254-36,254 TRANSIT CUTAWAY VEHICLES TOTAL FLEET MODERNIZATION & EXPANSION 41,036,589 11,129,134 52,165,723 2,378,862 4,756,592 7,135,454 43,415,452 15,885,726 59,301,178 CAPITAL SUPPORT EQUIPMENT OPERATIONS A.D.A. SCHEDULING AND DISPATCH SYSTEM ADA CALL CENTER UPGRADES 385, , , ,921 ADA VEHICLES/CUTAWAYS 14,649,460 14,649, ,649,460-14,649,460 ADMIN/POOL VEHICLES ADMIN/POOL/SUPERVISOR VEHICLES 169, ,639 92,664-92, , ,303 ADMIN/POOL/SUPERVISOR VEHICLES AUTOMATED PASSENGER COUNTER CAPITAL TOOLS FOR LIGHT RAIL MAINTENANCE 6,402 6, ,402-6,402 DISTRICT SHOPS RADIO SITE UPGRADE FIXED ROUTE BUS ANNUNCIATORS IN PLANT VEHICLES & EQUIP (BUS) 113, , , ,112 IN PLANT VEHICLES & EQUIP IN PLANT VEHICLES & EQUIP (RAIL) 10,708 10, ,708-10,708 IN-PLANT VEHICLES & EQUIP. 120, , , ,134 MAINTENANCE WEST LINE RADIO KITS 39,480 39, ,480-39,480 SUPPORT /SERVICE VEHICLES 1,889,135 1,889, ,889,135-1,889,135 SUPPORT/SERVICE VEHICLES SUPPORT/SERVICE VEHICLES SUPPORT/SERVICE VEHICLES-WEST 28,152 28, ,152-28,152 IN PLANT VEHICLES & EQUIPMENT 95,958 95, ,958-95,958 SUPPORT/SERVICE VEHICLES 541, , , ,883 TRANSMITTER UPGRADES UREA (DIESEL EXHAUST FLUID) STORAGE & DISPENSING TRANSIT CUTAWAY VANS ELECTRIC CAR & CHARGING STATION 24,739 24, ,739-24,739 VEHICLES FOR ASSET MANAGEMENT SUBTOTAL - OPERATIONS 18,075,673-18,075,673 92,664-92,664 18,168,337-18,168,337 MATERIALS MANAGEMENT EQUIPMENT REPLACE - CENTRAL WAREHOUSE SUBTOTAL - MATERIALS MANAGEMENT RTD 2017 Adopted Budget Page 174
180 Capital Expenditure Summary Chart by Program (continued) 2017 ADOPTED BUDGET PROGRAM CAPITAL ADOPTED BUDGET ADOPTED BUDGET ADOPTED BUDGET 2017 CAPITAL CARRYFORWARD 2017 NEW CAPITAL 2017 TOTAL CAPITAL CAPITAL PROGRAM BY PROJECT LOCAL FEDERAL TOTAL LOCAL FEDERAL TOTAL LOCAL FEDERAL TOTAL TREASURY FAREBOX REPLACEMENT COP FAREBOX REPLACEMENT 146, , , ,455 LRT NEW TVM UPGRADES, SE/SW & CENTRAL TVM HARDWARE AND SOFTWARE UPDATE TO WINDOWS 7 61,866 61, ,866-61,866 MONEY COUNTING EQUIPMENT TREASURY CAPITAL EQUIPMENT 16,167 16, ,167-16,167 SMART CARD SYSTEM ARRA 1,862,600 1,862, ,862,600-1,862,600 SUBTOTAL - TREASURY 2,087,088-2,087, ,087,088-2,087,088 INFORMATION TECHNOLOGY 511 INTEGRATION MY STOP 29,999 29, ,999-29,999 APPLICATION LOAD BALANCER APPLICATION PATCH ANALYSIS TOOL 201, , , ,720 AUTOMATED PASSENGER COUNTERS 843, , , ,780 AUTOMATED SOFTWARE/INTEGRATION TESTING TOOL 153, , , ,750 AUTOMATED STATION LOGGING AVAYA PHONE SYSTEM UPGRADE & SUPPORT 345, , , ,000 BI INITIATIVES 417, , , ,175 CALL-N-RIDE TABLET REPLACEMENT 230, , , ,991 CENTRAL COMPUTER SOFTWARE CIVIL RIGHTS COMPLAINT MANAGEMENT SOFTWARE 25,725 25, ,725-25,725 CLOUD COMPUTING CAPACITY PLANNING 59,400 59, ,400-59,400 COMPUTER HARDWARE SAN-ARRA DATA CENTER POWER EXPANSION 4,885 4, ,885-4,885 DISASTER RECOVERY 1,147,300 1,147, ,147,300-1,147,300 DRCOG FOCUS TRAVEL MODEL (Hardware/Software) 13,384 13, ,384-13,384 DUS JUMBOTRON PIDS, CLOCKS, SIGNS, AND WIFI EEO SOFTWARE 2,327 2, ,327-2,327 ELDORA RADIO REPEATER SITE 51,250 51, ,250-51,250 ENTERPRISE CONTENT MANAGEMENT ENTERPRISE CONTENT MANAGEMENT 824, , , ,880 ENTERPRISE CRM STUDY/REPLACEMENT 12,488 12, ,488-12,488 ENTERPRISE FIREWALL REPLACEMENT 127, , , ,875 ENTERPRISE ROUTER REPLACEMENT ENTERPRISE WIFI UPDATE 524, , , ,000 EXADATA STORAGE EXPANSION 46,562 46, ,562-46,562 FASTRACKS- IT STAFFING COST FORMAT PLOTTERS (2) CC FULL AUTOMATION OF RUN ASSIGNMENT GARAGE CONCENTRATORS , , , ,768 GPS RE-RADIATOR INFORMATION STORAGE REPLACEMENT/EXPANSION INFORMATION STORAgE UNIT REPLACEMNET 800, , , ,000 HANDHELD SMART READERS/MOBILE STATION DEVICES INTEGRATION OF NEW PLANNING/SCHEDULING SOFTWARE 512, , , ,500 INVENTORY PLANNING & FORECASTING 1,676,000 1,676, ,676,000-1,676,000 CYBERSECURITY 119, , , , , ,986 IVR DISASTER RECOVERY SERVERS 263, , , ,018 JOBS AUTOMATION LASERFICHE UPGRADE TO LEGACY SERVER REPLACEMENTS & UPGRADE MARKETING/PI WEB CONTENT MANAGEMENT SYSTEM 68,968 68, ,968-68,968 MOBILE DATA TERMINALS FOR ACCESS-A-RIDE 3,814,980 3,814, ,814,980-3,814,980 MOBILE DEVICE APPLICATION DEVELOPMENT MOBILE LAPTOP PROJECT 28,875 28, ,875-28,875 MOBILE PORTABLE VOICE RADIOS 717, , , ,500 MOBILE TICKETING 100, ,000 1,235,520 1,235,520 1,335,520-1,335,520 MYSTOP & WHERE'S MY RIDE ENHANCEMENTS 102, , , ,500 MYSTOP & WHERE'S MY RIDE IVR 410, , , ,610 NETWORK SYSTEM MONITORING AND ALERTING 205, , , ,000 NETWORKING LRT PLATFORM SERVICES OPERATIONAL CAMERAS AT CIVIC CENTER STN OPERATOR SELF-SERVICE AND AUTOMATED ATTENDANCE 205, , , ,000 RTD 2017 Adopted Budget Page 175
181 Capital Expenditure Summary Chart by Program (continued) 2017 ADOPTED BUDGET PROGRAM CAPITAL ADOPTED BUDGET ADOPTED BUDGET ADOPTED BUDGET 2017 CAPITAL CARRYFORWARD 2017 NEW CAPITAL 2017 TOTAL CAPITAL CAPITAL PROGRAM BY PROJECT LOCAL FEDERAL TOTAL LOCAL FEDERAL TOTAL LOCAL FEDERAL TOTAL OPTICAL FIBER MANAGEMENT SOFTWARE ORACLE BI HR AND PROCUREMENT ANALYTICS ORACLE BI SOFTWARE UPGRADES FOR ASSET MGMT 205, , , ,000 ORACLE DATA UPGRADES-ARRA ORACLE ENGINEERED SYSTEMS END OF LIFE REPLACEMENT , , , ,680 ORACLE ERP PROCUREMENT AND CONTRACT MODULES 504, , , ,326 ORACLE EXADATA DATABASE SERVER ORACLE RIDERSHIP MODEL CONVERSION ORACLE UPGRADE TO REVISION PARATRANSIT DATA SYSTEM UPGRADE 205, , , ,800 PASSENGER INFORMATION SYSTEM PASSWORD ID MANAGEMENT 82,000 82, ,000-82,000 PROOF OF CONCEPT ENVIRONMENT 102, , , ,500 PUBLIC INFORMATION DISPLAYS RADIO SYSTEMS/SOFTWARE - CAD/AVL RADIO SYSTEMS/SOFTWARE - CAD/AVL 5,616,580 5,616, ,616,580-5,616,580 RADIO UPGRADE FOR F.C.C. COMPLIANCE REAL TIME INFORMATION DELIVERY REAL TIME PASSENGER INFORMATION 1,365,942 1,365, ,365,942-1,365,942 RIDER ALERT SYSTEM , , , ,360 RTPI DELIVERY RTPI FOUNDATION SOFTWARE SCADA FIELD HARDWARE UPGRADE/REPLACEMENT SCHEDULING AND RUN CUTTING SOFTWARE 1,588,811 1,588, ,588,811-1,588,811 SMART MEDIA TECHNOLOGY 152, , , ,226 SMT DATA RETENTION STORAGE 51,250 51, ,250-51,250 SMT STORED VALUE CARD IMPLEMENTATION 2,226,029 2,226, ,226,029-2,226,029 STORAGE AREA NETWORK 437, , , ,281 THERMAL PRINTERS FOR BUS 271, , , ,773 TIME AND ATTENDANCE 263, , , ,355 TIS/RTPI + 2 FTE TRAPEZE OPS MODULE TRIP PLANNER ENHANCEMENTS 403, , , ,853 UNION TIMECLOCK DS 396, , , ,514 WEB & ENTERPRISE CONTENT MANAGEMENT 2 FTE 205, , , ,000 SUBTOTAL - INFORMATION TECHNOLOGY 28,164,889-28,164,889 3,274,128-3,274,128 31,439,017-31,439,017 SECURITY CCS - REBUILD/EXPANSION CCTV 482, , , ,269 C.C.T.V. INSTALLATION-LIGHT RAIL STATIONS CCTV NINE MILE PARKING STRUCTURE 257, , , ,775 CCTV RETROFIT ON BUSES ISILON CCTV VIDEO STORAGE REDUNDANCY , , , ,920 DUS LRT CCTV RADIO EQUIPMENT FOR ARMED SECURITY OFFICERS 262, ,931 25,740-25, , ,671 SECURITY COMMAND CENTER EQUIPMENT SECURITY SYSTEM REPLACEMENTS DISTRICT-WIDE 100, , , ,000 VIRTUAL SECURITY OPERATIONS CONSOLE (VSOC) WC LRT CCTV SUBTOTAL - SECURITY 1,102,975-1,102, , ,660 1,334,635-1,334,635 OTHER CAPITAL PROJECTS - ART-N-TRANSIT BUS BOX ENTRY TRAFFIC CONTROL DUS DUS GUARD SHACK 69,469 69,469-69,469-69,469 DUS SIGNAGE 254, , , ,284 DUS STREET SWEEPER ELECTRONIC CLOCK DUS PROJECTS FOR CLOSE OUT 28,952 28, ,952-28,952 RIO COURT/STATE OF GOOD REPAIR SECURITY & OTHER 4B PROJECTS SUBTOTAL -OTHER CAPITAL PROJECTS 352, , , ,705 TOTAL CAPITAL SUPPORT EQUIPMENT 49,783,329-49,783,329 3,598,452-3,598,452 53,381,781-53,381,781 UNALLOCATED CAPITAL , , , ,440 TOTAL CAPITAL 681,898, ,190, ,088, ,314,090 77,706, ,020, ,212, ,896,394 1,165,108,777 FASTRACKS 559,298, ,723, ,021, ,318,840 62,075, ,394, ,617, ,799, ,416,647 BASE SYSTEM 122,599,982 43,466, ,066,659 50,995,250 15,630,221 66,625, ,595,232 59,096, ,692,130 - RTD 2017 Adopted Budget Page 176
182 2017 Capital Expenditures Listed below is a brief description of each new capital project included in the 2017 Adopted Budget, along with the new capital funds budgeted for the project in Description FasTracks Description 2017 New Capital 2017 New Capital NORTH METRO RAIL LINE SOUTHEAST CORRIDOR EXTENSION GOLD LINE EAST CORRIDOR COMMUTER RAIL MAINTENANCE FACILITY FASTRACKS ADMIN PROJECTS All major right-of-way parcel acquisitions will be completed $131,046,655 along with a majority of the necessary utility relocations. Station work, rail installation, overhead catenary system (OCS), and systems work (signals/communications) will move into full swing. Most bridges will be completed, with ongoing work on the Skyway Structure. Remaining 5% of design to be completed. All three bridges $88,130,512 on the project are scheduled to be completed as well as the RidgeGate Parking Structure. Final grading and drainage to be completed. Station work to begin as well as track work and early components of systems work. Complete remaining civil and systems work; complete testing $9,267,600 and commissioning; reconcile final commuter rail vehicle payments; initiate pre-revenue service proving. Begin Operations. Management oversight allocation; close-out. Complete open punch list items; reconcile final commuter rail $4,575,327 vehicle payments; Management oversight allocation; closeout. Management oversight allocation; close-out. $1,047,851 Ongoing support of the FasTracks program, including program support consultants, quality assurance, and public involvement. This project will continue through the completion of the FasTracks program. $326,806 TOTAL FASTRACKS $234,394,752 Base System Facilities Construction & Maintenance CUSTOMER CARE CENTER 711 BUILDING FIRE PROTECTION FOR ZEE & SCC FACILITIES BOIL OFF TANK IN RADIATOR SHOP TOTAL FACILITIES CONSTRUCTION & MAINTENANCE Request is to build new Customer Care offices and telephone information call center in the 711 building. Request is to provide fire protection systems for the Zee and Security Command Center facilities. Request is to install a boil off tank/gas fired waste water evaporator in the radiator shop at District Shops. $5,401,081 $514,800 $82,368 $5,998,249 RTD 2017 Adopted Budget Page 177
183 Project Bus Infrastructure LOCAL GOVERNMENT CAPITAL REQUESTS 16TH STREET MALL PAVER REPAIR TOTAL BUS INFRASTRUCTURE Description Project is an annual program for transit and/or passenger related improvements, upgrades, and/or supplemental funding of requested transit improvements by local governments. Reconstruction plans were completed and issued for bid, Negotiations were unsuccessful. Looking for an alternate paving system. If an alternative system is selected, the project will be re-bid and constructed in New Capital $257,400 $6,176,570 $6,433,970 Park-n Rides US-36 & SHERIDAN STATION Project is to reconstruct the existing south side surface $1,544,400 (Westminster Center) parking area to provide additional bus bays, correct drainage issues, and bring this parking area up to current design criteria that is consistent with RTD's standards. Operating and maintenance costs will increase slightly due to larger bus boarding areas. TOTAL PARK-N RIDES $1,544,400 Capital Support Projects MOBILE TICKETING ORACLE ENGINEERED SYSTEMS END OF LIFE REPLACEMENT CYBERSECURITY RIDER ALERT SYSTEM GARAGE CONCENTRATORS TOTAL CAPITAL SUPPORT PROJECTS This project is a GM initiative to enhance fare products by offering a mobile application for the purchase and use of fare and parking products. The vendor manages the data and payments and sends a single payment for all transactions during a given time period to RTD. Vendors also provide data and analytical tools regarding the transactions on the application. The goal of this project is to replace the three different types of Engineered systems that run RTD Oracle applications and databases. These machines will be out of support in five years and would need to be updated to keep current with technology changes. The request is to purchase and continually fund a suite of equipment, software and cybersecurity specialist consulting services designed to identify security and compliance gaps in our IT systems, remediate those gaps, and monitor for and respond to suspicious activity in a timely manner. Communications is looking to implement a Rider Alert System in order to communicate up-to-the-minute service alerts for our riders in timely manner. The system will include a webbased interface that will offer riders the ability to sign up to receive alerts based on route, branch, direction, stop, and timeframe. The goal of this project is to replace aging garage concentrators and increase memory capacity on others. $1,235,520 $823,680 $514,800 $360,360 $339,768 $3,274,128 RTD 2017 Adopted Budget Page 178
184 Project Light Rail Construction DOWNTOWN TRACK & SWITCHES REPLACEMENT TOTAL LIGHT RAIL CONSTRUCTION Description The overall plan is to replace all track, turnout switches, street crossings, concrete flat work, etc. This project will include all of the downtown track and infrastructure from 7th street to 30th and Downing. The project will be divided into segments that can be completely refurbished within the span of one construction season New Capital $2,059,200 $2,059,200 Fleet Modernization & Expansion LRV PURCHASE OF 27 LRVS + MAJOR SPARES TRANSIT BUSES - 40 FOOT HOP BUSES - LOCAL MATCH TOTAL FLEET MODERNIZATION & EXPANSION In 2013, Rail Operations and the Planning Department determined that eighteen (18) Light Rail Vehicles (LRVs) would need to be purchased in order to meet the demands of the existing LRT system and accommodate the opening of the I-225 line in This analysis led to the current procurement of twelve (12) vehicles that was included in the capital budget plan. In order to bring the spare ratio to a desired 20% minimum and meet the anticipated growth in ridership, we need to purchase seventeen (17) additional vehicles by 2020 (2 will be purchased by FasTracks). This will increase the fleet from 184 to 201. The order for these vehicles was placed in Purchase a total TBD number of heavy duty 40-foot transit buses over the term of the SBP consisting of TBD replacement and TBD expansion vehicles. RTD local matching funds for HOP bus replacement in Boulder. Grant funds are obtained by the City of Boulder. $35,574,739 $6,929,534 $205,920 $42,710,193 Capital Support Equipment ISILON CCTV VIDEO STORAGE REDUNDANCY RADIO EQUIPMENT FOR ARMED SECURITY OFFICERS VEHICLES (12) FOR RTD POLICE & VIDEO INVESTIGATION UNIT TOTAL CAPITAL SUPPORT EQUIPMENT This project is to add redundant capabilities for CCTV storage capacity to allow for disaster recovery. These redundancies will be located in a separate location to protect the District from a catastrophic loss of video evidence if a flood, fire or other event occurred. This project is the purchase of radios for the expansion of the armed security, police, and other Transit Police unit employees. This project will acquire contract police vehicles to be used as patrol vehicles for our contracted police officers. These vehicles will be police SUVs similar to our standard RTD fleet purchases. Two police SUV vehicles will be purchased each year at cost of $45,000 each. $205,920 $25,740 $92,664 $324,324 RTD 2017 Adopted Budget Page 179
185 Project Systems Planning COLFAX AVENUE TRANSIT PRIORITY PROJECT SH 119 BUS RAPID TRANSIT- ENVIRONMENTAL PROPERTY SURVEY RECORDS SYSTEM-WIDE Description Request is to proceed with the Colfax Avenue Transit Priority Project. RTD has received a Federal Ladders of Opportunity grant to fund a capital project to reduce travel time and increase security and ridership for 15L bus route. The project includes: stop amenity improvements (repair and replace existing amenities, lighting, shelters, security cameras), bus bulbs at a few locations, transit signal priority (TSP), and bypass lanes/queue jumps. The project includes East Colfax from Broadway east to Potomac (near I-225). It is important to note that from Yosemite to Potomac, the project will only include improved stop amenities. RTD's remaining local match is $1.5M. This project was approved in the SBP for $2.5M with the expectation of an additional $1M from a DRCOG grant. This request is to accelerate the project in order to implement the recommendations of the Northwest Area Mobility Study (NAMS) given that no funding has been identified for implementation of the Northwest Rail. RTD has been awarded $1 million in DRCOG Transportation Improvement Program (TIP) funds for this project. The recommendations from the Northwest Area Mobility Study (NAMS) include the implementation of BRT on the key arterial roadways in the northwest area including SH 119. This Environmental Assessment will perform NEPA level analysis and Preliminary Engineering. Currently whenever RTD acquires or disposes off any property right (fee simple, easement, or license agreement), it utilizes an external survey firm (Jacobs) to establish the location of that property right on the ground, and prepare Right-of-Way maps, legal descriptions and exhibits. The contract with Jacobs will expire at the end of This project is to sort through Jacobs property survey records, bring this information within RTD, and organize it on an engineering GIS platform. The property survey information is critical to the system and needs to be brought within RTD. This project will strengthen the foundation of many Districtwide efforts by obtaining and organizing RTD property rights, utility, and other information in an easily accessible format New Capital $2,273,286 $1,544,400 $308,880 TOTAL SYSTEMS PLANNING $4,126,566 Unallocated Capital TOTAL UNALLOCATED CAPITAL This project provides an annual contingency in the amount of $150,000 for unanticipated District capital expenditures. $154,440 $154,440 TOTAL BASE SYSTEM $66,625,470 RTD 2017 Adopted Budget Page 180
186 Impact of Capital Program on Future Year Budgets Strategic Budget Plan Capital projects included in the current year budget may impact future years' budgets in two ways. First, completed projects may require ongoing maintenance, the cost of which must be included in future years. Second, projects that are not completed in the current year may require additional funds in future years. These issues are addressed through RTD's Base System six-year operating and capital plan, the Strategic Budget Plan (SBP). In September 2016, RTD adopted its SBP for the years This document is a financially constrained plan based on projected revenues from identifiable sources. The SBP presents aggregate projected service levels for the next six years. It also details all capital projects expected to be undertaken in the same time frame and projects the costs of ongoing operation of these capital improvements after their completion. The first year of the six-year SBP plan also provided the starting point for development of the 2017 capital budget. The two tables on the next page present a summary view of the Strategic Budget Plan. The first table presents the SBP operating program at a program summary level, and the second table presents a similar level of detail for the SBP capital program. Both tables are integrated into a single SBP. Capital expenditures identified in the SBP are generally routine capital expenditures to maintain RTD assets at the levels required to support its current operations. Some of the expenditures identified in the SBP are one-time specific purpose or event-specific items that must be captured as part of the six-year plan. The SBP plan also includes funding in the operating program to support additional operating costs resulting from planned capital expenditures. The third table that follows presents the extent to which non-recurring capital expenditures will impact RTD s current and future operating budget by project. In the SBP, no service reductions are assumed in rail, fixed-route bus and calln-ride services for 2017 from the 2016 run-board; in some cases, bus service is being expanded to realign and integrate with the FasTracks system. Other service additions are made in support of grant-funded service. The FasTracks service allocation offsets costs of bus and rail service added in support of the FasTracks program expansion. This is separate from the cost allocation to FasTracks of both direct and indirect costs of operating the FasTracks system. Operating expenses, the FasTracks service allocation, and other cost adjustments are presented in future year dollars based on appropriate inflationary factors. Capital expenditures and discretionary capital amounts are also presented in year of expenditure dollars. Interest payments and principal payments on debt are not presented in year of expenditure dollars. RTD 2017 Adopted Budget Page 181
187 Strategic Budget Plan - Operating Program Program Total Cost Interest Payments 1, 2 $ 28,275,422 $ 26,237,718 $ 23,537,985 $ 20,640,421 $ 17,558,288 $ 14,471, ,721,273 Bus Operations Current RTD 136,108, ,251, ,644, ,497, ,376, ,338, ,217,040 Bus Operations Private Carrier after Contract 97,276, ,221, ,558, ,304, ,064, ,882, ,308,724 Bus Operations - call-n-ride 7,373,594 7,603,421 7,826,802 8,036,234 8,247,172 8,462,584 47,549,808 Private Contract Administration Costs 371, , , , , ,088 2,398,066 Service Increases RTD-Operated 1,361,730 1,365,720 1,400, ,127,940 Service Increases Private Contractor 1,027,270 1,030,280 1,056, ,114,060 FasTracks Service Allocation - Bus (15,842,523) (16,338,394) (16,820,376) (17,274,526) (17,734,029) (18,203,981) (102,213,828) Cost Sharing Agreements - Bus Service 3,023,935 3,118,584 3,210,583 3,297,268 3,384,976 3,474,678 19,510,024 Van Pool Program 976,061 1,006,612 1,036,307 1,064,287 1,092,597 1,121,551 6,297,413 Section 5311 Local Match 859, , , , , ,864 5,546,772 Rail Operations 66,975,227 69,388,393 73,502,063 75,433,158 77,439,680 79,491, ,230,350 ADA Operating Costs 44,360,188 45,709,177 46,810,051 48,064,944 49,327,656 50,617, ,889,287 FasTracks Service Allocation - ADA (2,010,540) (2,073,470) (2,134,638) (2,192,273) (2,250,587) (2,310,228) (12,971,737) Facilities Maintenance - Base 20,600,031 21,227,859 21,733,455 22,321,058 22,914,798 23,522, ,319,242 Facilities Maintenance - Additional Costs 197, , , , , ,529 1,347,986 Capital Programs - Base 42,814,710 44,119,785 45,172,108 46,393,407 47,627,472 48,889, ,017,083 Capital Programs - Additional Costs 3,831, , , , , ,053 5,362,698 Direct Costs - Other Departments 623, , , , , ,348 4,017,646 Indirect Costs - Other Departments 89,115,285 93,001,523 93,894,918 95,053,550 95,765, ,770, ,601,531 FasTracks - Cost Allocation (36,850,000) (38,003,374) (42,709,667) (43,862,828) (45,029,579) (46,222,863) (252,678,311) Grand Total 490,468, ,331, ,256, ,382, ,460, ,814,673 $3,082,713,066 1 Interest payments are not presented in year of expenditure dollars. 2 Interest payments on bonds and COPs issued for purposes other than FasTracks Strategic Budget Plan - Capital Program Program Total Cost Long Term Debt Service 1,2 $48,605,000 $57,925,000 $61,825,000 $64,740,000 $62,255,000 $56,705,000 $352,055,000 Fleet Modernization and Expansion 3 $0 Buses and ADA Vehicles 6,929,534 25,586,370 30,276,400 31,723,901 24,796,710 48,326,325 $167,639,242 Other 205, , , , , ,614 $1,328,568 Light Rail Vehicles 35,574,739 27,795, $63,370,196 Passenger Infrastructure 3 $0 Bus Infrastructure 6,433, , , ,638 0 $7,922,348 Rail Infrastructure 2,059,200 2,229,836 2,295,616 2,245,331 2,305,057 2,366,141 $13,501,179 park-n-rides 3 1,544, $1,544,400 Capital Support Equipment 3 $0 Vehicles and Bus Maintenance Equipment 92,664 95,564 98, , , ,476 $597,856 Information Systems, Computer Equip. for Ops. 3,274,128 1,189,246 1,530,411 1,706, ,413 $8,090,649 Security Equipment 231, , , , , ,535 $3,149,035 Bus Maintenance Facilities 3 $0 District Shops 82, $82,368 Light Rail Maintenance Facilities 3 $0 District-wide $0 Facilities Construction and Maintenance 3 5,915,473 1,061, $6,977,299 Systems Planning 3 4,126,566 5,455,774 1,776, ,984,219 $82,342,928 Discretionary Capital 3 154, , , , , ,461 $996,426 Grand Total 115,230, ,745,993 99,250, ,499,056 90,987, ,884,185 $709,597,494 1 Principal payments are set at the time the bonds are issued and do not change with inflation. 2 Long-term debt service costs include principal payments on bonds and COPs and are not presented in year of expenditure dollars. 3 Capital expenditures and discretionary capital amounts are presented in year of expenditure dollars. RTD 2017 Adopted Budget Page 182
188 Strategic Budget Plan Capital Projects - Operating & Maintenance Costs Projected Capital Costs Operating & Maintenance Costs SBP Capital Project 2017 Cost Driver Total US 36 & Sheridan Park and Ride $ 1,544,400 On-going maintenance of reconstructed - 15,000 15,000 15,000 15,000 15,000 75,000 park-n-ride plus increase for larger bus boarding area Property Survey Records-System Wide 308,880 On-going maintenance of GIS property - 100, , , , , ,000 survey records system that RTD is bringing in-house Mobile Ticketing 1,235,520 Vendor costs for mobile appliction vendor - 100, , , , ,000 2,500,000 that maintains softw are and administers payments Cybersecurity Assessment, Mitigation, Monitoring 514,800 Specialist consulting services to support 1,300,000 1,100,000 1,000,000 1,000, , ,000 6,000,000 Services & Equipment and maintain steady-state risk identification, mitigation, and correction of security vulnerabilities Oracle Engineered Systems End of Life Replacement 823,680 On-going maintenance costs for 80,000 20,000 50, , , , ,000 replacement of 7 servers for Oracle ERP system Isilon CCTV Video Storage Redundancy 205,920 On-going maintenance costs for redundancy in CCTV storage capacity for disaster recovery - 8,400 8,400 8,400 8,400 8,400 42,000 Total $ 4,633,200 1,380,000 1,343,400 1,573,400 1,823,400 1,723,400 1,723,400 9,567,000 RTD 2017 Adopted Budget Page 183
189 FasTracks In November 2004, the voters of the Regional Transportation District approved the financing of the FasTracks multimodal project. The plan calls for new commuter rail and light rail lines in nine major travel corridors, bus rapid transit, an expanded park-n-ride system, enhanced bus service throughout the District, and development of Denver Union Station in downtown Denver as a multimodal transit hub. As of September 2016, when the Board of Directors approved the latest revision to the FasTracks Financial Plan, the total cost of the currently-funded FasTracks projects in year of expenditure (YOE) dollars was projected at $5.6 billion. FasTracks Detail RTD has developed a comprehensive plan, known as FasTracks, which addresses future mobility needs in the metropolitan Denver region. The projects in this $5.6 billion plan through 2040 include: West Rail Line: Completed 2013 Denver Union Station: Completed 2014 I-225 Rail Line: Projected completion moved to 2017 Eagle Project: Projected completion moved to 2017 Northwest Rail Line - Longmont Station: Complete 2018 Central Corridor Extension - Planning Study: Completed 2014 US 36 BRT: o Vehicles and BRT Service: Completed 2016 o $135M for Managed Lanes to Table Mesa: o Queue Jumps and Diverging Diamond Interchange: Completed 2016 o Table Mesa Pedestrian Bridge: Completed 2013 o Station Amenities: Completed 2016 o Broomfield and Westminster Improvements: Complete 2018 o Broomfield park-n-ride: North Metro to 124 th Avenue: Complete 2018 Southeast Rail Extension: Complete 2019 All FasTracks projects remain within the FasTracks Plan and will be constructed over time. However, without identification of additional funding sources, current projections indicate RTD 2017 Adopted Budget Page 184
190 that not all projects can be completed between now and the 2040 planning horizon. Only projects that RTD anticipated being able to fund by 2040 were included in the financial plan adopted by the RTD Board of Directors in September The ability to implement the FasTracks plan depends on a variety of financial assumptions and projections which have been developed using the best available estimates of costs, reasonably anticipated federal funding based on current federal law and regulations, and revenues from other sources including RTD sales tax and fare collections. Over the anticipated remaining time-period, specific cost items, federal and other contributions, and RTD revenues may vary from this financial plan. The FasTracks program is currently financed in part through a 0.4% regional sales and use tax approved by voters in November of In 2012, the RTD Board of Directors took formal action not to pursue a new sales and use tax election in 2012 or in the near future. Therefore, this financial plan assumes no additional sales and use tax will be available to fund the FasTracks program prior to In an effort to reduce costs and risks and improve delivery of FasTracks, RTD is delivering a portion of its commuter rail projects (the Eagle Project) through a long-term Public- Private Partnership (PPP) agreement in which a private sector party is designing, building, financing, operating and maintaining projects on behalf of RTD. In 2010, RTD reached a major milestone in the FasTracks program with the award of the contract for the Eagle Project to Denver Transit Partners (DTP). In 2011, RTD received a Full Funding Grant Agreement (FFGA) from the Federal Transit Administration (FTA) in the amount of $1.03 billion for this project. The Eagle Project includes the East and Gold Line corridors, a commuter rail maintenance facility, and a short electrified segment of the Northwest Rail corridor. RTD has contracted with DTP to design, build, and finance the initial construction of the projects, and to operate and maintain all project assets through the year Through this contract, RTD will realize savings over its internally estimated construction costs, and establishes the basis for its operating and maintenance costs for the first 28 years of corridor operations. The East and Northwest Rail corridors opened for revenue service in 2016, and the Gold Line is projected to open in In order to accomplish the Plan within the twelve-year schedule, a voter-approved Taxpayer Bill of Rights (TABOR), authorization of $3.477 billion in principal and $7.129 billion in total debt service was requested and received in November This initiative was passed by 58% of the voting population. Additional information on TABOR restrictions is included in Part X. Since inception, the primary funding source for the District has been a sales and use tax imposed on transactions within the District boundaries. Beginning with 1974, the District imposed a tax equal to 0.5%. In 1983, the tax was increased to 0.6% or six-tenths of one percent and the tax base was adjusted. As of January 1, 2005, the sales tax was increased by 0.4%, to one percent. Average annual sales and use tax growth from was 6.3%. However, due to recent economic conditions, sales and use tax growth has declined significantly below this historic average, including negative growth in 2008 and Current projections included in the financial plan show total sales and use tax forecast of $11.5 billion for the FasTracks RTD 2017 Adopted Budget Page 185
 Since 2011, RTD has")

191 program over the period The following chart shows actual and projected revenues from sales and use tax through 2040: Actual and Projected Sales and Use Tax Revenues (Dollars in Millions) Since 2011, RTD has engaged the Business Research Division (BRD) of the Leeds School of Business at the University of Colorado to perform its sales and use tax forecasts. The BRD forecasts project an average annual growth rate of 3.79% in sales and use tax collections for the financial plan period The average annual growth rate for the period , or the future years of the financial plan, is projected at 3.94%. Forecasted rates of increase vary by year, and the actual and forecasted annual growth rates by year for the period are shown in Figure 2 below. RTD 2017 Adopted Budget Page 186


192 Projected Sales and Use Tax Growth For the FasTracks corridors, RTD prepares travel forecasts for the horizon years 2020 and These forecasts are provided at the system, corridor, and station level and assume the build-out of the FasTracks rapid transit system as described above. RTD combined the construction schedule with the forecasts, so that passenger fare revenues are assumed to start at the time the corridors are assumed to open to revenue service per the construction schedule. The following table shows the average farebox revenues by corridor in year-of-expenditure dollars for 2020, the first year of full service operation for the currently funded FasTracks projects, and 2040, which is the horizon year of the financial plan. RTD 2017 Adopted Budget Page 187
193 FasTracks Projected Farebox Revenues by Corridor (millions of year-of-expenditure dollars) Corridor West Corridor $5.9 $12.5 Northwest Rail Corridor Gold Line I-225 Corridor East Corridor North Metro Corridor Southeast Corridor Extension US 36 BRT Free MetroRide Total Annual Farebox Revenues $46.2 $122.3 The District has developed operating and maintenance expense projections based on past experience and expectations of future ridership, schedules, renewal and replacement, labor, and general maintenance, all adjusted for inflation. Those projections are shown in the table below: FasTracks Projected O&M Expenses by Corridor (millions of year-of-expenditure dollars) Corridor West Corridor $17.0 $28.2 I-225 Corridor North Metro Corridor Southeast Corridor Extension US 36 BRT Denver Union Station RTD Oversight - Commuter Rail Free MetroRide Total Annual O&M Cost $70.3 $148.9 Financing a major project over a relatively short construction period requires significant expense to service debt and lease purchase financing. Historically, RTD has utilized two primary financing techniques: Sales Tax Revenue Bonds and Certificates of Participation (COPs). Sales tax revenue bonds are the backbone of RTD s financing program. This is because senior lien sales tax bonds provide the strongest security, and thus lowest long-term borrowing costs to RTD. As of September 2016, RTD had issued $1.454 billion in sales tax revenue bonds to fund capital investments in the FasTracks program. The adopted financial plan calls for the District to issue an additional approximately $195 million in bonds in late 2016 to finance the program. RTD 2017 Adopted Budget Page 188
194 RTD has used COP financing, which is a form of lease purchase transaction, for financing buses and rail vehicles. COPs are not secured by sales tax revenues, but are secured by the underlying leased asset and backed by RTD s commitment to appropriate payments in future annual budgets. RTD issued the Series 2005A COPs totaling $81.0 million in par amount to finance initial FasTracks expenditures related to the West corridor. In November 2010, RTD issued $312.9 million in COPs to fund capital investments on both the base and FasTracks systems. FasTracks investments funded from the Series 2010 COPs issue included the purchase of light rail vehicles and the construction of station parking facilities. In July 2014, RTD closed its first COP financing for a rail corridor. In this transaction, RTD issued $440.9 million of COPs to fund the North Metro Rail Line, using a portion of the rail line itself as the leased asset. COP lease payments are not covered by TABOR restrictions. In July 2010, RTD issued a $168 million, 30-year, subordinate lien bond to the Denver Union Station Project Authority (DUSPA) to finance a portion of the RTD contribution to the Denver Union Station project. Under this bond agreement, RTD will provide DUSPA with a 30-year cash flow of $12 million per year, structured as a fixed-rate bond with an interest rate of 5.85% on the RTD funds. This bond is amortized to comply with all required bond covenants and TABOR requirements as well as RTD s minimum net 1.20x debt service coverage policy. The following table shows debt service assumptions for the debt financing in the adopted financial plan for FasTracks: FasTracks Plan Debt Service Assumptions (millions of year-of-expenditure dollars) Type of Debt Principal Interest Less: Capitalized Interest Total Sales Tax Bonds $1,617.5 $2, $44.5 $3,629.6 Certificates of Participation $754.9 $ $4.9 $1,539.5 TIFIA Loan $280.0 $283.4 $0.0 $563.4 Denver Union Station Bond $168.0 $192.2 $0.0 $360.2 Total Debt Service $2,820.3 $3, $49.4 $6,092.8 A PPP is a contracting arrangement where the public entity partners with a private contractor or consortium on the development of a public project. In return for the private sector participation, the public agency pays annually appropriated availability payments to the private partner thereby spreading out large upfront costs of a project over time and preserving cash in the early years. The Eagle Project includes the East and Gold Line corridors, a commuter rail maintenance facility, and a short electrified segment of the Northwest Rail corridor. RTD has contracted with DTP to design, build, and finance the initial construction of the projects, and to operate and maintain all project assets through the year Through this contract, RTD realized savings over its internally estimated construction costs, and established the basis for its operating and maintenance costs for the first 28 years of corridor operations. In 2010, RTD awarded the contract for the Eagle Project to DTP, and began construction of the RTD 2017 Adopted Budget Page 189
195 project. In 2011, RTD received an FFGA from the FTA in the amount of $1.03 billion for this project. The East and Northwest Rail corridors opened for revenue service in 2016, and the Gold Line is projected to open in As part of the financial plan in the concession agreement, DTP provided debt and equity to cover $440.9 million of the initial capital cost of the Eagle project. In August, 2010, RTD acted as the conduit issuer for the issuance of $397.8 million in tax-exempt Private Activity Bonds for DTP to cover the debt portion of its financial commitment to the project. Under the concession agreement, RTD started making annual availability payments (service payments) to DTP when the project opened for revenue service. These payments cover operations, maintenance, and capital repayment, and are segmented into two pieces. The capital portion of the service payment is structured as a fixed annual debt subject to TABOR, secured on a subordinate basis to existing FasTracks revenue bonds. The operating portion of the service payment includes all costs to operate and maintain the line. The operating portion of the service payment is assumed to adjust according to a formula that includes inflation-based increases and performance-related reductions. The operating portion of the service payment is subject to annual appropriation and is not covered by TABOR restrictions. Under the concession agreement, DTP is responsible for delivering and operating the project according to the District s policy goals and standards and paying all project and finance costs from these service payments, while the District owns the project. The concession agreement includes various protections for RTD to ensure adequate control and remedies. Performance standards, periodic reviews, corrective measures, penalty assessments, cure periods, payment reductions, sharing of certain upside benefits and various other measures are provided in the terms of the contract to protect RTD. Ultimately, if DTP does not adequately perform under the contract, all or parts of the contract may be terminated. The table below shows the projected availability payments for the years 2020, which is the first year that all the currently-funded FasTracks projects will be operating, and 2040, which is the horizon year of the Regional Transportation Plan. These payments are based on the DTP contract with escalation rates for indexed payments as projected in the adopted FasTracks financial plan. FasTracks Availability Payments by Corridor (millions of year-of-expenditure dollars) Component Operating Costs - Federal FFGA Corridors $79.0 $148.1 Operating Costs - Other Eagle Corridors Capital Repayment Total Availability Payment $129.3 $242.7 The following chart shows the overall impact of the FasTracks capital program (projects funded by 2040) on the future operating and maintenance budgets of RTD, assuming no additional sales and use tax increase: RTD 2017 Adopted Budget Page 190


196 Projected FasTracks Cash Flow (Dollars in Thousands) The following table shows the additional annual revenue service hours by corridor for 2020, the first year of full service operation for the currently funded FasTracks projects, and RTD 2017 Adopted Budget Page 191
REGIONAL TRANSPORTATION DISTRICT
 REGIONAL TRANSPORTATION DISTRICT OPERATING DATA FOR THE FISCAL YEAR ENDING DECEMBER 31, 2016 PUBLISHED IN ACCORDANCE WITH THE SECURITIES AND EXCHANGE COMMISSION RULE 15c2-12 Table of Contents General Information...
ADOPTED BUDGET. Regional Transportation District 1660 Blake Street, Denver, Colorado rtd-denver.com
 ADOPTED BUDGET 201 8 Regional Transportation District 1660 Blake Street, Denver, Colorado 303.299.6000 rtd-denver.com 2018-Budget+CAFR-Covers.indd 1 2/21/18 10:06 AM The Government Finance Officers Association
REGIONAL TRANSPORTATION DISTRICT
 REGIONAL TRANSPORTATION DISTRICT OPERATING DATA FOR THE FISCAL YEAR ENDING DECEMBER 31, 2017 PUBLISHED IN ACCORDANCE WITH THE SECURITIES AND EXCHANGE COMMISSION RULE 15c2-12 Table of Contents General Information...
COMPREHENSIVE ANNUAL FINANCIAL REPORT Fiscal year ended December 31, 2016 and 2015
 Regional Transportation District 1600 Blake Street, Denver, Colorado 303.299.6000 rtd-denver.com COMPREHENSIVE ANNUAL FINANCIAL REPORT Fiscal year ended December 31, 2016 and 2015 REGIONAL TRANSPORTATION
Strategic Budget Plan, 2017 Annual Program Evaluation, & Financial Plan
 Regional Transportation District 1600 Blake Street Denver, CO 80202-1399 303-299-2307 Board of Directors Chair Larry Hoy, District J First Vice Chair - Tina Francone, District N Second Vice Chair Barbara
BOARD OF DIRECTORS REPORT
 BOARD OF DIRECTORS REPORT To: David A. Genova, General Manager Date: October 9, 2018 From: Heather McKillop, Chief Financial Officer GM Date: October 9, 2018 Board Meeting Date: October 16, 2018 Subject:
JP Morgan Public Finance Transportation Utility Conference
 JP Morgan Public Finance Transportation Utility Conference April 18-19, 2018 Presented by: Brenden Morgan Sr. Manager of Debt & Investments Table of Contents I. Overview of the Region and RTD II. Updates
REGIONAL TRANSPORTATION DISTRICT, COLORADO
 REGIONAL TRANSPORTATION DISTRICT, COLORADO Series 2004 Lease RTD Active Fleet of the District Fiscal Year Ended December 31, 2013 Fixed Route Bus Fleet Number RTD Owned Fixed Route Buses 40' Transit Coaches
REGIONAL TRANSPORTATION DISTRICT, COLORADO AS OF DECEMBER 31, 2015
 AS OF DECEMBER 31, RTD Active Fleet of the District Fixed Route Bus Fleet: Number RTD Owned- Fixed Route Buses 40' Transit Coaches 620 Articulated Buses 110 Intercity Coaches 175 Mall Shuttles 37 30' Transit
BOARD OF DIRECTORS REPORT
 BOARD OF DIRECTORS REPORT To: David Genova, General Manager Date: From: Heather McKillop, Chief Financial Officer GM Date: Board Meeting: October 16, 2018 Subject: ACTION DISCUSSION INFO X RECOMMENDED
A G E N D A. FasTracks Monitoring Committee. Tuesday, February 3, 2015 Rooms R, T, & D 5:30 PM Conference Dial-in # Conference ID: 15120
 Regional Transportation District 1600 Blake Street Denver, CO 80202-1399 303-299-2303 Board of Directors Chair Chuck Sisk, District 0 First Vice Chair Tom Tobiassen, District F Second Vice Chair Natalie
A G E N D A. Operations and Customer Service Committee/ Financial Administration and Audit Committee
 Regional Transportation District 1600 Blake Street Denver, CO 80202-1399 303-299-2306 Board of Directors Chair Larry Hoy, District J First Vice Chair - Tina Francone, District N Second Vice Chair Barbara
Regional Transportation District FasTracks Financial Plan. April 22,
 Regional Transportation District FasTracks Financial Plan April 22, 2004 2-1 Executive Summary The Regional Transportation District (the District or RTD ), has developed a comprehensive $4.7 billion Plan,
May 31, 2016 Financial Report
 2016 May 31, 2016 Financial Report Capital Metropolitan Transportation Authority 7/13/2016 Table of Contents SUMMARY REPORTS Budgetary Performance - Revenue 2 - Sales Tax Revenue 6 - Operating Expenses
SAN FRANCISCO MUNICIPAL TRANSPORTATION AGENCY
 THIS PRINT COVERS CALENDAR ITEM NO. : 11 DIVISION: Communications BRIEF DESCRIPTION: SAN FRANCISCO MUNICIPAL TRANSPORTATION AGENCY Presentation and discussion regarding the Fiscal Year (FY) 2013 SFMTA
INVESTING STRATEGICALLY
 11 INVESTING STRATEGICALLY Federal transportation legislation (Fixing America s Surface Transportation Act FAST Act) requires that the 2040 RTP be based on a financial plan that demonstrates how the program
Overview of the 2018 Budget Amendment
 It is recommended by the Financial Administration and Audit Committee that the Board of Directors adopt Resolution No., Series of 2018 to amend and appropriate funds for the proposed, to increase the appropriation
QUALITY TRANSPORTATION SUMMARY
 QUALITY TRANSPORTATION SUMMARY Quality Transportation Overview... 126 Department of Transportation... 127 Traffic Field Operations... 129 Winston-Salem Transit Authority... 131 Quality Transportation Non-Departmental...
VALLEY METRO RAIL FY18 Budget EXECUTIVE SUMMARY
 VALLEY METRO RAIL FY18 Budget EXECUTIVE SUMMARY FY18 ADOPTED ANNUAL OPERATING AND CAPITAL BUDGET Valley Metro Rail, Inc. (VMR) is a public non-profit corporation whose members are the cities of Chandler,
PINELLAS SUNCOAST TRANSIT AUTHORITY KEY BUDGET ASSUMPTIONS FOR FISCAL YEAR 2016
 PINELLAS SUNCOAST TRANSIT AUTHORITY KEY BUDGET ASSUMPTIONS FOR FISCAL YEAR 2016 PSTA Budget Forecasting Summary Item Assumption Amount Source 3 Yr. Avg. FY2016 FY2017 FY2018 FY2019 FY2020 Revenues FY15
VALLEY METRO RPTA FY18 Budget EXECUTIVE SUMMARY
 VALLEY METRO RPTA FY18 Budget EXECUTIVE SUMMARY FY18 ADOPTED ANNUAL OPERATING AND CAPITAL BUDGET Valley Metro Regional Public Transportation Authority (RPTA) provides public transportation services for
TEX Rail Fort Worth, Texas Project Development (Rating Assigned November 2012)
") TEX Rail Fort Worth, Texas Project Development (Rating Assigned November 2012) Summary Description Proposed Project: Commuter Rail 37.6 Miles, 14 Stations (12 new, two existing) Total Capital Cost ($YOE):
TEX Rail Fort Worth, Texas Project Development (Rating Assigned November 2012) Summary Description Proposed Project: Commuter Rail 37.6 Miles, 14 Stations (12 new, two existing) Total Capital Cost ($YOE):
8. FINANCIAL ANALYSIS
 8. FINANCIAL ANALYSIS This chapter presents the financial analysis conducted for the Locally Preferred Alternative (LPA) selected by the Metropolitan Transit Authority of Harris County (METRO) for the.
FY17 FY16 Valley Metro RPTA Sources of Funds FY17 vs FY16
 FY17 ADOPTED ANNUAL OPERATING AND CAPITAL BUDGET Valley Metro Regional Public Transportation Authority (RPTA) provides public transportation services for Maricopa County located in the metro Phoenix, Arizona.
2016 Budget. Lakewood, Washington
 2016 Budget Lakewood, Washington Mission Statement Pierce Transit improves people s quality of life by providing safe, reliable, innovative and useful transportation services that are locally based and
Denton County Transportation Authority Operating and Capital Budget As Adopted
 Denton County Transportation Authority Fiscal Year October 1, 2005 through September 30, 2006 2006 Operating and Capital Budget As Adopted August 25, 2005 John O. Hedrick Executive Director Transmittal
Total Operating Activities for FY17 are $56.9 million, an increase of $5.1M or 9.8% from FY16.
 FY17 ADOPTED ANNUAL OPERATING AND CAPITAL BUDGET Valley Metro Rail, Inc. (VMR) is a public non-profit corporation whose members are the cities of Chandler, Glendale, Mesa, Phoenix, and Tempe. VMR plans,
QUALITY TRANSPORTATION SUMMARY
 SUMMARY Transportation systems influence virtually every aspect of community life. They are the means for moving people, goods, and services throughout the community, and they play a significant role in
TSCC Budget Review TriMet
 TSCC Budget Review 2017-18 TriMet 1. Introduction to the District: The Tri-County Metropolitan Transportation District (TriMet) boundary covers about 575 square miles of the urban portions of Multnomah,
Financial Plan
 Financial Plan 2018-2019 Budget for Fiscal Year July 1, 2018 June 30, 2019 AT A GLANCE CHERRY CREEK SCHOOL DISTRICT NO. 5 4700 South Yosemite Street Greenwood Village, CO 80111 Arapahoe County, Colorado
Greater Portland Transit District 114 Valley Street Portland ME 04102
 Greater Portland Transit District 114 Valley Street Portland ME 04102 November 1, 2017 [SUBMITTED BY E-MAIL] Nathan Poore Town Manager Town of Falmouth 271 Falmouth Road Falmouth, ME 04105 Re: Preliminary
METROPOLITAN TRANSIT AUTHORITY NASHVILLE, TENNESSEE AUDITED FINANCIAL STATEMENTS AND OTHER FINANCIAL INFORMATION JUNE 30, 2017 AND 2016
 NASHVILLE, TENNESSEE AUDITED FINANCIAL STATEMENTS AND OTHER FINANCIAL INFORMATION JUNE 30, 2017 AND 2016 Table of Contents Page INTRODUCTION... 1-2 INDEPENDENT AUDITOR S REPORT... 3-5 MANAGEMENT S DISCUSSION
CHICAGO TRANSIT AUTHORITY. FINANCIAL STATEMENTS AND SUPPLEMENTARY INFORMATION December 31, 2011 and 2010 (With Independent Auditors Report Thereon)
") FINANCIAL STATEMENTS AND SUPPLEMENTARY INFORMATION (With Independent Auditors Report Thereon) Chicago, Illinois FINANCIAL STATEMENTS CONTENTS Independent Auditors Report... 1 Management s Discussion and
FINANCIAL STATEMENTS AND SUPPLEMENTARY INFORMATION (With Independent Auditors Report Thereon) Chicago, Illinois FINANCIAL STATEMENTS CONTENTS Independent Auditors Report... 1 Management s Discussion and
Review of FasTracks Status and Future Strategic Direction
 Review of FasTracks Status and Future Strategic Direction Regional Transportation District August 21, 2008 1 Overview RTD has experienced a dramatic increase in ridership over the past year, showing that
FORT WORTH TRANSPORTATION AUTHORITY
 FINANCIAL REPORT SEPTEMBER 30, 2010 C O N T E N T S INDEPENDENT AUDITOR'S REPORT... 1 MANAGEMENT'S DISCUSSION AND ANALYSIS... 3 Page BASIC FINANCIAL STATEMENTS Statements of Net Assets... 8 Statements
CHICAGO TRANSIT AUTHORITY. FINANCIAL STATEMENTS AND SUPPLEMENTARY INFORMATION December 31, 2010 and 2009 (With Independent Auditors Report Thereon)
") FINANCIAL STATEMENTS AND SUPPLEMENTARY INFORMATION (With Independent Auditors Report Thereon) Chicago, Illinois FINANCIAL STATEMENTS CONTENTS Independent Auditors Report... 1 Management s Discussion and
FINANCIAL STATEMENTS AND SUPPLEMENTARY INFORMATION (With Independent Auditors Report Thereon) Chicago, Illinois FINANCIAL STATEMENTS CONTENTS Independent Auditors Report... 1 Management s Discussion and
10-Year Capital Highway Investment Plan DRAFT
 This document is made available electronically by the Minnesota Legislative Reference Library as part of an ongoing digital archiving project. http://www.leg.state.mn.us/lrl/lrl.asp 10-Year Capital Highway
RTD Pass Program Portfolio: The Current State. An Overview of RTD Pass Programs June 6, 2017
 RTD Pass Program Portfolio: The Current State An Overview of RTD Pass Programs June 6, 2017 Outline 1. The Budget 2. Pass Programs By The Numbers 3. Equity The Budget How fare revenue and pass programs
RTD Pass Program Portfolio: The Current State. An Overview of RTD Pass Programs June 6, 2017
 RTD Pass Program Portfolio: The Current State An Overview of RTD Pass Programs June 6, 2017 Outline 1. The Budget 2. Pass Programs By The Numbers 3. Equity The Budget How fare revenue and pass programs
April 30, 2016 Financial Report
 2016 April 30, 2016 Financial Report Capital Metropolitan Transportation Authority 6/15/2016 Table of Contents SUMMARY REPORT Budgetary Performance - Revenue 2 - Sales Tax Revenue 6 - Operating Expenses
State Taxes Only See Separate Analysis for Property Taxes and Local Aids
 Senate Omnibus Tax Bill April 18, 2008 State Taxes Only See Separate Analysis for Property Taxes and Local Aids DOR Administrative Costs/Savings Yes X No Department of Revenue Analysis of S.F. 2869 (Bakk),
METRO. Metro Funding. Associated Master Plan: Comprehensive Master Transportation Plan (MTP) for Arlington. Neighborhood(s):
 for Arlington. Neighborhood(s):") METRO METRO METRO 2017 2026 CIP Metro Funding Project Description The Washington Metropolitan Area Transit Authority (WMATA/Metro) is a unique federal-state-local partnership formed to provide mass transit
METRO METRO METRO 2017 2026 CIP Metro Funding Project Description The Washington Metropolitan Area Transit Authority (WMATA/Metro) is a unique federal-state-local partnership formed to provide mass transit
Our Mission. To inspire every student to think, to learn, to achieve, to care
 At a Glance Our Mission To inspire every student to think, to learn, to achieve, to care MESSAGE FROM OUR SUPERINTENDENT High Performance in Cherry Creek Schools Harry Bull, Jr., Ed.D. The Cherry Creek
ST. CLOUD METROPOLITAN TRANSIT COMMISSION St. Cloud, Minnesota AUDITED FINANCIAL STATEMENTS. For the Year Ended September 30, 2015
 ST. CLOUD METROPOLITAN TRANSIT COMMISSION St. Cloud, Minnesota AUDITED FINANCIAL STATEMENTS For the Year Ended TABLE OF CONTENTS BOARD OF COMMISSIONERS, ADMINISTRATION AND OTHER DATA... 1 INDEPENDENT AUDITOR
Federal Transit Funding Crisis: A Message to Congress Presented by Alex Clifford, CEO Santa Cruz Metropolitan Transit District (METRO) 2017
 2017") Federal Transit Funding Crisis: A Message to Congress Presented by Alex Clifford, CEO Santa Cruz Metropolitan Transit District (METRO) 2017 HOW CAN CONGRESS HELP? Santa Cruz Metropolitan Transit District
Federal Transit Funding Crisis: A Message to Congress Presented by Alex Clifford, CEO Santa Cruz Metropolitan Transit District (METRO) 2017 HOW CAN CONGRESS HELP? Santa Cruz Metropolitan Transit District
IBO. Running on Empty: The MTA s 2005 Budget and Financial Plan. The Road to Adopting New York City s Budget. Revised and updated...
 IBO New York City Independent Budget Office Fiscal Brief November 2004 Running on Empty: The MTA s 2005 Budget and Financial Plan Revised and updated... The Road to Adopting New York City s Budget...at
Financial Report - FY 2017 Year to Date May 31, 2017
 Financial Report - FY 2017 Year to Date July 19, 2017 1 Major Highlights Revenue Sales tax remittances received through YTD April 2017 are 4.2% higher than YTD April 2016 Plaza Saltillo lease income budgeted
Letter of Transmittal Financial 1
 Letter of Transmittal Financial 1 June 5, 2018 Citizens of the City and County of Denver, Honorable Mayor, Honorable Auditor, Honorable Clerk and Recorder, Honorable Members of City Council, and Audit
August 31, 2016 Financial Report
 August 31, 2016 Financial Report Capital Metropolitan Transportation Authority 10/14/2016 Table of Contents SUMMARY REPORTS Budgetary Performance - Revenue 2 - Sales Tax Revenue 6 - Operating Expenses
CHICAGO TRANSIT AUTHORITY CHICAGO, ILLINOIS
 CHICAGO, ILLINOIS FINANCIAL STATEMENTS AND SUPPLEMENTARY INFORMATION Years Ended (With Independent Auditor s Report Thereon) Chicago, Illinois FINANCIAL STATEMENTS Years Ended TABLE OF CONTENTS Independent
Transit Subsidy. Mission Statement. Mandates
 Mission Statement The Potomac and Rappahannock Transportation Commission (PRTC) is a multi-jurisdictional agency representing Prince William, Stafford, and Spotsylvania Counties and the Cities of Manassas,
Financial Report Fiscal Year 2018
 Financial Report Fiscal Year 2018 Year to Date September 30, 2018 1 Major Highlights Revenue Sales tax remittances received in FY2018 are 6.5% higher than FY2017 Additional $20 million in operating grants
TABLE OF CONTENTS. Page. Page
 TABLE OF CONTENTS Page Overview Board of Directors... Overview-1 TriMet Officials... Overview-1 Budget Message... Overview-2 2016-2017 TriMet Organization Chart... Overview-9 Financial Summary General
OHIO STATEWIDE TRANSIT NEEDS STUDY
 OHIO STATEWIDE TRANSIT NEEDS STUDY SUMMARY OF FINDINGS The Ohio Statewide Transit Needs Study was tasked with quantifying Ohio s transit needs, as well as recommending programmatic and policy initiatives
INVESTMENT STRATEGIES
 3 INVESTMENT STRATEGIES 70 INVESTMENT STRATEGIES 71 A key role of Mobilizing Tomorrow is to outline a strategy for how the region will invest in transportation infrastructure over the next 35 years. This
III. Major Assumptions Projections
 III. Major Assumptions 2004-2008 Projections Utilization (Revenue, Ridership, Vehicle Traffic) UTILIZATION Baseline Before Gap-Closing Actions 2004 Ridership and Revenue In 2004, ridership on the various
Federal Assistance 13% Charges for Services 5% Appropriated Fund Balance.5% Other 3% Administration 6% Building Maintenance 3% Other 2%
 TRANSIT FUND The Transit Fund is used to account for the operations of the Town s public transit system. Federal Assistance 13% Transit Revenues State Assistance 12% Charges for Services 5% Appropriated
Washington Metropolitan Area Transit Authority Metro Budget Overview
 Washington Metropolitan Area Transit Authority Metro Budget Overview February 2011 Metro 10,877 Employees (10,974 budgeted) 1,491 Buses 588 Escalators and 237 Elevators 106 Miles of Track 92 Traction Power
Chapter 9 Financial Considerations. 9.1 Introduction
 9.1 Introduction Chapter 9 This chapter presents anticipated costs, revenues, and funding for the NEPA BART Extension Alternative. A summary of VTA s financial plan for the BART Extension Alternative is
Chapter 3: Regional Transportation Finance
 Chapter 3: Regional Transportation Finance This chapter examines the sources of funding for transportation investments in the coming years. It describes recent legislative actions that have changed the
University Link LRT Extension
 (November 2007) The Central Puget Sound Regional Transit Authority, commonly known as Sound Transit, is proposing to implement an extension of the Central Link light rail transit (LRT) Initial Segment
$82,895,000 REGIONAL TRANSPORTATION DISTRICT
 NEW ISSUE BOOK-ENTRY ONLY RATINGS: S&P: "AA+" Moody's: "Aa2" Fitch: "AA" See "RATINGS" In the opinion of Butler Snow LLP, Bond Counsel, assuming continuous compliance with certain covenants described herein,
Board Chair Ron Daily and Members Omnitrans Board of Directors FISCAL YEAR ANNUAL BUDGET EXECUTIVE SUMMARY
 DATE: May 2, 2018 ITEM # F4 TO: Board Chair Ron Daily and Members Omnitrans Board of Directors THROUGH: P. Scott Graham, CEO/General Manager FROM: SUBJECT: Maurice Mansion, Treasury Manager FISCAL YEAR
Central Puget Sound Regional Transit Authority
 Central Puget Sound Regional Transit Authority Single Audit Reports for the Year Ended December 31, 2014 TABLE OF CONTENTS Audited Financial Statements Management s Discussion and Analysis... 1 Independent
Transit Development Plan (FY ) Executive Summary
 Executive Summary") Transit Development Plan (FY 2019-2028) Executive Summary December 2018 TABLE OF CONTENTS Introduction... 1 System Profile... 2 Public Outreach... 4 Key Findings/Direction... 5 Implementation Plan... 6
Transit Development Plan (FY 2019-2028) Executive Summary December 2018 TABLE OF CONTENTS Introduction... 1 System Profile... 2 Public Outreach... 4 Key Findings/Direction... 5 Implementation Plan... 6
Our Mission. To inspire every student to think, to learn, to achieve, to care
 At a Glance Our Mission To inspire every student to think, to learn, to achieve, to care MESSAGE FROM OUR SUPERINTENDENT Our Culture of Learning Welcome to the Cherry Creek Schools Culture of Learning.
Dallas Area Rapid Transit Dallas, Texas. Financial Statements Years Ended September 30, 2016 and 2015 and Independent Auditor s Report
 Dallas Area Rapid Transit Dallas, Texas Financial Statements Years Ended September 30, 2016 and 2015 and Independent Auditor s Report DALLAS, TEXAS FINANCIAL STATEMENTS AS OF AND FOR THE YEARS ENDED SEPTEMBER
10 Financial Analysis
 10 Financial Analysis This chapter summarizes the financial analysis for the No-Build Alternative and the proposed METRO Blue Line Light Rail Transit (BLRT) Extension project. This chapter also describes
Analysis of the Alameda County Transportation Expenditure Plan Prepared by Alameda County Transportation Commission
 Analysis of the Alameda County Transportation Expenditure Plan Prepared by Alameda County Transportation Commission Discussion: In 1986, voters approved Measure B, a 1/2 cent sales tax, to fund transportation
Executive Summary. Fiscal Year ($ millions) Total Department Uses by Major Service Area 2, ,
 Total Department Uses by Major Service Area 2, ,") Executive Summary SAN FR ANCISCO S BUDGET The budget for the City and County of San Francisco (the City) for (FY) and FY is $7.3 billion and $7.6 billion, respectively. Roughly 52.3 percent of the budget
Executive Summary SAN FR ANCISCO S BUDGET The budget for the City and County of San Francisco (the City) for (FY) and FY is $7.3 billion and $7.6 billion, respectively. Roughly 52.3 percent of the budget
Arlington County, Virginia
 Arlington County, Virginia METRO METRO 2015 2024 CIP Metro Funding Project Description The Washington Metropolitan Area Transit Authority (WMATA/Metro) is a unique federal-state-local partnership formed
Structural Financial Task Force Tax Burden Benchmarking
 Structural Financial Task Force Tax Burden Benchmarking Meeting 5 June 17, 2011 DRAFT 1 Executive Summary Given our assumptions, the hypothetical household in Denver at $59,007 faces a: Sales tax burden
Audit and Finance Subcommittee
 MEETING OF THE Audit and Finance Subcommittee MEETING DATE January 12, 2017 TIME LOCATION 12:00 p.m. Valley Metro 101 N. 1st Ave., 10th Floor Lake Mead Conference Room (10B) Phoenix, AZ 85003 VALLEY METRO
MONTHLY FINANCIAL STATUS JUNE 2018
 (Millions) MONTHLY FINANCIAL STATUS To: Dave Genova, General Manager and CEO ACTION DISCUSSION INFO From: Heather McKillop, CFO and AGM Administration x Date: July 10, VS. BUDGET YTD VS. BUDGET JUNE VS.
Financial Outlook for the Metropolitan Transportation Authority
 Financial Outlook for the Metropolitan Transportation Authority Thomas P. DiNapoli New York State Comptroller Kenneth B. Bleiwas Deputy Comptroller Report 6-214 September 213 Highlights Fares and tolls
Regional Transportation District (Colorado) North Metro Certificates of Participation
 North Metro Certificates of Participation") Regional Transportation District (Colorado) North Metro Certificates of Participation Brenden Morgan Debt Manager, RTD Dee Wisor Butler Snow LLP Jason Simmons FirstSouthwest May 8, 2015 Summary Introduction
Regional Transportation District (Colorado) North Metro Certificates of Participation Brenden Morgan Debt Manager, RTD Dee Wisor Butler Snow LLP Jason Simmons FirstSouthwest May 8, 2015 Summary Introduction
EXECUTIVE DIVISION MISSION STATEMENT STRATEGIC PLAN CHANGE INITIATIVES & SCORECARD MEASURES
 EXECUTIVE DIVISION MISSION STATEMENT The Mission of the Executive Division is to plan, execute, and manage the efficient, effective, safe, and courteous delivery of quality public transportation services
Central Puget Sound Regional Transit Authority
 Central Puget Sound Regional Transit Authority Single Audit Reports for the Year Ended December 31, 2013 TABLE OF CONTENTS Audited Financial Statements Management s Discussion and Analysis...1 Independent
IV. Major Assumptions Projections
 IV. Major Assumptions 2004-2008 Projections This page has been intentionally left blank. Utilization (Revenue, Ridership, Vehicle Traffic) This page has been intentionally left blank. UTILIZATION Baseline
TABLE OF CONTENTS. Page. Page
 TABLE OF CONTENTS Page Overview Board of Directors... Overview-1 TriMet Officials... Overview-1 Budget Message... Overview-2 2017-2018 TriMet Organization Chart... Overview-10 Financial Summary General
February 2016 Financial Report
 2016 February 2016 Financial Report Capital Metropolitan Transportation Authority 4/13/2016 Table of Contents SUMMARY REPORT Budgetary Performance - Revenue 2 - Sales Tax Revenue 5 - Operating Expenses
Whatcom Transportation Authority
 Whatcom Transportation Authority Annual Budget 2011 Table of Contents Executive Memorandum... 1 WTA Mission... 2 WTA Vision Destination 2020... 3 Key Objectives... 4 Budget Initiatives... 5 Budget Assumptions...
MONTHLY FINANCIAL STATUS AUGUST 2018
 (Millions) MONTHLY FINANCIAL STATUS To: Dave Genova, General Manager and CEO ACTION DISCUSSION INFO From: Heather McKillop, CFO and AGM Administration x Date: October 9, VS. BUDGET YTD VS. BUDGET AUGUST
Governor s FY 2019 Revised, FY 2020 and Capital Budget Recommendations House Finance Committee April 9, 2019
 Governor s FY 2019 Revised, FY 2020 and Capital Budget Recommendations House Finance Committee April 9, 2019 Quasi-public agency Established in 1964 Responsible: Fixed route bus service and Americans with
Public Authorities by the Numbers: Capital District Transportation Authority
 Public Authorities by the Numbers: Capital District Transportation Authority June 2016 Table of Contents I. EXECUTIVE SUMMARY... 1 II. CAPITAL DISTRICT TRANSPORTATION AUTHORITY BY THE NUMBERS... 2 Introduction...
CHAPTER 9 FINANCIAL CONSIDERATIONS
 CHAPTER 9 FINANCIAL CONSIDERATIONS 9.1 INTRODUCTION This chapter presents anticipated costs, revenues, and funding for the Berryessa Extension Project (BEP) Alternative and the Silicon Valley Rapid Transit
Auditor s Letter. Timothy M. O Brien, CPA Denver Auditor Annual Audit Plan
 2017 Audit Plan Office of the Auditor Audit Services Division City and County of Denver Timothy M. O Brien, CPA Inside: Planned Audits Plan Description Audit Selection Process Auditor s Authority credit:
CHAPTER 7: Financial Plan
 CHAPTER 7: Financial Plan Report Prepared by: Contents 7 FINANCIAL PLAN... 7-1 7.1 Introduction... 7-1 7.2 Assumptions... 7-1 7.2.1 Operating Revenue Assumptions... 7-2 7.2.2 Operating Cost Assumptions...
CHAPTER 9 FINANCIAL CONSIDERATIONS
 CHAPTER 9 FINANCIAL CONSIDERATIONS 9.1 INTRODUCTION This chapter presents anticipated costs, revenues, and funding for the BEP and the SVRTP. A summary evaluation of VTA s financial plan for the proposed
Whatcom Transportation Authority
 Whatcom Transportation Authority Annual Budget 12/14/2017 This Page Intentionally Left Blank Whatcom Transportation Authority (WTA) Annual Budget Table of Contents General Manager s Budget Message... 2
Table of Contents. Transmittal... i Introduction Executive Overview...1 Organization Chart...7. Community Profile...8. GFOA Budget Award...
 Table of Contents Transmittal... i Introduction Executive Overview...1 Organization Chart...7 Community Profile...8 GFOA Budget Award...18 Budget Calendar...19 How to use this document...20 General Fund
Governor s FY 2017 Revised, FY 2018 and Capital Budget Recommendations House Finance Committee April 12, 2017
 Governor s FY 2017 Revised, FY 2018 and Capital Budget Recommendations House Finance Committee April 12, 2017 Quasi-public agency Established in 1964 Responsible: Fixed route bus service and Americans
APPENDIX I REVENUE PROJECTION AND ASSUMPTIONS
 APPENDIX I REVENUE PROJECTION AND ASSUMPTIONS The 2018 StanCOG Regional Transportation Plan/Sustainable Communities Strategy (RTP/SCS) financial forecasts provide revenue projections for StanCOG member
Metro. Board Report. Fare revenue projections, based on preliminary assumptions for ridership
 Metro Board Report Los Angeles County Metropolitan Transportation Authority One Gateway Plaza 3rd Floor Board Room Los Angeles, CA SUBJECT: FY18 BUDGET DEVELOPMENT UPDATE ACTION: RECEIVE AND FILE RECOMMENDATION
EASTERN SIERRA TRANSIT AUTHORITY ANNUAL FINANCIAL REPORT WITH INDEPENDENT AUDITOR S THEREON. June 30, 2016
 EASTERN SIERRA TRANSIT AUTHORITY ANNUAL FINANCIAL REPORT WITH INDEPENDENT AUDITOR S THEREON June 30, 2016 Annual Financial Report For the Year Ended June 30, 2016 TABLE OF CONTENTS FINANCIAL SECTION Independent
MONTHLY FINANCIAL STATUS OCTOBER 2018
 (Millions) MONTHLY FINANCIAL STATUS To: Dave Genova, General Manager and CEO ACTION DISCUSSION INFO From: Heather McKillop, CFO and AGM Administration x Date: December 11, VS. BUDGET YTD VS. BUDGET OCTOBER
Adopted 2018 OPERATING BUDGET Two-Year Financial Plan and Five-Year CAPITAL PROGRAM
 2018 Adopted 2018 OPERATING BUDGET Two-Year Financial Plan and Five-Year CAPITAL PROGRAM MOVING YOU Northeastern Illinois December 2017 RTA Board of Directors Kirk Dillard Chairman Anthony K. Anderson
Community Planning & Development
 Community Planning & Development Mayor Office of Manager Community Planning & Developement Office of the Manager Development Services Code Administration & Enforcement Planning Services North Denver Cornerstone
A P3 Success Story RTD s EAGLE P3 Project
 A P3 Success Story RTD s EAGLE P3 Project September 20, 2011 STATE WORKSHOP ON PUBLIC PRIVATE PARTNERSHIPS FOR TRANSPORTATION WASHINGTON, DC Overview of the EAGLE P3 East Corridor 22.8 miles of commuter
FY Statewide Capital Investment Strategy... asset management, performance-based strategic direction
 FY 2009-2018 Statewide Capital Investment Strategy.. asset management, performance-based strategic direction March 31, 2008 Governor Jon S. Corzine Commissioner Kris Kolluri Table of Contents I. EXECUTIVE