AGEC 603. Derived Demand for Land. Based on consumer choice Utility theory and budget constraint
|
|
|
- Kory Mathews
- 6 years ago
- Views:
Transcription

1 AGEC 603 Derived Demand for Land Individual Demand Based on consumer choice Utility theory and budget constraint Utility theory Utility is the satisfaction one gets from consuming a good or service Budget constraint how much you have to spend Marginal Utility Change in utility derived from a change in consumption of a particular good holding other goods constant Law of Diminishing Marginal Utility - as consumption per unit of time increases, marginal utility decreases Examples M&Ms Texan Steak - Amarillo 1
2 Bundle of goods Bundles of goods Indifference / Isoutility Curves Bundle of goods B 1 Negative slope Nonintersecting Everywhere dense Convex to the origin B 2 L 1 L 2 Land units Consuming B 1 L 1 provides the same utility as consuming B 2 L 2 Indifference Curves M B Land Units Which bundle would you prefer bundle M or bundle B? The answer is that this we would be indifferent because they give us the same utility. The ultimate choice will depend on the prices of these two products. Indifference Curves Which bundle would you prefer more bundle C or bundle N? C N We would prefer bundle N over bundle C because it gives us more utility or satisfaction. The question is whether we can afford to buy bundle N! Land Units 2
3 Bundle of goods 1 Bundle of goods -1 Marginal Rate of Substitution The rate at which the consumer is willing to substitute one good for another and maintain a constant utility level bundle land MRS of land for bundle with utility constant Notice - rise over run = the slope for a specific segment for a nonlinear curves Marginal Rate of Substitution MRS land for bundle going from 2 to 3 land units _ bundle 1 1 land 1 1 Land Units This means the consumer is willing to give up 1 bundle unit in exchange for one land unit! Marginal Rate of Substitution MRS bundle for land going from 2 to 3 bundle units bundle land Land Units This means the consumer is willing to give up 2 land units for one additional unit of bundle of goods! 3
4 Bundle of goods Marginal Rate of Substitution bundle MU MRS land MU land bundle Why? Utility must be constant What you give up with one, you must gain with the other! Budget Constraint Represents the amount of income available for spending on the consumption bundles Example land / bundle budget P land x Q land + P bundle x Q bundle Budget where P land and P bundle represent the price of land and the bundle of goods while Q land and Q bunlde represent the quantities you purchase during the time period. Budget Constraint Graph Income = $200 Prices = $40 / unit bundle and $20 / unit land Apply all income to bundle Budget Constraint Apply all income to land Land 4
5 Bundle of goods 9 10 Bundle of goods 9 10 Bundle of goods 9 10 Bundle Price Decreases by 1/2 Bundle price decreases by 1/2 Original price budget constraint After price change budget constraint Apply all income to land Land Bundle Price Increases by 2 Original price budget constraint Bundle price decreases by 1/2 budget constraint Bundle price doubles budget constraint Land Land Price Changes Original price budget constraint Land price doubles Land price decreases by 1/ Land 5
6 Bundle of good Bundle of goods Steaks (lbs) consumed per week Income Changes Original Budget Line Budget Line at increased income Budget Line at ½ income Note: parallel shifts Dozen corn ears consumed per week Objective - Maximize Utility Indifference Curve below budget constraint Can increase utility by moving outward Not Optimal Point Indifference Curve is Tangent to Budget Constraint Feasible spends all budget Maximizes Utility highest curve obtainable Land Units Indifference Curves and points above the budget Constraint exceeds your budget - not feasible Slope Budget Constraint Using x and y intercept points to calculate slope land = 0, bundle = 5 and land = 10 and bundle = 0 Slope = rise / run = (5-0)/(0-10) = -0.5 These points obtained Income / price of bundle = 5 and Income / price of land = 10 I I ( 0) Pbunlde P I I (0 ) Pland Pland Land Units bundle P P land bundle 6
7 Bundle of goods Tangency Conditions Slope of indifference curve = slope of budget constraint Slope of indifference curve = MRS = - MU land / MU bundle Slope of budget constraint = -P land / P bundle Therefore, MU MRS MU MU P land land MU P land bundle bundle bundle P P land bundle Consumer Equilibrium Point where utility is maximized subject to the budget constraint occurs at MU land P land = MU bundle P bundle In other words, the marginal utility derived from the last dollar spent on each good is identical. This can be expanded to include all goods and services purchased by the consumer. Individual Demand Curve Original Price = $20 / unit Consumption bundle 2.5 bundle units and 5 units land What if price decreases to $15? What happens to budget constraint? Land units 7
8 Bundle of goods Bundle of goods Land Price Decreases New x-intercept Same Why New equilibrium = 2.75 bundle and 6 land Why an increase in bundle and increase in land? Land Units Land Price Increases New y-intercept same Why? New equilibrium = bundle and 1.5 land Why an decrease in land and increase in bundle? Land Units Individual Demand Curve - Land Demand Schedule Price Quantity P increase 1.5 P o 5 P decrease 6 8
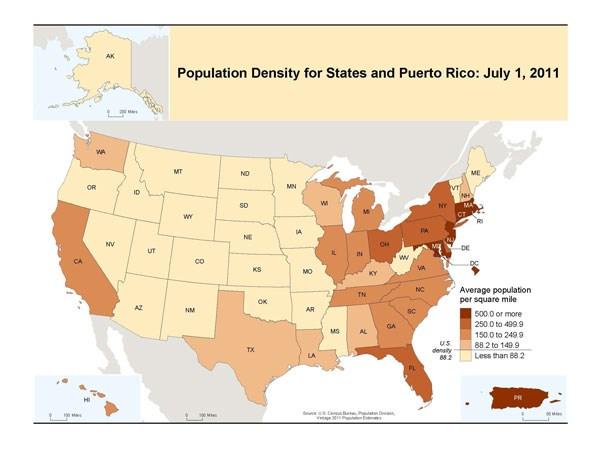
9 Market Demand Curve - Land + = The market demand curve is the horizontal summation of the demand schedules for all the consumers in the market. Demand Curve Jargon - Review Specific terms to distinguish between movement along a demand curve and a shift in a demand curve Change in the quantity demanded is a movement along a demand curve - Cause Change in demand is a shift in the demand curve - Causes World Population and Demand Population one of the most important factors in determining demand for land Trends Price Changing characteristics Future outlook P 3 Density P 2 S Increasing population leads to 1) increasing price and 2) increasing land use assuming no change in supply curve P 1 L 1 L 2 L 3 Land Quantity D 9

10 World Population Source: World Population Year Population Change 1 AD 200 million million billion Doubled in 313 years billion Doubled in 118 years billion Increased by 1 billion in 38 years billion Doubled in 39 years billion billion Source U.S. Census Bureau World Population Distribution 10


 http://www.worldometers.")
11 World Population by Country Urban Areas >= million inhabitants in World Population Density (people/km2) 11

: 1950-2050 Source: United Nations Population Division,")
12 World Population Growth Is Almost Entirely Concentrated in the World's Poorer Countries. World Population (in Billions): Source: United Nations Population Division, World Population Prospects, The 2008 Revision Population Reference Bureau. All rights reserved. 12
13 Population Density Projections Year Population Area (sq. km.) Density (persons per sq. km.) Acres / person ,557,628, ,061, ,042,828, ,061, ,712,338, ,061, ,450,929, ,061, ,287,869, ,061, ,090,319, ,061, ,866,054, ,061, ,631,071, ,061, ,315,758, ,061, ,896,844, ,061, ,376,416, ,061, Global Hunger Index The 2013 (GHI) ranks 88 countries using three indicators: The proportion of people who are calorie deficient, or undernourished The prevalence of underweight in children under the age of five The under-five mortality rate Takes into account the special vulnerability of children to nutritional deprivation Ratings from 0 (best) to 100 (worst). Global Hunger Index Countries are rated from 0 (best) to 100 (worst). Overall GHI scores improved from 18.7 in the 1990 to 15.2 in the Sub-Saharan Africa and South Asia have the worst scores on the 2008 GHI. Policy Research Institute, 13


14 2008 Global Hunger Index GHI-Winners and Losers Global Hunger Index Policy Research Institute, 14

15 U.S. Population U.S. Population 15

16 U.S. Population U.S. Population Components of Population Change One birth every 8 seconds One death every 12 seconds One international migrant (net) every 40 seconds Net gain of one person every 17 seconds 10 Most Populous States State Population, Pop. per sq. mi., Poplation California 38,332, ,444,861 Texas 26,448, ,317,744 New York 19,651, ,685,769 Florida 19,552, ,477,429 Illinois 12,882, ,432,892 Pennsylvania 12,773, ,768,184 Ohio 11,570, ,227,739 Georgia 9,992, ,712,397 Michigan 9,895, ,017,838 North Carolina 9,848, ,694,

17 Fastest Growing Cities Percent Increase 2011 Total Population 1. New Orleans , Round Rock, Texas , Austin, Texas , Plano, Texas , McKinney, Texas , Frisco, Texas , Denton, Texas , Denver , Cary, N.C , Raleigh, N.C , Alexandria, Va , Tampa, Fla , McAllen, Texas , Carrollton, Texas , Atlanta ,427 Fastest Growing States The 10 Fastest Growing States from April 1, 2010, to July 1, 2011 Percent change 1. District of Columbia Texas Utah Alaska Colorado North Dakota Washington Arizona Florida Georgia 1.32 The 10 States with the Largest Numeric Increase from April 1, 2010, to July 1, 2011 Numeric change 1. Texas 529, California 438, Florida 256, Georgia 128, North Carolina 121, Washington 105, Virginia 96, Arizona 90, Colorado 88, New York 87,000 U.S. Population Movement 17
18 U.S. Population Projections Table 1. Projections of the Population and Components of Change for the United States: 2015 to 2060 Year Population Numeric change Percent change Natural increase Births Vital events Deaths Net international migration ,363 2, ,677 4,290 2, ,896 2, ,612 4,380 2, ,407 2, ,453 4,413 2,959 1, ,471 2, ,225 4,433 3,208 1, ,662 2, ,002 4,505 3,503 1, ,016 2, ,612 3,765 1, ,934 1, ,729 3,951 1, ,803 1, ,820 4,038 1,204 thousands Interim Projections: Percent Change in Population by Region of the United States, 2000 to United States Northeast Midwest South West Source: U.S. Census Bureau, Population Division, Interim State Population Projections, 2005 Texas Population Projections Low zero migration High migration rate 18


19 Texas Population Projections Growth rates vary by year and area Changing Demographics Aging Population 19

20 Changing Race Make-up Changing Demographics Mean Commute travel times Year Minutes Back to Demand Theory How does above fit into our simple theoretical aggregated demand Changing demographic Aging usually lower disposable income Work at home lower travel expenses increase income to spend elsewhere Change in taste and preferences Change in indifference curve Only time will tell? 20

21 Land Price Bundle of goods Changing Income and Utility Max Increase in budget constraint move equilibrium Increase in income increase budget constraint Land Units Changing Income Increase in demand D new D original Land Units World GDP Increase - Projected 21

22 U.S. & Texas Income Non Ag Land Resource Needs Increasing Population mineral and energy needs increasing Urbanization Increased incomes increase demand for land Increased incomes increase in recreational / leisure activities All increasing demand for land Changing taste and preferences Competition between Land Uses Highest and best use Conflicts of interest arise Many land uses are not compatible with each other Owners have different objectives Conflicts of interest between owners and society 22
Economics of Demand or Theory of Consumer Behavior. Chapter 2 Chapter 5 p
 Economics of Demand or Theory of Consumer Behavior Chapter 2 Chapter 5 p. 119-12 Topics Where are we going? Utility Theory Marginal utility Indifference curves Budget constraint Consumer equilibrium -
Faculty: Sunil Kumar
 Objective of the Session To know about utility To know about indifference curve To know about consumer s surplus Choice and Utility Theory There is difference between preference and choice The consumers
Consumer Choice and Demand
 Consumer Choice and Demand 1 Utility Utility Analysis Sense of pleasure, or satisfaction that comes from consumption Subjective Assumption Taste are given Tastes are relatively stable 2 Total utility Utility
Chapter 4 Topics. Behavior of the representative consumer Behavior of the representative firm Pearson Education, Inc.
 Chapter 4 Topics Behavior of the representative consumer Behavior of the representative firm 1-1 Representative Consumer Consumer s preferences over consumption and leisure as represented by indifference
Chapter 3. Consumer Behavior
 Chapter 3 Consumer Behavior Question: Mary goes to the movies eight times a month and seldom goes to a bar. Tom goes to the movies once a month and goes to a bar fifteen times a month. What determine consumers
Introductory to Microeconomic Theory [08/29/12] Karen Tsai
![Introductory to Microeconomic Theory [08/29/12] Karen Tsai](/thumbs/89/98057894.jpg "Introductory to Microeconomic Theory [08/29/12] Karen Tsai") Introductory to Microeconomic Theory [08/29/12] Karen Tsai What is microeconomics? Study of: Choice behavior of individual agents Key assumption: agents have well-defined objectives and limited resources
Introductory to Microeconomic Theory [08/29/12] Karen Tsai What is microeconomics? Study of: Choice behavior of individual agents Key assumption: agents have well-defined objectives and limited resources
Nation s Uninsured Rate for Children Drops to Another Historic Low in 2016
 Nation s Rate for Children Drops to Another Historic Low in 2016 by Joan Alker and Olivia Pham The number of uninsured children nationwide dropped to another historic low in 2016 with approximately 250,000
Principle of Microeconomics
 Principle of Microeconomics Chapter 21 Consumer choices Elements of consumer choices Total amount of money available to spend. Price of each item consumers on a perfectly competitive market are price takers.
Chapter 4 The Theory of Individual Behavior
 Managerial Economics & Business Strategy Chapter 4 The Theory of Individual Behavior McGraw-Hill/Irwin Copyright 2010 by the McGraw-Hill Companies, Inc. All rights reserved. Overview I. Consumer Behavior
Eco 300 Intermediate Micro
 Eco 300 Intermediate Micro Instructor: Amalia Jerison Office Hours: T 12:00-1:00, Th 12:00-1:00, and by appointment BA 127A, aj4575@albany.edu A. Jerison (BA 127A) Eco 300 Spring 2010 1 / 27 Review of
CHAPTER 4. The Theory of Individual Behavior
 CHAPTER 4 The Theory of Individual Behavior Copyright 2014 McGraw-Hill Education. All rights reserved. No reproduction or distribution without the prior written consent of McGraw-Hill Education. Chapter
Forecasting State and Local Government Spending: Model Re-estimation. January Equation
 Forecasting State and Local Government Spending: Model Re-estimation January 2015 Equation The REMI government spending estimation assumes that the state and local government demand is driven by the regional
THEORETICAL TOOLS OF PUBLIC FINANCE
 Solutions and Activities for CHAPTER 2 THEORETICAL TOOLS OF PUBLIC FINANCE Questions and Problems 1. The price of a bus trip is $1 and the price of a gallon of gas (at the time of this writing!) is $3.
Economics II - Exercise Session # 3, October 8, Suggested Solution
 Economics II - Exercise Session # 3, October 8, 2008 - Suggested Solution Problem 1: Assume a person has a utility function U = XY, and money income of $10,000, facing an initial price of X of $10 and
Microeconomics Pre-sessional September Sotiris Georganas Economics Department City University London
 Microeconomics Pre-sessional September 2016 Sotiris Georganas Economics Department City University London Organisation of the Microeconomics Pre-sessional o Introduction 10:00-10:30 o Demand and Supply
Chapter 4. Consumer and Firm Behavior: The Work- Leisure Decision and Profit Maximization. Copyright 2014 Pearson Education, Inc.
 Chapter 4 Consumer and Firm Behavior: The Work- Leisure Decision and Profit Maximization Copyright Chapter 4 Topics Behavior of the representative consumer Behavior of the representative firm 1-2 Representative
What is the marginal utility of the third chocolate bar to this consumer? a) 10 b) 9 c) 8 d) 7
 10 b) 9 c) 8 d) 7") Chapter 5 Review Quiz 1. Which of the following best expresses the law of diminishing marginal utility? a) the more a person consumes of a product, the smaller becomes the utility received from its consumption
Chapter 5 Review Quiz 1. Which of the following best expresses the law of diminishing marginal utility? a) the more a person consumes of a product, the smaller becomes the utility received from its consumption
Chapter 21: Theory of Consumer Choice
 Chapter 21: Theory of Consumer Choice We will now try to "get behind the demand curve To get behind the D curve we must study individual behavior How do individuals make consumption decisions? We have
제 4 장소비자행동이론. The Theory of Consumer Behavior
 제 4 장소비자행동이론 The Theory of Consumer Behavior 소비자행동 Consumer Behavior Consumer Preferences 소비자선호 The goods and services consumers actually consume. Given the choice between 2 bundles of goods a consumer
Marginal Utility, Utils Total Utility, Utils
 Mr Sydney Armstrong ECN 1100 Introduction to Microeconomics Lecture Note (5) Consumer Behaviour Evidence indicated that consumers can fulfill specific wants with succeeding units of a commodity but that
Residual Income Requirements
 Residual Income Requirements ytzhxrnmwlzh Ch. 4, 9-e: Item 44, Balance Available for Family Support (04/10/09) Enter the appropriate residual income amount from the following tables in the guideline box.
March Karen Cunnyngham Amang Sukasih Laura Castner
 Empirical Bayes Shrinkage Estimates of State Supplemental Nutrition Assistance Program Participation Rates in 2009-2011 for All Eligible People and the Working Poor March 2014 Karen Cunnyngham Amang Sukasih
Q Homeowner Confidence Survey Results. May 20, 2010
 Q1 2010 Homeowner Confidence Survey Results May 20, 2010 The Zillow Homeowner Confidence Survey is fielded quarterly to determine the confidence level of American homeowners when it comes to the value
Eastern Mediterranean University Faculty of Business and Economics Department of Economics Spring Semester
 Eastern Mediterranean University Faculty of Business and Economics Department of Economics 2015 16 Spring Semester ECON101 Introduction to Economics I Second Midterm Exam Duration: 90 minutes Type A 23
Lecture 3: Consumer Choice
 Lecture 3: Consumer Choice September 15, 2015 Overview Course Administration Ripped from the Headlines Quantity Regulations Consumer Preferences and Utility Indifference Curves Income and the Budget Constraint
Consumer Theory. Introduction Budget Set/line Study of Preferences Maximizing Utility
 Consumer Theory Introduction Budget Set/line Study of Preferences Maximizing Utility Introduction Where does the law of demand come from? Consumption choices depend on two factors: 1. What choices you
Union Members in New York and New Jersey 2018
 For Release: Friday, March 29, 2019 19-528-NEW NEW YORK NEW JERSEY INFORMATION OFFICE: New York City, N.Y. Technical information: (646) 264-3600 BLSinfoNY@bls.gov www.bls.gov/regions/new-york-new-jersey
Lecture 4: Consumer Choice
 Lecture 4: Consumer Choice September 18, 2018 Overview Course Administration Ripped from the Headlines Consumer Preferences and Utility Indifference Curves Income and the Budget Constraint Making a Choice
Module 2 THEORETICAL TOOLS & APPLICATION. Lectures (3-7) Topics
 Topics") Module 2 THEORETICAL TOOLS & APPLICATION 2.1 Tools of Public Economics Lectures (3-7) Topics 2.2 Constrained Utility Maximization 2.3 Marginal Rates of Substitution 2.4 Constrained Utility Maximization:
Module 2 THEORETICAL TOOLS & APPLICATION 2.1 Tools of Public Economics Lectures (3-7) Topics 2.2 Constrained Utility Maximization 2.3 Marginal Rates of Substitution 2.4 Constrained Utility Maximization:
We want to solve for the optimal bundle (a combination of goods) that a rational consumer will purchase.
 that a rational consumer will purchase.") Chapter 3 page1 Chapter 3 page2 The budget constraint and the Feasible set What causes changes in the Budget constraint? Consumer Preferences The utility function Lagrange Multipliers Indifference Curves
Chapter 3 page1 Chapter 3 page2 The budget constraint and the Feasible set What causes changes in the Budget constraint? Consumer Preferences The utility function Lagrange Multipliers Indifference Curves
UNIVERSITY OF WASHINGTON Department of Economics
 Write your name: Suggested Answers UNIVERSITY OF WASHINGTON Department of Economics Economics 200, Fall 2008 Instructor: Scott First Hour Examination ***Use Brief Answers (making the key points) & Label
FHA Manual Underwriting Exceeding 31% / 43% DTI Eligibility Quick Reference
 Credit Score/ Compensating Factor(s)* No Compensating Factor One Compensating Factor Two Compensating Factors No Discretionary Debt Maximum DTI 31% / 43% 37% / 47% 40% / 50% 40% / 40% *Acceptable compensating
Consumer Choice and Demand
 Consumer Choice and Demand CHAPTER12 C H A P T E R C H E C K L I S T When you have completed your study of this chapter, you will be able to 1 Calculate and graph a budget line that shows the limits to
The 2017 CHP Salary Survey
 The 2017 CHP Salary Survey Gary Lauten, CHP, AAHP Niche Analyst Introduction The 2017 certified health physicist (CHP) survey data was collected by having CHPs submit their responses to survey questions
MICROECONOMIC THEORY 1
 MICROECONOMIC THEORY 1 Lecture 2: Ordinal Utility Approach To Demand Theory Lecturer: Dr. Priscilla T Baffour; ptbaffour@ug.edu.gh 2017/18 Priscilla T. Baffour (PhD) Microeconomics 1 1 Content Assumptions
Kentucky , ,349 55,446 95,337 91,006 2,427 1, ,349, ,306,236 5,176,360 2,867,000 1,462
 TABLE B MEMBERSHIP AND BENEFIT OPERATIONS OF STATE-ADMINISTERED EMPLOYEE RETIREMENT SYSTEMS, LAST MONTH OF FISCAL YEAR: MARCH 2003 Beneficiaries receiving periodic benefit payments Periodic benefit payments
Topic 4b Competitive consumer
 Competitive consumer About your economic situation, do you see the light at the end of the tunnel? I think the light at the end of the tunnel has been turned off due to my budget constraints. 1 of 25 The
(Note: Please label your diagram clearly.) Answer: Denote by Q p and Q m the quantity of pizzas and movies respectively.
 Answer: Denote by Q p and Q m the quantity of pizzas and movies respectively.") 1. Suppose the consumer has a utility function U(Q x, Q y ) = Q x Q y, where Q x and Q y are the quantity of good x and quantity of good y respectively. Assume his income is I and the prices of the two
1. Suppose the consumer has a utility function U(Q x, Q y ) = Q x Q y, where Q x and Q y are the quantity of good x and quantity of good y respectively. Assume his income is I and the prices of the two
University of Toronto November 28, ECO 100Y INTRODUCTION TO ECONOMICS Midterm Test # 2
 Department of Economics Prof. Gustavo Indart University of Toronto November 28, 2008 SOLUTIONS ECO 100Y INTRODUCTION TO ECONOMICS Midterm Test # 2 LAST NAME FIRST NAME STUDENT NUMBER INSTRUCTIONS: 1. The
The Rational Consumer. The Objective of Consumers. Maximizing Utility. The Budget Set for Consumers. Slope =
 The Rational Consumer The Objective of Consumers 2 Chapter 8 and the appendix Announcements We have studied demand curves. We now need to develop a model of consumer behavior to understand where demand
ECO101 PRINCIPLES OF MICROECONOMICS Notes. Consumer Behaviour. U tility fro m c o n s u m in g B ig M a c s
 ECO101 PRINCIPLES OF MICROECONOMICS Notes Consumer Behaviour Overview The aim of this chapter is to analyse the behaviour of rational consumers when consuming goods and services, to explain how they may
State Individual Income Taxes: Personal Exemptions/Credits, 2011
 Individual Income Taxes: Personal Exemptions/s, 2011 Elderly Handicapped Blind Deaf Disabled FEDERAL Exemption $3,700 $7,400 $3,700 $7,400 $0 $3,700 $0 $0 $0 $0 Alabama Exemption $1,500 $3,000 $1,500 $3,000
Housing Tax Expenditures and the Economy
 Housing Tax Expenditures and the Economy The GSEs, Housing, and the Economy January 24, 2011 Todd Sinai, The Wharton School Housing tax expenditures cost a lot Tax expenditure Mortgage interest deduction
Undocumented Immigrants are:
 Immigrants are: Current vs. Full Legal Status for All Immigrants Appendix 1: Detailed State and Local Tax Contributions of Total Immigrant Population Current vs. Full Legal Status for All Immigrants
Econ 1101 Summer 2013 Lecture 7. Section 005 6/26/2013
 Econ 1101 Summer 2013 Lecture 7 Section 005 6/26/2013 Announcements Homework 6 is due tonight at 11:45pm, CDT Midterm tomorrow! Will start at 5:40pm, there is a recitation beforehand. Make sure to work
We will make several assumptions about these preferences:
 Lecture 5 Consumer Behavior PREFERENCES The Digital Economist In taking a closer at market behavior, we need to examine the underlying motivations and constraints affecting the consumer (or households).
Daniel Morris, MS, PhD
 Daniel Morris, MS, PhD Our Oregon is Oregon s progressive coalition, working for social and economic justice and fighting to protect Oregon s priorities. Education 2 nd largest K-12 class sizes in the
3. Consumer Behavior
 3. Consumer Behavior References: Pindyck und Rubinfeld, Chapter 3 Varian, Chapter 2, 3, 4 25.04.2017 Prof. Dr. Kerstin Schneider Chair of Public Economics and Business Taxation Microeconomics Chapter 3
2014 U.S. Census (2015) Median African-American Household Income Rank, Memphis Included. Household Median Income Ranking, African American Population
 Median African-American Household Income Rank, Memphis Included. Household Median Income Ranking, African American Population") 2015 2015 Rankings Report Prepared by Elena Delavega, PhD, MSW Department of Social Work Benjamin L. Hooks Institute for Social Change University of Memphis 2014 U.S. Census (2015) - Rank, Memphis Included
2015 2015 Rankings Report Prepared by Elena Delavega, PhD, MSW Department of Social Work Benjamin L. Hooks Institute for Social Change University of Memphis 2014 U.S. Census (2015) - Rank, Memphis Included
Problem Set 5: Individual and Market Demand. Comp BC
 Economics 204 Problem Set 5: Individual and Market Demand 1. (a) See the graph in your book exhibit 4.9 or 4.10 (b) See the graph in your book exhibit 4.11 (c) Price decrease normal good Y Orig omp New
EBRI Databook on Employee Benefits Chapter 6: Employment-Based Retirement Plan Participation
 EBRI Databook on Employee Benefits Chapter 6: Employment-Based Retirement Plan Participation UPDATED July 2014 This chapter looks at the percentage of American workers who work for an employer who sponsors
A Study of Factors Impacting Resiliency
 A Study of Factors Impacting Resiliency Place cover image here Brian Lewandowski Associate Director, Business Research Division June 13, 2017 Project Team Colorado Research Team: Brian Lewandowski Richard
1969. Median. Introduction
 Introduction PROJECTIONS OF 1969 INCOME SIZE DISTRIBUTION FOR FAMILIES AND UNRELATED INDIVIDUALS COMBINED FOR STATES AND SELECTED SMSA's Joseph J. Knott and Mitsuo Ono, U.S. Bureau of the Census* The demand
The Rational Consumer. The Objective of Consumers. The Budget Set for Consumers. Indifference Curves are Like a Topographical Map for Utility.
 The Rational Consumer The Objective of Consumers 2 Finish Chapter 8 and the appendix Announcements Please come on Thursday I ll do a self-evaluation where I will solicit your ideas for ways to improve
NAME: INTERMEDIATE MICROECONOMIC THEORY SPRING 2008 ECONOMICS 300/010 & 011 Midterm I March 14, 2008
 NAME: INTERMEDIATE MICROECONOMIC THEORY SPRING 2008 ECONOMICS 300/010 & 011 Section I: Multiple Choice (4 points each) Identify the choice that best completes the statement or answers the question. 1.
Checkpoint Payroll Sources All Payroll Sources
 Checkpoint Payroll Sources All Payroll Sources Alabama Alaska Announcements Arizona Arkansas California Colorado Connecticut Source Foreign Account Tax Compliance Act ( FATCA ) Under Chapter 4 of the Code
Example: Histogram for US household incomes from 2015 Table:
 1 Example: Histogram for US household incomes from 2015 Table: Income level Relative frequency $0 - $14,999 11.6% $15,000 - $24,999 10.5% $25,000 - $34,999 10% $35,000 - $49,999 12.7% $50,000 - $74,999
The Effect of the Federal Cigarette Tax Increase on State Revenue
 FISCAL April 2009 No. 166 FACT The Effect of the Federal Cigarette Tax Increase on State Revenue By Patrick Fleenor Today the federal cigarette tax will rise from 39 cents to $1.01 per pack. The proceeds
Q309 NATIONAL DELINQUENCY SURVEY FROM THE MORTGAGE BANKERS ASSOCIATION. Data as of September 30, 2009
 NATIONAL DELINQUENCY SURVEY FROM THE MORTGAGE BANKERS ASSOCIATION Q309 Data as of September 30, 2009 2009 Mortgage Bankers Association (MBA). All rights reserved, except as explicitly granted. Data are
Theory of Consumer Behavior First, we need to define the agents' goals and limitations (if any) in their ability to achieve those goals.
 in their ability to achieve those goals.") Theory of Consumer Behavior First, we need to define the agents' goals and limitations (if any) in their ability to achieve those goals. We will deal with a particular set of assumptions, but we can modify
Theory of Consumer Behavior First, we need to define the agents' goals and limitations (if any) in their ability to achieve those goals. We will deal with a particular set of assumptions, but we can modify
Aiming. Higher. Results from a Scorecard on State Health System Performance 2015 Edition. Douglas McCarthy, David C. Radley, and Susan L.
 Aiming Higher Results from a Scorecard on State Health System Performance Edition Douglas McCarthy, David C. Radley, and Susan L. Hayes December The COMMONWEALTH FUND overview On most of the indicators,
By: Adelle Simmons and Laura Skopec ASPE
 ASPE RESEARCH BRIEF 47 MILLION WOMEN WILL HAVE GUARANTEED ACCESS TO WOMEN S PREVENTIVE SERVICES WITH ZERO COST-SHARING UNDER THE AFFORDABLE CARE ACT By: Adelle Simmons and Laura Skopec ASPE The Affordable
The Costs and Benefits of Half a Loaf: The Economic Effects of Recent Regulation of Debit Card Interchange Fees. Robert J. Shapiro
 The Costs and Benefits of Half a Loaf: The Economic Effects of Recent Regulation of Debit Card Interchange Fees Robert J. Shapiro October 1, 2013 The Costs and Benefits of Half a Loaf: The Economic Effects
Annual Costs Cost of Care. Home Health Care
 2017 Cost of Care Home Health Care USA National $18,304 $47,934 $114,400 3% $18,304 $49,192 $125,748 3% Alaska $33,176 $59,488 $73,216 1% $36,608 $63,492 $73,216 2% Alabama $29,744 $38,553 $52,624 1% $29,744
Pay Frequency and Final Pay Provisions
 Pay Frequency and Final Pay Provisions State Pay Frequency Minimum Final Pay Resign Final Pay Terminated Alabama Bi-weekly or semi-monthly No Provision No Provision Alaska Semi-monthly or monthly Next
Income from U.S. Government Obligations
 Baird s ----------------------------------------------------------------------------------------------------------------------------- --------------- Enclosed is the 2017 Tax Form for your account with
State Corporate Income Tax Collections Decline Sharply
 Corporate Income Tax Collections Decline Sharply Nicholas W. Jenny and Donald J. Boyd The Rockefeller Institute Fiscal News: Vol. 1, No. 3 July 26, 2001 According to a report from the Congressional Budget
FAPRI Analysis of Dairy Policy Options for the 2002 Farm Bill Conference
 FAPRI Analysis of Dairy Policy Options for the 2002 Farm Bill Conference FAPRI-UMC Report #04-02 April 11, 2002 Food and Agricultural Policy Research Institute University of Missouri 101 South Fifth Street
Q209 NATIONAL DELINQUENCY SURVEY FROM THE MORTGAGE BANKERS ASSOCIATION. Data as of June 30, 2009
 NATIONAL DELINQUENCY SURVEY FROM THE MORTGAGE BANKERS ASSOCIATION Q209 Data as of June 30, 2009 2009 Mortgage Bankers Association (MBA). All rights reserved, except as explicitly granted. Data are from
Impacts of Prepayment Penalties and Balloon Loans on Foreclosure Starts, in Selected States: Supplemental Tables
 THE UNIVERSITY NORTH CAROLINA at CHAPEL HILL T H E F R A N K H A W K I N S K E N A N I N S T I T U T E DR. MICHAEL A. STEGMAN, DIRECTOR T 919-962-8201 OF PRIVATE ENTERPRISE CENTER FOR COMMUNITY CAPITALISM
Appendix 4.A. A Formal Model of Consumption and Saving Pearson Addison-Wesley. All rights reserved
 Appendix 4.A A Formal Model of Consumption and Saving How Much Can the Consumer Afford? The Budget Constraint Current income y; future income y f ; initial wealth a Choice variables: a f = wealth at beginning
3/1/2016. Intermediate Microeconomics W3211. Lecture 4: Solving the Consumer s Problem. The Story So Far. Today s Aims. Solving the Consumer s Problem
 1 Intermediate Microeconomics W3211 Lecture 4: Introduction Columbia University, Spring 2016 Mark Dean: mark.dean@columbia.edu 2 The Story So Far. 3 Today s Aims 4 We have now (exhaustively) described
DATA AS OF SEPTEMBER 30, 2010
 NATIONAL DELINQUENCY SURVEY Q3 2010 DATA AS OF SEPTEMBER 30, 2010 2010 Mortgage Bankers Association (MBA). All rights reserved, except as explicitly granted. Data are from a proprietary paid subscription
MINIMUM WAGE WORKERS IN HAWAII 2013
 WEST INFORMATION OFFICE San Francisco, Calif. For release Wednesday, June 25, 2014 14-898-SAN Technical information: (415) 625-2282 BLSInfoSF@bls.gov www.bls.gov/ro9 Media contact: (415) 625-2270 MINIMUM
STATE AND FEDERAL MINIMUM WAGES
 2017 STATE AND FEDERAL MINIMUM WAGES STATE AND FEDERAL MINIMUM WAGES The federal Fair Labor Standards Act (FLSA) establishes minimum wage and overtime requirements for most employers in the private sector
The Economic Impact of Spending for Operations and Construction in 2013 by AZA-Accredited Zoos and Aquariums
 The Economic Impact of Spending for Operations and Construction in 2013 by AZA-Accredited Zoos and Aquariums By Stephen S. Fuller, Ph.D. Dwight Schar Faculty Chair and University Professor Director, Center
A Closed Economy One-Period Macroeconomic Model
 A Closed Economy One-Period Macroeconomic Model Chapter 5 Topics in Macroeconomics 2 Economics Division University of Southampton February 21, 2008 Chapter 5 1/40 Topics in Macroeconomics Closing the Model
Microeconomics (Week 3) Consumer choice and demand decisions (part 1): Budget lines Indifference curves Consumer choice
 Consumer choice and demand decisions (part 1): Budget lines Indifference curves Consumer choice") Microeconomics (Week 3) onsumer choice and demand decisions (part 1): Budget lines Indifference curves onsumer choice The budget constraint The budget constraint describes the different bundles that the
Microeconomics (Week 3) onsumer choice and demand decisions (part 1): Budget lines Indifference curves onsumer choice The budget constraint The budget constraint describes the different bundles that the
Answer keys for PS 3
 Econ0 nswer kes for S 3. Solution: Income = $50 (CDs) = $5 (CTs) = $5 a. X intercept= I = 50/5 = 0 Y intercept = I = 50/5 = 6 b. Slope= = - 5/5 = - 3/5 Budget constraint in slope- intercept form: = (-3/5)
Choice. A. Optimal choice 1. move along the budget line until preferred set doesn t cross the budget set. Figure 5.1.
 Choice 34 Choice A. Optimal choice 1. move along the budget line until preferred set doesn t cross the budget set. Figure 5.1. Optimal choice x* 2 x* x 1 1 Figure 5.1 2. note that tangency occurs at optimal
Health Coverage for the Black Population Today and Under the Affordable Care Act
 fact sheet Health Coverage for the Black Population Today and Under the Affordable Care Act July 2013 As of 2011, 37 million individuals living in the United States identified as Black or African American.
White Paper 2018 STATE AND FEDERAL MINIMUM WAGES
 White Paper STATE AND FEDERAL S White Paper STATE AND FEDERAL S The federal Fair Labor Standards Act (FLSA) establishes minimum wage and overtime requirements for most employers in the private sector and
LPL RESEARCH RETIREMENT ENVIRONMENT INDEX
 LPL RESEARCH PRIVATE CLIENT THOUGHT LEADERSHIP May 2017 DISRUPTIVE INSIGHTS LPL RESEARCH RETIREMENT ENVIRONMENT INDEX STATE-BY-STATE HOLISTIC VIEW INTO PRE-RETIREE LANDSCAPE O V E R V I E W The LPL Research
Econ 323 Microeconomic Theory. Practice Exam 1 with Solutions
 Econ 323 Microeconomic Theory Practice Exam 1 with Solutions Chapter 2, Question 1 The equilibrium price in a market is the price where: a. supply equals demand b. no surpluses or shortages result c. no
Econ 323 Microeconomic Theory. Chapter 2, Question 1
 Econ 323 Microeconomic Theory Practice Exam 1 with Solutions Chapter 2, Question 1 The equilibrium price in a market is the price where: a. supply equals demand b. no surpluses or shortages result c. no
E&G, Ch. 1: Theory of Choice; Utility Analysis - Certainty
 1 E&G, Ch. 1: Theory of Choice; Utility Analysis - Certainty I. Summary: All decision problems involve: 1) determining the alternatives available the Opportunities Locus. 2) selecting criteria for choosing
Introductory Microeconomics (ES10001)
") Topic 2: Household ehaviour Introductory Microeconomics (ES11) Topic 2: Consumer Theory Exercise 4: Suggested Solutions 1. Which of the following statements is not valid? utility maximising consumer chooses
Topic 2: Household ehaviour Introductory Microeconomics (ES11) Topic 2: Consumer Theory Exercise 4: Suggested Solutions 1. Which of the following statements is not valid? utility maximising consumer chooses
Growing Slowly, Getting Older:*
 Growing Slowly, Getting Older:* Demographic Trends in the Third District States BY TIMOTHY SCHILLER N ational trends such as slower population growth, an aging population, and immigrants as a larger component
Health Insurance Coverage among Puerto Ricans in the U.S.,
 Health Insurance Coverage among Puerto Ricans in the U.S., 2010 2015 Research Brief Issued April 2017 By: Jennifer Hinojosa Centro RB2016-15 The recent debates and issues surrounding the 2010 Affordable
14.54 International Trade Lecture 3: Preferences and Demand
 14.54 International Trade Lecture 3: Preferences and Demand 14.54 Week 2 Fall 2016 14.54 (Week 2) Preferences and Demand Fall 2016 1 / 29 Today s Plan 1 2 Utility maximization 1 2 3 4 Budget set Preferences
Econ 1101 Practice Questions about Consumer Theory Solution
 Econ 0 Practice Questions about Consumer Theory Solution Question : Sam eats only green eggs and ham. He has an income of $3. Green eggs have a price of P G = $ and ham has a price of P H = $. Sam s preferences
Lecture # Applications of Utility Maximization
 Lecture # 10 -- Applications of Utility Maximization I. Matching vs. Non-matching Grants Here we consider how direct aid compares to a subsidy. Matching grants the federal government subsidizes local spending.
TThe Supplemental Nutrition Assistance
 STATE SUPPLEMENTAL NUTRITION ASSISTANCE PROGRAM PARTICIPATION RATES IN 2010 TThe Supplemental Nutrition Assistance Program (SNAP) is a central component of American policy to alleviate hunger and poverty.
Chapter 4. Consumer Choice. A Consumer s Budget Constraint. Consumer Choice
 Chapter 4 Consumer Choice Consumer Choice In Chapter 3, we described consumer preferences Preferences alone do not determine choices We must also specifi constraints In this chapter, we describe how consumer
Estimating the Number of People in Poverty for the Program Access Index: The American Community Survey vs. the Current Population Survey.
 Background Estimating the Number of People in Poverty for the Program Access Index: The American Community Survey vs. the Current Population Survey August 2006 The Program Access Index (PAI) is one of
PRACTICE QUESTIONS CHAPTER 5
 CECN 104 PRACTICE QUESTIONS CHAPTER 5 1. Marginal utility is the: A. sensitivity of consumer purchases of a good to changes in the price of that good. B. change in total utility realized by consuming one
Fiscal Policy Project
 Fiscal Policy Project How Raising and Indexing the Minimum Wage has Impacted State Economies Introduction July 2012 New Mexico is one of 18 states that require most of their employers to pay a higher wage
medicaid a n d t h e How will the Medicaid Expansion for Adults Impact Eligibility and Coverage? Key Findings in Brief
 on medicaid a n d t h e uninsured July 2012 How will the Medicaid Expansion for Adults Impact Eligibility and Coverage? Key Findings in Brief Effective January 2014, the ACA establishes a new minimum Medicaid
MINIMUM WAGE WORKERS IN TEXAS 2016
 For release: Thursday, May 4, 2017 17-488-DAL SOUTHWEST INFORMATION OFFICE: Dallas, Texas Contact Information: (972) 850-4800 BLSInfoDallas@bls.gov www.bls.gov/regions/southwest MINIMUM WAGE WORKERS IN
Employer-Funded Individual Health Insurance
 Employer-Funded Individual Health Insurance ANNUAL REPORT 2016 1 EXECUTIVE SUMMARY This 2016 Annual Report is intended to provide a detailed, nationwide profile of how employers and employees are using