Fiscal Policy. 1 Macroeconomics Lecture 4
|
|
|
- Darren Bennett
- 5 years ago
- Views:
Transcription
1 The Role of the Government and Fiscal Policy Topic 4 1
2 Goals of the Lecture 1) Derive the Equilibrium on the Investment-Saving market - derive IS curve. 2) Definition of Budget Deficit and Government Debt. 3) Dynamics of Spending in US-EU for the last 40 years. 4) Ricardian Equivalence & Social Security Reform. 5) Tax Reforms, Taxes in the Labor Market, and Supply-Side. 6) Political Cycles, Volatility from Discretionary Spending. 7) Fiscal Policy in Emerging Markets (Argentina, Russia), Inequality, Kuznets curves, etc. 2
3 From Our Previous Work to Goods Market Equilibrium In Topic 2 we defined Aggregate Production. In Topic 3 we defined two main components of Aggregate Spending: Consumption and Investment. More specifically desired levels of Consumption (C d ) and Investment (I d ). We now consider the Equilibrium: aggregate quantity of goods & services demanded equals goods & services supplied (Y). 3
4 Goods Market Equilibrium Goods MKT Equilibrium Condition: Y = C d + I d + G + NX. (1) C d is a function of PVLR (Y, Y f, a), tax policy, expectations, r, etc. I d is a function of r, A f, K, and investment tax policy. G is a function of government policy. NX we will model in the last lecture of the course (for the U.S., NX is small, take it 0). Let us take Y (supply) as given. Let us postpone p studying G in detail to later today. NX in future lectures. 4
5 Goods Market Equilibrium (Cont.) For given Y, we can re-express (1) as: S d = Y - C d -G = I d. (2) when NX = 0 Desired Saving = Desired Investment Equilibrium: The resources not consumed by private households or the government are channeled to firms that use them to finance investment. So what links S d to I d? The Real Interest Rate, r. In equilibrium S = I. We defined I as negative function of r in Topic 3 by looking at MPK f = UC f. r fl I d. We also considered saving and consumption decisions as a function of r. Assume now substitution effect dominates (true empirically). r fl S d. 5
6 Goods Market Equilibrium (Cont.) r S d r * 0 I d I* I,S 6
7 Goods Market Equilibrium (Cont.) r S d r * r 0 S I At r Desired investment tis higher h than desired d saving, hence the price of saving (r) is going to increase, converging to 0 I d I* If investors want to borrow (I ) more than savers are willing to lend (S ), this will be bid up the price of saving (r). 7 I,S
8 Example: Increase in output (Y > Y) r S d = Y C d G S d = Y C d G r * 0 r * 1 I d I* I * I* I,S 8
9 The IS Curve The IS curve relates Y to r. For any level of output Y the IS curve shows the value of r for which the goods MKT is in Equilibrium. How do interest rates relate to Y? As Y increases, Desired Saving increases, decreasing the Real Interest Rate that clears the goods market. Alternatively think of IS as: Y = C(r) + I(r) + G where C and I are negative in r. IS curve is downward sloping in (r, Y) space. 9
10 Building the IS Curve r I d S d = Y C d G S d = Y C d G r IS r * 0 r * 1 r * 1 r * 0 I* I * I* I,S Y Y 10
11 The IS Curve (Cont.) IS curve represents demand side of the economy. The IS curve is named as is because it documents the relationship between Saving and Investment (holding NX constant to 0). We represent the demand side of the economy, drawn in (r,y) space as the I-S curve. Why IS? Because the demand side of the economy can be boiled down to I = S (when NX is zero). Alternatively think of IS as: Y = C(r) + I(r) + G where C and I are negative in r. 11
12 Demand Side Analysis (IS Curve) r r IS Y Y Suppose r is set by the Fed at the level of r (we will explore this in depth later in the course). For a given r, we can solve for the level of output desired by the demand side of the economy. 12
13 Some Thoughts on IS Curve What shifts the IS curve? Anything that causes Desired C, I or G to change (or NX when we model it). What shifts IS curve to the right? (i.e., makes Y higher on the demand side of the economy). Increase in consumer confidence (expectations of future PVLR). Permanent increase in stock market wealth. A permanent reduction in income taxes (if households are PIH or Keynesian). A temporary reduction in income taxes (if households are Keynesian or Liquidity Constrained PIH). An expected future increase in TFP (stimulates investment demand). Anything shifting MPK up. An increase in government spending (i.e., war). Changes in r WILL NOT cause IS curve to shift (causes movement along IS curve). 13
14 Example 1: Suppose Consumer Confidence Falls r Suppose consumer confidence falls. Desired saving increases, decreasing the real interest rate that clears the goods market at any Y. IS curve will shift in. C falls r* r* Y 1 IS 1 Y* IS Y 14
15 Example 2: Suppose Future TFP Increases r Suppose future TFP increase. Desired investment increases (MPK goes up), increasing the real interest rate that clears the goods market at any Y. IS curve will shift out. A f increases r* r* Y* IS IS 1 Y 1 Y 15
16 Example 3: Suppose Population Increases (N goes up next period) r Suppose N f goes up. Desired investment increases (MPK goes up), increasing the real interest rate that clears the goods market at any Y. IS curve will shift out. MPK goes up r* r* Y* IS IS 1 Y 1 Y 16
17 Example 4: Suppose Government Spending Rises r Suppose Government Spending increases (and no effect on Y*). Desired saving decreases, increasing the real interest rate that clears the goods market. IS curve will shift out. r* G rises r* Y* IS IS 1 Y 1 Y 17
18 Fiscal Policy: Government Enters the Picture The last graph was a simple example of how G can enter the picture in influencing the goods market equilibrium. What is the role of Government? This Lecture Fiscal policy. Next Monetary Policy. We start from the components of government budget. Then shift our attention on they can be used. Government Expenditures; Government Receipts; Government Deficit and Surpluses. Government Debt. 18


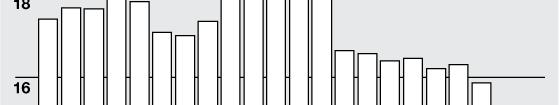
19 Outlays of the Government: Canada INT G 19
20 Outlays of the Government US (G + Tr + INT) about 33% of GDP (Y). Government Purchases of Goods and Services. Government Investment (1/6 of Total) in Capital Goods and Consumption (5/6). Huge jumps during WWII, Korea, Viet Nam, Gulf Wars. Transfer Payments. (Social Security, Welfare, Unemployment Insurance). Increasing steadily after Why? Interest payments to holders of Government Debt (net of interest received). Very sharp increase to repay War debt after WWII. But also high h in the periods of high h interest t rates ( ). 1989) Relatively small government in the US. (G + Tr + INT) about 56% of GDP (Y) in Sweden! 20


21 Revenues of the Government: Canada EI=Employment Insurance Goods & Services Tax 21


22 Revenues of the Government: Canada 22
23 Revenues of the Government T = Revenue Side of the Budget. T/GDP : 16% in 1940; 29.6% in 2000; 27.2% in The income tax on individuals is the federal government's principal source of funds to cover its outlays. First U.S. income tax law was enacted in Effectively from 1913, but de facto introduced after WWII. Income Taxes/GDP : 1.7% in 1940; 8.7% in 1945; 10% in Contributions to Social Insurance (Payroll taxes, like Social Security taxes) are now 8% of GDP; Sales Taxes are 6% of GDP; Corporate taxes are 2-3% of GDP. Small fiscal pressure relative to EU. France s T/GDP is 54%! 23
24 Total Revenues and Outlays as a Percentage of Gross Domestic Product, 1970 to Federal Government only. Percent Source: Congressional Budget Office 24
25 Decomposition of Total Revenues as Percentage of GDP, 1929 to Source: Urban Institute, Changes in Total Government Tax Receipts Since
26 Federal vs. State Government In 2005 Federal Government was about $2,520 billion; State Government was about $1,544 billion. FED IN: The income tax on individuals is the federal government's principal source of funds to cover its outlays. In 1999 income taxes brought in about 48% of total federal revenues, 42% in Second place are Contributions to Social Insurance -- 39% in FED OUT: Transfer Payments are the federal government's principal outlay. 44% of total in Second place is government purchases -- 30% in 2005, 2/3 of which was Defense. Also a good 15% of outlays is dedicated to transfers to the State Governments (Grants in Aid). STATE IN: Grants in Aid received from the Fed are only 23% of total revenues for State Governments. The bulk (54% in 2005) comes from Sales Taxes. Income taxes account for only 18%. STATE OUT: State Governments main outlay are government purchases -- 74% in 2005, especially spending in education. Transfer Payments are the State government's second outlay. 26% of total in
27 Federal Government Finances: 2005 (in billions of US$) Current expenditures 3,898.8 Consumption expenditures 1,975.7 Current transfer payments 1,517.8 Current receipts 3,586.3 Current tax receipts 2,520.7 Personal current taxes 1,203.1 Government social benefits 1,484.0 Taxes on production and imports To persons 1,480.9 To the rest of the world Other current transfer payments to the rest of the world (net) Interest payments To persons and business To the rest of the world Subsidies Less: Wage accruals less disbursements 0.0 Net government saving Social insurance funds 65.4 Other Taxes on corporate income Taxes from the rest of the world 10.8 Contributions for government social insurance Income receipts on assets 98.3 Interest and miscellaneous receipts Dividends 2.4 Current transfer receipts From business (net) 30.1 From persons 72.0 Current surplus of government enterprises
28 State Government Finances: 2005 (figures in $1000) Current expenditures 1,470,462,458 General expenditure 1,280,597,790 Intergovernmental expenditure 403,467,210 Direct expenditure 877,130,580 General expenditures, by function: Education 455,104,018 Public welfare 368,806,663 Hospitals 42,751, Health 48,781,368 Highways 90,273,738 Police protection 11,362,668 Correction 40,689,366 Natural resources 18,360,179 Parks and recreation 5,395,996 Government administration 46,567,853 Interest on general debt 34,362,180 Other and unallocable 118,142,342 Current receipts 1,637,820,897 General revenue 1,282,347,838 Intergovernmental revenue 408,456,380 Taxes 648,111,258 General sales 212,906,626 Selective sales 98,527,139 License taxes 42,568,040 Individual income tax 220,254,617 Corporate income tax 38,691,026 Other taxes 35,163,810 Current charges 122,799,848 Miscellaneous general revenue 102,980,352 Utility revenue 14,627,471 Liquor store revenue 5,212,064 Insurance trust revenue 335,633,524 Utility expenditure 22,785,073 Liquor store expenditure 4,081,755 Insurance trust expenditure 167,974,677 Debt at end of fiscal year 798,355,198 28
29 How the US Federal Government Budget Comes About In the US each year the President proposes a Budget plan to Congress in early February. The US Congress operates in 3 steps: First, Lawmakers decide on the overall level of spending and taxes. Second, they divide that overall figure into separate categories -- for national defense, health and human services, and transportation, for instance. Third, Congress considers individual appropriations bills spelling out how the money in each category will be spent. Each appropriations bill ultimately must be signed by the President in order to take effect. Congress usually does not complete its work on appropriations bills until September. Most Lobbying activities are directed to Budget and Appropriations Committee. 29
30 Fiscal Policy Fiscal policy is the use of government spending (G) and taxes (t n ) to stabilize the economy. Governments can have: Output targets Price targets Unemployment targets. Stabilizing the economy means moving the economy towards its targets. We will ignore price targets for now (we have no prices in our model yet). Suppose the government has an output target and suppose that target is Y* (we will also explain why Y* is a good target later in the course). Fiscal policy is the manipulation of G and t n to move the economy towards Y*. (Assumes government knows where Y* is - we will discuss other drawbacks to fiscal policy later). 30
31 Example of Fiscal Policy: Consumer Confidence Falls Government can undo the decline in consumer confidence by increasing G or decreasing t n (if agents are non-ricardian) - this is fiscal policy. r C falls r* r* G increases IS 1 IS = IS 2 Y 1 Y* Y Compute Change in G: If ΔG = -Δ Δ consumer confidence, Y will remain unchanged (taking r as fixed) 31
32 Government Spending, Deficits and Interest Rate Let us start with some definitions about public debt and deficits. Tax Revenues = T 0 +ty n Transfers = Tr 0 g Y (linear approximation) (linear approximation, g is the relationship between Tr and Y). When Y increases, Taxes increase (more earnings in economy). When Y increases, Transfers fall (less people on welfare). Actual Government Deficits is the actual budget deficit in the current period. G + Tr + INT - T = G + (Tr 0 g Y) + INT -T 0 -t n Y = G + Tr 0 + INT T 0 (t n +g) Y (where Y is current period GDP and INT is interest paid on existing Gov. debt). For now, assume T 0 = Tr 0 = Interest = 0 Actual Deficit (when above set to Zero) = G (t n +g) Y 32


33 Canadian Budget Surplus Share 33
34 US Federal Budget Deficit Share* * Positive numbers are surpluses. 34
35 Government Spending, Deficits and Interest Rate.. Structural Budget Deficit is the deficit that would exist in the economy that would occur at potential output Y*: G - T = G (t n + g)y* Cyclical Deficits: Actual Deficits - Structural Deficits. Difference is due to Automatic Stabilizers (Provisions in the budget that increase outlays in recessions and revenues in booms automatically). Examples: i) Taxes are high when the economy expands and low when it contracts; ii) Unemployment transfers are low when the economy expands and high when it contracts. 35
36 Types of Deficits In general: Deficits are countercyclical! (They rise when Y falls and fall when Y rises) Even if the government has a policy (combination of G and T) that would lead to no deficits at Y* (the target level of output for the economy), deficits could still occur (the reason: Y does not always equal Y*). Why do we get countercyclical deficits? Automatic Stabilizers! Welfare Payments, Unemployment Insurance, and Tax System dampen the effects of consumption over the business cycle. Again: T goes up when times are good (like in the late 1990s). G/Tr goes up when times are bad (welfare payments). Given Automatic Stabilizers (and potentially proactive governmental fiscal policies), cyclical deficits seem to be an inherent part of our economy. 36
37 Examples of Counter-cyclical Deficits: Small Deficits (or Surpluses) at the end of the 1990 s Expansion Source: the Economist. 37


38 Examples of Counter-cyclical Deficits: The Financial Crisis and Canada Vs. US 38


39 Examples of Counter-cyclical Deficits: The Financial Crisis and Canada 39


40 International Budget Surplus Shares 40
41 Graphing Deficits When Policy Is Constant (i.e. G, T 0, Tr 0, g, t n fixed) Even when the structural deficit is close to zero (i.e. (G +Tr 0 -T 0 )/(t n + g) = Y*), actual deficits can be large when Y < Y*! Deficit Outlays > Revenues 0 Y* Outlays < Revenues Structural Deficit = G +Tr 0 -T 0 (t n + g)y* Actual Deficit = G +Tr 0 -T 0 (t n + g)y Y 41
42 Graphing Deficits When Policy Is Constant (Cont.) When Y < Y* (the US in the 2001, Japan in ) 1993) deficits increase. Even when the structural deficit is close to zero. This is because revenue weaken and transfer increase. However in the US after 9/11 there was a shift in spending (defense) and President Bush implemented a Tax Cut in See your readings on the Economist about the US deficit and its fluctuations. So what happens to our previous graph when policy changes? 42
43 Graphing Deficits When Policy Changes What happens to actual and structural deficits when G increases to G? Deficit G +Tr 0 -T 0 G+Tr 0 -T 0 0 Y* Structural Deficit = G+Tr 0 - T 0 (t n +g)y* Y Actual Deficit = G +Tr 0 -T 0 (t n + g)y Changing government policy affects both structural and actual deficits! 43


44 Actual and Structural (Standardized) Surplus Note positive values are Surpluses, negative Deficits. Source: Congressional Budget Office 44
45 National Government Budgets for 2004 (in billions of US$) Exp / Budget Deficit / Nation GDP Revenue Expenditure GDP Deficit GDP US (federal) % % -4.07% US (state) % 5% 0.40% Japan % % -7.57% Germany % -8.33% -3.70% UK % -7.43% -2.95% France % -7.46% -3.75% Italy % -6.77% -3.25% China % -9.75% -1.94% Spain % -0.52% -0.20% Canada (federal) % 4.00% 0.67% South Korea % -3.33% -0.83% 45
46 Should Governments Try To Prevent Deficits? Examples: U.S. Balanced Budget Amendment. Criteria for entry to EMU that deficit/gdp be 3% or less and that debt/gdp be 60% or less. Benefits: Limit Spending: If it spends today, government must: 1) Raise Taxes Now (Changing Taxes Frequently Creates Economic Uncertainty) 2) Raise Taxes in Future (Higher Taxes Cause also Incentives to be Distorted). 3) Print Money in Future (Could Lead to Inflation) Is there a cost? Yes - balanced budget amendments can make economic situations worse. Example: consumer confidence falls. As Y falls, tax revenues fall. As tax revenues fall, deficits (cyclical) increase. If the government has to balance the budget, it would either have to cut G or increase T - both of which would cause the IS curve to shift further to the left. Conclusion - it may be bad to have policies requiring governments to eliminate all deficits, but there may be some benefits from eliminating structural deficits. 46
47 Costs and Benefits of Government Spending Consumption G Governments can provide services that may be inefficiently provided in private sector (i.e., Police protection, parks, post office, etc). Investment G Governments can provide investment that is used as an input into other production (i.e., Highway and transportation infrastructure, bridges, enforce property rights). Training and Education G (another form of Investment G = Increase Human Capital) Governments can train the work force (i.e., Student loan programs, public education, state colleges, etc). Cost to Government Spending????? --- Diverts resources from private sector! Benefits of Government Spending???? --- Helps increase A in a country (roads, property rights, skilled labor, NSF grants). Provides goods not provided in market place. Must compare the benefits to the costs of government spending! 47
48 Public Debt The US national debt on February 2014: $17.6 trillion (was $9.8 trillion in 2008) Per capita share of the national debt on February 2014: $54,800 Debt = Total Value of Government Bonds Outstanding at a Particular Time. Δ(Debt) = Deficit. If Government is spending more than it receives (there s a budget deficit), total debt has to go up. If the economy s nominal growth is strong then the ratio Debt/Nominal GDP goes down. The relationship between Deficit and Debt: Δ(Debt/Nominal GDP) = Deficit/Nominal GDP (Debt/Nominal GDP * Growth of nominal GDP) 48
49 Public Debt (Cont.) Prove the relationship between Deficit and Debt: Δ(Debt/Nominal GDP) = Deficit/Nominal GDP (Debt/Nominal GDP * Growth of nominal GDP) Define: Q = B/pY = Debt/Nominal GDP Start from the growth rate of the Debt/Nominal GDP ratio, ΔQ/Q = ΔB/B Δ(pY)/pY Multiply both sides by Q: ΔQ = ΔB/pY B/pY * Δ(pY)/pY ΔQ = ΔB/pY B/pY * (ΔY/Y + Δp/p) 49
50 US Federal Debt Held by the Public as a Percentage of GDP Financial Crisis Surpluses in the 1990 s Increase in outlays + high INT in 1980 s Source: Congressional Budget Office 50


51 Canada Debt Held by the Public as a Percentage of GDP 51
52 Public Debt: A Burden on Future Generations? Case for Yes: Higher deficits mean higher consumption G and (through lower T) higher C. Thus higher deficits potentially mean lower S(national). Lower S(national) results in lower I (S = I). Higher G crowds out I. Lower I today results in lower K for the next generation. All else equal, higher h government deficits today could reduce the earnings potential (Y) of future generations. Case for No: Higher deficits can come from higher investment G (infrastructure, education) that create higher future A. Higher future A (TFP) could make future generations better off even if future K is lower. 52
53 Does the Debt Payback Hurt Future Generations? If we run deficits today, future generations will have to pay for our spending. Policy makers often say that - our spending today will decrease the consumption of our children by X% - they will have to take their hard earned money and pay taxes to cover our spending binge. When government borrows to finance a deficit - they borrow from the current generation (give bonds to me and you). Eventually, these bonds will end up in the hands of the future generation (we will leave them to future generation - directly or indirectly). When government repays the debt - it will take taxes from the future generation and use that revenue to pay off the same future generation -they own the debt! (caveat - some debt is held by foreign citizens and some people own more bonds than others). Summary: when we leave a deficit to our children, we leave them both the assets and the liabilities associated with the debt. The paying back of debt is a zero sum game (just a reshuffling in the economy)! Are Deficits bad for future generations? e Could be (see prev. slide) - but, it has nothing to do with the fact that the deficit has to be repaid (unless most is held by foreigners). 53
54 Are Deficits Bad, Part 2: Ricardian Equivalence Hold the amount of G constant. Assume that current taxes exactly finance this level of spending and debt is zero. Assume people live forever and it is possible to borrow and lend at r. Suppose now the Government decides to cut taxes and the Government instead floats debt B to finance the spending today. Q: What tdo you think kis going to happen to consumption and saving? Do you think that the extra disposable income is going to be saved or consumed? Hint: We know that under PIH all people care is PVLR. Has that changed? 54
55 Ricardian Equivalence Ricardian Equivalence: Theory that states that consumers behavior is equivalent regardless if the government finances G (government expenditures) through increased taxes or through increased debt B. <<Take money from consumers today higher T, or take money from them tomorrow to repay (1+r)B, the PVLR is unchanged>> If the government floats debt to finance the spending today, consumers realize that the government, at some time in the future, will have to raise taxes to pay back the debt. As a result, a reduction in taxes today (for given G today) will be seen as being accompanied by higher taxes in the future. Households will save today to fund the future tax increases (they expect disposable income in the future to fall). National Saving would remain unchanged. Does this theory hold empirically? NO! Private Saving was falling during the large deficits of the 80s. People, when asked, tend not to think this way. 55
56 Ricardian Equivalence Recall from Topic 3 that Giorgio maximize U(c, c f ) in a two period model (current = period 1, future = period 2) U(.) = ln(c) + β ln (c f ) (log utility - for simplification, β = Discount Factor - i.e., how much you like eating today versus tomorrow) The two ways: c f = (y + a - T - c) (1 + r) + y f (Taxes, Budget Constraint; a = Initial Wealth) c f = (y + a - c) (1 + r) + y f -T f (Bonds, Budget Constraint; a = Initial Wealth) Suppose all bonds are held by foreigners for simplicity. B = T is the policy change that was implemented (change from taxes to bonds). To repay the bonds fully in period 2 T f =B (1 + r) =T (1 + r). Notice: they are equivalent. 56
57 Ricardian Equivalence: Consumption Continued Why Doesn t it hold: Myopia; Liquidity Constraints; High Levels of Impatience; Do not care about bequests/future generations; Timing of Taxes is Important (taxes are not lump sum). If Ricardian Equivalence did hold, running a deficit would not affect national savings for the economy. In this case (with a closed economy), I = S, so Investment would not change! A tax cut would be entirely saved. If Ricardian Equivalence did not hold, decreasing T could cause C to increase (an income effect). A tax cut could be mostly consumed. 57
58 The Fiscal Problem of the 21 st Century Source: Congressional Budget Office 58
59 Sustainability of the US Government Spending Congressional Budget Office (CBO) report in 2002: A 125-Year Picture of the Federal Government's Share of the Economy, 1950 to Fed Government spending (as a share of GDP): 19% on average period Projection: 39.7% by 2075 These projections assumes no change in policy: Current entitlement rules Current level of benefits Reasonable future path of wages Current tax structure Projected expenditure share: 30% non-interest spending 10% interest payments Note components of Gov t share: Medicare Medicaid Social Security 59
60 Expenditure of Entitlement Programs Expenditure on Medicare, Medicaid and Social Security: 0.3% of GDP in % of GDP in 2000 Projected: 13.9% in 2030 Projected: 21.1% in 2075 Why such increase? Increased generosity. Increased eligibility: Number of people working for each person aged 65 and above: in in Projected 2.8 in Projected 2.4 in 2075 Implication: if taxes remain stable at 19%, no funds for defense, research, environmental programs, unemployment insurance, etc. 60
61 Expenditure of Entitlement Programs: a Breakdown Expenditure on Social Security: 4.2% of GDP in 2000 Projected 6.2% of GDP in 2030 Projected stable Expenditure on Medicare and Medicaid: 3.4% in 2000 Projected 7.7% in 2030 Projected 14.9% in 2075 How much do we value spending on health? Research by Jones (2001): benefits of spending on health (increase in life expectancy) outweigh the costs. Bottom line: either tax structure t or benefit entitlement t rules have to change! 61
62 Implement a Social Security Program Consider two PIH adults who are similar in all respects (lifetime resources, life span, timing of income, etc) except the first is in period 1 of her life and the second is in period 3 of her life (suppose all households only live three periods: young worker, mature worker and retired). Here are their consumption/income/saving profiles. Each live three years; r = 0, β = 1, H = 0 (assume same utility function from last lecture i.e. smooth consumption). Period: Income: Consumption: Saving:
63 Implementing a Social Security Program Suppose the government unexpectedly taxes the young $3 this period to give to the old. (The old get $3). Current tax receipts from workers are used to pay current benefits to retirees. What happens to the consumption of the young? Nothing: PVLR has not changed! What happens to saving of the young. Young save less now than they otherwise would (-3 now compared to 0 before). What happens to the consumption of the old? It increases consumption by $3 in the last period of their life. Saving does not change (they dissave $8 in both cases) Total Saving for society falls by $3 and consumption increases by $3 at the time the program is implemented! Note: Like Expected Income Increases, Expected Transfers have no effect once they are implemented. 63
64 Reforming the Social Security Program In a Pay-As-You-Go system the size of the young cohort that pays taxes has to be larger or comparable to the size of the retirees. If there is a discrepancy, the government has to do for the difference increasing i taxes (in reality it emits IOU s bonds that later repays). Suppose now you want to move to a Fully Funded Social Security System. An example are Private Retirement Accounts PRAs. What happens to the consumption of the old? They paid the $3 when young. However if we are going to fully fund the young, the old won t get their whole $3. Why? We increased consumption to the old by $3 in the last period of their life without them paying enough contributions (actually 0). 64
65 Reforming the Social Security Program (Cont.) In a Pay-As-You-Go system the size of the young cohort that pays taxes has to be larger or comparable to the size of the retirees. To move to a fully-funded system a cut (at least partial) of the benefit for current retirees is necessary. This is the main problem in reforming Social Security systems in Europe. Current generation of next-to-retirement would be left without pension. For this reason most transition democracies in Central and Eastern Europe chose to complement their Social Security systems with Individual retirement schemes. Employees and, in some cases, employers must contribute t a certain percentage of earnings to an individual account managed by a public or private fund manager chosen by the employee. (Bulgaria, Hungary, Latvia, Poland, Russia). 65
66 Reforming the Social Security Program (Cont.) 66
67 The Effects of Taxes on Incentives Substitution and Income effects of Income Taxes. Average Tax Rate: Total Taxes Paid/(Before-Tax Income) Marginal Tax Rate: Tax on the additional $1 of income (i.e. on the marginal dollar). The maximum effective marginal income tax rate is around 39.6 percent for taxpayers, depending on their level of deductions. Increase Average Tax Rate, Keep Marginal Tax Rate Constant: Income Effect >> Labor Supply Increases (you are poorer, consume less leisure). Increase Marginal Tax Rate, Keep Average Tax Rate Constant: Substitution Effect >> Labor Supply decreases (leisure is cheaper, consume more leisure). 67
68 The Effects of Taxes on Incentives: Examples 1981 ERTA Tax cut. Decrease Average Tax Rate, Decrease Marginal Tax Rate: Income Effect >> Labor Supply decreases (you are richer, consume more leisure). Substitution Effect >> Labor Supply increases (leisure is more expensive, consume less leisure). EMPIRICAL RESULT: NO EFFECT ON LABOR SUPPLY Tax Reform Act. Constant Average Tax Rate, Decrease Marginal Tax Rate: Income Effect >> None. Substitution Effect >> Labor Supply increases (leisure is more expensive, consume less leisure). EMPIRICAL RESULT: INCREASE IN LABOR SUPPLY. 68
69 Supply Side Economics: The effect of Taxes on Incentives Emphasizes substitution effects of marginal tax rates. Says people would work more if t n were lower and would save more if t s were lower. Where they are wrong: Tax cuts (lower t n /t s and lower T) have income effects which can potentially dominate. N falls (and S falls). Where they are right: Tax Reforms (lower t but T=0) do not have income effects. N and S (efficiently) rise. Where they may be right: Positive effects on human capital investment? Becker and Lucas of the U of C think so. 69
70 Notes on Supply Side Economics By Tax Reform economists mean revenue-neutral reform in the way taxes are collected. In some Flat Tax proposals this involves eliminating tax deductions (e.g. home mortgage interest) and lowering income tax rates. To see how this can be revenue-neutral, suppose T = t n *(Y - D) where D = tax deductions. One can lower t n and D so that, for a given Y, T will be unchanged. Tax reforms that lower t n s have substitution effects, but no income effects since T=0. Such Tax Reforms have positive effects on labor supply and on private saving (with no negative effects on government saving). Why is increasing N and S efficient? Because, relative to an efficient tax code, the existing i tax code discourages N and S(household). h The most efficient i (but not necessarily the most fair or feasible) tax code would be a lump sum tax on all individuals: every individual would pay the same tax. Thus individuals would face zero marginal tax rates -- they could keep 100% of marginal income. The current tax code has positive marginal tax rates and lots of deductions. Moving from the current tax code to a lump sum tax would be a Tax Reform with positive substitution effects. Thus, compared to the efficiency ideal of a lump sum tax, the current tax code encourages people to substitute away from N and S(household). 70
71 Taxes Affect Social Security through Incentives to Work 71
72 Other Direct Incentives: Tax System Simplification Source: the Economist. See readings for a favorable analysis of the introduction 72 of a flat tax in Macroeconomics Russia Lecture 4
73 BONUS MATERIAL: Political Budget Cycles Emphasizes the role of politics in government in affecting size and timing of deficits and spending. The relationship between political motivations and the nature of macroeconomic policies and outcomes (2 initiators Nordhaus and Hibbs). Opportunistic Cycles: Politicians spend more to boost the economy close to elections in order to get elected. True prevalently in emerging markets (evidence from Argentina, Russia ss regional elections, Brender and Drazen 2004). Partisan Cycles: Parties have political platforms/tastes that hinge on specific economic variables (Democrats like high employment, Social Insurance Spending, Republicans like low inflation). Evidence in the US is strong. Unemployment is lower and economic growth is higher under Democrats than Republicans. Inflation is lower under Republicans. 73
74 Political Budget Cycles (Cont.) But precisely because of their different tastes Democrats and Republicans are historically as likely to have large budget deficits. Democrats like high h spending in Social Insurance (unemployment insurance, welfare). But are also more likely to raise taxes. Republicans like small government and little spending on government purchases (with the exception of defense). But are also more likely to cut taxes. 74
75 75
76 Political Budget Cycles in LCD Ames (1987) presents a panel study of 17 Latin American countries where over the period , 1982, government expenditures increased by 6.3% in the pre- election year and decreased by 7.6% in the year after the election. Evidence Ben-Porath (1975) for Israel over the period , Krueger and Turan (1993) for Turkey over the period , and Gonzàlez (2002), for Mexico over the period Brender and Drazen (2004) confirm the presence of opportunistic cycles in new democracies. 76
77 Conclusions on Topic 4 Derive the IS curve. Main components of the Government budget. The role of fiscal policy. Deficit, Debt. Future challenges to fiscal policy and Social Security. Political cycles in deficits. 77
The role of the government and fiscal policy
 The role of the government and fiscal policy Topic 4 1 Goals of the lecture 1) Derive the equilibrium on the investment-saving market - derive IS curve. 2) Definition of budget deficit and government debt.
The Role of the Government and Fiscal Policy
 TOPIC 4 Th R l f h G d The Role of the Government and Fiscal Policy Federal Budget Deficit Share* * Calculations by Jeff Frankel (Harvard Econ Professor) 2 Outline Putting together savings and investment
Outline. Government and Fiscal Policy. Government deficit and debt. Should we worry about deficit? Ricardian Equivalence. Taxes and Incentives
 Government and dfiscal lpolicy Outline Government and Fiscal Policy Government deficit and debt Should we worry about deficit? Ricardian Equivalence Social lsecurity Taxes and Incentives 2 Government Outlays
Macroeconomics in the World Economy: Theory and Applications Topic 4: Fiscal Policy
 Macroeconomics in the World Economy: Theory and Applications Topic 4: Fiscal Policy Dennis Plott University of Illinois at Chicago Department of Economics http://blackboard.uic.edu Spring 2014 Plott (ECON
Economics 10020/20020 Principles of Macroeconomics The Government & Fiscal Policy
 on Economics 10020/20020 Principles of Macroeconomics & Dennis C. Plott University of Notre Dame Department of Economics www.dennisplott.com Spring 2015 Dennis C. Plott (Notre Dame) & ECON 10020/20020
Chapter 15. Government Spending and its Financing Pearson Addison-Wesley. All rights reserved
 Chapter 15 Government Spending and its Financing Chapter Outline The Government Budget: Some Facts and Figures Government Spending, Taxes, and the Macroeconomy Government Deficits and Debt Deficits and
10. Fiscal Policy and the Government Budget
 10. Fiscal Policy and the Government Budget 1 The Government Budget The government s budget is affected by: Government spending (outlay) Tax revenue (income) 2 Government Spending Major components of government
QUIZ 4: Macro Winter Question 1. Would you expect a country to have a larger Deficit/GDP ratio or a Debt/GDP ratio?
 Name: QUIZ 4: Macro Winter 2011 You must always show your thinking to get full credit. Question 1 Would you expect a country to have a larger Deficit/GDP ratio or a Debt/GDP ratio? You would expect the
Consumption, Saving, and Investment. Chapter 4. Copyright 2009 Pearson Education Canada
 Consumption, Saving, and Investment Chapter 4 Copyright 2009 Pearson Education Canada This Chapter In Chapter 3 we saw how the supply of goods is determined. In this chapter we will turn to factors that
Road Map. Does consumption theory accurately match the data? What theories of consumption seem to match the data?
 TOPIC 3 The Demand Side of the Economy Road Map What drives business investment decisions? What drives household consumption? What is the link between consumption and savings? Does consumption theory accurately
Intermediate Macroeconomic Theory. Costas Azariadis. Costas Azariadis. Lecture 11: Fiscal Policy
 Lecture 11: Fiscal Policy 1.FACTS & FIGURES a) The gov t budget -outlays G (purch.) TR(transfers) INT (int. payments) TR~ Social Security Pensions to gov t employees Unemployment Insurance Welfare checks
Chapter 25 Fiscal Policy Principles of Economics in Context (Goodwin, et al.)
") Chapter 25 Fiscal Policy Principles of Economics in Context (Goodwin, et al.) Chapter Overview This chapter introduces you to a formal analysis of fiscal policy, and puts it in context with real-world
Chapter 25 Fiscal Policy Principles of Economics in Context (Goodwin, et al.) Chapter Overview This chapter introduces you to a formal analysis of fiscal policy, and puts it in context with real-world
MID-TERM EXAM #2: Intermediate Macro Winter 2014
 MID-TERM EXAM #2: Intermediate Macro Winter 2014 Name: Student Number: State clearly your assumptions when you derive a result. You must always show your thinking to get full credit. You have 1 hour and
Understanding the World Economy. Fiscal policy. Nicolas Coeurdacier Lecture 9
 Understanding the World Economy Fiscal policy Lecture 9 Nicolas Coeurdacier nicolas.coeurdacier@sciencespo.fr Lecture 9 : Fiscal policy 1. Public spending 2. Taxation 3. Debt and deficits 4. Fiscal policy
Micro-foundations: Consumption. Instructor: Dmytro Hryshko
 Micro-foundations: Consumption Instructor: Dmytro Hryshko 1 / 74 Why Study Consumption? Consumption is the largest component of GDP (e.g., about 2/3 of GDP in the U.S.) 2 / 74 J. M. Keynes s Conjectures
Business Cycles II: Theories
 Macroeconomic Policy Class Notes Business Cycles II: Theories Revised: December 5, 2011 Latest version available at www.fperri.net/teaching/macropolicy.f11htm In class we have explored at length the main
Chapter 4. Consumption and Saving. Copyright 2009 Pearson Education Canada
 Chapter 4 Consumption and Saving Copyright 2009 Pearson Education Canada Where we are going? Here we will be looking at two major components of aggregate demand: Aggregate consumption or what is the same
Lecture 7. Fiscal Policy
 Lecture 7 Fiscal Policy The role of government spending and taxes Fiscal policy: government spending and tax policy AD = C + II + G What if G changes? What is the effect on Y? How large is (government)
Lecture III Federal Deficits and Debt Financial & Macroeconomic Perspectives Social Security Accounting. Page 1
 Lecture III Federal Deficits and Debt Financial & Macroeconomic Perspectives Social Security Accounting Page 1 Agenda The Government Budget, Deficits and Debt The Gov t Spending and Tax Multiplier and
International Macroeconomics
 Slides for Chapter 3: Theory of Current Account Determination International Macroeconomics Schmitt-Grohé Uribe Woodford Columbia University May 1, 2016 1 Motivation Build a model of an open economy to
Setting the Annual Budget
 14 Fiscal Policy Introduction The 2000s have been a decade of fiscal policy: The Economic Stimulus Act of 2008 cost $152 billion. The American Recovery and Reinvestment Act of 2009 was a $789 billion package
The Influence of Monetary and Fiscal Policy on Aggregate Demand
 Chapter 32 The Influence of Monetary and Fiscal Policy on Aggregate Demand Test B 1. Of the effects that help explain why the U.S. aggregate demand curve slopes downward the a. wealth effect is most important
Review: Markets of Goods and Money
 TOPIC 6 Putting the Economy Together Demand (IS-LM) 2 Review: Markets of Goods and Money 1) MARKET I : GOODS MARKET goods demand = C + I + G (+NX) = Y = goods supply (set by maximizing firms) as the interest
Notes 6: Examples in Action - The 1990 Recession, the 1974 Recession and the Expansion of the Late 1990s
 Notes 6: Examples in Action - The 1990 Recession, the 1974 Recession and the Expansion of the Late 1990s Example 1: The 1990 Recession As we saw in class consumer confidence is a good predictor of household
Macroeconomics Study Sheet
 Macroeconomics Study Sheet MACROECONOMICS Macroeconomics studies the determination of economic aggregates. Output tends to rise in the long run (longterm economic growth), but fluctuates in the short run
Please choose the most correct answer. You can choose only ONE answer for every question.
 Please choose the most correct answer. You can choose only ONE answer for every question. 1. Only when inflation increases unexpectedly a. the real interest rate will be lower than the nominal inflation
15 th. edition Gwartney Stroup Sobel Macpherson. First page. edition Gwartney Stroup Sobel Macpherson
 Alternative Views of Fiscal Policy An Overview GWARTNEY STROUP SOBEL MACPHERSON Fiscal Policy, Incentives, and Secondary Effects Full Length Text Part: 3 Macro Only Text Part: 3 Chapter: 12 Chapter: 12
Understanding the World Economy Master in Economics and Business. Fiscal policy. Nicolas Coeurdacier
 Understanding the World Economy Master in Economics and Business Fiscal policy Lecture 9 Nicolas Coeurdacier nicolas.coeurdacier@sciencespo.fr Lecture 9 : Fiscal policy 1. Public spending 2. Taxation 3.
INTERMEDIATE MACROECONOMICS
 INTERMEDIATE MACROECONOMICS LECTURE 6 Douglas Hanley, University of Pittsburgh CONSUMPTION AND SAVINGS IN THIS LECTURE How to think about consumer savings in a model Effect of changes in interest rate
The Influence of Monetary and Fiscal Policy on Aggregate Demand P R I N C I P L E S O F. N. Gregory Mankiw. Introduction
 C H A P T E R 34 The Influence of Monetary and Fiscal Policy on Aggregate Demand P R I N C I P L E S O F Economics N. Gregory Mankiw Introduction This chapter focuses on the short-run effects of fiscal
1. When the Federal government uses taxation and spending actions to stimulate the economy it is conducting:
 1. When the Federal government uses taxation and spending actions to stimulate the economy it is conducting: A. Fiscal policy B. Incomes policy C. Monetary policy D. Employment policy 2. When the Federal
Consumption, Saving, and Investment. 1 Macroeconomics Lecture 3
 Consumption, Saving, and Investment t Topic 3 1 Goals for Today s Class Start Modeling Aggregate Demand (AD) What drives business investment decisions? Does investment theory accurately match the data?
Final Exam Macroeconomics Winter 2011 Prof. Veronica Guerrieri
 Final Exam Macroeconomics Winter 2011 Prof. Veronica Guerrieri Name (print): Name (signature): Section Registered (circle one): T 1:30 T 6:00 W 1:30 As always, the honor code rules are in effect. You know
Fiscal policy: Ricardian Equivalence, the e ects of government spending, and debt dynamics
 Roberto Perotti November 20, 2013 Version 02 Fiscal policy: Ricardian Equivalence, the e ects of government spending, and debt dynamics 1 The intertemporal government budget constraint Consider the usual
DEFICITS AND DEBT Macroeconomics in Context (Goodwin, et al.)
") Chapter 16 DEFICITS AND DEBT Macroeconomics in Context (Goodwin, et al.) Chapter Overview This chapter expands on the material from Chapter 10, from a less theoretical and more applied perspective. It
Chapter 16 DEFICITS AND DEBT Macroeconomics in Context (Goodwin, et al.) Chapter Overview This chapter expands on the material from Chapter 10, from a less theoretical and more applied perspective. It
TOPIC 9. International Economics
 TOPIC 9 International Economics 2 Goals of Topic 9 What is the exchange rate? NX back!! What is the link between the exchange rate and net exports? What is the trade deficit? How do different shocks affect
FINAL EXAM. Name Student ID 1. C 2. B 3. D 4. B 5. B 6. A 7. A 8. D 9. C 10. B 11. C 12. B 13. A 14. B 15. C
 FINAL EXAM Name Student ID Instructions: The exam consists of three parts: (1) 15 multiple choice questions; (2) three problems; and (3) two graphical questions. Please answer all questions in the space
In this chapter, look for the answers to these questions
 In this chapter, look for the answers to these questions How does the interest-rate effect help explain the slope of the aggregate-demand curve? How can the central bank use monetary policy to shift the
MODERN PRINCIPLES: MACROECONOMICS. Tyler Cowen George Mason University. Alex Tabarrok George Mason University. Worth Publishers
 MODERN PRINCIPLES: MACROECONOMICS Tyler Cowen George Mason University Alex Tabarrok George Mason University Worth Publishers CONTENTS Preface xv CHAPTER 1 The Big Ideas 1 Big Idea One: Incentives Matter
Classroom Etiquette. No reading the newspaper in class (this includes crossword puzzles). Attendance is NOT REQUIRED.
. Attendance is NOT REQUIRED.") Classroom Etiquette No reading the newspaper in class (this includes crossword puzzles). Limited talking No Texting. Attendance is NOT REQUIRED. Do NOT leave in the middle of the lecture. What is this??
Classroom Etiquette No reading the newspaper in class (this includes crossword puzzles). Limited talking No Texting. Attendance is NOT REQUIRED. Do NOT leave in the middle of the lecture. What is this??
Definition 58 POTENTIAL GDP is the economy s long run growth trend for real GDP.
 III GDP and the Business Cycle We now begin our discussion of business cycles, chapter. Definition 58 POTENTIAL GDP is the economy s long run growth trend for real GDP. Definition 59 The BUSINESS CYCLE
Macroeconomic Theory and Policy
 ECO 209Y Macroeconomic Theory and Policy Lecture 3: Aggregate Expenditure and Equilibrium Income Gustavo Indart Slide 1 Assumptions We will assume that: There is no depreciation There are no indirect taxes
Business Cycles II: Theories
 International Economics and Business Dynamics Class Notes Business Cycles II: Theories Revised: November 23, 2012 Latest version available at http://www.fperri.net/teaching/20205.htm In the previous lecture
Principle of Macroeconomics, Summer B Practice Exam
 Principle of Macroeconomics, Summer B 2017 Practice Exam 1) If real GDP in a small country in 2015 is $8 billion and real GDP in the same country in 2016 is $8.3 billion, the growth rate of real GDP between
chapter: Solution Fiscal Policy
 S169-S182_Krug2e_Macro_PS_Ch13.qxp 2/25/09 8:02 PM Page S-169 Fiscal Policy chapter: 29 13 ECONOMICS MACROECONOMICS 1. The accompanying diagram shows the current macroeconomic situation for the economy
SAVING, INVESTMENT, AND THE FINANCIAL SYSTEM
 26 SAVING, INVESTMENT, AND THE FINANCIAL SYSTEM WHAT S NEW IN THE FOURTH EDITION: There are no substantial changes to this chapter. LEARNING OBJECTIVES: By the end of this chapter, students should understand:
Economics 1012A: Introduction to Macroeconomics FALL 2007 Dr. R. E. Mueller Third Midterm Examination November 15, 2007
 Economics 1012A: Introduction to Macroeconomics FALL 2007 Dr. R. E. Mueller Third Midterm Examination November 15, 2007 Answer all of the following questions by selecting the most appropriate answer on
Macroeconomics Mankiw 6th Edition
 N. Gregory Mankiw Lecture notes, ECON 1150 Macroeconomics Mankiw 6th Edition 21 & 22 The Influence of Monetary and Fiscal Policy on Aggregate Demand Premium PowerPoint Slides by Ron Cronovich 2012 UPDATE
Consumption, Saving and Investment
 TOPIC 3 Consumption, Saving and Investment TODAY s GOAL: Start Modeling Aggregate Demand (AD) What drives business investment decisions? What drives household consumption? Does consumption theory accurately
DEFICITS AND DEBT Macroeconomics in Context (Goodwin, et al.)
") Chapter 16 DEFICITS AND DEBT Macroeconomics in Context (Goodwin, et al.) Chapter Overview This chapter expands on the material from Chapter 10, from a less theoretical and more applied perspective. It
Chapter 16 DEFICITS AND DEBT Macroeconomics in Context (Goodwin, et al.) Chapter Overview This chapter expands on the material from Chapter 10, from a less theoretical and more applied perspective. It
Chapter 4: Consumption, Saving, and Investment
 Chapter 4: Consumption, Saving, and Investment Cheng Chen SEF of HKU September 21, 2017 Chen, C. (SEF of HKU) ECON2102/2220: Intermediate Macroeconomics September 21, 2017 1 / 78 Chapter Outline Describe
Macroeconomic Measurement 3: The Accumulation of Value
 International Economics and Business Dynamics Class Notes Macroeconomic Measurement 3: The Accumulation of Value Revised: October 30, 2012 Latest version available at http://www.fperri.net/teaching/20205.htm
Lesson 12 The Influence of Monetary and Fiscal Policy on Aggregate Demand
 Lesson 12 The Influence of Monetary and Fiscal Policy on Aggregate Demand Henan University of Technology Sino-British College Transfer Abroad Undergraduate Programme 0 In this lesson, look for the answers
Intermediate Macroeconomics
 Intermediate Macroeconomics Lecture 9 - Government Expenditure & Taxes Zsófia L. Bárány Sciences Po 2011 November 9 Data on government expenditure government expenditure is the dollar amount spent at all
Chapter 10 GOVERNMENT SPENDING
 Chapter 10 GOVERNMENT SPENDING SECTION I THE ECONOMICS OF GOVERNMENT SPENDING Total Government Spending in 2003 was $ 3,000,000,000,000 For every man, woman, and child (per capita) $ 10,300 Spending in
Government Budget and Fiscal Policy CHAPTER
 Government Budget and Fiscal Policy 11 CHAPTER The National Budget The national budget is the annual statement of the government s expenditures and tax revenues. Fiscal policy is the use of the national
Saving, Investment and the Financial System (Chapter 26 in Mankiw & Taylor)
") Saving, Investment and the Financial System (Chapter 26 in Mankiw & Taylor) We have seen that saving and investment are essential to long-run economic growth In this lecture we will see how the financial
Saving, Investment and the Financial System (Chapter 26 in Mankiw & Taylor) We have seen that saving and investment are essential to long-run economic growth In this lecture we will see how the financial
Archimedean Upper Conservatory Economics, November 2016 Quiz, Unit VI, Stabilization Policies
 Multiple Choice Identify the choice that best completes the statement or answers the question. 1. The federal budget tends to move toward _ as the economy. A. deficit; contracts B. deficit; expands C.
Macroeconomics and the Global Economic Environment (FNCE 613) SAMPLE EXAM 1
 SAMPLE EXAM 1") Macroeconomics and the Global Economic Environment (FNCE 613) SAMPLE EXAM 1 Macroeconomics and the Global Economic Environment (FNCE 613) SAMPLE EXAM 1 NAME (IN BLOCK LETTERS) Class time (CIRCLE ONE):
Macroeconomics and the Global Economic Environment (FNCE 613) SAMPLE EXAM 1 Macroeconomics and the Global Economic Environment (FNCE 613) SAMPLE EXAM 1 NAME (IN BLOCK LETTERS) Class time (CIRCLE ONE):
Question 1: Productivity, Output and Employment (20 Marks)
") Answers for ECON222 exercise 2 Winter 2010 Question 1: Productivity, Output and Employment (20 Marks) Part a): (6 Marks) Start by taking the derivative of the production wrt labour, which is then set equal
Answers for ECON222 exercise 2 Winter 2010 Question 1: Productivity, Output and Employment (20 Marks) Part a): (6 Marks) Start by taking the derivative of the production wrt labour, which is then set equal
Appendix 4.A. A Formal Model of Consumption and Saving Pearson Addison-Wesley. All rights reserved
 Appendix 4.A A Formal Model of Consumption and Saving How Much Can the Consumer Afford? The Budget Constraint Current income y; future income y f ; initial wealth a Choice variables: a f = wealth at beginning
The influence of Monetary And Fiscal Policy on Aggregate Demand
 Lecture 11 The influence of Monetary And Fiscal Policy on Aggregate Demand Prof. Samuel Moon Jung Introduction Earlier chapters covered: the long-run effects of fiscal policy on interest rates, investment,
Chapter 16. Fiscal Policy and the Government Budget
 Chapter 16 Fiscal Policy and the Government Budget Preview To examine the relationship between the government budget and the growth of government debt To understand the long- and short-run economic effects
PUBLIC DEBT AND INEQUALITY Alessandro Missale University of Milano. Winter School on Inequality and Social Welfare Theory Canazei 13 January 2014
 1 PUBLIC DEBT AND INEQUALITY Alessandro Missale University of Milano Winter School on Inequality and Social Welfare Theory Canazei 13 January 2014 Presentation Outline 2 Outline The role of public debt
What we know about monetary policy
 Apostolis Philippopoulos What we know about monetary policy The government may have a potentially stabilizing policy instrument in its hands. But is it effective? In other words, is the relevant policy
SIMON FRASER UNIVERSITY Department of Economics. Intermediate Macroeconomic Theory Spring PROBLEM SET 1 (Solutions) Y = C + I + G + NX
 Y = C + I + G + NX") SIMON FRASER UNIVERSITY Department of Economics Econ 305 Prof. Kasa Intermediate Macroeconomic Theory Spring 2012 PROBLEM SET 1 (Solutions) 1. (10 points). Using your knowledge of National Income Accounting,
SIMON FRASER UNIVERSITY Department of Economics Econ 305 Prof. Kasa Intermediate Macroeconomic Theory Spring 2012 PROBLEM SET 1 (Solutions) 1. (10 points). Using your knowledge of National Income Accounting,
Chapter 10. Fiscal Policy. Macroeconomics: Principles, Applications, and Tools NINTH EDITION
 Macroeconomics: Principles, Applications, and Tools NINTH EDITION Chapter 10 Fiscal Policy Learning Objectives 10.1 Explain how fiscal policy works using aggregate demand and aggregate supply. 10.2 Identify
Economics 325 Intermediate Macroeconomic Analysis Problem Set 1 Suggested Solutions Professor Sanjay Chugh Spring 2009
 Department of Economics University of Maryland Economics 325 Intermediate Macroeconomic Analysis Problem Set Suggested Solutions Professor Sanjay Chugh Spring 2009 Instructions: Written (typed is strongly
Supply and Demand over the Business Cycle
 Session 9. The Model at Work. v Business Cycles v The Economy in the Long Run: Recession and recovery Monetary expansion The everyday business of the central bank v Summing up: The IS/LM Model in Closed
Econ 98- Chiu Spring 2005 Final Exam Review: Macroeconomics
 Disclaimer: The review may help you prepare for the exam. The review is not comprehensive and the selected topics may not be representative of the exam. In fact, we do not know what will be on the exam.
Econ 223 Lecture notes 2: Determination of output and income Classical closed economy equilibrium
 Econ 223 Lecture notes 2: Determination of output and income Classical closed economy equilibrium Kevin Clinton Winter 2005 The classical model assumes that prices and wages etc. are fully flexible. Output
Fiscal Policy. Fiscal policy concepts. Chris Edmond NYU Stern. Today. Government budget constraint. Fiscal policy. Expenditure. Spring 2008.
 Fiscal policy concepts Fiscal policy Fiscal Policy Chris Edmond NYU Stern Spring 2008 government decisions to spend, raise revenue, and issue debt Expenditure purchases of goods and services (consumption
7) What is the money demand function when the utility of money for the representative household is M M
 What is the money demand function when the utility of money for the representative household is M M") 1) The savings curve is upward sloping, because (a) high interest rates increase the future returns that households obtain from their savings. (b) high interest rates increase the opportunity cost of consuming
1) The savings curve is upward sloping, because (a) high interest rates increase the future returns that households obtain from their savings. (b) high interest rates increase the opportunity cost of consuming
Chapter 5. Saving and Investment in the Open Economy. Copyright 2009 Pearson Education Canada
 Chapter 5 Saving and Investment in the Open Economy Copyright 2009 Pearson Education Canada Balance of Payments Accounting The balance of payments accounts are the record of country s international transactions.
If a model were to predict that prices and money are inversely related, that prediction would be evidence against that model.
 The Classical Model This lecture will begin by discussing macroeconomic models in general. This material is not covered in Froyen. We will then develop and discuss the Classical Model. Students should
Lecture III Federal Deficits and Debt Financial & Macroeconomic Perspectives Social Security Accounting. Page 1
 Lecture III Federal Deficits and Debt Financial & Macroeconomic Perspectives Social Security Accounting Page 1 Agenda Preliminaries The Government Budget, Deficits and Debt The Gov t Spending and Tax Multiplier
2. Suppose a family s annual disposable income is $8000 of which it saves $2000. (a) What is their APC?
 What is their APC?") REVIEW Chapters 10 and 13 Fiscal Policy 1. Complete the following table assuming that (a) MPS = 1/5, (b) there is no government and (c) all saving is personal saving. Level of output and income Consumption
REVIEW Chapters 10 and 13 Fiscal Policy 1. Complete the following table assuming that (a) MPS = 1/5, (b) there is no government and (c) all saving is personal saving. Level of output and income Consumption
Putting the Economy Together
 Putting the Economy Together Topic 6 1 Goals of Topic 6 Today we will lay down the first layer of analysis of an aggregate macro model. Derivation and study of the IS-LM Equilibrium. The Goods and the
THE INFLUENCE OF MONETARY AND FISCAL POLICY ON AGGREGATE DEMAND
 21 THE INFLUENCE OF MONETARY AND FISCAL POLICY ON AGGREGATE DEMAND LEARNING OBJECTIVES: By the end of this chapter, students should understand: the theory of liquidity preference as a short-run theory
A Real Intertemporal Model with Investment Copyright 2014 Pearson Education, Inc.
 Chapter 11 A Real Intertemporal Model with Investment Copyright Chapter 11 Topics Construct a real intertemporal model that will serve as a basis for studying money and business cycles in Chapters 12-14.
Opening the Economy. Topic 9
 Opening the Economy Topic 9 Goals of Topic 9 What is the exchange rate? NX is back!! What is the link between the exchange rate and net exports? What is the trade deficit? How do different shocks affect
macro macroeconomics Government Debt (chapter 15) N. Gregory Mankiw
 N. Gregory Mankiw") macro Topic 14: (chapter 15) macroeconomics fifth edition N. Gregory Mankiw PowerPoint Slides by Ron Cronovich 2002 Worth Publishers, all rights reserved In this chapter you will learn about the size of
macro Topic 14: (chapter 15) macroeconomics fifth edition N. Gregory Mankiw PowerPoint Slides by Ron Cronovich 2002 Worth Publishers, all rights reserved In this chapter you will learn about the size of
Chapter 14. Introduction. Learning Objectives. Deficit Spending and The Public Debt. Explain how federal government budget deficits occur
 Chapter 14 Deficit Spending and The Public Debt Introduction In adopting the euro, European nations agreed to abide by the Stability and Growth Pact. The pact called for limitations on government spending
Fiscal Policy. Fiscal Policy. Mark Huggett. Georgetown University. March 2, 2018
 Fiscal Policy Mark Huggett Georgetown University March 2, 2018 Fiscal Policy Fiscal policy focuses on the connection between elements of government policy (spending, taxation and debt) and the overall
MACROECONOMICS - CLUTCH CH FISCAL POLICY.
 !! www.clutchprep.com CONCEPT: INTRODUCTION TO FISCAL POLICY Fiscal Policy involves setting the level of and by Focus specifically on spending and taxes of government > Government spending is an important
THE INFLUENCE OF MONETARY AND FISCAL POLICY ON AGGREGATE DEMAND
 20 THE INFLUENCE OF MONETARY AND FISCAL POLICY ON AGGREGATE DEMAND LEARNING OBJECTIVES: By the end of this chapter, students should understand: the theory of liquidity preference as a short-run theory
University of Victoria. Economics 325 Public Economics SOLUTIONS
 University of Victoria Economics 325 Public Economics SOLUTIONS Martin Farnham Problem Set #5 Note: Answer each question as clearly and concisely as possible. Use of diagrams, where appropriate, is strongly
Unit 3: Aggregate Demand and Supply and Fiscal Policy
 Unit 3: Aggregate Demand and Supply and Fiscal Policy 1 Aggregate Demand 2 What is Aggregate Demand? Aggregate means added all together. When we use aggregates we combine all prices and all quantities.
IN THIS LECTURE, YOU WILL LEARN:
 IN THIS LECTURE, YOU WILL LEARN: Am simple perfect competition production medium-run model view of what determines the economy s total output/income how the prices of the factors of production are determined
Goals of Topic 2. Introduce the Supply Side of the Macro Economy: 1. Production Function. 2. Labor Market: Labor Demand.
 TOPIC 2 The Supply Side of the Economy Goals of Topic 2 Introduce the Supply Side of the Macro Economy: 1. Production Function 2. Labor Market: Labor Demand Labor Supply Equilibrium Wages and Employment
MACROECONOMICS. Semester 2, 2016 ECF1200
 MACROECONOMICS Semester 2, 2016 ECF1200 Week 4: Chapter 8 - Saving, investment and the financial system The financial system Groups of institutions that help to match one person s saving with another
Lecture 3: National Income: Where it comes from and where it goes
 Class Notes Intermediate Macroeconomics Li Gan Lecture 3: National Income: Where it comes from and where it goes Production Function: Y = F(K, L) = K α L 1-α Returns to scale: Constant Return to Scale:
Economics 302 Intermediate Macroeconomic Theory
 Economics 302 Intermediate Macroeconomic Theory and Policy (Fall 2010) Prof. Menzie Chinn Lecture 11 Wednesday, October 13, 2010 slide 0 Outline Government budgets Fluctuations in the deficit: purchases,
Study Questions. Lecture 15 International Macroeconomics
 Study Questions Page 1 of 5 Study Questions Lecture 15 International Macroeconomics Part 1: Multiple Choice Select the best answer of those given. 1. If the aggregate supply and demand curves in the figure
EC202 Macroeconomics
 EC202 Macroeconomics Koç University, Summer 2014 by Arhan Ertan Study Questions - 3 1. Suppose a government is able to permanently reduce its budget deficit. Use the Solow growth model of Chapter 9 to
ECF2331 Final Revision
 Table of Contents Week 1 Introduction to Macroeconomics... 5 What Macroeconomics is about... 5 Macroeconomics 5 Issues addressed by macroeconomists 5 What Macroeconomists Do... 5 Macro Research 5 Develop
Government debt. Lecture 9, ECON Tord Krogh. September 10, Tord Krogh () ECON 4310 September 10, / 55
 ECON 4310 September 10, / 55") Government debt Lecture 9, ECON 4310 Tord Krogh September 10, 2013 Tord Krogh () ECON 4310 September 10, 2013 1 / 55 Today s lecture Topics: Basic concepts Tax smoothing Debt crisis Sovereign risk Tord
Government debt Lecture 9, ECON 4310 Tord Krogh September 10, 2013 Tord Krogh () ECON 4310 September 10, 2013 1 / 55 Today s lecture Topics: Basic concepts Tax smoothing Debt crisis Sovereign risk Tord
Understanding the World Economy Final Exam Indicative answers
 Nicolas Coeurdacier Master Economics & Business Spring 2017 Understanding the World Economy Final Exam Indicative answers I. Multiple choice [50 points = 2 per question] It is a multiple choice questionnaire.
Chapter 14 Deficit Spending and the Public Debt
 Chapter 14 Deficit Spending and the Public Debt Learning Objectives After you have studied this chapter, you should be able to 1. define government budget deficits and surpluses, a balanced budget, the
THE INFLUENCE OF MONETARY AND FISCAL POLICY ON AGGREGATE DEMAND. Chapter 34
 1 THE INFLUENCE OF MONETARY AND FISCAL POLICY ON AGGREGATE DEMAND Chapter 34 Importance of economic policy Economic policy refers to the actions of the government that have a direct impact on the macroeconomic