Investor Presentation April 2018
|
|
|
- Eric Greer
- 5 years ago
- Views:
Transcription
1 Investor Presentation April 2018
2 Forward Looking Statements & Other Disclosure Matters Forward-Looking Statements - This presentation contains forward-looking statements within the meaning of the federal securities laws, including but not limited to, the Private Securities Litigation Reform Act of 1995 that involve risks and uncertainties. Such forward-looking statements include information concerning the Company's future financial performance, business strategy, plans, goals and objectives. Statements containing the words "anticipate," "believe," "could," "estimate," "expect," "intend," "may," "plan," "project," "should, predict, will, potential or the negative of such terms or other similar expressions are generally forward-looking in nature and not historical facts. Such forward-looking statements are based on our current expectations. We can give no assurance that such statements will prove to be correct, and actual results may differ materially. A wide variety of potential risks, uncertainties, and other factors could materially affect the our ability to achieve the results either expressed or implied by our forwardlooking statements including, but not limited to: general economic conditions impacting our customers or potential customers; our ability to execute periodic securitizations of future originated customer loans on favorable terms; our ability to continue existing customer financing programs or to offer new customer financing programs; changes in the delinquency status of our credit portfolio; unfavorable developments in ongoing litigation; increased regulatory oversight; higher than anticipated net charge-offs in the credit portfolio; the success of our planned opening of new stores; technological and market developments and sales trends for our major product offerings; our ability to manage effectively the selection of our major product offerings; our ability to protect against cyber-attacks or data security breaches and to protect the integrity and security of individually identifiable data of our customers and employees; our ability to fund our operations, capital expenditures, debt repayment and expansion from cash flows from operations, borrowings from our revolving credit facility, and proceeds from accessing debt or equity markets; and other risks detailed Part I, Item IA, Risk Factors, in our Annual Report on Form 10-K for the fiscal year ended January 31, 2018 and other reports filed with the SEC. If one or more of these or other risks or uncertainties materialize (or the consequences of such a development changes), or should our underlying assumptions prove incorrect, actual outcomes may vary materially from those reflected in our forward-looking statements. You are cautioned not to place undue reliance on these forwardlooking statements, which speak only as of the date of this presentation. We disclaim any intention or obligation to update publicly or revise such statements, whether as a result of new information, future events or otherwise, or to provide periodic updates or guidance. All forward-looking statements attributable to us, or to persons acting on our behalf, are expressly qualified in their entirety by these cautionary statements. Non-GAAP Measures - To supplement financial measures that are prepared and presented in accordance with accounting principles generally accepted in the United States of America ("GAAP"), we may also provide adjusted non-gaap financial measures. These non-gaap financial measures are not meant to be considered as a substitute for comparable GAAP measures but should be considered in addition to results presented in accordance with GAAP, and are intended to provide additional insight into our operations and the factors and trends affecting the business. Management believes these non-gaap financial measures are useful to financial statement readers because (1) they allow for additional transparency with respect to key metrics we use in our financial and operational decision making and (2) they are used by some of our institutional investors and the analyst community to help them analyze our operating results. 2
3 Conn s, Inc. Overview Conn s is a specialty retailer of durable consumer goods and provider of financing solutions to credit-constrained consumers Headquartered in The Woodlands, TX Conn s has corporate ratings of B1/B (Moody s/s&p) Approximately 4,300 employees and operates 118 retail locations in Texas, Alabama, Arizona, Colorado, Georgia, Louisiana, Mississippi, Nevada, New Mexico, Oklahoma, North Carolina, South Carolina, Tennessee and Virginia Conn s core customer demographic represents under-served consumers that typically have credit scores between 550 and 650 and who usually have limited financing options These customers typically earn $25,000-$60,000 in annual income, live in densely populated and mature neighborhoods, and usually shop to replace older household goods with newer items Conn s operates through two segments, retail and credit, and provides the opportunity to purchase high quality premium brand products across four primary categories: furniture and mattresses, appliances, electronics, and home office goods Strategy is to drive repeat business at the retail level through unique retail and credit offering Conn s product selection is focused on higher priced, large ticket items (e.g. bedroom sets, mattresses, refrigerators, and televisions) which generate higher margins and typically require some form of customer financing Conn s financed approximately 71% of customer transactions through its in-house financing program in FY18 Historical Store Growth Historical Revenues Balance Sheet $ in millions $1,194 $201 $993 $1,485 $1,613 $1,597 $1,516 $262 $289 $281 $324 $1,224 $1,324 $1,316 $1,192 $ in millions As of January 31, 2018 Receivable, net $1,287.4 Total Assets $1,900.8 Total Debt $1,091.0 Total Liabilities $1,365.7 FY13 FY14 FY15 FY16 FY17 FY18 FY14 FY15 FY16 FY17 FY18 Retail Credit Total Equity $


4 Retail Overview Retail Segment Conn s operates 118 retail stores across 14 states with 10 new stores opened in FY17, 3 new stores opened in FY18 and 2 new opened to date in FY19 leveraging existing infrastructure, advertising and distribution centers The stores are located in areas densely populated by Conn s core customer demographic and range in size from 30,000-50,000 square feet; stores deliver annual sales of $11.0 million on average per location (1) Conn s offers a high level of customer service through a trained and motivated commission-based sales force as well as quick delivery and installation, and product repair or replacement services High Quality Brands 118 existing stores 10 Existing Distribution Centers Retail Product Mix FY18 Consumer Electronics 23.1% Home Office 7.5% Other 1.6% Furniture Mattress 36.5% (1) For locations open 12 months as of January 31, 2018 Appliances 31.3% 4

 Financed Consumer receivables secured by long-lived products that customers consider integral to their everyday")
 (1) Conn s credit sales includes Product Sales and Repair Service Agreement ( RSA ) commissions, excludes Service Revenues and FC&O related to retail segment (2) In")
5 Credit Program Overview Offering in-house credit for over 50 years Provides solid foundation for underwriting decisions Proven through multiple business cycles and a deep recession Credit decisioning and collection operations are independent of retail operations FY18 Method of Payment In-store Cash & Credit Cards 7.0% Third-party Promotional Financing 16.1% Third-party Rent-to-own 5.9% In-House Financing 71.0% Simple, secured installment contracts Total Retail Sales (1) Financed Consumer receivables secured by long-lived products that customers consider integral to their everyday lives ($ in millions) $701 $980 $223 $1,208 $266 $1,309 $1,300 $238 $364 $1,178 $342 $204 $497 $757 $942 $1,071 $936 $836 FY13 FY14 FY15 FY16 FY17 FY18 Conn's Credit Sales Cash Sales (2) (1) Conn s credit sales includes Product Sales and Repair Service Agreement ( RSA ) commissions, excludes Service Revenues and FC&O related to retail segment (2) In addition to cash sales, Conn s receives timely cash payments for credit card, third-party financing and lease-to-own business 5
6 Providing Credit for a Wide Range of Consumers Credit Score FY2018: 16% of Sales Readily Available Revolving and Promotional Credit FY2018: 71% of Sales Prime Cutoff Score FY2018: 6% of Sales (1) LEASE TO OWN SOLUTION Conn s Core Customer Limited Available Credit Monthly Lease-to- Own Lease-to-Own Average Credit Score of Sales Financed Average Customer Income for Sales Financed 610 $ 43,400 Originations to customer with limited access to revolving credit and limited disposable income Payday Lending Note: Credit scores exclude non-scored accounts (1) Progressive Leasing is our current lease-to-own partner 6
7 Core Customer Base Conn s Core Customer Consumers with FICO scores between 550 and 650 Origination Credit Score as % of Q4 FY18 Scored Originations (1) National Credit Score as % of US Population (2) Approximately 1% of Conn s Q4 FY18 originations are from nonscored population 35% 40% 40% Lifestyle of a Conn s Target Customer The best of life is in the home 0.1% of originations below 525 9% 7% 8% 5% 0% 10% 13% 13% 17% 3% 1% Entertainment outside of the home is often cost prohibitive Average American watches 35 hours of television per week Difficult to acquire quality products to improve life in the home < Core customer market makes up approximately 1/5 of the US population (1) Conn s credit score distribution based on credit score of originations for three months ended January 31, 2018 (2) National credit score distribution as of April 2017 (Source is FICO) 7


8 Conn s Strong Value Proposition Premium shopping experience Competitively priced assortment of high-quality, aspirational products EDLC Every Day Low Cost for our customer Low-cost, low-risk source of financing for our core customer Next-day delivery and after sale repair service 8
9 Comparison of Value Proposition Example of $2,000 Purchase in Texas Monthly Payment Total Payments Conn s in house financing (1) $85 Conn s in house financing (1) $3,056 Relative Price -- National rent to own provider A (2) $168 National rent to own provider A (2) $5, x National rent to own provider B (3) $249 National rent to own provider B (3) $6, x CSO payday installment loan provider (4) $909 CSO payday installment loan provider (4) $4, x Short term payday lending 9 Other Potential Sources of Financing Subprime credit card limited availability, low balance, high fees Using Conn s in house credit preserves access to emergency funding My Best Buy Visa purchase variable APR is up to 29.24%; Amazon.com Store card standard variable purchase APR is 27.24% (5) (1) Assumes 36-month term and no down payment (2) Assumes 34-month term and $153 initial payment (3) Assumes 24-month term and $249 initial payment (4) Assumes 5-month term and no down payment; includes interest and CSO fees; without auto payment (5) Source and
10 Evolution of Conn s Business Management Team Core Customer Merchandise Offering Retail Pricing Strategy Credit Underwriting Servicing & Collections Retail focused leadership team Began to focus on lower-income customer Increased furniture & mattress offerings Exited most products less than $300 Competitive pricing - promotional but not everyday low pricing Implemented new underwriting model developed with assistance from FICO in 2013 Charge off accounts when over 209 days due Limit re-aging (no accounts can be re-aged more than a total of 12 months over life) Late Current Integrated new leadership team members including CEO, CFO, COO-Retail, CCO, GC, CAO, CHRO, and others Continue focus on core customers with improved underwriting sophistication Continue focus on quality, branded products to improve operating performance Invested additional capital to expand existing stores to accommodate these offerings Maintain competitive pricing Implement new and upgraded underwriting models Continue to review and enhance underwriting standards to improve overall credit results Enhanced leadership talent Enhanced back-up servicing arrangement Yield WA APR ranging low 20s mid 20s Increased use of no-interest programs to drive sales Implementing loan program changes to increase portfolio yields across most states Reducing use of no-interest programs Store Base Extensive remodeling program nearly all stores in new format at end of FY16 Closed 24 stores since FY12 Opened ten new stores in FY17 and three in FY18 Conn s has opened two new locations in FY19 10
11 FY19 - Strategic Priorities Conn s unmatched value proposition, combining a differentiated credit offering and a compelling retail experience provides the company with significant opportunity to grow profitably Retail Segment Strategic Priorities Improve same store sales performance to positive low single digits Optimize mix of quality, branded products and gain efficiencies in warehouse, delivery and transportation costs Maximize significant retail sales opportunity as identified in our sales funnel Continue to increase lease-to-own sales Open five to nine new stores in FY19 in our current footprint to leverage existing infrastructure Maintain disciplined oversight of our SG&A expenses Credit Segment Strategic Priorities Continue to improve credit spread towards our stated goal of 1,000 bps Increase interest income by continuing to originate higher-yielding loans; approximately 90% of current originations are at higher weighted average interest rate Refine and enhance our underwriting model to find incremental sales opportunities, while continuing to reduce losses and improve overall portfolio performance Continue to focus on reducing leverage and lowering interest expense 11
12 Fourth Quarter FY18 - Highlights Financial Performance Third consecutive quarter of profitability o Net income increased to $3.2 million versus prior year loss of $0.1 million o Adjusted non-gaap EPS of $0.56 in Q4 FY18 compared to $0.05 for Q4 FY17 o Operating income in Q4 FY18 increased 56.2% or $16.1 million to $44.8 million versus prior year Retail Segment Record retail gross margin o Quarterly record retail gross margin of 40.1%, 120 bps increase versus prior year o Lease-to-own successful transition reflects steady improvement, with lease-to-own at 6.5% of sales o Furniture and mattress sales mix increased to 35.3%, up 720 bps from Q4 FY15 in line with our strategy Credit Segment Record yield and lower charge-offs resulted in highest credit spread in three years o Record yield of 20.5% improved 400 bps from prior year, with credit spread of 560 bps o 60+ delinquency rate declined 80 bps from prior year, reflecting second consecutive quarter of decrease o Provision was $17.4 million below last year Capital Structure Lowest interest expense in past ten quarters o Interest expense in Q4 FY18 declined $7.1 million or 28.2% from last year o As a percent of revenues, Q4 interest expense was 4.3% versus 5.8% for same period last year o Closed 2017-B ABS transaction in December 2017 with the lowest all in cost of funds of 5.43% 12
13 Retail Review
14 Differentiated Retail Strategy Conn s unique business model provides it with critical competitive advantages Approximately 68% of product sales are derived from larger durable home goods (furniture, mattresses and appliances) Customers typically like to view and touch in person Next day delivery and in-house aftermarket repair service Focus on core subprime customer Allow customers to make aspirational home product purchases Affordable payment options via Conn s in-house credit or other third party financing solutions 14
15 Q4 FY18 - Retail Segment Overview Q4 FY18 total sales declined -6.0% and same store sales were down -8.0% impacted by the lease-to-own transition, general consumer weakness along the Mexican border and soft TV sales Retail margin in Q4 FY18 was 40.1%, improving 120 bps from prior year rate of 38.9% Margin expansion continues to be driven by improved product margins across all product categories, favorable product mix and continued focus on increasing efficiencies Retail SG&A in the fourth quarter was $1.6 million above last year and included incremental expense from additional stores, partially offset by discipline cost controls in other areas Retail performance and margin remain strong and we achieved record fourth quarter retail gross margin 15

16 Compelling Retail Opportunity Over 22 million Total visits to stores and website 1.3 million Submitted applications for Conn s in-house credit 690,000 Approved applications for Conn s in-house credit 390,000 Used Conn s in-house credit (Credit utilization rate of approximately 47%) Data represents FY18 actuals 16 16
17 Lease-to-Own Penetration Q4 FY18 Lease-to-Own rate was 6.5% 11.6% 12.0% 8.4% 8.6% 8.7% 7.9% 7.5% 7.3% 5.8% 5.6% 4.9% 5.2% 5.3% 5.0% 4.3% 4.5% 5.7% 4.5% 4.6% 5.3% 5.6% 6.2% 6.0% 6.4% 2.4% 1.9% 17 17
18 Retail Margin 40.0% Record Fourth Quarter Retail Margin 38.4% 39.8% 39.8% +120 bps from prior year same period 40.1% 38.0% 36.5% 36.4% 37.0% 37.4% 36.0% 34.0% 32.3% 32.0% FY13 FY14 FY15 FY16 FY17 Q1 FY18 Q2 FY18 Q3 FY18 Q4 FY
19 Product Sales and Margin Mix Same Store Sales (1) Total Sales Q4 Product Mix Q4 Gross Profit Mix Q4 Q4 FY18 FY17 FY18 FY17 Furniture and Mattress -5.3% -3.9% 35.3% 34.6% 50.1% 49.1% Home Appliance -0.1% 0.9% 27.9% 26.0% 21.6% 21.0% Consumer Electronics -16.7% -15.0% 27.0% 29.9% 22.9% 24.8% Home Office -1.3% -0.4% 8.4% 7.9% 4.7% 4.2% Other (2) -14.8% -13.9% 1.4% 1.6% 0.7% 0.9% Product sales -7.2% -5.8% 100.0% 100.0% 100.0% 100.0% Repair Service Agreement commissions -13.9% -10.0% Service 13.9% Total net sales -8.0% -6.0% (1) Same store sales include stores operating in both comparative full periods (2) Other category includes delivery, installation and outdoor product revenues 19
20 Cost of Goods and SG&A - Retail Segment Q4 FY18 Q4 FY17 FY18 FY17 FY16 FY15 FY14 FY13 Percent of Total Retail Net Sales: Cost of Goods Sold 59.9% 61.1% 60.4% 62.6% 63.0% 63.6% 63.5% 67.7% Percent of Total Retail Revenue: Advertising 7.0% 7.2% 7.3% 7.1% 6.8% 6.9% 5.1% 4.8% Compensation and benefits 9.6% 8.7% 9.9% 9.6% 10.1% 10.4% 11.2% 12.4% Occupancy 7.6% 6.7% 8.3% 7.3% 6.2% 5.6% 5.4% 6.2% All Other 0.6% 0.3% 1.0% 0.8% 0.6% 0.6% 1.1% 1.0% Total SG&A 24.8% 22.9% 26.5% 24.8% 23.7% 23.5% 22.8% 24.4% 20
21 Retail Revenue and Operating Margin $ in millions $1, % 11.9% 14.0% $1,450 $1,200 $1,316 $1, % 10.0% $ % 6.0% $ % $ % $200 FY17 FY18 0.0% Retail Revenues Retail Operating Margin Retail operating margin rate is approximately flat to prior year on lower revenues Note: As reported 21
22 Credit Review
23 Q4 FY18 - Credit Segment Overview In Q4 FY18, the credit segment results benefitted from higher finance charges, stronger portfolio fundamentals, controlled expenses and lower borrowing costs, resulting in significantly improved results Interest income and fee yield of 20.5% in Q4 FY18 increased 400 bps from prior year 60 Day+ rate declined 80 bps versus prior year period and represented the second consecutive quarter of decline Provision for bad debt in Q4 FY18 decreased by $17.4 million from prior year FY18 cumulative loss rate for the year of origination represents the first year-overyear decline in the past six years Interest expense in Q4 FY18 decreased $7.1 million or 28.2% from prior year Our fourth quarter credit trends reflect growing momentum in our transformation and demonstrate our credit strategy is producing the expected results 23
24 Credit Business - Future Goal FY18 spread increased to 420 bps (highest in 3 years) Q4 FY18 spread was 560 bps 23% - 25% 22.0% 19.3% Spread of 1,000 bps 17.9% 17.7% 17.0% 16.3% 15.4% 12.0% Credit Spread from 990 bps to 100 bps 12.4% 14.4% 15.1% 8.0% 10.1% 12% - 13% 7.0% FY14 FY15 FY16 FY17 FY18 Future Goal 24 11
25 Interest Income & Fee Yield Record yield achieved in FY18 Q4 represented the sixth consecutive quarter of incremental yield improvement 20.0% 19.3% 18.6% 18.0% 17.9% 17.7% 16.3% 16.0% 15.4% 14.0% FY13 FY14 FY15 FY16 FY17 FY18 25
26 Interest Rate (weighted average per origination month) Direct loan program in place in four states 28.0% 27.1% 27.2% 27.2% 27.4% 27.4% 27.5% 27.4% 27.5% 27.5% 27.6% 27.9% 27.9% 27.9% 27.8% 27.0% 26.7% 26.0% 25.0% 24.7% 24.0% 23.0% 22.0% 21.7% 21.6% 21.6% 21.5% 21.4% 21.5% 21.5% 21.4% 21.0% Feb FY17 Mar Apr May Jun Jul Aug Sep Oct Nov Dec Jan Feb FY18 Mar Apr May Jun Jul Aug Sep Oct Nov Dec Jan 26 26
27 Underwriting Summary Decisions are not made at store level Underwriting and risk assessment processes are centralized at the Company s Beaumont, TX office Credit (including underwriting and collections) team is independent from the sales staff Customers physically come into a store to validate identification and close the purchase and loan transaction Proprietary scoring models Decisions based on credit bureau and application data as well as past experience with the customer to determine a customer s ability to repay loans Scoring models determine credit decision, limit and down payment required with no exceptions, other than changes in application data which are verified by underwriting Early pay default model Core origination model Product risk model Amount financed and product category determine contract term assigned 27
28 Underwriting Initiatives Mar FY17 Jul FY17 Aug FY17 Sep FY17 Oct FY17 Nov FY17 Jan FY17 Lowered certain credit limits Eliminated some new customers in certain states Reduced 12- month nointerest program eligibility Raised down payments for some customers Approved some previously declined customers Deployed new internal risk scorecard Further tightened criteria on early-pay defaulters Further reduced 12- month nointerest program eligibility Tightened approval criteria on customers with limited credit history Increased maximum term to help reduce Payment- To-Income Ratio Increased interest rates in AZ, NM, NV, SC Adjusted approval criteria for higher risk new customers / low risk long-term customers Implemented additional requirements for repeat customers based on prior loan performance Differentiated application process based on online or retail source (channel) Made changes to new market cutoffs based on favorable performance Launched 18 month COP offer to top Conn s credit customers Implemented more restrictive channelspecific early pay default rules Credit limit and down payment adjustments Implemented new fraud model Adjusted cutoffs on new market applicants and increase DP on high risk segments to 20% Hired veteran subprime credit risk manager as Chief Credit Officer in June FY17 Note: Conn s Fiscal Year ends on January 31 28
29 Percentage of Originations - by Time on Books (1) 65.0% 60.0% 55.0% 50.0% 45.0% 40.0% 35.0% 30.0% 0-5M New >5M Existing % of Portfolio Consisting of Seasoned, Repeat Customers (1) (1) Time on books is number of months since first credit transaction with Conn s 29
30 First Pay Default Trends First pay defaults have improved each month since July FY17, when the more significant underwriting changes were implemented, except when Hurricane Harvey impacted August FY18 Nov FY16 Dec FY16 Jan FY16 Feb FY17 Mar FY17 Apr FY17 May FY17 June FY17 July FY17 First Pay Default Variance to Prior Year Aug FY17 Sep FY17 Oct FY17 Nov FY17 Dec FY17 Jan FY17 Feb FY18 Mar FY18 Apr FY18 May FY18 Jun FY18 Jul FY18 Aug FY18 Sep FY18 Oct FY18 Nov FY18 Dec FY18 Jan FY % 0.60% 1.07% 0.77% 0.64% 0.38% 0.66% Increase in August FY18 reflects impact from Hurricane Harvey 0.53% 0.18% -0.11% -0.44% -0.54% -0.08% -0.31% -0.41% -0.17% -0.75% -0.48% -0.89% -0.03% -0.14% -0.36% -0.67% -0.81% -0.13% -0.11% -0.32% 30
31 60 Day+ versus Prior Year 60 Day+ rate declined 80 bps versus prior year period Second consecutive quarter of decline 60 Day + Delinquency Rate FY17 FY % 11.0% 10.5% 10.4% $14 million decrease versus Q4 prior year 10.7% 9.5% 9.8% 9.6% 9.9% 9.9% 8.5% 8.6% Q1 Q2 Q3 Q4 31
32 Re-age % Trend 25.0% Re-age % of Portfolio Balance 23.8% 24.3% 23.0% 21.0% 19.0% 17.0% 15.8% 16.0% 15.0% Q1 FY18 Q2 FY18 Q3 FY18 Q4 FY18 32
33 Static Pool Charge-Offs (FY14 Q4 - FY18 Q4) New customer loss rates are 2x the loss rate of existing customers 20% 0-5 Months = New > 5 Months = Existing 18% 16% 14% 12% 10% 8% 6% 4% 2% 0% Time on books is number of months since first credit transaction with Conn s 33
34 Static Pool - Balances Remaining Balance Remaining Expected Static Pool Loss Rate Period As of 1/31/18 Comparable PY Estimated Range FY % 26.5% Upper 13% FY % 5.2% Mid 14% FY % 0.5% Upper 14% The periods reflect the year of loan origination 34
35 Vintage 60+ Delinquency (FY16 vs subsequent quarterly vintages) 60+ Vintage performance is favorable for all quarters starting in Q3 FY17 when the new risk model was fully implemented New scorecard implemented Subsequent vintages lower 35
36 Customer Recoveries Customer recoveries were $3.6 million in Q4, up approximately $2.5 million from prior year; highest level since ceasing sale of charged-off accounts 1,400,000 Monthly Customer Recoveries ($) Q4 FY18: $3.6 million Q4 FY17: $1.1 million 1,200,000 1,000, , , , ,000-36
37 ABS Cost of Funds Improvement Collateral Amount ($mm) 2015-A 2016-A 2016-B 2017-A 2017-B $1,442.6 $705.1 $699.7 $559.3 $669.3 Bond Structure $ (mm) Rating (F) WAL $ (mm) Rating (F) WAL $ (mm) Rating (F) WAL $ (mm) Rating (F/ K) WAL $ (mm) Class A $952.1 NR 0.51 $423.0 BBB 0.46 $391.8 BBB 0.45 $313.2 BBB/ BBB 0.36 $361.4 BBB/ BBB Class B $165.9 NR 1.57 $70.5 BB 1.23 $112.0 BB 1.32 $106.3 BB/ BB $132.2 BB/ BB Class C $70.5 B 1.74 $49.0 B 1.85 $50.3 B/ B $78.6 B-/ B Total Class A & B $1, % 0.67 $ % 0.57 $ % 0.64 $ % 0.57 $ % 0.63 Total Class A, B & C $ % 0.72 $ % 0.75 $ % 0.70 $ % 0.81 Overcollateralization Initial Target (%curr) Floor (%init) Reserve Account Base Case Loss Assumption Fitch Kroll Performance Triggers Cum. Net Loss Trigger 3 mo. Avg Annualized Net Loss Trigger Rolling 3 mo. Recov. Trigger Net Proceeds: Class A & B (% collat) Net Proceeds: Class A, B & C (% collat) 22.50% 20.00% 21.00% 16.00% 25.00% 46.00% 40.00% 35.00% 35.00% 2.00% 5.00% 5.00% 5.00% 5.00% 1.00% 1.50% 1.50% 1.50% 1.50% % 24.75% 24.25% 25.25% % 23.65% -- Yes Yes Yes Yes -- Yes Yes Yes Yes Yes Yes Yes 74.76% 67.83% 69.81% 74.40% 71.56% % % 83.20% Pricing Yield Coupon Spread Yield Coupon Spread Yield Coupon Spread Yield Coupon Spread Yield Coupon Class A 4.57% 4.57% % 4.68% % 3.73% % 2.73% % 2.73% Class B 8.50% 8.50% % 8.96% % 7.34% % 5.11% % 4.52% Class C % 12.00% % 7.54% % 5.95% Total Class A & B 5.94% 5.94% % 6.00% % 5.38% % 3.99% % 3.65% Total Class A, B & C % 7.82% % 4.96% % 4.39% Rating (F/ K) 14.50% WAL Class A & B Costs amortized over WAL Class A & B All-in Cost of Funds Class A, B & C Costs amortized over WAL Class A, B & C All-in Cost of Funds 3.21% 1.69% 1.44% 1.33% 1.27% 9.15% 7.78% 6.89% 5.36% 4.96% % % 0.99% 74 bps % % 5.43% improvement 37
38 Financial Review
39 Historical Financial Summary - As Reported Total Revenue ($ in millions) Operating Margin % $792 $865 $1,194 $1,485 $1,613 $1,597 $1, % 13.6% 8.1% 7.0% 7.6% 3.7% 4.0% FY12 FY13 FY14 FY15 FY16 FY17 FY18 FY12 FY13 FY14 FY15 FY16 FY17 FY18 Net Income ($ in millions) $93.4 $52.6 $58.5 $30.9 $6.5 $(3.7) $(25.6) FY12 FY13 FY14 FY15 FY16 FY17 FY18 39
40 Available Liquidity $ in millions $1,000 $800 $600 $400 $200 $0 Cash ABL Utilization ABL Net Availability (1) ABL Committed (Growth) Capacity (2) $863 $785 $763 $759 $615 $417 $285 $463 $111 $130 $355 $129 $208 $203 $6 Letters of Credit $113 $80 $35 $13 $9 Q1 FY18 Q2 FY18 Q3 FY18 Q4 FY18 We continue to closely manage liquidity and have made significant enhancements to our liquidity profile Closed $469.8 million ABS transaction in April of 2017 Redeemed outstanding 2015-A Class B Notes effective May 15, 2017 Redeemed outstanding 2016-A Class B and C Notes effective August 15, 2017 Closed $572.2 million ABS transaction in December of 2017 Redeemed the 2016-B Class B Notes effective February 15, 2018 (1) Immediately available borrowing capacity (based on prior month borrowing base certificate and is not adjusted for dominion) (2) Borrowing capacity that could become available upon increases in eligible inventory and customer receivable balances under the borrowing base Note: Columns may not total due to rounding 40
41 Impact of Tax Reform to Conn s Direct Impact to Conn s In Q4 of FY18, Conn s reduced its deferred tax asset by approximately $13.4 million This resulted in a one-time, non-cash reduction that was recorded through the provision for income taxes line item of the income statement and reduced Q4 of FY18 earnings by $0.42 per diluted share Beginning in FY19, the Company s effective tax rate will be between 23% and 25% Starting in late FY18, most capital expenditures will be 100% deductible which will lower Conn s cash taxes Anticipate that the bill will have a positive impact on our core customer primarily through the following: Positive Impact to Conn s Core Customer A reduction in the tax rate of income tax brackets; An increase in the standard deduction (to $12,000 from $6,350 for individuals, and to $24,000 from $12,700 for married couples); and An increase in the child tax credit (doubles the child care tax credit to $2,000 per dependent child under age 17) 41
42 Our Stores

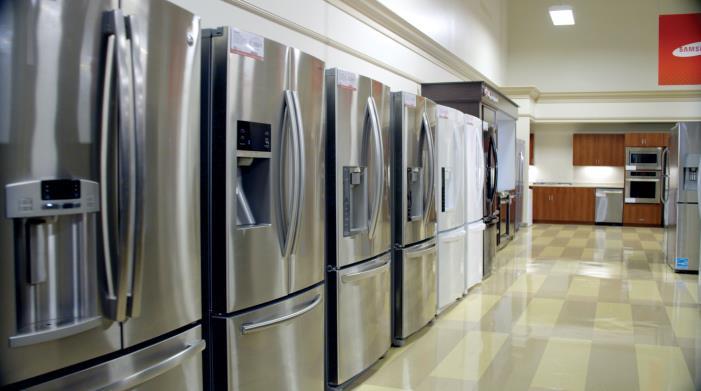
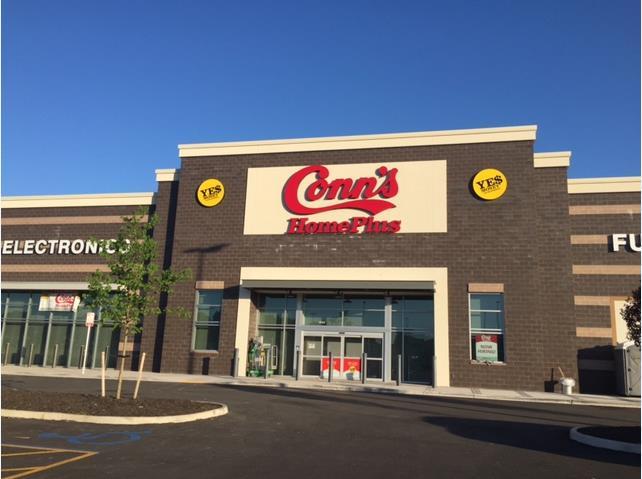


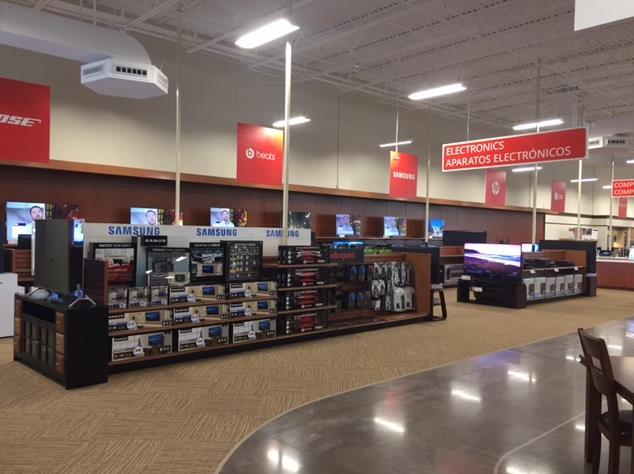
43 Our Stores 43


44 Our Stores 44
45
Investor Presentation JUNE 2018
 Investor Presentation JUNE 2018 Forward Looking Statements & Other Disclosure Matters Forward-Looking Statements - This presentation contains forward-looking statements within the meaning of the federal
Fourth Quarter Earnings Presentation. March 29, 2016
 Fourth Quarter Earnings Presentation March 29, 2016 Safe Harbor Agreement This presentation contains forward looking statements within the meaning of the Private Securities Litigation Reform Act of 1995
Conn's, Inc. Reports Fourth Quarter Fiscal Year 2018 Financial Results
 Conn's, Inc. Reports Fourth Quarter Fiscal Year 2018 Financial Results April 5, 2018 Achieves Full-Year Profitability Record Yield and Lower Charge-Offs Drive Highest Credit Spread in Three Years 60+ Delinquency
Conn's, Inc. Reports First Quarter Fiscal 2018 Financial Results
 June 6, 2017 Conn's, Inc. Reports First Quarter Fiscal 2018 Financial Results Credit Performance Improving as Turnaround Initiatives Take Further Hold Strong Product Margins Across All Categories Drive
Conn's, Inc. Reports Third Quarter Fiscal Year 2018 Financial Results
 December 7, 2017 Conn's, Inc. Reports Third Quarter Fiscal Year 2018 Financial Results Second Consecutive Quarter of Profitability Record Yield Drives Highest Spread in 11 Quarters Direct Loan Program
FIRST QUARTER EARNINGS PRESENTATION JUNE 2, 2014
 FIRST QUARTER EARNINGS PRESENTATION JUNE 2, 2014 Safe Harbor Agreement This presentation contains forward looking statements within the meaning of the Private Securities Litigation Reform Act of 1995 that
SANTANDER CONSUMER USA HOLDINGS INC. Fourth Quarter and Full Year
 SANTANDER CONSUMER USA HOLDINGS INC. Fourth Quarter and Full Year 2016 01.25.2017 IMPORTANT INFORMATION 2 Forward-Looking Statements This presentation contains forward-looking statements within the meaning
Investor Presentation January Asbury Automotive Group All rights reserved.
 Investor Presentation January 2018 Forward Looking Statements and Non-GAAP Financial Information To the extent that statements in this presentation are not recitations of historical fact, such statements
Rent-A-Center today is
 INVESTOR PRESENTATION FIRST QUARTER 2014 Safe Harbor This presentation contains forward-looking statements that involve risks and uncertainties. Such forward-looking statements generally can be identified
SANTANDER CONSUMER USA HOLDINGS INC. Fourth Quarter and Full Year
 SANTANDER CONSUMER USA HOLDINGS INC. Fourth Quarter and Full Year 2017 01.31.2018 IMPORTANT INFORMATION 2 Forward-Looking Statements This presentation contains forward-looking statements within the meaning
4Q 2017 Investor Presentation
 4Q 2017 Investor Presentation Forward-Looking Statements This presentation, including the accompanying oral presentation (collectively, this presentation ), does not constitute an offer to sell or the
Second Quarter
 Second Quarter 208 07.25.208 IMPORTANT INFORMATION 2 Forward-Looking Statements This presentation contains forward-looking statements within the meaning of the Private Securities Litigation Reform Act
SANTANDER CONSUMER USA HOLDINGS INC. Third Quarter
 SANTANDER CONSUMER USA HOLDINGS INC. Third Quarter 2017 10.27.2017 IMPORTANT INFORMATION 2 Forward-Looking Statements This presentation contains forward-looking statements within the meaning of the Private
SANTANDER CONSUMER USA HOLDINGS INC. (Exact name of registrant as specified in its charter)
") UNITED STATES SECURITIES AND EXCHANGE COMMISSION Washington, D.C. 20549 FORM 8-K CURRENT REPORT Pursuant to Section 13 or 15(d) of the Securities Exchange Act of 1934 Date of Report (Date of earliest event
UNITED STATES SECURITIES AND EXCHANGE COMMISSION Washington, D.C. 20549 FORM 8-K CURRENT REPORT Pursuant to Section 13 or 15(d) of the Securities Exchange Act of 1934 Date of Report (Date of earliest event
Q Transformation Update & Financial Results May 26, 2016
 Q1 2016 Transformation Update & Financial Results May 26, 2016 a Cautionary Statement Regarding Forward-Looking Information This presentation contains forward-looking statements, including statements about
Investor Presentation. November 2015
 Investor Presentation November 2015 Safe Harbor Statement Cautionary Statement Regarding Risks and Uncertainties That May Affect Future Results This presentation contains forward-looking statements within
SANTANDER CONSUMER USA HOLDINGS INC. First Quarter
 SANTANDER CONSUMER USA HOLDINGS INC. First Quarter 2017 04.26.2017 IMPORTANT INFORMATION 2 Forward-Looking Statements This presentation contains forward-looking statements within the meaning of the Private
INVESTOR PRESENTATION
 INVESTOR PRESENTATION DISCLOSURE 2 Forward-Looking Statements This presentation includes forward-looking statements within the meaning of the "Safe-Harbor" provisions of the Private Securities Litigation
Investor Presentation. February 2015
 Investor Presentation February 2015 Safe Harbor Statement Cautionary Statement Regarding Risks and Uncertainties That May Affect Future Results This presentation may contain forward-looking statements
SANTANDER CONSUMER USA HOLDINGS INC. Second Quarter
 SANTANDER CONSUMER USA HOLDINGS INC. Second Quarter 2017 07.28.2017 IMPORTANT INFORMATION 2 Forward-Looking Statements This presentation contains forward-looking statements within the meaning of the Private
Second Quarter 2013 Earnings Presentation. August 2, 2013
 Second Quarter 2013 Earnings Presentation August 2, 2013 Agenda Strategic Review Financial Review Questions and Answers Edward Tilly Chief Executive Officer Alan Dean Executive Vice President, CFO and
SANTANDER CONSUMER USA HOLDINGS INC. First Quarter
 SANTANDER CONSUMER USA HOLDINGS INC. First Quarter 206 04.27.206 IMPORTANT INFORMATION 2 Forward-Looking Statements This presentation contains forward-looking statements within the meaning of the Private
SANTANDER CONSUMER USA HOLDINGS INC. Third Quarter
 SANTANDER CONSUMER USA HOLDINGS INC. Third Quarter 2016 11.09.2016 IMPORTANT INFORMATION 2 Forward-Looking Statements This presentation contains forward-looking statements within the meaning of the Private
Third Quarter 2015 Earnings Call October 29, 2015
 Third Quarter 2015 Earnings Call October 29, 2015 Rob Wagman President & Chief Executive Officer Nick Zarcone Executive Vice President & Chief Financial Officer Joe Boutross Director, Investor Relations
Q %; 7.1% Q3 106%; 61% Q3 EPS
 At Home Group Inc. Announces Third Quarter Fiscal 2018 Financial Results Q3 net sales grew 25%; comparable store sales increased 7.1% Q3 operating income rose 106%; adjusted operating income 1 increased
Fourth Quarter 2014 Financial Results Supplement
 Fourth Quarter 20 Financial Results Supplement February 19, 2015 Table of contents Financial Results Segment Business Information 2 - Annual Financial Results 12 - Single-Family New Funding Volume 3 -
American Express. Financial Community Meeting. Kenneth I. Chenault Chairman and Chief Executive Officer
 American Express Financial Community Meeting Kenneth I. Chenault Chairman and Chief Executive Officer Daniel T. Henry Executive Vice President and Chief Financial Officer February 4, 2009 Agenda 2008 Financial
Cautionary Statement Regarding Forward-Looking Statements
 January 2018 Cautionary Statement Regarding Forward-Looking Statements Forward Looking Statements: Certain statements are forward-looking statements made pursuant to the safe harbor provisions of the Private
1Q 2018 Investor Presentation. May 2018
 1Q 2018 Investor Presentation May 2018 Forward-Looking Statements This presentation, including the accompanying oral presentation (collectively, this presentation ), does not constitute an offer to sell
Jefferies Crossover Consumer Finance Summit. December 6, 2018
 Jefferies Crossover Consumer Finance Summit December 6, 2018 1 SAFE HARBOR STATEMENT & USE OF NON-GAAP INFORMATION Safe Harbor Statement: Safe Harbor" Statement under the Private Securities Litigation
BMC STOCK HOLDINGS, INC. Second Quarter 2018 Earnings Presentation July 30, BMC. All Rights Reserved.
 BMC STOCK HOLDINGS, INC. Second Quarter 2018 Earnings Presentation July 30, 2018 2018 BMC. All Rights Reserved. CLICK Disclaimer TO EDIT TITLE This presentation contains "forward-looking statements" within
SANTANDER CONSUMER USA HOLDINGS INC. (Exact name of registrant as specified in its charter)
") UNITED STATES SECURITIES AND EXCHANGE COMMISSION Washington, D.C. 20549 FORM 8-K CURRENT REPORT Pursuant to Section 13 or 15(d) of the Securities Exchange Act of 1934 Date of Report (Date of earliest event
UNITED STATES SECURITIES AND EXCHANGE COMMISSION Washington, D.C. 20549 FORM 8-K CURRENT REPORT Pursuant to Section 13 or 15(d) of the Securities Exchange Act of 1934 Date of Report (Date of earliest event
U.S. LOAN, LEASE & FLOORPLAN SECURITIZATION PLATFORMS. May 2018
 U.S. LOAN, LEASE & FLOORPLAN SECURITIZATION PLATFORMS May 2018 SAFE HARBOR STATEMENT This presentation contains several forward-looking statements. Forward-looking statements are those that use words such
[Insert Subheading] Click to edit Master text styles. Shop Direct Limited. Q1 FY18 Results. Three months ended 30 September 2017.
![[Insert Subheading] Click to edit Master text styles. Shop Direct Limited. Q1 FY18 Results. Three months ended 30 September 2017.](/thumbs/75/71763350.jpg "[Insert Subheading] Click to edit Master text styles. Shop Direct Limited. Q1 FY18 Results. Three months ended 30 September 2017.") [Insert Subheading] Click to edit Master text styles Shop Direct Limited Q1 FY18 Results Three months ended 30 September 2017 7 December 2017 1 Disclaimer This presentation (the Presentation ) has been
[Insert Subheading] Click to edit Master text styles Shop Direct Limited Q1 FY18 Results Three months ended 30 September 2017 7 December 2017 1 Disclaimer This presentation (the Presentation ) has been
Q %; 7.8% Q2 50%; 35% Q2 EPS
 At Home Group Inc. Announces Second Quarter Fiscal 2018 Financial Results Q2 net sales increased 23%; comparable store sales increased 7.8% Q2 net income increased 50%; pro forma adjusted net income 1
Foxtons Interim results presentation For the period ended 30 June 2018
 Foxtons Interim results presentation For the period ended 30 June 2018 Important information This presentation includes statements that are, or may be deemed to be, forward-looking statements. These forward-looking
Raymond James The 35 th Annual Institutional Investors Conference
 Raymond James The 35 th Annual Institutional Investors Conference Edward Tilly, CEO March 4, 2014 1 Forward-Looking Statements This presentation may contain forward-looking statements, within the meaning
Second Quarter 2012 Earnings Presentation. August 2, 2012
 Second Quarter 2012 Earnings Presentation August 2, 2012 Agenda Strategic Review William Brodsky Chairman and CEO Financial Review Alan Dean Executive Vice President, CFO and Treasurer Questions and Answers
SANTANDER CONSUMER USA HOLDINGS INC. (Exact name of registrant as specified in its charter)
") UNITED STATES SECURITIES AND EXCHANGE COMMISSION Washington, D.C. 20549 FORM 8-K CURRENT REPORT Pursuant to Section 13 or 15(d) of the Securities Exchange Act of 1934 Date of Report (Date of earliest event
UNITED STATES SECURITIES AND EXCHANGE COMMISSION Washington, D.C. 20549 FORM 8-K CURRENT REPORT Pursuant to Section 13 or 15(d) of the Securities Exchange Act of 1934 Date of Report (Date of earliest event
SAFE HARBOR STATEMENT
 1 SAFE HARBOR STATEMENT Forward Looking Statements This press release, and the above referenced conference call, contains or may contain forward-looking statements made pursuant to the safe harbor provisions
SALLIE MAE. ABS East Investor Presentation September 2015
 SALLIE MAE ABS East Investor Presentation September 2015 Forward-Looking Statements and Disclaimer Cautionary Note Regarding Forward-Looking Statements The following information is current as of August
First Quarter 2015 Earnings Presentation. May 1, 2015
 First Quarter 2015 Earnings Presentation May 1, 2015 Agenda Strategic Review Financial Review Questions and Answers Edward Tilly Chief Executive Officer Alan Dean Executive Vice President, CFO and Treasurer
Q4 & Full Year Transformation Update & Financial Results February 2015
 Q4 & Full Year 2014 Transformation Update & Financial Results February 2015 a Agenda Introduction Opening Remarks Financial Results Rob Schriesheim Chief Financial Officer Eddie Lampert Chairman & Chief
Dean Foods. Earnings Report. February 11, 2009
 Dean Foods Fourth Quarter and Year End 2008 Earnings Report February 11, 2009 Forward Looking Statements The following statements made in this presentation are forward looking and are made pursuant to
Q Investor Presentation
 Q3 2017 Investor Presentation FORWARD-LOOKING STATEMENTS This presentation contains forward-looking statements within the meaning of the Private Securities Litigation Reform Act of 1995. These statements
Fiscal 2018 Second Quarter Earnings Call Presentation February 2, 2018
 Fiscal 2018 Second Quarter Earnings Call Presentation February 2, 2018 Safe Harbor Statement Certain statements in this presentation may be forward-looking in nature, or "forward-looking statements" within
2017 Third Quarter Results. Maracay Homes Pardee Homes Quadrant Homes Trendmaker Homes TRI Pointe Homes Winchester Homes
 2017 Third Quarter Results Maracay Homes Pardee Homes Quadrant Homes Trendmaker Homes TRI Pointe Homes Winchester Homes Forward Looking Statement Various statements contained in this presentation, including
SANTANDER CONSUMER USA HOLDINGS INC. (Exact name of registrant as specified in its charter)
") UNITED STATES SECURITIES AND EXCHANGE COMMISSION Washington, D.C. 20549 FORM 8-K CURRENT REPORT Pursuant to Section 13 or 15(d) of the Securities Exchange Act of 1934 Date of Report (Date of earliest event
UNITED STATES SECURITIES AND EXCHANGE COMMISSION Washington, D.C. 20549 FORM 8-K CURRENT REPORT Pursuant to Section 13 or 15(d) of the Securities Exchange Act of 1934 Date of Report (Date of earliest event
SAFE HARBOR STATEMENT
 1 SAFE HARBOR STATEMENT Forward Looking Statements This press release contains or may contain forward-looking statements made pursuant to the safe harbor provisions of the Private Securities Litigation
2018 First Quarter Earnings Call. February 8, 2018
 2018 First Quarter Earnings Call February 8, 2018 Forward Looking Statements / Non-GAAP Measures This presentation contains information about management's view of the Company's future expectations, plans
Investor Presentation
 Investor Presentation September 2018 Disclaimer This presentation contains forward-looking statements. You can generally identify forward-looking statements by our use of forward-looking terminology such
Strategic Mortgage Income Fund 3Q 2015 Presentation
 Strategic Mortgage Income Fund 3Q 2015 Presentation October 22 nd, 2015 Nothing presented herein is intended to constitute investment advice and no investment decision should be made based on any information
STRATEGIC AND OPERATIONAL OVERVIEW. April 4, 2018
 STRATEGIC AND OPERATIONAL OVERVIEW April 4, 2018 SAFE HARBOR STATEMENT This presentation contains several forward-looking statements. Forward-looking statements are those that use words such as believe,
Best Buy Reports Holiday Revenue Results
 Best Buy Reports Holiday Revenue Results Domestic Revenue Decreased 0.8% Repurchased $203 million in Stock for a Year-to-Date Total of $588 million Improving the Fourth Quarter Operating Margin Outlook
2017 Fourth Quarter and Full Year Results. Maracay Homes Pardee Homes Quadrant Homes Trendmaker Homes TRI Pointe Homes Winchester Homes
 217 Fourth Quarter and Full Year Results Maracay Homes Pardee Homes Quadrant Homes Trendmaker Homes TRI Pointe Homes Winchester Homes Forward Looking Statement Various statements contained in this presentation,
For Immediate Release:
 For Immediate Release: FirstCash Reports Record Second Quarter Results; Announces 62 Store Acquisition in Mexico, Opens 16 New LatAm Stores; Completes Share Repurchases, Adds New $100 Million Repurchase
Second Quarter 2016 Earnings Presentation. July 29, 2016
 Second Quarter 2016 Earnings Presentation July 29, 2016 Agenda Strategic Review Financial Review Questions and Answers Edward Tilly Chief Executive Officer Alan Dean Executive Vice President, CFO and Treasurer
Second Quarter 2018 Earnings Call AUGUST 8, 2018
 Second Quarter 2018 Earnings Call AUGUST 8, 2018 Safe Harbor Statement FORWARD-LOOKING STATEMENTS This presentation includes forward-looking statements within the meaning of the safe harbor provisions
THIRD QUARTER FISCAL YEAR 2018 Earnings Conference Call & Presentation. August 7, 2018 at 9:00 a.m. CT (10:00 a.m. ET)
") THIRD QUARTER FISCAL YEAR 2018 Earnings Conference Call & Presentation August 7, 2018 at 9:00 a.m. CT (10:00 a.m. ET) 1 Third Quarter Fiscal Year 2018 Welcome to Nexeo s Earnings Conference Call and Presentation
THIRD QUARTER FISCAL YEAR 2018 Earnings Conference Call & Presentation August 7, 2018 at 9:00 a.m. CT (10:00 a.m. ET) 1 Third Quarter Fiscal Year 2018 Welcome to Nexeo s Earnings Conference Call and Presentation
Earnings Conference Call Third Quarter November 20, 2007
 Earnings Conference Call Third Quarter 2007 November 20, 2007 Safe Harbor Statement The Private Securities Litigation Reform Act of 1995 (the Act ) provides protection from liability in private lawsuits
FBM 4Q17 Earnings Presentation
 FBM 4Q7 Earnings Presentation February 27, 208 DISCLOSURES Forward-Looking Statements This presentation contains forward-looking statements as that term is defined in the Private Securities Litigation
Quarterly Economic Update Key Trends
 Quarterly Economic Update Key Trends Linda Haran Senior Director June 2011 Experian and the marks used herein are service marks or registered trademarks of Experian Information Solutions, Inc. Other product
First Quarter 2017 Earnings Call MAY 4, 2017
 First Quarter 2017 Earnings Call MAY 4, 2017 Safe Harbor Statement FORWARD-LOOKING STATEMENTS This presentation includes forward-looking statements within the meaning of the safe harbor provisions of the
Fourth Quarter & Full Year 2016 Earnings Call
 Fourth Quarter & Full Year 2016 Earnings Call February 23, 2017 Rob Wagman President & Chief Executive Officer Nick Zarcone Executive Vice President & Chief Financial Officer Joe Boutross Director, Investor
First American Financial KBW Mortgage Finance & Asset Management Conference June 1, 2017
 First American Financial KBW Mortgage Finance & Asset Management Conference June 1, 2017 2015 First American Financial Corporation and/or its affiliates. All rights reserved. q NYSE: FAF Safe Harbor Statement
June Steve Michaels, CFO and President of Strategic Operations
 June 2018 Steve Michaels, CFO and President of Strategic Operations Safe Harbor Statement & Use of Non-GAAP Information Safe Harbor Statement: Safe Harbor" Statement under the Private Securities Litigation
Best Buy Reports Fourth Quarter and Fiscal Year Results
 Best Buy Reports Fourth Quarter and Fiscal Year Results 0.9% Fourth Quarter Domestic Comparable Store Sales Increase $965 Million Adjusted Annual Free Cash Flow $150 Million in Phase One Renew Blue Cost
Investor Conference Call FY2019 First Quarter Ended August 31, October 16, 2018 at 11 a.m. ET
 Investor Conference Call FY2019 First Quarter Ended August 31, 2018 October 16, 2018 at 11 a.m. ET Forward-Looking Statements This presentation contains certain statements that are considered forwardlooking
Forward-Looking Statements and Non- GAAP Financial Measures
 Investor Deck 3 rd Quarter 2014 0 Forward-Looking Statements and Non- GAAP Financial Measures Certain statements in this presentation are forward-looking as defined in the Private Securities Litigation
Best Buy Reports Third Quarter Results
 Best Buy Reports Third Quarter Results Non-GAAP diluted EPS from continuing operations of $0.32 GAAP diluted EPS from continuing operations of $0.30 $65 million in additional annualized Renew Blue cost
MYERS INDUSTRIES, INC. MARCH 9, 2017 FOURTH QUARTER & FULL YEAR EARNINGS PRESENTATION
 MYERS INDUSTRIES, INC. MARCH 9, 2017 FOURTH QUARTER & FULL YEAR EARNINGS PRESENTATION SAFE HARBOR STATEMENT Statements in this presentation concerning the Company s goals, strategies, and expectations
2018 Second Quarter Earnings Call. May 8, 2018
 2018 Second Quarter Earnings Call May 8, 2018 Forward Looking Statements / Non-GAAP Measures This presentation contains information about management's view of the Company's future expectations, plans and
SLM CORPORATION INVESTOR PRESENTATION STEVE MCGARRY EVP AND CFO
 SLM CORPORATION INVESTOR PRESENTATION STEVE MCGARRY EVP AND CFO 19th Annual Credit Suisse Financial Services Forum February 13, 2018 Forward-Looking Statements and Disclaimer 2 Cautionary Note Regarding
American Express Company Earnings Conference Call Q1 11. April 20, 2011
 American Express Company Earnings Conference Call Q1 11 April 20, 2011 Summary Financial Performance ($ in millions, except per share amounts) Q1'11 Q1'10 % Inc/(Dec) Total Revenues Net of Interest Expense
Q2 Fiscal 2019 Letter to Shareholders
 Q2 Fiscal 2019 Letter to Shareholders How Data Science is Woven into the Fabric of Stitch Fix To illustrate the pervasiveness of data science and algorithms across our business, here s an example that
Dean Foods Third Quarter 2008 Earnings Report. November 4, 2008
 Dean Foods Third Quarter 2008 Earnings Report November 4, 2008 Forward Looking Statements The following statements made in this presentation are forward looking and are made pursuant to the safe harbor
1Q 2017 FORD CREDIT EARNINGS REVIEW
 1Q 2017 FORD CREDIT EARNINGS REVIEW April 27, 2017 FC1 FORD CREDIT STRATEGY ORIGINATE SERVICE FUND Support Ford and Lincoln sales Strong dealer relationships Full spread of business Consistent underwriting
Making it happen. 6 March 2018
 Making it happen 6 March 2018 LEGAL NOTICE This presentation has been prepared to inform investors and prospective investors in the secondary markets about the Group and does not constitute an offer of
Q Earnings Call. June 20, 2018
 Q1 2018 Earnings Call June 20, 2018 Notice to Recipients This presentation contains statements that are forward-looking statements. Forward-looking statements relate to expectations, beliefs, projections,
Elevate Investor Presentation May 2017
 Elevate Investor Presentation May 2017 1 Forward-Looking Statements This presentation and responses to various questions contain forward-looking statements within the meaning of Section 27A of the Securities
Results for Q3 Fiscal 2019
 Results for Q3 Fiscal 2019 Earnings Announcement: January 30, 2019 (Quarter Ended December 31, 2018) Risks and Non-GAAP Disclosures This presentation contains forward-looking statements within the meaning
H1 16 interim results. 22 September 2015
 H1 16 interim results 22 September 2015 Important notice 2 This presentation may include certain forward-looking statements, beliefs or opinions, including statements with respect to the Company s business,
SLM CORPORATION INVESTOR PRESENTATION. Second Quarter 2017
 SLM CORPORATION INVESTOR PRESENTATION Second Quarter 2017 2 Forward-Looking Statements and Disclaimer Cautionary Note Regarding Forward-Looking Statements The following information is current as of April
Investor Presentation
 Investor Presentation June 2018 Safe Harbor Statement This presentation contains forward-looking statements. You can generally identify forward-looking statements by our use of forward-looking terminology
Business Unit Overview
 Agenda 2009 Performance Unique Opportunities for Growth Business Unit Overview Why is our credit performance better than the competition s? What s happening to spending? How will we grow? Question and
 Safe harbor and non-gaap measures This presentation contains statements as to Walmart management's guidance regarding earnings per share and adjusted earnings per share for the fiscal year ending January
DOLLARAMA REPORTS STRONG RESULTS FOR FOURTH QUARTER AND FULL YEAR FISCAL 2017
 For immediate distribution DOLLARAMA REPORTS STRONG RESULTS FOR FOURTH QUARTER AND FULL YEAR FISCAL 24% increase in quarterly diluted net earnings per common share 10% increase in quarterly cash dividend
2017 First Quarter Results. Maracay Homes Pardee Homes Quadrant Homes Trendmaker Homes TRI Pointe Homes Winchester Homes
 217 First Quarter Results Maracay Homes Pardee Homes Quadrant Homes Trendmaker Homes TRI Pointe Homes Winchester Homes Forward Looking Statement Various statements contained in this presentation, including
SANTANDER CONSUMER USA HOLDINGS INC. (Exact name of registrant as specified in its charter)
") UNITED STATES SECURITIES AND EXCHANGE COMMISSION Washington, D.C. 20549 FORM 8-K CURRENT REPORT Pursuant to Section 13 or 15(d) of the Securities Exchange Act of 1934 Date of Report (Date of earliest event
UNITED STATES SECURITIES AND EXCHANGE COMMISSION Washington, D.C. 20549 FORM 8-K CURRENT REPORT Pursuant to Section 13 or 15(d) of the Securities Exchange Act of 1934 Date of Report (Date of earliest event
SALLIE MAE. Smart Option Student Loan Historical Performance Data Period ended December 31, 2017
 1 SALLIE MAE Smart Option Student Loan Historical Performance Data Period ended December 31, 2017 Forward-Looking Statements and Disclaimer 2 Cautionary Note Regarding Forward-Looking Statements The following
At Home Group Inc. Announces Third Quarter Fiscal 2019 Financial Results
 At Home Group Inc. Announces Third Quarter Fiscal 2019 Financial Results Q3 net sales increased 25.5%; comparable store sales increased 5.2% Delivers 19 th consecutive quarter of comparable store sales
2015 Second Quarter Conference Call August 4, 2015
 2015 Second Quarter Conference Call August 4, 2015 Safe Harbor Statements in this presentation, including the information set forth as to the future financial or operating performance of Atlas Financial
Fiscal 2018 Third Quarter Results. 28 June 2018
 Fiscal 2018 Third Quarter Results 28 June 2018 Safe harbor and non-gaap Cautionary Note Regarding Forward-Looking Statements: All statements in these materials and the related presentation that are not
BMC STOCK HOLDINGS, INC Baird Industrials Conference November 8, 2017
 BMC STOCK HOLDINGS, INC. 2017 Baird Industrials Conference November 8, 2017 Peter Alexander, President and Chief Executive Officer 2017 BMC. All Rights Reserved. CLICK DISCLAIMER TO EDIT TITLE Forward-Looking
SENSATA FOURTH QUARTER AND FULL YEAR 2017 EARNINGS PRESENTATION FEBRUARY 1, 2018
 SENSATA FOURTH QUARTER AND FULL YEAR 2017 EARNINGS PRESENTATION FEBRUARY 1, 2018 Forward-Looking Statements This earnings presentation contains "forward-looking statements" within the meaning of Section
2015 Fourth-Quarter and Fiscal Year Performance
 205 Fourth-Quarter and Fiscal Year Performance Financial Results and Company Highlights March 5, 206 Disclaimers Forward-Looking Statements This presentation includes forward-looking statements within
Form 8-K. SIGNET JEWELERS LIMITED (Exact name of registrant as specified in its charter)
") UNITED STATES SECURITIES AND EXCHANGE COMMISSION Washington, D.C. 20549 Form 8-K CURRENT REPORT Pursuant to Section 13 or 15(d) of the Securities Exchange Act of 1934 Date of Report (Date of earliest event
UNITED STATES SECURITIES AND EXCHANGE COMMISSION Washington, D.C. 20549 Form 8-K CURRENT REPORT Pursuant to Section 13 or 15(d) of the Securities Exchange Act of 1934 Date of Report (Date of earliest event
We Distribute Products That Deliver Energy to the World. NOW Inc., Fourth Quarter and Full-Year 2017 Review & Key Takeaways
 We Distribute Products That Deliver Energy to the World NOW Inc., Fourth Quarter and Full-Year 2017 Review & Key Takeaways Forward Looking Statements Statements made in the course of this presentation
FINANCIAL OVERVIEW AL MISTYSYN SENIOR VICE PRESIDENT, FINANCE & CHIEF FINANCIAL OFFICER FINANCIAL COMMUNITY PRESENTATION OCTOBER 3, 2017
 FINANCIAL OVERVIEW AL MISTYSYN SENIOR VICE PRESIDENT, FINANCE & CHIEF FINANCIAL OFFICER FINANCIAL COMMUNITY PRESENTATION OCTOBER 3, 2017 Forward Looking Statement The presentations today will contain certain
UBS Global Financial Services Conference May 14, Joseph Saunders, Chief Executive Officer. Byron Pollitt, Chief Financial Officer
 UBS Global Financial Services Conference May 14, 2008 Joseph Saunders, Chief Executive Officer Byron Pollitt, Chief Financial Officer Safe Harbor Reminder The following materials and management s discussion