THE DISTRIBUTION OF DEBT ACROSS EU COUNTRIES:
|
|
|
- Jessie Bryant
- 5 years ago
- Views:
Transcription
1 THE DISTRIBUTION OF DEBT ACROSS EU COUNTRIES: The role of individual characteristics, institutions and credit conditions Olympia Bover, José María Casado, Sonia Costa, Philip Du Caju, Yvonne McCarthy, Eva Sierminska, Panagiota Tzamourani, Ernesto Villanueva, Tibor Zavadil ECB Conference on Household Finance and Consumption Frankfurt, 17 October 2013
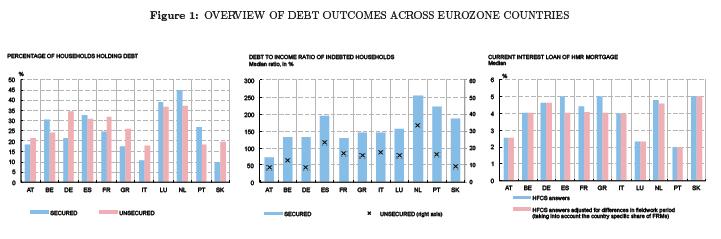
2 1. INTRODUCTION The new HFCS micro data reveal striking differences in the incidence, amount, and cost of debt across countries in the EMU Moreover, the patterns of debt by age and income are substantially different across countries Distribution of debt across households of different characteristics play a role on how aggregate shocks affect the macroeconomy. e.g. interest rate changes within a monetary union can have different consequences on aggregate consumption in member states depending on proportion of indebted households and their characteristics 2
3 1. INTRODUCTION Purpose of this paper: 1. Document country differences in the relationship between household characteristics and debt (i) Holding debt (ii) Quantity of debt (at various quantiles) (iii) Interest rate by means of country-specific regressions of these debt outcomes on set of household characteristics (age, schooling, labour status, etc) 2. Study the extent to which these differences are associated with differences in institutions and credit conditions Legal enforcement of contracts Tax treatment of mortgage payments Regulatory LTV ratios Prevalence of Fixed Rate Mortgages Information about borrowers Financial Literacy 3
4 1. INTRODUCTION Comments: We consider many institutions Assess predictive power of each institution by examining its impact on three separate debt outcomes (extensive margin, intensive margin, cost) this provides indications about the channel through which each institution affects borrowing behaviour The approach we follow leads to effects of institutional variables on household debt which have causal validity under less restrictive conditions than pooling data across countries using interactions of household characteristics and institutional variables we allow for endogeneity with respect to unobserved country effects, both additive and interacting with the remaining household characteristics (more later) 4
5 1. INTRODUCTION Main findings: Demographics - age, income, education are important predictors of secured debt holdings within countries - in contrast, unsecured debt mainly depends on number of adults - in some countries i-rate varies with income - differences across countries in the estimated age, income, education profiles Institutions - length of repossession best predicts the differences in debt distributions across countries for countries with one standard deviation longer repossession period: Fraction of borrowers is 16% smaller Amount borrowed is lower among the youngest (12% lower than RG) i-rate paid by high income households is 0.3 pp lower - remaining institutions deliver less robust results 5
6 2. DATA The HFCS is a Eurosystem initiative aimed at collecting comparable microlevel information (common core questionnaire, variable definitions...) It collects information on household income, assets, liabilities and lots of information on household characteristics The first wave of HFCS was conducted in 15 euro area countries our analysis is based on the data for 11 of these countries* The first wave of the survey was conducted between end-2008 and mid-2011 Total sample size of just over 62,000 households [*Finland excluded because debt information not comparable; Cyprus not included because education (and marital status) collected only for the respondent; Malta not included although we have now received private information on continuous age variables; Slovakia excluded from interest rate analysis because of highly imprecise estimates] 6
7 2. DATA Debt variables Holding debt i. Secured: mortgages or loans using HMR as collateral or other properties as collateral ii. Debt balance Unsecured: credit line/overdraft balance or credit cards or other noncollateralised loans i. Log (secured debt) ii. Interest rate Log (unsecured debt) i. On HMR mortgage ii. Not enough information in the data for i-rates on unsecured debt We distinguish secured from unsecured to avoid conditioning on endogenous outcomes (e.g home-ownership) [To correct for differences in fieldwork periods across countries: (i) We convert all debt balances to 2010 values by adjusting by the country-specific HICP, (ii) Interest rate adjusted by the change of Euribor multiplied by the % of adjustable rate mortgages] 7
8 3. EMPIRICAL METHODOLOGY Household-Country Regressions Country Regressions 1st step: 2nd step: This procedure (eg for k = 1) is identical to running the partially pooled regression which in the estimation of allows for endogeneity of with respect to omitted country variables and reverse causality captured by and Alternatives would collapse all 2nd steps into a fully pooled regression: or one pooling slopes but not intercepts, so that additive country effects are still allowed: Two-step estimated effects of institutions and household characteristics have causal validity (and validity as unbiased predictors) under less restrictive conditions than either of these two alternatives. The reason is that two-step estimates control for unobserved country effects in a more flexible way than the pooled regressions. 8
9 3. EMPIRICAL METHODOLOGY THE FIRST STEP: MODEL OF DEBT OUTCOMES Three different specifications where the dependent variable is a different debt outcome - Holding vs not holding debt (logit) Odds ratio (invariant to values of ) Holding debt probability of a common reference group across countries (levels comparison) - Quantity of debt held conditional on holding debt (OLS,conditional variance, quantile regression) - Interest rate (OLS, conditional variance, quantile regression) Core members of the household socio-demographic characteristics - the respondent to the survey and his/her partner (if any) - when there is only one core member we include his/her characteristics - in the case of couples we include information on both core members and relate their characteristics to each other 9
10 Age 3. EMPIRICAL METHODOLOGY THE FIRST STEP: MODEL OF DEBT OUTCOMES i. age of the oldest core household member (five intervals: 16 to 34, 35 to 44, 45 to 54, 55 to 64, and over 64) ii. we take into account the age of the other core member by including the age difference between the two Education i. we consider the education of the more educated core member (three dummy variables: low education, medium, and high) ii. we take into account the education of the other core member by including a binary variable to indicate if the two members have attained different education levels (i.e. if the other core member has a lower education than the most educated) Labour status i. labour status of the core member with the highest income (employee, selfemployed, retired, and unemployed and other inactive) ii. a binary variable denoting if the other member is working 10
11 3. EMPIRICAL METHODOLOGY THE FIRST STEP: MODEL OF DEBT OUTCOMES Socio-demographic characteristics By defining characteristics of core couples in this way we directly focus on the importance of difference between the two members and do so in a more parsimonious way as compared to defining the full set of dummies for the two partners More fundamentally, this is an attempt to focus on the traits of the household as a group and their distribution without requiring to define a "reference person" ex ante, all of whose characteristics would then be emphasized relative to other members In addition: couple dummy, log(nº of adults), log(total income) 11
12 3. EMPIRICAL METHODOLOGY 2 ND STEP: IMPACT OF INSTITUTIONS ON 1 ST STEP COEFFS. We regress each of the estimated effects from the first step (slopes and intercept) on each of the institutional variables of interest. we analyze the effect of each institution separately.. multivariate analysis (hold constant other relevant institutions) We focus on the institutions that have tended to be highlighted in the existing theoretical or empirical literature of household debt outcomes [Estimations use all 5 implicates and are weighted by (i) population weights in part one and (ii) country sample size in part two] 12
13 4. RESULTS: THE ASSOCIATION BETWEEN DEBT HOLDINGS AND HOUSEHOLD CHARACTERISTICS 1. SECURED DEBT: EXTENSIVE MARGIN: The Probability of Holding Debt INTENSIVE MARGIN: The Amount of Debt Held PRICE: Interest Rate of Secured Debt 2. UNSECURED DEBT: Extensive and Intensive Margin 13
14 4. RESULTS: THE ASSOCIATION BETWEEN DEBT HOLDINGS AND HOUSEHOLD CHARACTERISTICS 1. SECURED DEBT: EXTENSIVE MARGIN: The Probability of Holding Debt INTENSIVE MARGIN: The Amount of Debt Held PRICE: Interest Rate of Secured Debt UNSECURED DEBT: Extensive and Intensive Margin 14
15 4. RESULTS: SECURED DEBT EXTENSIVE MARGIN: THE PROBABILITY OF HOLDING DEBT Figure in next slides shows: - Country specific odds ratios relative to the omitted category for each group - Probability of holding secured debt for the reference group in general, relationship between secured debt holding and age has the expected hump shape higher income, higher levels of education and employment are also associated with a greater likelihood of holding secured debt household size and composition matter obvious differences in the effects across countries of higher education, difference in education between household core members and most significantly of age and income 15
16 4. RESULTS: SECURED DEBT EXTENSIVE MARGIN: THE PROBABILITY OF HOLDING DEBT 16
17 4. RESULTS: SECURED DEBT EXTENSIVE MARGIN: THE PROBABILITY OF HOLDING DEBT 17
18 4. RESULTS: SECURED DEBT EXTENSIVE MARGIN: THE PROBABILITY OF HOLDING DEBT 18
19 4. RESULTS: SECURED DEBT EXTENSIVE MARGIN: THE PROBABILITY OF HOLDING DEBT 19
20 4. RESULTS: SECURED DEBT EXTENSIVE MARGIN: THE PROBABILITY OF HOLDING DEBT 20
21 4. RESULTS: SECURED DEBT EXTENSIVE MARGIN: THE PROBABILITY OF HOLDING DEBT 21
22 4. RESULTS: SECURED DEBT EXTENSIVE MARGIN: THE PROBABILITY OF HOLDING DEBT 22

23 4. RESULTS: SECURED DEBT EXTENSIVE MARGIN: THE PROBABILITY OF HOLDING DEBT 23
24 4. RESULTS: SECURED DEBT EXTENSIVE MARGIN: THE PROBABILITY OF HOLDING DEBT 24
25 4. RESULTS: SECURED DEBT EXTENSIVE MARGIN: THE PROBABILITY OF HOLDING DEBT 25
26 4. RESULTS: SECURED DEBT EXTENSIVE MARGIN: THE PROBABILITY OF HOLDING DEBT 26
27 4. RESULTS: SECURED DEBT EXTENSIVE MARGIN: THE PROBABILITY OF HOLDING DEBT 27
28 4. FIRST STAGE RESULTS: THE ASSOCIATION BETWEEN DEBT HOLDINGS AND HOUSEHOLD CHARACTERISTICS 1. SECURED DEBT: EXTENSIVE MARGIN: The Probability of Holding Debt INTENSIVE MARGIN: The Amount of Debt Held PRICE: Interest Rate of Secured Debt UNSECURED DEBT: Extensive and Intensive Margin 28
29 4. RESULTS: SECURED DEBT INTENSIVE MARGIN: THE AMOUNT OF DEBT HELD Figure in next slide shows: - country level OLS estimates and their confidence interval (red dots and grey lines) across all countries:. the amount of secured debt is highest for households aged 16 to 34. higher income is associated with higher debt again, as in the case of holding debt or not, the most significant differences across countries occur in the estimated effects of age and income 29
30 4. RESULTS: SECURED DEBT INTENSIVE MARGIN: THE AMOUNT OF DEBT HELD 30
31 4. RESULTS: SECURED DEBT INTENSIVE MARGIN: THE AMOUNT OF DEBT HELD 31
32 4. RESULTS: SECURED DEBT INTENSIVE MARGIN: THE AMOUNT OF DEBT HELD 32
33 4. RESULTS: SECURED DEBT INTENSIVE MARGIN: THE AMOUNT OF DEBT HELD 33
34 4. RESULTS: SECURED DEBT INTENSIVE MARGIN: THE AMOUNT OF DEBT HELD (QUANTILE REGRESSIONS) Next two slides: -To check if the effects of the covariates vary across the distribution of debt we estimate quantile regressions as well in general the QR results do not deviate too much from the OLS estimates there are some exceptions but it is worth noting that most of the variation across the distribution can be captured by the location-scale model 34

35 4. RESULTS: SECURED DEBT INTENSIVE MARGIN: THE AMOUNT OF DEBT HELD (QUANTILE REGRESSIONS) 35

36 4. RESULTS: SECURED DEBT INTENSIVE MARGIN: THE AMOUNT OF DEBT HELD (QUANTILE REGRESSIONS) 36
37 4. RESULTS: THE ASSOCIATION BETWEEN DEBT HOLDINGS AND HOUSEHOLD CHARACTERISTICS 1. SECURED DEBT: EXTENSIVE MARGIN: The Probability of Holding Debt INTENSIVE MARGIN: The Amount of Debt Held PRICE: Interest Rate of Secured Debt UNSECURED DEBT: Extensive and Intensive Margin 37
38 4. RESULTS: THE ASSOCIATION BETWEEN DEBT HOLDINGS AND HOUSEHOLD CHARACTERISTICS Figure in next slide shows: - country level OLS estimates and their confidence interval (red dots and grey lines) rates across countries for RG range from 2.4 (LU) to 4.6 (DE) differences across countries by age although not generally significant higher income is associated with lower rates in many countries but not all 38
39 4. RESULTS: SECURED DEBT PRICE: INTEREST RATE 39
40 4. RESULTS: SECURED DEBT PRICE: INTEREST RATE 40
41 4. RESULTS: SECURED DEBT PRICE: INTEREST RATE 41
42 4. RESULTS: SECURED DEBT PRICE: INTEREST RATE 42
43 4. FIRST STAGE RESULTS: THE ASSOCIATION BETWEEN DEBT HOLDINGS AND HOUSEHOLD CHARACTERISTICS 1. SECURED DEBT: 2.EXTENSIVE MARGIN: The Probability of Holding Debt INTENSIVE MARGIN: The Amount of Debt Held PRICE: Interest Rate of Secured Debt UNSECURED DEBT: Extensive and Intensive Margin 43
44 4. FIRST STAGE RESULTS: UNSECURED DEBT EXTENSIVE MARGIN: THE PROBABILITY OF HOLDING DEBT UNSECURED DEBT SECURED DEBT 44
45 4. RESULTS: Summary Results Estimated Profiles of the Probability of Holding Debt 45
46 4. EFFECTS OF INSTITUTIONS ON ESTIMATED PROFILES Coefficients from first step on institutions Holding debt. probability for a reference/comparable group across countries to study level effects (reference group: age 35-44, medium education, employee, couple, no difference in age nor in education, other core member working, 2 adults, median income of the country). odd-ratios Debt balance. mean for the same reference group. OLS coefficients to see effect of institutions on age profile, income profile, etc. [effects on quantile regression coefficients but not shown] Interest rate. mean for the same reference group. OLS coefficients Effects considered (left-hand side). constant/level, age, education, income, self-employment 46
47 4. EFFECTS OF INSTITUTIONS ON ESTIMATED PROFILES Institutions A. Legal enforcement A.1. Duration of foreclosure (months) B. Regulation: fiscal and macro-prudential framework B.1. Taxation on mortgage payments: (i) wedge between market interest rate and the after tax cost of housing, (ii) deductibility or not, no limit on deductibility B.2. Regulatory LTV: existence of regulatory limit on LTV, regulatory limit (%) C. Credit conditions C.1. Fixed-interest rate (if % of mortgages FMR for period longer than 10 years > 50%) C.2. Conditions that reduce initial payments: interest only payments (if % of i-only mortgage loans >10 %) C.3. Financial development proxy: depth of information on borrowers (0 to 6), math score (PISA) 47
48 4. EFFECTS OF INSTITUTIONS ON ESTIMATED PROFILES Institution by institution We analyze the effects of each institution separately, usually by simple regressions In some cases, an institution is captured by two complementary variables in particular:. deductibility of mortgage payments and, in case of deductibility, whether there is a limit on the deductibility or not. existence of a regulatory LTV limit and, in case of existence, value of such limit Also multivariate results allowing for various institutions 48
49 4. EFFECTS OF INSTITUTIONS ON ESTIMATED PROFILES Presentation of the results of the second part - graphs where we group the charts into three columns - first column shows impact of the institutional variables on the probability of holding debt of the reference group (in first row) and on the odds ratios of each of the sociodemographic characteristics as compared to the omitted category (from second to last row) - second column shows the effect of institutions on the (log) amount of secured debt held (dependent variables by rows are the OLS coefficients from first part). Similarly, we also analyze the effect of institutions on the amount of debt held at various points of the distribution (10 th, 50 th, 90 th percentile) but these are not shown - third column shows the effect of institutions on the level of interest rate of the household main residence mortgage (dependent variables by rows are the OLS coefficients from first part) Remark: Slovenia not included in part two because very noisy estimates in the first part (as expected given number of indebted households in the sample) 49
50 4. EFFECTS OF INSTITUTIONS ON ESTIMATED PROFILES A.1. Duration of foreclosure: theory Longer durations decrease bank recovery value in the case of nonrepayment. Somehow similar to the existence of bankrupcy Theory focuses on consequences on unsecured debt, we study secured debt. Costly repossession may turn secured debt into unsecured Bankrupcy causes higher probability of non-repayment priced in groupspecific higher lending rates (relative to European-style situation). Tertilt et al (2007), Hintermeier and Koeniger (2011), Chatterjee et al. (2007) Simulations suggest bankrupcy makes US households less likely to borrow. Young US households (mid-30s) specially affected. Low current income, high income risk, costly to accumulate assets. End up facing higher interest rates and borrowing less 50
51 4. EFFECTS OF INSTITUTIONS ON ESTIMATED PROFILES A.1. Duration of foreclosure: measurement Data available through European Mortgage Federation (data from 2007). Source: questionnaires sent to national experts. Questionnaire identifies comparable steps in the process of repossession in case of non-repayment in some EU countries.. Each step identified by minimum and maximum legal duration. Ask for an assessment of typical duration. Repossession periods in the sample vary between 5 months (NL) and 56 ( IT). Short durations in ES (8 months), AT or DE (9 months) or LU (10 months). Long durations in PT or GR (24 months), FR (20 months) or BE (18 months) Length of repossession periods are persistent over time. Source: Study of EMF of periods in 1990 for a subsample of countries.. Correlation between durations in 1990 and in 2007 is.83 51
52 4. EFFECTS OF INSTITUTIONS ON ESTIMATED PROFILES A.1. Duration of foreclosure: comments on results In countries where the repossession process takes longer, the reference group is less likely to hold secured debt. a one-month delay in the time to repossess leads to a 0.7 percentage point reduction in the chances of holding debt (statistically significant) In terms of the amount of debt held, the impacts vary across the debt distribution, in particular the impact is larger in absolute value among youngest households Evidence supporting the notion of a differential interest rate treatment of high income borrowers. longer foreclosures associated with relatively higher interest rates for low income households (effect precisely estimated) 52
53 A.1. TYPICAL DURATION OF FORECLOSURE (MONTHS) 53
54 4. EFFECTS OF INSTITUTIONS ON ESTIMATED PROFILES B.1. Taxation of mortgage payments: theory Gervais (2002): OLG model with a down payment and housing consumption. Mortgage deduction + low taxation on imputed rents increase relative return on housing investments. Incentive to overconsume housing over life-cycle Generates age and income borrowing profiles in the US. Youth save to benefit from incentive early in the life-cycle.. Mostly high income households able to save and afford down payment. Progressivity of income taxes should reinforce the income profile Interest rates are endogenous but not group specific 54
55 4. EFFECTS OF INSTITUTIONS ON ESTIMATED PROFILES B.1. Taxation of mortgage payments: measurement FIRST MEASURE Taxation on mortgage payments incentives measured using two dummies, so use a bivariate regression. An indicator for the existence of some tax deduction to mortgage payments. Countries without mortgage tax deductions: DE, SK An indicator for countries without a limit to mortgage tax deductions The only country without any limit to tax deductions is NL Source: ECB (2009) Structural Issues Report SECOND MEASURE A continuous measure of housing tax incentives developed by Johanson (Source: OECD WP, forthcoming). Wedge between market interest rate and the after tax cost of housing. 100% LTV, a house worth 6 times the average wage, single, median income 55
56 4. EFFECTS OF INSTITUTIONS ON ESTIMATED PROFILES B.1. Taxation of mortgage payments: comments on results (continuous measure) Positive association between tax relief and the chances that RG holds debt Tax relief also positively correlated with higher amounts of debt by RG Tentative evidence of a pass-through of the tax relief into higher i-rates Basic prediction about age profile not confirmed 56
57 B.1. TAXATION ON MORTGAGE PAYMENTS: WEDGE 57
58 4. EFFECTS OF INSTITUTIONS ON ESTIMATED PROFILES B.1. Taxation of mortgage payments: comments on results (two dummies) (Bivariate regression: one slide with results for each variable) The reference group in countries with tax exemption on mortgage payments is 17 pp more likely to hold secured debt (not precise) When examining the amount of debt, the absence of a limit to tax deductibility further increases the amount of debt held by the reference group in countries with tax exemption (although very imprecise), specially at the top decile of the debt distribution (not shown) There is actually evidence of an age profile in the response of the probability of having debt and some age profile can also be detected in the response of the debt amount (not when using the continuous measure by Johanson) No evidence of response of the income profiles to mortgage tax relief. may be partially explained by the positive (but not significant) correlation between interest rates and income for countries without a limit on deductions? 58
59 B.1. TAXATION: EXISTENCE OF INTEREST PAYMENTS DEDUCTIBILITY AND NO LIMIT ON DEDUCTIBILITY (I) 59
60 B.1. TAXATION: EXISTENCE OF INTEREST PAYMENTS DEDUCTIBILITY AND NO LIMIT ON DEDUCTIBILITY (II) 60
61 4. EFFECTS OF INSTITUTIONS ON ESTIMATED PROFILES B.2. Regulatory Loan-to-Values: theory Ortalo-Magné and Rady (1999,2006): OLG model with a housing ladder. Credit constraints for the youth. Interest rates are exogenous. Supply of housing is inelastic The relaxation of LTVs alters the age profile of borrowing. Low-income youth -who would otherwise rent- borrow and purchase flats. Sold by the elderly Higher LTVs increases the amount of debt. Among the youths (mechanically, higher LTV). Unclear pattern among older households Simulations by Chambers et al (2009a,b) emphasize that overall increases in LTVs mainly increase (non group-specific) interest rates. Little impact on age profiles 61
62 4. EFFECTS OF INSTITUTIONS ON ESTIMATED PROFILES B.2. Regulatory of Loan-To-Values: measurement Loan to Values measured using two variables 1. Existence of a threshold above which:. Extra provisioning needed under Basel II or. Limits applying for bonds to be eligible as collateral for covered or mortgage bonds.. All euro area countries have a regulatory limit but BE, NL, LU and AT (for the first three, the source is ECB, 2009). 2. Within the set of countries with a maximum Loan to Value, the lowest threshold between extra provisioning and limit for covered bonds Variation between 60% (DE, FR) and 80% (IT,ES) Bivariate regression with two different dummies. One slide per variable 62
63 4. EFFECTS OF INSTITUTIONS ON ESTIMATED PROFILES B.2. Regulatory of Loan-To-Values: comments on results (Bivariate regression: one slide with results for each variable) No robust effects on the probability of holding secured debt for the RG. but an overall positive effect of an increase in the value of the LTV limit on debt holding by the very young is present in the data Still, differences in LTV are useful to understand a handful of facts about the distribution of debt amounts. the average debt held by the reference group in a country with a maximum LTV limit is 49% lower than in a country with no such limit. the decrease in the amount of debt held in those countries is larger among the youngest than among the 45 to 54 years old. we find some effects suggesting that low income households expand their borrowing the most when the maximum LTV ratio increases We find little evidence that either the absence of a regulatory maximum LTV or an increase in the value of the limit result in higher i-rates charged to the RG (but find it for the very young) 63
64 B.2. REGULATORY LTV: EXISTENCE OF REGULATORY LIMIT ON LTV AND REGULATORY LIMIT (%) (I) 64
65 B.2. REGULATORY LTV: EXISTENCE OF REGULATORY LIMIT ON LTV AND REGULATORY LIMIT (%) (II) 65
66 4. EFFECTS OF INSTITUTIONS ON ESTIMATED PROFILES C.1. % mortgages with fixed interest rate: theory Campbell and Cocco (2003) simulate household s welfare under FRM and ARM. Calibrated to US FRM s main advantage is low income risk at the cost of substantial capital risk.. If households unable to borrow short-term, fluctuations in ARM installments cause disutility Prevalence of FRMs should increase access to borrowing among risky households. Self-employed, low schooling. Fixed term contracts? Unclear predictions about the amount borrowed 66
67 4. EFFECTS OF INSTITUTIONS ON ESTIMATED PROFILES C.1. % mortgages with fixed interest rate: measurement Prevalence of FRMs measure taken from ECB (2009). Proportion of loans with first fixed interest rates period of at least 10 years.. Survey in 2007 to institutions lending in the euro area. Members of euro area can be divided into ARM- countries and FRMcountries (IT and DE are mixed cases). FRM: BE, NL, FR. ARM: PT, ES, GR, SK, Prevalence probably reflects situation in 2007, not when the average loan in our sample was taken.. Given the patterns above, we present results with a dummy prevalence above 50%.. Results similar if we use prevalence in
68 4. EFFECTS OF INSTITUTIONS ON ESTIMATED PROFILES C.1. % mortgages with fixed interest rate: comments on results Focus on self-employed (and other income risk households e.g. low educated). prevalence of FRMs is associated with a greater likelihood of holding secured debt by those groups Prevalence of FRM is reflected in higher i-rates for the reference group (as such products entail larger risks for financial institutions). countries with prevalence of FMR mortgages charge i-rates 74 basis points higher (s.e. 30bp). interestingly, no effect of higher interest rates to self-employed Propensity of the RG to hold debt not much affected by the prevalence of FMR 68
69 C.1. FIXED-INTEREST RATE (IF % OF MORTGAGES FMR FOR PERIOD LONGER THAN 10 YEARS > 50%) 69
70 4. EFFECTS OF INSTITUTIONS ON ESTIMATED PROFILES C.1. Credit conditions that reduce initial payments: theory Basic permanent income model: credit constrained households borrow if (early) mortgage installments are low Instruments allowing lower initial payments change profiles of borrowing. Increase borrowing among youths or low income households.. Caveat: age profile hard to detect in a cross-section, as those institutions also delay repayment of principal. Expand borrowing among highest income growth households. College Chambers et al (2009) confirm age and income profiles using OLG models (with i-only mortgages rolled into fixed rate mortgages) 70
71 C.1. Credit conditions that reduce initial payments: measurement The source of information is ECB (2009). Questionnaire to survey experts, Fraction of mortgages with interest only payments in the first three years. Varies between 0% (IT) and 33% (NL). Rare in DE (0.9%), GR (1.5%) or FR (3.5%), more common in AT (18%) or PT (10%) Use indicator of whether the fraction exceeds 10%. Comments on results in next slide No significant patterns found; impacts are not precise Similar imprecision when we use long maturities or products that allow unilateral maturity extension 71
72 4. EFFECTS OF INSTITUTIONS ON ESTIMATED PROFILES C.1. Credit conditions that reduce initial payments: comments on results No significant patterns found; impacts are not precise Similar imprecision when we use long maturities or products that allow unilateral maturity extension 72
73 C.2. CONDITIONS THAT REDUCE INITIAL PAYMENTS: INTEREST ONLY PAYMENTS (IF % OF I-ONLY MORTGAGE LOANS > 10%) 73
74 4. EFFECTS OF INSTITUTIONS ON ESTIMATED PROFILES C.3. Information on borrowers (proxy for financial development) Ability to process information about borrowers should allow banks to price risk properly. increase interest rates for default-prone households. otherwise not observed being granted credit The cross-sectional variance of interest rates should increase (Edelberg, 2009) Unclear effect on propensity to hold debt or amount of debt held Measure from the Getting Credit index of the World Bank. Index varies from 1 to 6 74
75 4. EFFECTS OF INSTITUTIONS ON ESTIMATED PROFILES C.3. Information on borrowers: comments on results In countries with (one point) deeper information on borrowers (e.g. credit registries) the RG has a lower probability of having secured debt (7%, not precise) Better information about borrowers permits better pricing of loans to young households; probably as a consequence, we see a precisely estimated age profile of the amount borrowed Higher i-rates for default-prone households (that we identify as the young or self-employed) when there is more information about borrowers 75
76 C.3. FINANCIAL DEVELOPMENT PROXY: DEPTH OF INFORMATION ON BORROWERS (0 TO 6) 76
77 4. EFFECTS OF INSTITUTIONS ON ESTIMATED PROFILES Multivariate analysis So far we have reported simple cross-country regressions of debt-related magnitudes on institutions following theoretical literature. treating the set of countries as a (small sample) of an underlying population of countries. standard errors reflect (i) variance of the coefficients across the population of countries and (ii) sampling variance of the first step estimates We also perform a multivariate analysis to (i) control for share of FRM, (ii) analyze the relative importance of various institutions. we take the within sample regressions of the first stage coefficients on each institution as the quantities of interest. s.e. only reflect sampling error in the first stage coefficients. comparable to the conventional standard errors calculated by default in the pooled version of the 2nd stage estimator 77

78 4. EFFECTS OF INSTITUTIONS ON ESTIMATED PROFILES Multivariate results: sample-average multiple regressions 78
79 4. EFFECTS OF INSTITUTIONS ON ESTIMATED PROFILES Summary on institution effects (Holding other institutions constant) Time to repossession correlates strongly with many of the patterns of interest. Longer time to repossession:. diminish chances that RG has secured debt (+1 month, -1pp). diminish relatively less the chances of borrowing of the over 45. affect pricing of loans (relatively higher i-rates to low income households) Mortgage tax exemptions. conditional on borrowing, average secured debt amount held by RG is 1.38 points larger in countries without a limit on mortgage deductibility. no effect on probability of holding secured debt. some positive correlation between i-rates charged to RG and tax deductibility 79
80 4. EFFECTS OF INSTITUTIONS ON ESTIMATED PROFILES Summary on institution effects (cont.) (Holding other institutions constant) Regulatory LTVs. once all other institutions are taken into account, variation in regulatory LTV does not correlate with the fraction of borrowers or the amount borrowed. may be consequence of the (counter-intuitive) positive correlation found between existence of LTV limit and higher i-rates Prevalence of FRMs. consistent with simple supply side effects, correlates with higher i-rates charged to RG 80
81 5. CONCLUSIONS Socio-economic and demographic factors are important correlates of household debt. But considerable heterogeneity in the relative importance of these factors across countries Among the institutions we consider, length of repossession best explains these differences. One standard deviation longer time to repossess (15 months) associated with. 10 to 16 percent lower chances that the RG holds secured debt.. varying impact on amounts by age/cohort (falls by 12% among households and 6% among over 45).. interest rates paid by lower-income households are 30 bp higher. Absence of limits to tax deductibility accounts for higher debt amount Variation in LTVs, depth of information about borrowers or in low-initial payment mortgages do not account for the distribution of debt across countries and groups of the population. 81
82 THANK YOU 82
83 APPENDIX: SAMPLE SIZE, BY COUNTRY 83
84 84
85 INSTITUTIONS: DATA USED 85
THE DISTRIBUTION OF DEBT ACROSS EU COUNTRIES:
 THE DISTRIBUTION OF DEBT ACROSS EU COUNTRIES: The role of individual characteristics, institutions and credit conditions Olympia Bover, José María Casado, Sonia Costa, Philip Du Caju, Yvonne McCarthy,
THE DISTRIBUTION OF DEBT ACROSS EU COUNTRIES:
 THE DISTRIBUTION OF DEBT ACROSS EU COUNTRIES: The role of individual characteristics, institutions and credit conditions Bover, Casado, Costa, Du Caju, McCarthy, Sierminska, Tzamourani, Villanueva, Zavadil
Pockets of risk in the Belgian mortgage market - Evidence from the Household Finance and Consumption survey 1
 IFC-National Bank of Belgium Workshop on "Data needs and Statistics compilation for macroprudential analysis" Brussels, Belgium, 18-19 May 2017 Pockets of risk in the Belgian mortgage market - Evidence
HOUSEHOLDS INDEBTEDNESS: A MICROECONOMIC ANALYSIS BASED ON THE RESULTS OF THE HOUSEHOLDS FINANCIAL AND CONSUMPTION SURVEY*
 HOUSEHOLDS INDEBTEDNESS: A MICROECONOMIC ANALYSIS BASED ON THE RESULTS OF THE HOUSEHOLDS FINANCIAL AND CONSUMPTION SURVEY* Sónia Costa** Luísa Farinha** 133 Abstract The analysis of the Portuguese households
Introduction to the. Eurosystem. Household Finance and Consumption Survey
 ECB-PUBLIC The opinions of the author do not necessarily reflect the views of the ECB or the Eurosystem Introduction to the Eurosystem Household Finance and Consumption Survey Sébastien Pérez-Duarte OEE
The Eurosystem Household Finance and Consumption Survey
 ECB-PUBLIC DRAFT The Eurosystem Household Finance and Consumption Survey Carlos Sánchez Muñoz Frankfurt Fudan Financial Research Forum 25 September 2015 ECB-PUBLIC DRAFT ECB-PUBLIC DRAFT Outline 1. Background
Household Finance and Consumption Survey in Malta: The Results from the Second Wave
 Household Finance and Consumption Survey in Malta: The Results from the Second Wave Daniel Gaskin Juergen Attard Karen Caruana 1 WP/02/2017 1 Mr D Gaskin, Mr J Attard and Ms K Caruana are an Economist
HOUSEHOLD DEBT AND CREDIT CONSTRAINTS: COMPARATIVE MICRO EVIDENCE FROM FOUR OECD COUNTRIES
 HOUSEHOLD DEBT AND CREDIT CONSTRAINTS: COMPARATIVE MICRO EVIDENCE FROM FOUR OECD COUNTRIES Jonathan Crook (University of Edinburgh) and Stefan Hochguertel (VU University Amsterdam) Discussion by Ernesto
Wealth inequality in the euro area
 Wealth inequality in the euro area Results of the Household Finance and Consumption Surveys 2010 and 2014 Aurel Schubert 23 June 2017 The views expressed are those of the speaker and not necessarily those
Reamonn Lydon & Tara McIndoe-Calder Central Bank of Ireland CBI. NERI, 22 April 2015
 The Household Finance and Consumption Survey The Financial Position of Irish Households Reamonn Lydon & Tara McIndoe-Calder Central Bank of Ireland CBI NERI, 22 April 2015 Disclaimer Any views expressed
HOUSEHOLD FINANCE AND CONSUMPTION SURVEY: A COMPARISON OF THE MAIN RESULTS FOR MALTA WITH THE EURO AREA AND OTHER PARTICIPATING COUNTRIES
 HOUSEHOLD FINANCE AND CONSUMPTION SURVEY: A COMPARISON OF THE MAIN RESULTS FOR MALTA WITH THE EURO AREA AND OTHER PARTICIPATING COUNTRIES Article published in the Quarterly Review 217:2, pp. 27-33 BOX
In Debt and Approaching Retirement: Claim Social Security or Work Longer?
 AEA Papers and Proceedings 2018, 108: 401 406 https://doi.org/10.1257/pandp.20181116 In Debt and Approaching Retirement: Claim Social Security or Work Longer? By Barbara A. Butrica and Nadia S. Karamcheva*
How Do Households Allocate Their Assets? Stylized Facts from the Eurosystem Household Finance and Consumption Survey
 How Do Households Allocate Their Assets? Stylized Facts from the Eurosystem Household Finance and Consumption Survey Luc Arrondel, a Laura Bartiloro, b Pirmin Fessler, c Peter Lindner, c Thomas Y. Mathä,
Deleveraging and Consumption in a Highly Indebted Property Market
 and Consumption in a Highly Indebted Property Market Yvonne McCarthy and Kieran McQuinn Central Bank of Ireland & Economic and Social Research Institute www.esri.ie Irish Economic Policy Conference February
Indebtedness of households and the cost of debt by household type and income group. Research note 10/2014
 Indebtedness of households and the cost of debt by household type and income group Research note 10/2014 Eva Sierminska December 2014 EUROPEAN COMMISSION Directorate-General for Employment, Social Affairs
How do households choose to allocate their wealth? Some stylized facts derived from the Eurosystem Household Finance and Consumption Survey
 How do households choose to allocate their wealth? Some stylized facts derived from the Eurosystem Household Finance and Consumption Survey Conference on household finance and consumption; European Central
YOUTH UNEMPLOYMENT IN THE EURO AREA
 YOUTH UNEMPLOYMENT IN THE EURO AREA Ramon Gomez-Salvador and Nadine Leiner-Killinger European Central Bank EKONOMSKI INSTITUT PRAVNE FAKULTETE 14 December 2007 Ljubljana Outline I. Introduction II. Stylised
Pension Wealth and Household Saving in Europe: Evidence from SHARELIFE
 Pension Wealth and Household Saving in Europe: Evidence from SHARELIFE Rob Alessie, Viola Angelini and Peter van Santen University of Groningen and Netspar PHF Conference 2012 12 July 2012 Motivation The
ON THE ASSET ALLOCATION OF A DEFAULT PENSION FUND
 ON THE ASSET ALLOCATION OF A DEFAULT PENSION FUND Magnus Dahlquist 1 Ofer Setty 2 Roine Vestman 3 1 Stockholm School of Economics and CEPR 2 Tel Aviv University 3 Stockholm University and Swedish House
Household debt and spending in the United Kingdom
 Household debt and spending in the United Kingdom Philip Bunn and May Rostom Bank of England Fourth ECB conference on household finance and consumption 17 December 2015 1 Outline Motivation Literature/theory
Determination of manufacturing exports in the euro area countries using a supply-demand model
 Determination of manufacturing exports in the euro area countries using a supply-demand model By Ana Buisán, Juan Carlos Caballero and Noelia Jiménez, Directorate General Economics, Statistics and Research
Exploring differences in financial literacy across countries: the role of individual characteristics, experience, and institutions
 Exploring differences in financial literacy across countries: the role of individual characteristics, experience, and institutions Andrej Cupák National Bank of Slovakia Pirmin Fessler Oesterreichische
Simulating the impact of borrower-based macroprudential policies on mortgages and the real estate sector in Austria
 Simulating the impact of borrower-based macroprudential policies on mortgages and the real estate sector in Austria Evidence from the Household Finance and Consumption Survey 2014 Nicolas Albacete and
Copyright 2011 Pearson Education, Inc. Publishing as Addison-Wesley.
 Appendix: Statistics in Action Part I Financial Time Series 1. These data show the effects of stock splits. If you investigate further, you ll find that most of these splits (such as in May 1970) are 3-for-1
HOUSEHOLDS LENDING MARKET IN THE ENLARGED EUROPE. Debora Revoltella and Fabio Mucci copyright with the author New Europe Research
 HOUSEHOLDS LENDING MARKET IN THE ENLARGED EUROPE Debora Revoltella and Fabio Mucci copyright with the author New Europe Research ECFin Workshop on Housing and mortgage markets and the EU economy, Brussels,
The distribution of wealth between households
 The distribution of wealth between households Research note 11/2013 1 SOCIAL SITUATION MONITOR APPLICA (BE), ATHENS UNIVERSITY OF ECONOMICS AND BUSINESS (EL), EUROPEAN CENTRE FOR SOCIAL WELFARE POLICY
Household Income Distribution and Working Time Patterns. An International Comparison
 Household Income Distribution and Working Time Patterns. An International Comparison September 1998 D. Anxo & L. Flood Centre for European Labour Market Studies Department of Economics Göteborg University.
Online Robustness Appendix to Are Household Surveys Like Tax Forms: Evidence from the Self Employed
 Online Robustness Appendix to Are Household Surveys Like Tax Forms: Evidence from the Self Employed March 01 Erik Hurst University of Chicago Geng Li Board of Governors of the Federal Reserve System Benjamin
Working Paper Series. Wealth effects on consumption across the wealth distribution: empirical evidence. No 1817 / June 2015
 Working Paper Series Luc Arrondel, Pierre Lamarche and Frédérique Savignac Wealth effects on consumption across the wealth distribution: empirical evidence No 1817 / June 2015 Note: This Working Paper
State Dependency of Monetary Policy: The Refinancing Channel
 State Dependency of Monetary Policy: The Refinancing Channel Martin Eichenbaum, Sergio Rebelo, and Arlene Wong May 2018 Motivation In the US, bulk of household borrowing is in fixed rate mortgages with
52 ECB. The 2015 Ageing Report: how costly will ageing in Europe be?
 Box 7 The 5 Ageing Report: how costly will ageing in Europe be? Europe is facing a demographic challenge. The old age dependency ratio, i.e. the share of people aged 65 or over relative to the working
THE DISTRIBUTION OF DEBT ACROSS EURO AREA COUNTRIES: THE ROLE OF INDIVIDUAL CHARACTERISTICS, INSTITUTIONS AND CREDIT CONDITIONS
 THE DISTRIBUTION OF DEBT ACROSS EURO AREA COUNTRIES: THE ROLE OF INDIVIDUAL CHARACTERISTICS, INSTITUTIONS AND CREDIT CONDITIONS Olympia Bover, Jose Maria Casado, Sonia Costa, Philip Du Caju, Yvonne McCarthy,
Indebted households in the euro area: a micro perspective using the EU-SILC
 Indebted households in the euro area: a micro perspective using the EU-SILC 2 nd European User Conference for EU-LFS and EU-SILC Mannheim 31 March-1 April 211 Ramon Gomez-Salvador, Adriana Lojschova and
Household Balance Sheets and Debt an International Country Study
 47 Household Balance Sheets and Debt an International Country Study Jacob Isaksen, Paul Lassenius Kramp, Louise Funch Sørensen and Søren Vester Sørensen, Economics INTRODUCTION AND SUMMARY What are the
Bank Contagion in Europe
 Bank Contagion in Europe Reint Gropp and Jukka Vesala Workshop on Banking, Financial Stability and the Business Cycle, Sveriges Riksbank, 26-28 August 2004 The views expressed in this paper are those of
Internet Appendix. The survey data relies on a sample of Italian clients of a large Italian bank. The survey,
 Internet Appendix A1. The 2007 survey The survey data relies on a sample of Italian clients of a large Italian bank. The survey, conducted between June and September 2007, provides detailed financial and
Labour Supply, Taxes and Benefits
 Labour Supply, Taxes and Benefits William Elming Introduction Effect of taxes and benefits on labour supply a hugely studied issue in public and labour economics why? Significant policy interest in topic
Data Appendix. A.1. The 2007 survey
 Data Appendix A.1. The 2007 survey The survey data used draw on a sample of Italian clients of a large Italian bank. The survey was conducted between June and September 2007 and elicited detailed financial
Business cycle fluctuations Part II
 Understanding the World Economy Master in Economics and Business Business cycle fluctuations Part II Lecture 7 Nicolas Coeurdacier nicolas.coeurdacier@sciencespo.fr Lecture 7: Business cycle fluctuations
Wealth Inequality Reading Summary by Danqing Yin, Oct 8, 2018
 Summary of Keister & Moller 2000 This review summarized wealth inequality in the form of net worth. Authors examined empirical evidence of wealth accumulation and distribution, presented estimates of trends
Household debt burden and financial vulnerability in Luxembourg 1
 IFC-National Bank of Belgium Workshop on "Data needs and Statistics compilation for macroprudential analysis" Brussels, Belgium, 18-19 May 2017 Household debt burden and financial vulnerability in Luxembourg
Public Employees as Politicians: Evidence from Close Elections
 Public Employees as Politicians: Evidence from Close Elections Supporting information (For Online Publication Only) Ari Hyytinen University of Jyväskylä, School of Business and Economics (JSBE) Jaakko
Wealth Inequality and Homeownership in Europe
 Wealth Inequality and Homeownership in Europe Leo Kaas, Georgi Kocharkov, and Edgar Preugschat December 21, 2017 Abstract The recently published Household Finance and Consumption Survey has revealed large
New Evidence on the Demand for Advice within Retirement Plans
 Research Dialogue Issue no. 139 December 2017 New Evidence on the Demand for Advice within Retirement Plans Abstract Jonathan Reuter, Boston College and NBER, TIAA Institute Fellow David P. Richardson
Additional Evidence and Replication Code for Analyzing the Effects of Minimum Wage Increases Enacted During the Great Recession
 ESSPRI Working Paper Series Paper #20173 Additional Evidence and Replication Code for Analyzing the Effects of Minimum Wage Increases Enacted During the Great Recession Economic Self-Sufficiency Policy
The data definition file provided by the authors is reproduced below: Obs: 1500 home sales in Stockton, CA from Oct 1, 1996 to Nov 30, 1998
 Economics 312 Sample Project Report Jeffrey Parker Introduction This project is based on Exercise 2.12 on page 81 of the Hill, Griffiths, and Lim text. It examines how the sale price of houses in Stockton,
Mortgage Rates, Household Balance Sheets, and Real Economy
 Mortgage Rates, Household Balance Sheets, and Real Economy May 2015 Ben Keys University of Chicago Harris Tomasz Piskorski Columbia Business School and NBER Amit Seru Chicago Booth and NBER Vincent Yao
This presentation. Downward wage rigidity in EU countries. Based on recent papers on wage rigidity in European countries:
 Downward wage rigidity in EU countries OECD - DELSA seminar, Paris, October 2010 Philip Du Caju This presentation Based on recent papers on wage rigidity in European countries: Babecký J., Ph. Du Caju,
Inequality and Poverty in EU- SILC countries, according to OECD methodology RESEARCH NOTE
 Inequality and Poverty in EU- SILC countries, according to OECD methodology RESEARCH NOTE Budapest, October 2007 Authors: MÁRTON MEDGYESI AND PÉTER HEGEDÜS (TÁRKI) Expert Advisors: MICHAEL FÖRSTER AND
Macroeconomic Experiences and Risk-Taking of Euro Area Households
 Macroeconomic Experiences and Risk-Taking of Euro Area Households Miguel Ampudia (ECB) and Michael Ehrmann (Bank of Canada) Frankfurt, October 18th, 2013 The views expressed here are our own and not necessarily
According to the life cycle theory, households take. Do wealth inequalities have an impact on consumption? 1
 Do wealth inequalities have an impact on consumption? Frédérique SAVIGNAC Microeconomic and Structural Analysis Directorate The ideas presented in this article reflect the personal opinions of their authors
 TABLE I SUMMARY STATISTICS Panel A: Loan-level Variables (22,176 loans) Variable Mean S.D. Pre-nuclear Test Total Lending (000) 16,479 60,768 Change in Log Lending -0.0028 1.23 Post-nuclear Test Default
The Labor Market Consequences of Adverse Financial Shocks
 The Labor Market Consequences of Adverse Financial Shocks November 2012 Unemployment rate on the two sides of the Atlantic Credit to the private sector over GDP Credit to private sector as a percentage
Appendix A. Additional Results
 Appendix A Additional Results for Intergenerational Transfers and the Prospects for Increasing Wealth Inequality Stephen L. Morgan Cornell University John C. Scott Cornell University Descriptive Results
Household Finance And Consumption
 Household Finance And Consumption Survey vs. Report published in the Quarterly Review 213:3 HOUSEHOLD FINANCE AND CONSUMPTION SURVEY MALTA VS. EURO AREA 1 In 211 the Central Bank of finalised a Household
Macroprudential Policy Analysis for Real Estate Markets in the euro area
 Reiner Martin Deputy Head Macroprudential Policies Division European Central Bank Macroprudential Policy Analysis for Real Estate Markets in the euro area Oslo 21 November 2017 Rubric Outline 1 Principles
II. Underlying domestic macroeconomic imbalances fuelled current account deficits
 II. Underlying domestic macroeconomic imbalances fuelled current account deficits Macroeconomic imbalances, including housing and credit bubbles, contributed to significant current account deficits in
Exploring differences in financial literacy across countries: the role of individual characteristics, experience, and institutions
 Exploring differences in financial literacy across countries: the role of individual characteristics, experience, and institutions Andrej Cupák Pirmin Fessler Maria Silgoner Elisabeth Ulbrich July 26,
Capital allocation in Indian business groups
 Capital allocation in Indian business groups Remco van der Molen Department of Finance University of Groningen The Netherlands This version: June 2004 Abstract The within-group reallocation of capital
II.2. Member State vulnerability to changes in the euro exchange rate ( 35 )
") II.2. Member State vulnerability to changes in the euro exchange rate ( 35 ) There have been significant fluctuations in the euro exchange rate since the start of the monetary union. This section assesses
II.2. Member State vulnerability to changes in the euro exchange rate ( 35 ) There have been significant fluctuations in the euro exchange rate since the start of the monetary union. This section assesses
Gender Differences in the Labor Market Effects of the Dollar
 Gender Differences in the Labor Market Effects of the Dollar Linda Goldberg and Joseph Tracy Federal Reserve Bank of New York and NBER April 2001 Abstract Although the dollar has been shown to influence
Characteristics of the euro area business cycle in the 1990s
 Characteristics of the euro area business cycle in the 1990s As part of its monetary policy strategy, the ECB regularly monitors the development of a wide range of indicators and assesses their implications
Appendix B: Methodology and Finding of Statistical and Econometric Analysis of Enterprise Survey and Portfolio Data
 Appendix B: Methodology and Finding of Statistical and Econometric Analysis of Enterprise Survey and Portfolio Data Part 1: SME Constraints, Financial Access, and Employment Growth Evidence from World
3 The recent strength of survey-based indicators: what does it tell us about the depth and breadth of real GDP growth?
 3 The recent strength of survey-based indicators: what does it tell us about the depth and breadth of real GDP growth? Prepared by Gabe de Bondt and Magnus Forsells Recent opinion surveys point to a solid
The Trend Reversal of the Private Credit Market in the EU
 The Trend Reversal of the Private Credit Market in the EU Key Findings of the ECRI Statistical Package 2016 Roberto Musmeci*, September 2016 The ECRI Statistical Package 2016, Lending to Households and
Cash holdings determinants in the Portuguese economy 1
 17 Cash holdings determinants in the Portuguese economy 1 Luísa Farinha Pedro Prego 2 Abstract The analysis of liquidity management decisions by firms has recently been used as a tool to investigate the
Getting ready to prevent and tame another house price bubble
 Macroprudential policy conference Should macroprudential policy target real estate prices? 11-12 May 2017, Vilnius Getting ready to prevent and tame another house price bubble Tomas Garbaravičius Board
Heterogeneity and the ECB s monetary policy
 Benoît Cœuré Member of the Executive Board Heterogeneity and the ECB s monetary policy Paris, 29 March 2019 Persistence of inflation differentials main pre-crisis concern Inflation dispersion in the euro
INTANGIBLE INVESTMENT AND INNOVATION IN THE EU: FIRM- LEVEL EVIDENCE FROM THE 2017 EIB INVESTMENT SURVEY 49
 CHAPTER II.6 INTANGIBLE INVESTMENT AND INNOVATION IN THE EU: FIRM- LEVEL EVIDENCE FROM THE 2017 EIB INVESTMENT SURVEY 49 Debora Revoltella and Christoph Weiss European Investment Bank, Economics Department
Yannan Hu 1, Frank J. van Lenthe 1, Rasmus Hoffmann 1,2, Karen van Hedel 1,3 and Johan P. Mackenbach 1*
 Hu et al. BMC Medical Research Methodology (2017) 17:68 DOI 10.1186/s12874-017-0317-5 RESEARCH ARTICLE Open Access Assessing the impact of natural policy experiments on socioeconomic inequalities in health:
Did the Social Assistance Take-up Rate Change After EI Reform for Job Separators?
 Did the Social Assistance Take-up Rate Change After EI for Job Separators? HRDC November 2001 Executive Summary Changes under EI reform, including changes to eligibility and length of entitlement, raise
Credit Discrimination in European Households
 Credit Discrimination in European Households Evidence from survey data in Eurozone and the case of Greece E. Patatouka 1 A. Fasianos 2 1 Department of Urbanism, Geography University Paris 8 2 Department
How do inflation expectations impact consumer behaviour?
 How do inflation expectations impact consumer behaviour? Ioana A. Duca, Geoff Kenny, Andreas Reuter August 19, 2016 Abstract This paper investigates empirically the relationship between consumer inflation
Evaluation of the effects of the active labour measures on reducing unemployment in Romania
 National Scientific Research Institute for Labor and Social Protection Evaluation of the effects of the active labour measures on reducing unemployment in Romania Speranta PIRCIOG, PhD Senior Researcher
Downward Nominal Wage Rigidity in the OECD
 Downward Nominal Wage Rigidity in the OECD Steinar Holden and Fredrik Wulfsberg November 25, 2005 fwu/november 25, 2005 Motivation Conventional view: Long run Phillips curve is vertical. No long run relationship
Labour Supply and Taxes
 Labour Supply and Taxes Barra Roantree Introduction Effect of taxes and benefits on labour supply a hugely studied issue in public and labour economics why? Significant policy interest in topic how should
How strong is the wealth channel of monetary policy transmission? A microeconometric evaluation for Austria
 How strong is the wealth channel of monetary policy transmission? Nicolas Albacete, Peter Lindner 1 We study the magnitude and the sources of wealth effects on consumer spending in Austria by using household-level
Flash Eurobarometer 386 THE EURO AREA REPORT
 Eurobarometer THE EURO AREA REPORT Fieldwork: October 2013 Publication: November 2013 This survey has been requested by the European Commission, Directorate-General for Economic and Financial Affairs and
Macroeconomic Policies in Europe: Quo Vadis A Comment
 Macroeconomic Policies in Europe: Quo Vadis A Comment February 12, 2016 Helene Schuberth Outline Staff Projection of the Euro Area Monetary Policy Investment Rebalancing in the euro area Fiscal Policy
Fiscal Divergence and Business Cycle Synchronization: Irresponsibility is Idiosyncratic. Zsolt Darvas, Andrew K. Rose and György Szapáry
 Fiscal Divergence and Business Cycle Synchronization: Irresponsibility is Idiosyncratic Zsolt Darvas, Andrew K. Rose and György Szapáry 1 I. Motivation Business cycle synchronization (BCS) the critical
To What Extent is Household Spending Reduced as a Result of Unemployment?
 To What Extent is Household Spending Reduced as a Result of Unemployment? Final Report Employment Insurance Evaluation Evaluation and Data Development Human Resources Development Canada April 2003 SP-ML-017-04-03E
Interaction of household income, consumption and wealth - statistics on main results
 Interaction of household income, consumption and wealth - statistics on main results Statistics Explained Data extracted in June 2017. Most recent data: Further Eurostat information, Main tables and Database.
Firm level evidence on wage dynamics in Europe
 Firm level evidence on wage dynamics in Europe Ana Lamo European Central Bank* Bruegel 11Dec 2012 *Standar disclaimers apply 1 Outline of the presentation I. The main features of wage behavior at the firm
Market Microstructure Invariants
 Market Microstructure Invariants Albert S. Kyle and Anna A. Obizhaeva University of Maryland TI-SoFiE Conference 212 Amsterdam, Netherlands March 27, 212 Kyle and Obizhaeva Market Microstructure Invariants
ECB Report on Financial Integration in Europe April 2008 Lucas Papademos
 ECB Report on Financial Integration in Europe April 2008 Lucas Papademos Frankfurt am Main, 29 April 2008 1 Structure of the report Chapter 1: State of financial integration in the euro area Assessment
THE IMPACT OF FINANCIAL STABILITY REPORT S WARNINGS ON THE LOAN TO VALUE RATIO. Andrés Alegría Rodrigo Alfaro Felipe Córdova Central Bank of Chile
 THE IMPACT OF FINANCIAL STABILITY REPORT S WARNINGS ON THE LOAN TO VALUE RATIO Andrés Alegría Rodrigo Alfaro Felipe Córdova Central Bank of Chile * The views are those of the authors and do not necessarily
Ministry of Health, Labour and Welfare Statistics and Information Department
 Special Report on the Longitudinal Survey of Newborns in the 21st Century and the Longitudinal Survey of Adults in the 21st Century: Ten-Year Follow-up, 2001 2011 Ministry of Health, Labour and Welfare
Housing Markets and the Macroeconomy During the 2000s. Erik Hurst July 2016
 Housing Markets and the Macroeconomy During the 2s Erik Hurst July 216 Macro Effects of Housing Markets on US Economy During 2s Masked structural declines in labor market o Charles, Hurst, and Notowidigdo
The Effect of Unemployment on Household Composition and Doubling Up
 The Effect of Unemployment on Household Composition and Doubling Up Emily E. Wiemers WORKING PAPER 2014-05 DEPARTMENT OF ECONOMICS UNIVERSITY OF MASSACHUSETTS BOSTON The Effect of Unemployment on Household
COMMUNITY ADVANTAGE PANEL SURVEY: DATA COLLECTION UPDATE AND ANALYSIS OF PANEL ATTRITION
 COMMUNITY ADVANTAGE PANEL SURVEY: DATA COLLECTION UPDATE AND ANALYSIS OF PANEL ATTRITION Technical Report: February 2013 By Sarah Riley Qing Feng Mark Lindblad Roberto Quercia Center for Community Capital
AUGUST THE DUNNING REPORT: DIMENSIONS OF CORE HOUSING NEED IN CANADA Second Edition
 AUGUST 2009 THE DUNNING REPORT: DIMENSIONS OF CORE HOUSING NEED IN Second Edition Table of Contents PAGE Background 2 Summary 3 Trends 1991 to 2006, and Beyond 6 The Dimensions of Core Housing Need 8
THE PERSISTENCE OF UNEMPLOYMENT AMONG AUSTRALIAN MALES
 THE PERSISTENCE OF UNEMPLOYMENT AMONG AUSTRALIAN MALES Abstract The persistence of unemployment for Australian men is investigated using the Household Income and Labour Dynamics Australia panel data for
Economic Preparation for Retirement and the Risk of Out-of-pocket Long-term Care Expenses
 Economic Preparation for Retirement and the Risk of Out-of-pocket Long-term Care Expenses Michael D Hurd With Susann Rohwedder and Peter Hudomiet We gratefully acknowledge research support from the Social
Internet Appendix for A Model of Mortgage Default
 Internet Appendix for A Model of Mortgage Default John Y. Campbell 1 João F. Cocco 2 This version: February 2014 1 Department of Economics, Harvard University, Littauer Center, Cambridge, MA 02138, US
Really Uncertain Business Cycles
 Really Uncertain Business Cycles Nick Bloom (Stanford & NBER) Max Floetotto (McKinsey) Nir Jaimovich (Duke & NBER) Itay Saporta-Eksten (Stanford) Stephen J. Terry (Stanford) SITE, August 31 st 2011 1 Uncertainty
Financial liberalization and the relationship-specificity of exports *
 Financial and the relationship-specificity of exports * Fabrice Defever Jens Suedekum a) University of Nottingham Center of Economic Performance (LSE) GEP and CESifo Mercator School of Management University
The trade balance and fiscal policy in the OECD
 European Economic Review 42 (1998) 887 895 The trade balance and fiscal policy in the OECD Philip R. Lane *, Roberto Perotti Economics Department, Trinity College Dublin, Dublin 2, Ireland Columbia University,
Trinity College and Darwin College. University of Cambridge. Taking the Art out of Smart Beta. Ed Fishwick, Cherry Muijsson and Steve Satchell
 Trinity College and Darwin College University of Cambridge 1 / 32 Problem Definition We revisit last year s smart beta work of Ed Fishwick. The CAPM predicts that higher risk portfolios earn a higher return
Rescuing the Interest Rate Pass Through: Role of Unconventional Policies & Banks Financing Choices
 Rescuing the Interest Rate Pass Through: Role of Unconventional Policies & Banks Financing Choices Francesco Paolo Mongelli (ECB & Goethe Univ.) ASSOCIATION FOR COMPARATIVE ECONOMIC STUDIES Poster Session,
Supplement March Trends in poverty and social exclusion between 2012 and March 2014 I 1
 Supplement March 2014 Trends in poverty and social exclusion between 2012 and 2013 March 2014 I 1 This supplement to the Quarterly Review provides in-depth analysis of recent labour market and social developments.