THE DISTRIBUTION OF DEBT ACROSS EU COUNTRIES:
|
|
|
- Brittany Dalton
- 5 years ago
- Views:
Transcription
1 THE DISTRIBUTION OF DEBT ACROSS EU COUNTRIES: The role of individual characteristics, institutions and credit conditions Bover, Casado, Costa, Du Caju, McCarthy, Sierminska, Tzamourani, Villanueva, Zavadil Household Wealth Data and Public Policy Bank of England, London, 9-10 March 2015
2 2 1. INTRODUCTION Purpose of this paper: 1. Document country differences in the relationship between household characteristics and secured debt (i) Holding debt (ii) Quantity of debt (iii) Interest rate 2. Study the association of these differences with differences in institutions and credit conditions Legal enforcement of contracts Tax treatment of mortgage payments Regulatory LTV ratios Also: prevalence of fixed rate mortgages, information about borrowers, financial literacy
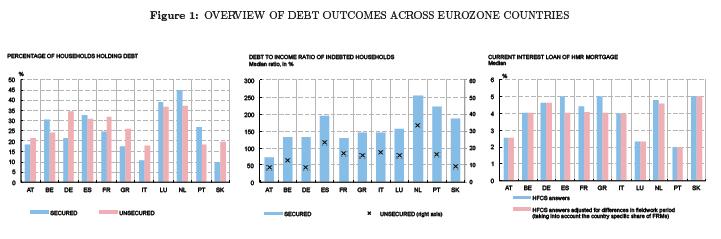
3 3 1. INTRODUCTION We use comparable micro data across countries in the EMU There are striking differences in the incidence, amount, and cost of debt across countries. Household Finance and Consumption Survey (2010). 45%(32%) households in NL(Spain) outstanding secured debt. 10% in IT or Slovakia Moreover, the patterns of debt by age and income are substantially different across countries
4 1. INTRODUCTION We put together data on many institutions Assess predictive power of each institution by examining its impact on three separate debt outcomes (extensive margin, intensive margin, cost) this provides information about the channel through which each institution affects borrowing behaviour Our approach leads to effects of institutions on household debt which have causal validity under less restrictive conditions than pooling data across countries using interactions of household characteristics and institutional variables we allow for endogeneity with respect to unobserved country effects, both additive and interacting with the remaining household characteristics (more later) 4
5 5 1. INTRODUCTION Preview of salient results: Demographics - i-rates vary with significantly with income in Italy, Portugal, Luxembourg, and France - the age profile of debt holding is hump shaped in some countries like Spain or Belgium but flat in others (e.g. Austria) - there are large differences in debt holding probabilities across countries at any age or income level - for a group of comparable households there are large differences in debt holding probabilities across countries: IT 12%, AT DE 25%, LU NT PT 45-50%, ES 65% (also in amounts and i-rates)
6 6 1. INTRODUCTION Preview of salient results (continued): Institutions - length of repossession best predicts the differences in debt distributions across countries for countries with one standard deviation (15 months) longer repossession period: Fraction of borrowers is 16% smaller Amount borrowed is lower among the youngest (12% lower than RG) i-rate paid by high income households is 0.3 pp lower - remaining institutions deliver less robust results
7 7 RELATED LITERATURE 1. Determinants of credit holdings across countries. Djankov et al, 2007, Jappelli et 2005 Christelis et al., We study the distribution of debt incidence, amount and cost across groups of the population 2. Empirical assessments of the impact of institutions on debt-related outcomes. Gropp et al (bankruptcy), Chiuri and Jappelli 2003 (Loan to Values). We analyze the relative explanatory power of several institutions 3. Quantitative macro literature studying the role of housing tax deductions, bankruptcy institutions or credit market conditions on distribution of debt. Citations along the way.. Use the diversity of European experiences.
8 8 2. DATA The HFCS is a Eurosystem initiative aimed at collecting comparable microlevel information It collects information on household income, assets, liabilities and many household characteristics The first wave was conducted in 15 euro area countries (we use 11/12)* The first wave was conducted between end-2008 and mid-2011 Sample size of just over 62,000 households [*Finland excluded because debt information not comparable; Cyprus not included because education (and marital status) collected only for the respondent; Malta not included although we have now received private information on continuous age variables; Slovakia excluded from interest rate analysis because of highly imprecise estimates]
9 2. DATA Debt variables Debt holding i. Mortgages or loans using HMR or other properties as collateral Debt balance (extensive margin) i. Secured debt amount (intensive margin) Interest rate i. On HMR mortgage (cost of debt) We focus on secured debt to avoid conditioning on endogenous choices (e.g. home-ownership) [To correct for differences in fieldwork periods across countries: (i) We convert all debt balances to 2010 values by adjusting by the country-specific HICP, (ii) Interest rate adjusted by the change of Euribor multiplied by the % of adjustable rate mortgages] 9
10 10 3. EMPIRICAL METHODOLOGY We follow a two-step approach: Step 1: Household-Country Regressions Step 2: Cross-country Regressions
11 11 3. EMPIRICAL METHODOLOGY Our approach is identical to running a sequence of partially pooled regressions, e.g. for k=1 It allows for endogeneity of with respect to omitted country variables and reverse causality by including and as country fixed effects Alternatives would collapse all 2 nd steps into a fully pooled regression: or one pooling slopes but not intercepts, so that additive country effects are still allowed: Our effects of institutions and household characteristics have causal validity (and validity as unbiased predictors) under less restrictive conditions than either of these two alternatives. The reason is that two-step estimates control for unobserved country effects in a more flexible way than the pooled regressions.
12 3. EMPIRICAL METHODOLOGY THE FIRST STEP: MODEL OF DEBT OUTCOMES 12 First-step outcomes - Holding vs not holding debt (logit*) - Quantity of debt held conditional on holding debt (OLS) - Interest rate (OLS) First-step covariates of core members of the household - the respondent to the survey and his/her partner (if any) [ Odds ratio (invariant to values of ) Holding debt probability of a common reference group across countries (levels comparison) ]
13 13 Age 3. EMPIRICAL METHODOLOGY THE FIRST STEP: MODEL OF DEBT OUTCOMES i. age of the oldest core household member (five intervals) ii. we take into account the age of the partner by including the age difference between the two Education i. education of the more educated core member (three dummy variables) ii. a binary variable to indicate if the other member has lower education than the most educated. Labour status i. labour status of the core member with the highest income (employee, self-employed, retired, and unemployed or inactive) ii. a binary variable denoting if the other member is working
14 3. EMPIRICAL METHODOLOGY THE FIRST STEP: MODEL OF DEBT OUTCOMES 14 In specifying the characteristics of household members we have: Focused on the difference between the two members Parsimonious specification as compared to defining the full set of dummies for the two partners Focused on the traits of the household as a group No need to define a "reference person" ex ante, Reference person problematic as his/her characteristics would then be overemphasized relative to others In addition: couple dummy, log(nº of adults), log(total income)
15 3. EMPIRICAL METHODOLOGY 2 ND STEP: IMPACT OF INSTITUTIONS ON 1 ST STEP COEFFS. 15 We regress each of the estimated effects from the first step (slopes and intercept) on each of the institutional variables of interest. we analyze the effect of each institution separately.. multivariate analysis (holding constant other relevant institutions) We focus on the institutions that have been highlighted in the literature on household debt [Estimations use all 5 implicates and are weighted by (i) population weights in part one and (ii) country sample size in part two]
16 4. RESULTS: THE ASSOCIATION BETWEEN DEBT HOLDINGS AND HOUSEHOLD CHARACTERISTICS SECURED DEBT: EXTENSIVE MARGIN: The Probability of Holding Debt INTENSIVE MARGIN: The Amount of Debt Held PRICE: Interest Rate of Secured Debt
17 4. RESULTS: THE ASSOCIATION BETWEEN DEBT HOLDINGS AND HOUSEHOLD CHARACTERISTICS SECURED DEBT: EXTENSIVE MARGIN: The Probability of Holding Debt INTENSIVE MARGIN: The Amount of Debt Held PRICE: Interest Rate of Secured Debt UNSECURED DEBT: Extensive and Intensive Margin
18 4. RESULTS: SECURED DEBT EXTENSIVE MARGIN: THE PROBABILITY OF HOLDING DEBT 18 Figures in next slides show: - Country specific odds ratios relative to the omitted category for each group - Probability of holding secured debt for the reference group (couple, aged 35-44, medium educ., both employed, country median income) for comparable households there are large differences in debt holding probabilities across countries: IT 12%, AT DE 25%, LU NT PT 45-50%, ES 65% the relationship between secured debt holding and age has the expected hump shape in some countries (e.g. Belgium, Spain) but it is almost flat in others (e.g. Austria, Italy) higher income, higher levels of education and employment are also associated with a greater likelihood of holding secured debt household size and composition matter most significant differences across countries in the effects of age and income
19 4. RESULTS: SECURED DEBT EXTENSIVE MARGIN: THE PROBABILITY OF HOLDING DEBT 19
20 4. RESULTS: SECURED DEBT EXTENSIVE MARGIN: THE PROBABILITY OF HOLDING DEBT 20
21 4. RESULTS: SECURED DEBT EXTENSIVE MARGIN: THE PROBABILITY OF HOLDING DEBT 21
22 4. RESULTS: SECURED DEBT EXTENSIVE MARGIN: THE PROBABILITY OF HOLDING DEBT 22
23 4. RESULTS: SECURED DEBT EXTENSIVE MARGIN: THE PROBABILITY OF HOLDING DEBT 23
24 4. RESULTS: SECURED DEBT EXTENSIVE MARGIN: THE PROBABILITY OF HOLDING DEBT 24
25 4. RESULTS: SECURED DEBT EXTENSIVE MARGIN: THE PROBABILITY OF HOLDING DEBT 25
26 4. RESULTS: SECURED DEBT EXTENSIVE MARGIN: THE PROBABILITY OF HOLDING DEBT 26
27 4. RESULTS: THE ASSOCIATION BETWEEN DEBT HOLDINGS AND HOUSEHOLD CHARACTERISTICS SECURED DEBT: EXTENSIVE MARGIN: The Probability of Holding Debt INTENSIVE MARGIN: The Amount of Debt Held PRICE: Interest Rate of Secured Debt UNSECURED DEBT: Extensive and Intensive Margin
28 28 Figures in next slides show: 4. RESULTS: SECURED DEBT INTENSIVE MARGIN: THE AMOUNT OF DEBT HELD - country level OLS estimates and their confidence interval (red dots and grey lines) for comparable households there are large differences in the amount of debt held for those holding debt (from ES 32,000 to NL 150,000 ) across all countries:. the amount of secured debt is highest for households aged 16 to 34. higher income is associated with higher debt again, as in the case of holding debt or not, the most significant differences across countries occur in the estimated effects of age and income
29 4. RESULTS: SECURED DEBT INTENSIVE MARGIN: THE AMOUNT OF DEBT HELD 29
30 4. RESULTS: SECURED DEBT INTENSIVE MARGIN: THE AMOUNT OF DEBT HELD 30
31 4. RESULTS: SECURED DEBT INTENSIVE MARGIN: THE AMOUNT OF DEBT HELD 31
32 4. RESULTS: SECURED DEBT INTENSIVE MARGIN: THE AMOUNT OF DEBT HELD 32
33 4. RESULTS: SECURED DEBT INTENSIVE MARGIN: THE AMOUNT OF DEBT HELD 33
34 4. RESULTS: SECURED DEBT INTENSIVE MARGIN: THE AMOUNT OF DEBT HELD 34
35 4. RESULTS: SECURED DEBT INTENSIVE MARGIN: THE AMOUNT OF DEBT HELD 35
36 4. RESULTS: SECURED DEBT INTENSIVE MARGIN: THE AMOUNT OF DEBT HELD 36
37 4. RESULTS: THE ASSOCIATION BETWEEN DEBT HOLDINGS AND HOUSEHOLD CHARACTERISTICS SECURED DEBT: EXTENSIVE MARGIN: The Probability of Holding Debt INTENSIVE MARGIN: The Amount of Debt Held PRICE: Interest Rate of Secured Debt UNSECURED DEBT: Extensive and Intensive Margin
38 4. RESULTS: THE ASSOCIATION BETWEEN DEBT HOLDINGS AND HOUSEHOLD CHARACTERISTICS 38 Figures in next slides show: - country level OLS estimates and their confidence interval (red dots and grey lines) nominal rates across countries for RG range from 2.4 (LU) to 4.6 (DE) differences across countries by age although not generally significant higher income is associated with lower rates in Italy and to some extent in FR, LU, and PT but not in other countries
39 4. RESULTS: SECURED DEBT PRICE: INTEREST RATE 39
40 4. RESULTS: SECURED DEBT PRICE: INTEREST RATE 40
41 4. RESULTS: SECURED DEBT PRICE: INTEREST RATE 41
42 4. RESULTS: SECURED DEBT PRICE: INTEREST RATE 42
43 4. RESULTS: SECURED DEBT PRICE: INTEREST RATE 43
44 4. RESULTS: SECURED DEBT PRICE: INTEREST RATE 44
45 4. RESULTS: SECURED DEBT PRICE: INTEREST RATE 45
46 4. RESULTS: SECURED DEBT PRICE: INTEREST RATE 46
47 4. RESULTS: THE ASSOCIATION BETWEEN DEBT HOLDINGS AND HOUSEHOLD CHARACTERISTICS SECURED DEBT: 2.EXTENSIVE MARGIN: The Probability of Holding Debt INTENSIVE MARGIN: The Amount of Debt Held PRICE: Interest Rate of Secured Debt UNSECURED DEBT: Extensive and Intensive Margin
48 4. RESULTS: UNSECURED DEBT EXTENSIVE MARGIN: THE PROBABILITY OF HOLDING DEBT 48 UNSECURED DEBT SECURED DEBT
49 4. RESULTS: ESTIMATED PROFILES OF THE PROBABILITY OF HOLDING SECURED DEBT (age) 49
50 4. RESULTS: ESTIMATED PROFILES OF THE PROBABILITY OF HOLDING SECURED DEBT (total income) 50
51 4. RESULTS: Estimated Profiles of the Probability of Holding SECURED Debt (education) 51
52 52 4. EFFECTS OF INSTITUTIONS ON ESTIMATED PROFILES Second-step outcomes: Derivative and intercept effects from first-step Holding debt. probability for a reference/comparable group across countries to study level effects (RG: age 35-44, medium education, employee, couple, no difference in age nor in education, other core member working, median income of the country). odd-ratios Debt balance Interest rate Derivatives that we consider as second-step outcomes:. constant/level, age, income
53 53 4. EFFECTS OF INSTITUTIONS ON ESTIMATED PROFILES Institutions A. Legal enforcement A.1. Duration of foreclosure (months) B. Regulation: fiscal and macro-prudential framework B.1. Taxation on mortgage payments: (i) wedge between market interest rate and the after tax cost of housing, (ii) deductibility or not, no limit on deductibility B.2. Regulatory LTV: existence of regulatory limit on LTV, regulatory limit (%)
54 54 4. EFFECTS OF INSTITUTIONS ON ESTIMATED PROFILES Institutions (continued) C. Credit conditions C.1. Fixed-interest rate (if % of mortgages FMR for period longer than 10 years > 50%) C.2. Conditions that reduce initial payments: interest only payments (if % of i-only mortgage loans >10 %) C.3. Financial development proxy: depth of information on borrowers (0 to 6), maths score (PISA)
55 55 4. EFFECTS OF INSTITUTIONS ON ESTIMATED PROFILES Institution by institution We analyze the effects of each institution separately In some cases, an institution is captured by two complementary variables in particular:. existence of a regulatory LTV limit and, in case of existence, value of such limit Also multivariate results allowing for various institutions
56 56 4. EFFECTS OF INSTITUTIONS ON ESTIMATED PROFILES A.1. Duration of foreclosure: theory Longer durations decrease bank recovery value in the case of non-repayment. Similar to the existence of bankrupcy in the limit Theory focuses on consequences on unsecured debt, we study secured debt. Costly repossession may turn secured debt into unsecured The existence of bankrupcy causes those with higher probability of non-repayment to face higher lending rates. Tertilt et al (2007), Hintermeier and Koeniger (2011), Chatterjee et al. (2007) Bankrupcy makes US households less likely to borrow. Young US households (mid-30s) specially affected. Low current income, high income risk. End up facing higher interest rates and borrowing less
57 57 4. EFFECTS OF INSTITUTIONS ON ESTIMATED PROFILES A.1. Duration of foreclosure: measurement Data available through European Mortgage Federation (data from 2007). Source: questionnaires sent to national experts. Questionnaire identifies comparable steps in the process of repossession in case of non-repayment in some EU countries.. Each step identified by minimum and maximum legal duration. Ask for an assessment of typical duration. Repossession periods in the sample vary between 5 months (NL) and 56 (IT). Short durations in ES (8 months), AT or DE (9 months) or LU (10 months). Long durations in PT or GR (24 months), FR (20 months) or BE (18 months) Length of repossession periods are persistent over time. Source: Study of EMF of periods in 1990 for a subsample of countries.. Correlation between durations in 1990 and in 2007 is.83
58 4. EFFECTS OF INSTITUTIONS ON ESTIMATED PROFILES A.1. Duration of foreclosure: comments on results In countries where the repossession process takes longer, the reference group is less likely to hold secured debt. a one-month delay in the time to repossess leads to a 0.7 percentage point reduction in the chances of holding debt (statistically significant) In terms of the amount of debt held, the impacts vary across the debt distribution, in particular the impact is larger in absolute value among youngest households Evidence supporting the notion of a differential interest rate treatment of high income borrowers. longer foreclosures associated with relatively higher interest rates for low income households (effect precisely estimated) 58
59 4. EFFECTS OF INSTITUTIONS ON ESTIMATED PROFILES Presentation of the results of the second part - graphs where we group the charts into three columns - first column shows impact of the institutional variables on the probability of holding debt of the reference group (in first row) and on the odds ratios of each of the sociodemographic characteristics as compared to the omitted category (from second to last row) - second column shows the effect of institutions on the (log) amount of secured debt held -(dependent variables by rows are the OLS coefficients from first part). - third column shows the effect of institutions on the level of interest rate of the household main residence mortgage -(dependent variables by rows are the OLS coefficients from first part) 59
60 A.1. TYPICAL DURATION OF FORECLOSURE (MONTHS) 60
61 61 A.1. TYPICAL DURATION OF FORECLOSURE (MONTHS) REFERENCE GROUP AGE INCOME
62 62 A.1. TYPICAL DURATION OF FORECLOSURE (MONTHS) REFERENCE GROUP AGE INCOME
63 63 A.1. TYPICAL DURATION OF FORECLOSURE (MONTHS) REFERENCE GROUP AGE INCOME
64 64 4. EFFECTS OF INSTITUTIONS ON ESTIMATED PROFILES B.1. Taxation of mortgage payments: theory Gervais (2002): OLG model with a down payment and housing consumption. Mortgage deduction + low taxation on imputed rents increase relative return on housing investments. Incentive to overconsume housing over life-cycle Generates age and income borrowing profiles in the US. Youth save to benefit from incentive early in the life-cycle.. Mostly high income households able to save and afford down-payment. Progressivity of income taxes should reinforce the income profile Interest rates are endogenous but not group specific
65 4. EFFECTS OF INSTITUTIONS ON ESTIMATED PROFILES B.1. Taxation of mortgage payments: measurement FIRST MEASURE A continuous measure of housing tax incentives developed by Johanson (Source: OECD WP, forthcoming). Wedge between market interest rate and the after tax cost of housing. 100% LTV, a house worth 6 times the average wage, single, median income SECOND MEASURE Taxation on mortgage payments incentives measured using two dummies: - An indicator for the existence of some tax deduction to mortgage payments Countries without mortgage tax deductions: DE, SK - An indicator for countries without a limit to mortgage tax deductions The only country without any limit to tax deductions is NL Source: ECB (2009) Structural Issues Report 65
66 4. EFFECTS OF INSTITUTIONS ON ESTIMATED PROFILES B.1. Taxation of mortgage payments: comments on results (continuous measure) Positive association between tax relief and the chances that RG holds debt Tax relief also positively correlated with higher amounts of debt by RG Tentative evidence of a pass-through of the tax relief into higher i-rates Basic prediction about age profile not confirmed with continuous measure but evidence of an age profile in the response of the probability of holding debt when using the two dummies [ Another result when using the two dummies: the RG in countries with tax exemption on mortgage payments is 17 pp more likely to hold secured debt (but not very precise) ] 66
67 B.1. TAXATION ON MORTGAGE PAYMENTS: WEDGE 67
68 68 B.1. TAXATION ON MORTGAGE PAYMENTS: WEDGE REFERENCE GROUP AGE INCOME
69 69 B.1. TAXATION ON MORTGAGE PAYMENTS: WEDGE REFERENCE GROUP AGE INCOME
70 70 B.1. TAXATION ON MORTGAGE PAYMENTS: WEDGE REFERENCE GROUP AGE INCOME
71 4. EFFECTS OF INSTITUTIONS ON ESTIMATED PROFILES B.2. Regulatory Loan-to-Values: theory Ortalo-Magné and Rady (1999, 2006): OLG model with a housing ladder. Credit constraints for the youth. Interest rates are exogenous. Supply of housing is inelastic The relaxation of LTVs alters the age profile of borrowing. Low-income youth -who would otherwise rent- borrow and purchase flats. Sold by the elderly Higher LTVs increases the amount of debt. Among the youths (mechanically, higher LTV). Unclear pattern among older households Simulations by Chambers et al (2009a,b) emphasize that overall increases in LTVs mainly increase (non group-specific) interest rates. Little impact on age profiles 71
72 4. EFFECTS OF INSTITUTIONS ON ESTIMATED PROFILES B.2. Regulatory of Loan-To-Values: measurement Loan to Values measured using two variables: 1. Existence of a threshold above which:. Extra provisioning needed under Basel II or. Limits applying for bonds to be eligible as collateral for covered or mortgage bonds.. All euro area countries have a regulatory limit except BE, NL, LU and AT (for the first three, the source is ECB, 2009). 2. Within the set of countries with a maximum Loan to Value (taken as the lowest threshold between extra provisioning and limit for covered bonds) Variation between 60% (DE, FR) and 80% (IT,ES) Bivariate regression with two different dummies. 72
73 4. EFFECTS OF INSTITUTIONS ON ESTIMATED PROFILES B.2. Regulatory of Loan-To-Values: comments on results (Bivariate regression: one slide with results for each variable) No robust effects on the probability of holding secured debt for the RG. but an overall positive effect of an increase in the value of the LTV limit on debt holding by the very young is present in the data Still, differences in LTV are useful to understand facts about the distribution of debt amounts. the average debt held by the reference group in a country with a maximum LTV limit is 49% lower than in a country with no such limit. we find some effects suggesting that low income households expand their borrowing the most when the maximum LTV ratio increases We find little evidence that either the absence of a regulatory maximum LTV or an increase in the value of the limit result in higher i-rates charged to the RG 73
74 B.2. REGULATORY LTV: EXISTENCE OF REGULATORY LIMIT ON LTV AND REGULATORY LIMIT (%) (I) 74
75 B.2. REGULATORY LTV: EXISTENCE OF REGULATORY LIMIT ON LTV AND REGULATORY LIMIT (%) (II) 75
76 76 B.2. REGULATORY VS. ACTUAL LTV (I) Regulatory Loan-to-Values affect the distribution of debt to the extent that actual loan actual LTVs concentrate around these. Households report retrospective information about (i) the original loan amount and (ii) the cost of the house.. Compute histograms for the stock of existing mortgages on main residence. Histograms of LTVs suggest wide variation in actual practices.
 above AT BE LU NL: No")

77 77 B.2. REGULATORY VS. ACTUAL LTV (II) above AT BE LU NL: No regulatory limit but very different actual LTV below: DE has limit but similar to AT that has not
 above IT PT: Regulatory limit but very different actual LTV")
78 78 B.2. REGULATORY VS. ACTUAL LTV (III) above IT PT: Regulatory limit but very different actual LTV below: LU no limit but similar actual LTV to IT that has limit
79 79 4. EFFECTS OF INSTITUTIONS ON ESTIMATED PROFILES C.1. % mortgages with fixed interest rate: theory Campbell and Cocco (2003) simulate household s welfare under FRM and ARM. Calibrated to US FRM s main advantage is low income risk at the cost of substantial capital risk.. If households unable to borrow short-term, fluctuations in ARM installments cause disutility Prevalence of FRMs should increase access to borrowing among risky households. Self-employed, low schooling. Fixed term contracts? Unclear predictions about the amount borrowed
80 80 4. EFFECTS OF INSTITUTIONS ON ESTIMATED PROFILES C.1. % mortgages with fixed interest rate: measurement Prevalence of FRMs measure taken from ECB (2009). Proportion of loans with first fixed interest rates period of at least 10 years.. Survey in 2007 to institutions lending in the euro area. Members of euro area can be divided into ARM- countries and FRMcountries (IT and DE are mixed cases). FRM: BE, NL, FR. ARM: PT, ES, GR, SK, Prevalence probably reflects situation in 2007, not when the average loan in our sample was taken.. Given the patterns above, we present results with a dummy prevalence above 50%.. Results similar if we use prevalence in 2007.
81 4. EFFECTS OF INSTITUTIONS ON ESTIMATED PROFILES C.1. % mortgages with fixed interest rate: comments on results 81 Focus on self-employed (and other income risk households e.g. low educated). prevalence of FRMs is associated with a greater likelihood of holding secured debt by those groups Prevalence of FRM is reflected in higher i-rates for the reference group (as such products entail larger risks for financial institutions). countries with prevalence of FMR mortgages charge i-rates 74 basis points higher (s.e. 30bp). interestingly, no effect of higher interest rates to self-employed Propensity of the RG to hold debt not much affected by the prevalence of FMR
82 C.1. FIXED-INTEREST RATE (IF % OF MORTGAGES FMR FOR PERIOD LONGER THAN 10 YEARS > 50%) 82
83 4. EFFECTS OF INSTITUTIONS ON ESTIMATED PROFILES C.1. Credit conditions that reduce initial payments: theory 83 Basic permanent income model: credit constrained households borrow if (early) mortgage installments are low Instruments allowing lower initial payments change profiles of borrowing. Increase borrowing among youths or low income households.. Caveat: age profile hard to detect in a cross-section, as those institutions also delay repayment of principal. Expand borrowing among highest income growth households. College Chambers et al (2009) confirm age and income profiles using OLG models (with i-only mortgages rolled into fixed rate mortgages)
84 4. EFFECTS OF INSTITUTIONS ON ESTIMATED PROFILES C.1. Credit conditions that reduce initial payments: measurement 84 The source of information is ECB (2009). Questionnaire to survey experts Fraction of mortgages with interest only payments in the first three years. Varies between 0% (IT) and 33% (NL). Rare in DE (0.9%), GR (1.5%) or FR (3.5%), more common in AT (18%) or PT (10%) Use indicator of whether the fraction exceeds 10%.
85 85 4. EFFECTS OF INSTITUTIONS ON ESTIMATED PROFILES C.1. Credit conditions that reduce initial payments: comments on results No significant patterns found; impacts are not precise Similar imprecision when we use long maturities or products that allow unilateral maturity extension
86 C.2. CONDITIONS THAT REDUCE INITIAL PAYMENTS: INTEREST ONLY PAYMENTS (IF % OF I-ONLY MORTGAGE LOANS > 10%) 86
87 87 4. EFFECTS OF INSTITUTIONS ON ESTIMATED PROFILES C.3. Information on borrowers (proxy for financial development) Ability to process information about borrowers should allow banks to price risk properly. increase interest rates for default-prone households. otherwise not observed being granted credit The cross-sectional variance of interest rates should increase (Edelberg, 2009) Unclear effect on propensity to hold debt or amount of debt held Measure from the Getting Credit index of the World Bank. Index varies from 1 to 6
88 4. EFFECTS OF INSTITUTIONS ON ESTIMATED PROFILES 88 C.3. Information on borrowers: comments on results In countries with (one point) deeper information on borrowers (e.g. credit registries) the RG has a lower probability of having secured debt (7%, not precise) Higher i-rates for default-prone households (that we identify as the young or self-employed) when there is more information about borrowers Better information about borrowers permits better pricing of loans to young households; probably as a consequence, we see a precisely estimated age profile of the amount borrowed
89 C.3. FINANCIAL DEVELOPMENT PROXY: DEPTH OF INFORMATION ON BORROWERS (0 TO 6) 89
90 90 4. EFFECTS OF INSTITUTIONS ON ESTIMATED PROFILES Multivariate analysis So far we reported simple cross-country regressions of debt-related magnitudes on institutions to test some theoretical predictions. treating the set of countries as a (small sample) of an underlying population of countries. standard errors reflect (i) variance of the coefficients across the population of countries and (ii) sampling variance of the first step estimates
91 4. EFFECTS OF INSTITUTIONS ON ESTIMATED PROFILES 91 Multivariate analysis We also perform a multivariate analysis to (i) control for share of FRM, (ii) analyze the relative importance of various institutions. we take the within sample regressions of the first stage coefficients on each institution as the quantities of interest. s.e. only reflect sampling error in the first stage coefficients. comparable to the conventional standard errors calculated by default in the pooled version of the 2nd stage estimator. i.e. we condition on the set of countries in our data (Abadie, Athey, Imbens, and Wooldridge, 2014)
92 4. EFFECTS OF INSTITUTIONS ON ESTIMATED PROFILES Multivariate results: sample-average multiple regressions 92
93 93 4. EFFECTS OF INSTITUTIONS ON ESTIMATED PROFILES Summary on effects of multivariate institution Time to repossession correlates strongly with many of the patterns of interest. Longer time to repossession:. diminish chances that RG has secured debt (+1 month, -1pp). diminish relatively less the chances of borrowing of the over 45. affect pricing of loans (relatively higher i-rates to low income households) Mortgage tax exemptions. conditional on borrowing, average secured debt amount held by RG is 1.38 points larger in countries without a limit on mortgage deductibility. no effect on probability of holding secured debt. some positive correlation between i-rates charged to RG and tax deductibility
94 94 4. EFFECTS OF INSTITUTIONS ON ESTIMATED PROFILES Summary on effects of multivariate institution Regulatory LTVs. once all other institutions are taken into account, variation in regulatory LTV does not correlate with the fraction of borrowers or the amount borrowed Prevalence of FRMs. consistent with simple supply side effects, correlates with higher i-rates charged to RG
95 95 5. CONCLUSIONS The availability of rich household wealth data for multiple countries allowed us to uncover substantial cross-country heterogeneity in the distribution of debt for different types of households We have also been able to relate these differences to differences in institutions in a systematic way We have used a comprehensive set of institutions and distributional characteristics
96 96 5. CONCLUSIONS Among the institutions we consider, length of repossession best explains these differences. One standard deviation longer time to repossess (15 months) associated with. 10 to 16 percent lower chances that the RG holds secured debt.. varying impact on amounts by age/cohort (falls by 12% among households and 6% among over 45).. interest rates paid by lower-income households are 30 bp higher. Absence of limits to tax deductibility accounts for higher debt amount Variation in LTVs, depth of information about borrowers or in low-initial payment mortgages do not account for the distribution of debt across countries and groups of the population.
97 THANK YOU 97
98 APPENDIX: SAMPLE SIZE, BY COUNTRY 98
99 99
100 INSTITUTIONS: DATA USED 100
THE DISTRIBUTION OF DEBT ACROSS EU COUNTRIES:
 THE DISTRIBUTION OF DEBT ACROSS EU COUNTRIES: The role of individual characteristics, institutions and credit conditions Olympia Bover, José María Casado, Sonia Costa, Philip Du Caju, Yvonne McCarthy,
THE DISTRIBUTION OF DEBT ACROSS EU COUNTRIES:
 THE DISTRIBUTION OF DEBT ACROSS EU COUNTRIES: The role of individual characteristics, institutions and credit conditions Olympia Bover, José María Casado, Sonia Costa, Philip Du Caju, Yvonne McCarthy,
Introduction to the. Eurosystem. Household Finance and Consumption Survey
 ECB-PUBLIC The opinions of the author do not necessarily reflect the views of the ECB or the Eurosystem Introduction to the Eurosystem Household Finance and Consumption Survey Sébastien Pérez-Duarte OEE
The Eurosystem Household Finance and Consumption Survey
 ECB-PUBLIC DRAFT The Eurosystem Household Finance and Consumption Survey Carlos Sánchez Muñoz Frankfurt Fudan Financial Research Forum 25 September 2015 ECB-PUBLIC DRAFT ECB-PUBLIC DRAFT Outline 1. Background
Pockets of risk in the Belgian mortgage market - Evidence from the Household Finance and Consumption survey 1
 IFC-National Bank of Belgium Workshop on "Data needs and Statistics compilation for macroprudential analysis" Brussels, Belgium, 18-19 May 2017 Pockets of risk in the Belgian mortgage market - Evidence
How Do Households Allocate Their Assets? Stylized Facts from the Eurosystem Household Finance and Consumption Survey
 How Do Households Allocate Their Assets? Stylized Facts from the Eurosystem Household Finance and Consumption Survey Luc Arrondel, a Laura Bartiloro, b Pirmin Fessler, c Peter Lindner, c Thomas Y. Mathä,
HOUSEHOLDS INDEBTEDNESS: A MICROECONOMIC ANALYSIS BASED ON THE RESULTS OF THE HOUSEHOLDS FINANCIAL AND CONSUMPTION SURVEY*
 HOUSEHOLDS INDEBTEDNESS: A MICROECONOMIC ANALYSIS BASED ON THE RESULTS OF THE HOUSEHOLDS FINANCIAL AND CONSUMPTION SURVEY* Sónia Costa** Luísa Farinha** 133 Abstract The analysis of the Portuguese households
HOUSEHOLD DEBT AND CREDIT CONSTRAINTS: COMPARATIVE MICRO EVIDENCE FROM FOUR OECD COUNTRIES
 HOUSEHOLD DEBT AND CREDIT CONSTRAINTS: COMPARATIVE MICRO EVIDENCE FROM FOUR OECD COUNTRIES Jonathan Crook (University of Edinburgh) and Stefan Hochguertel (VU University Amsterdam) Discussion by Ernesto
Household Finance and Consumption Survey in Malta: The Results from the Second Wave
 Household Finance and Consumption Survey in Malta: The Results from the Second Wave Daniel Gaskin Juergen Attard Karen Caruana 1 WP/02/2017 1 Mr D Gaskin, Mr J Attard and Ms K Caruana are an Economist
HOUSEHOLD FINANCE AND CONSUMPTION SURVEY: A COMPARISON OF THE MAIN RESULTS FOR MALTA WITH THE EURO AREA AND OTHER PARTICIPATING COUNTRIES
 HOUSEHOLD FINANCE AND CONSUMPTION SURVEY: A COMPARISON OF THE MAIN RESULTS FOR MALTA WITH THE EURO AREA AND OTHER PARTICIPATING COUNTRIES Article published in the Quarterly Review 217:2, pp. 27-33 BOX
Reamonn Lydon & Tara McIndoe-Calder Central Bank of Ireland CBI. NERI, 22 April 2015
 The Household Finance and Consumption Survey The Financial Position of Irish Households Reamonn Lydon & Tara McIndoe-Calder Central Bank of Ireland CBI NERI, 22 April 2015 Disclaimer Any views expressed
YOUTH UNEMPLOYMENT IN THE EURO AREA
 YOUTH UNEMPLOYMENT IN THE EURO AREA Ramon Gomez-Salvador and Nadine Leiner-Killinger European Central Bank EKONOMSKI INSTITUT PRAVNE FAKULTETE 14 December 2007 Ljubljana Outline I. Introduction II. Stylised
How do households choose to allocate their wealth? Some stylized facts derived from the Eurosystem Household Finance and Consumption Survey
 How do households choose to allocate their wealth? Some stylized facts derived from the Eurosystem Household Finance and Consumption Survey Conference on household finance and consumption; European Central
Pension Wealth and Household Saving in Europe: Evidence from SHARELIFE
 Pension Wealth and Household Saving in Europe: Evidence from SHARELIFE Rob Alessie, Viola Angelini and Peter van Santen University of Groningen and Netspar PHF Conference 2012 12 July 2012 Motivation The
The distribution of wealth between households
 The distribution of wealth between households Research note 11/2013 1 SOCIAL SITUATION MONITOR APPLICA (BE), ATHENS UNIVERSITY OF ECONOMICS AND BUSINESS (EL), EUROPEAN CENTRE FOR SOCIAL WELFARE POLICY
Bank Contagion in Europe
 Bank Contagion in Europe Reint Gropp and Jukka Vesala Workshop on Banking, Financial Stability and the Business Cycle, Sveriges Riksbank, 26-28 August 2004 The views expressed in this paper are those of
HOUSEHOLDS LENDING MARKET IN THE ENLARGED EUROPE. Debora Revoltella and Fabio Mucci copyright with the author New Europe Research
 HOUSEHOLDS LENDING MARKET IN THE ENLARGED EUROPE Debora Revoltella and Fabio Mucci copyright with the author New Europe Research ECFin Workshop on Housing and mortgage markets and the EU economy, Brussels,
Household Balance Sheets and Debt an International Country Study
 47 Household Balance Sheets and Debt an International Country Study Jacob Isaksen, Paul Lassenius Kramp, Louise Funch Sørensen and Søren Vester Sørensen, Economics INTRODUCTION AND SUMMARY What are the
52 ECB. The 2015 Ageing Report: how costly will ageing in Europe be?
 Box 7 The 5 Ageing Report: how costly will ageing in Europe be? Europe is facing a demographic challenge. The old age dependency ratio, i.e. the share of people aged 65 or over relative to the working
In Debt and Approaching Retirement: Claim Social Security or Work Longer?
 AEA Papers and Proceedings 2018, 108: 401 406 https://doi.org/10.1257/pandp.20181116 In Debt and Approaching Retirement: Claim Social Security or Work Longer? By Barbara A. Butrica and Nadia S. Karamcheva*
INTANGIBLE INVESTMENT AND INNOVATION IN THE EU: FIRM- LEVEL EVIDENCE FROM THE 2017 EIB INVESTMENT SURVEY 49
 CHAPTER II.6 INTANGIBLE INVESTMENT AND INNOVATION IN THE EU: FIRM- LEVEL EVIDENCE FROM THE 2017 EIB INVESTMENT SURVEY 49 Debora Revoltella and Christoph Weiss European Investment Bank, Economics Department
Indebted households in the euro area: a micro perspective using the EU-SILC
 Indebted households in the euro area: a micro perspective using the EU-SILC 2 nd European User Conference for EU-LFS and EU-SILC Mannheim 31 March-1 April 211 Ramon Gomez-Salvador, Adriana Lojschova and
Determination of manufacturing exports in the euro area countries using a supply-demand model
 Determination of manufacturing exports in the euro area countries using a supply-demand model By Ana Buisán, Juan Carlos Caballero and Noelia Jiménez, Directorate General Economics, Statistics and Research
Wealth inequality in the euro area
 Wealth inequality in the euro area Results of the Household Finance and Consumption Surveys 2010 and 2014 Aurel Schubert 23 June 2017 The views expressed are those of the speaker and not necessarily those
Comments on Exploring Differences in Household Debt across Euro Area Countries and the US D. Christelis, M. Ehrmann, and D.
 Comments on Exploring Differences in Household Debt across Euro Area Countries and the US D. Christelis, M. Ehrmann, and D. Georgarakos ECB Conference on Household Finance and Consumption, October 17-18
ECB Report on Financial Integration in Europe April 2008 Lucas Papademos
 ECB Report on Financial Integration in Europe April 2008 Lucas Papademos Frankfurt am Main, 29 April 2008 1 Structure of the report Chapter 1: State of financial integration in the euro area Assessment
II.2. Member State vulnerability to changes in the euro exchange rate ( 35 )
") II.2. Member State vulnerability to changes in the euro exchange rate ( 35 ) There have been significant fluctuations in the euro exchange rate since the start of the monetary union. This section assesses
II.2. Member State vulnerability to changes in the euro exchange rate ( 35 ) There have been significant fluctuations in the euro exchange rate since the start of the monetary union. This section assesses
SURVEY ON THE ACCESS TO FINANCE OF SMALL AND MEDIUM-SIZED ENTERPRISES IN THE EURO AREA APRIL TO SEPTEMBER 2012
 SURVEY ON THE ACCESS TO FINANCE OF SMALL AND MEDIUM-SIZED ENTERPRISES IN THE EURO AREA APRIL TO SEPTEMBER 2012 NOVEMBER 2012 European Central Bank, 2012 Address Kaiserstrasse 29, 60311 Frankfurt am Main,
Indebtedness of households and the cost of debt by household type and income group. Research note 10/2014
 Indebtedness of households and the cost of debt by household type and income group Research note 10/2014 Eva Sierminska December 2014 EUROPEAN COMMISSION Directorate-General for Employment, Social Affairs
Firm level evidence on wage dynamics in Europe
 Firm level evidence on wage dynamics in Europe Ana Lamo European Central Bank* Bruegel 11Dec 2012 *Standar disclaimers apply 1 Outline of the presentation I. The main features of wage behavior at the firm
Getting ready to prevent and tame another house price bubble
 Macroprudential policy conference Should macroprudential policy target real estate prices? 11-12 May 2017, Vilnius Getting ready to prevent and tame another house price bubble Tomas Garbaravičius Board
Macroeconomic Policies in Europe: Quo Vadis A Comment
 Macroeconomic Policies in Europe: Quo Vadis A Comment February 12, 2016 Helene Schuberth Outline Staff Projection of the Euro Area Monetary Policy Investment Rebalancing in the euro area Fiscal Policy
Inequality and Poverty in EU- SILC countries, according to OECD methodology RESEARCH NOTE
 Inequality and Poverty in EU- SILC countries, according to OECD methodology RESEARCH NOTE Budapest, October 2007 Authors: MÁRTON MEDGYESI AND PÉTER HEGEDÜS (TÁRKI) Expert Advisors: MICHAEL FÖRSTER AND
Exploring differences in financial literacy across countries: the role of individual characteristics, experience, and institutions
 Exploring differences in financial literacy across countries: the role of individual characteristics, experience, and institutions Andrej Cupák National Bank of Slovakia Pirmin Fessler Oesterreichische
THE EFFECT OF DEMOGRAPHIC AND SOCIOECONOMIC FACTORS ON HOUSEHOLDS INDEBTEDNESS* Luísa Farinha** Percentage
 THE EFFECT OF DEMOGRAPHIC AND SOCIOECONOMIC FACTORS ON HOUSEHOLDS INDEBTEDNESS* Luísa Farinha** 1. INTRODUCTION * The views expressed in this article are those of the author and not necessarily those of
3 Lower interest rates and sectoral changes in interest income
 Chart A 3 Lower interest rates and sectoral changes in interest income Euro area balance sheet and euro area property income This box describes the impact of the decline in interest rates on interest income
Credit Discrimination in European Households
 Credit Discrimination in European Households Evidence from survey data in Eurozone and the case of Greece E. Patatouka 1 A. Fasianos 2 1 Department of Urbanism, Geography University Paris 8 2 Department
Downward Nominal Wage Rigidity in the OECD
 Downward Nominal Wage Rigidity in the OECD Steinar Holden and Fredrik Wulfsberg November 25, 2005 fwu/november 25, 2005 Motivation Conventional view: Long run Phillips curve is vertical. No long run relationship
Wages, Productivity and the Paradoxes of Disappearing Mass Unemployment in Europe
 Wages, Productivity and the Paradoxes of Disappearing Mass Unemployment in Europe Tito Boeri XXIII National Conference of Labour Economics Brescia 11-12 September 2008 1994 OECD Jobs Study The labour market
Household debt and spending in the United Kingdom
 Household debt and spending in the United Kingdom Philip Bunn and May Rostom Bank of England Fourth ECB conference on household finance and consumption 17 December 2015 1 Outline Motivation Literature/theory
Wealth Inequality and Homeownership in Europe
 Wealth Inequality and Homeownership in Europe Leo Kaas, Georgi Kocharkov, and Edgar Preugschat December 21, 2017 Abstract The recently published Household Finance and Consumption Survey has revealed large
This presentation. Downward wage rigidity in EU countries. Based on recent papers on wage rigidity in European countries:
 Downward wage rigidity in EU countries OECD - DELSA seminar, Paris, October 2010 Philip Du Caju This presentation Based on recent papers on wage rigidity in European countries: Babecký J., Ph. Du Caju,
State Dependency of Monetary Policy: The Refinancing Channel
 State Dependency of Monetary Policy: The Refinancing Channel Martin Eichenbaum, Sergio Rebelo, and Arlene Wong May 2018 Motivation In the US, bulk of household borrowing is in fixed rate mortgages with
DATA SET ON INVESTMENT FUNDS (IVF) Naming Conventions
 Naming Conventions") DIRECTORATE GENERAL STATISTICS LAST UPDATE: 10 APRIL 2013 DIVISION MONETARY & FINANCIAL STATISTICS ECB-UNRESTRICTED DATA SET ON INVESTMENT FUNDS (IVF) Naming Conventions The series keys related to Investment
DIRECTORATE GENERAL STATISTICS LAST UPDATE: 10 APRIL 2013 DIVISION MONETARY & FINANCIAL STATISTICS ECB-UNRESTRICTED DATA SET ON INVESTMENT FUNDS (IVF) Naming Conventions The series keys related to Investment
Macroprudential Policy Analysis for Real Estate Markets in the euro area
 Reiner Martin Deputy Head Macroprudential Policies Division European Central Bank Macroprudential Policy Analysis for Real Estate Markets in the euro area Oslo 21 November 2017 Rubric Outline 1 Principles
Consumers quantitative inflation perceptions and expectations in the euro area: an evaluation (*)
") Consumers quantitative inflation perceptions and expectations in the euro area: an evaluation (*) Gianluigi Ferrucci (ECB), Olivier Biau (EC), Heinz Dieden (ECB), Roberta Friz (EC), Staffan Linden (EC)
Consumers quantitative inflation perceptions and expectations in the euro area: an evaluation (*) Gianluigi Ferrucci (ECB), Olivier Biau (EC), Heinz Dieden (ECB), Roberta Friz (EC), Staffan Linden (EC)
Interaction of household income, consumption and wealth - statistics on main results
 Interaction of household income, consumption and wealth - statistics on main results Statistics Explained Data extracted in June 2017. Most recent data: Further Eurostat information, Main tables and Database.
The Labor Market Consequences of Adverse Financial Shocks
 The Labor Market Consequences of Adverse Financial Shocks November 2012 Unemployment rate on the two sides of the Atlantic Credit to the private sector over GDP Credit to private sector as a percentage
The Trend Reversal of the Private Credit Market in the EU
 The Trend Reversal of the Private Credit Market in the EU Key Findings of the ECRI Statistical Package 2016 Roberto Musmeci*, September 2016 The ECRI Statistical Package 2016, Lending to Households and
Copyright 2011 Pearson Education, Inc. Publishing as Addison-Wesley.
 Appendix: Statistics in Action Part I Financial Time Series 1. These data show the effects of stock splits. If you investigate further, you ll find that most of these splits (such as in May 1970) are 3-for-1
Wealth Inequality Reading Summary by Danqing Yin, Oct 8, 2018
 Summary of Keister & Moller 2000 This review summarized wealth inequality in the form of net worth. Authors examined empirical evidence of wealth accumulation and distribution, presented estimates of trends
Internet Appendix. The survey data relies on a sample of Italian clients of a large Italian bank. The survey,
 Internet Appendix A1. The 2007 survey The survey data relies on a sample of Italian clients of a large Italian bank. The survey, conducted between June and September 2007, provides detailed financial and
Simulating the impact of borrower-based macroprudential policies on mortgages and the real estate sector in Austria
 Simulating the impact of borrower-based macroprudential policies on mortgages and the real estate sector in Austria Evidence from the Household Finance and Consumption Survey 2014 Nicolas Albacete and
Deleveraging and Consumption in a Highly Indebted Property Market
 and Consumption in a Highly Indebted Property Market Yvonne McCarthy and Kieran McQuinn Central Bank of Ireland & Economic and Social Research Institute www.esri.ie Irish Economic Policy Conference February
Data Appendix. A.1. The 2007 survey
 Data Appendix A.1. The 2007 survey The survey data used draw on a sample of Italian clients of a large Italian bank. The survey was conducted between June and September 2007 and elicited detailed financial
Consumption, Income and Wealth
 59 Consumption, Income and Wealth Jens Bang-Andersen, Tina Saaby Hvolbøl, Paul Lassenius Kramp and Casper Ristorp Thomsen, Economics INTRODUCTION AND SUMMARY In Denmark, private consumption accounts for
ON THE ASSET ALLOCATION OF A DEFAULT PENSION FUND
 ON THE ASSET ALLOCATION OF A DEFAULT PENSION FUND Magnus Dahlquist 1 Ofer Setty 2 Roine Vestman 3 1 Stockholm School of Economics and CEPR 2 Tel Aviv University 3 Stockholm University and Swedish House
Occasional Paper series
 Occasional Paper series No 89 / AN ANALYSIS OF YOUTH UNEMPLOYMENT IN THE EURO AREA by Ramon Gomez-Salvador and Nadine Leiner-Killinger OCCASIONAL PAPER SERIES NO 89 / JUNE 2008 AN ANALYSIS OF YOUTH UNEMPLOYMENT
Falling Short of Expectations? Stress-Testing the European Banking System
 Falling Short of Expectations? Stress-Testing the European Banking System Viral V. Acharya (NYU Stern, CEPR and NBER) and Sascha Steffen (ESMT) January 2014 1 Falling Short of Expectations? Stress-Testing
Cyclical Convergence and Divergence in the Euro Area
 Cyclical Convergence and Divergence in the Euro Area Presentation by Val Koromzay, Director for Country Studies, OECD to the Brussels Forum, April 2004 1 1 I. Introduction: Why is the issue important?
Households Indebtedness and Financial Fragility
 9TH JACQUES POLAK ANNUAL RESEARCH CONFERENCE NOVEMBER 13-14, 2008 Households Indebtedness and Financial Fragility Tullio Jappelli University of Naples Federico II and Marco Pagano University of Naples
Social Situation Monitor - Glossary
 Social Situation Monitor - Glossary Active labour market policies Measures aimed at improving recipients prospects of finding gainful employment or increasing their earnings capacity or, in the case of
Survey on the Access to Finance of Enterprises in the euro area. April to September 2017
 Survey on the Access to Finance of Enterprises in the euro area April to September 217 November 217 Contents Introduction 2 1 Overview of the results 3 2 The financial situation of SMEs in the euro area
Investment in Germany and the EU
 Investment in Germany and the EU Pedro de Lima Head of the Economics Studies Division Economics Department Berlin 19/12/2016 11/01/2017 1 Slow recovery of investment, with strong heterogeneity Overall
Switching Monies: The Effect of the Euro on Trade between Belgium and Luxembourg* Volker Nitsch. ETH Zürich and Freie Universität Berlin
 June 15, 2008 Switching Monies: The Effect of the Euro on Trade between Belgium and Luxembourg* Volker Nitsch ETH Zürich and Freie Universität Berlin Abstract The trade effect of the euro is typically
Life Insurance and Euro Zone s Economic Growth
 Available online at www.sciencedirect.com Procedia - Social and Behavioral Sciences 57 ( 2012 ) 126 131 International Conference on Asia Pacific Business Innovation and Technology Management Life Insurance
Influence of demographic factors on the public pension spending
 Influence of demographic factors on the public pension spending By Ciobanu Radu 1 Bucharest University of Economic Studies Abstract: Demographic aging is a global phenomenon encountered especially in the
Working Paper Series. Wealth effects on consumption across the wealth distribution: empirical evidence. No 1817 / June 2015
 Working Paper Series Luc Arrondel, Pierre Lamarche and Frédérique Savignac Wealth effects on consumption across the wealth distribution: empirical evidence No 1817 / June 2015 Note: This Working Paper
The working poor, low wages and mobility out of poverty: A crosscountry
 The working poor, low wages and mobility out of poverty: A crosscountry perspective Henning Lohmann University of Cologne LoWER Annual Conference European Low-wage Employment Research Network 15/16 April
Online Robustness Appendix to Are Household Surveys Like Tax Forms: Evidence from the Self Employed
 Online Robustness Appendix to Are Household Surveys Like Tax Forms: Evidence from the Self Employed March 01 Erik Hurst University of Chicago Geng Li Board of Governors of the Federal Reserve System Benjamin
4 Distribution of Income, Earnings and Wealth
 NERI Quarterly Economic Facts Autumn 2014 4 Distribution of Income, Earnings and Wealth Indicator 4.1 Indicator 4.2a Indicator 4.2b Indicator 4.3a Indicator 4.3b Indicator 4.4 Indicator 4.5a Indicator
Fiscal sustainability challenges in Romania
 Preliminary Draft For discussion only Fiscal sustainability challenges in Romania Bucharest, May 10, 2011 Ionut Dumitru Anca Paliu Agenda 1. Main fiscal sustainability challenges 2. Tax collection issues
Swedish Fiscal Policy. Martin Flodén, Laura Hartman, Erik Höglin, Eva Oscarsson and Helena Svaleryd Meeting with IMF 3 June 2010
 Swedish Fiscal Policy Martin Flodén, Laura Hartman, Erik Höglin, Eva Oscarsson and Helena Svaleryd Meeting with IMF 3 June 21 The S2 indicator Ireland Greece Luxembourg United Slovenia Spain Lithuania
Household Income Distribution and Working Time Patterns. An International Comparison
 Household Income Distribution and Working Time Patterns. An International Comparison September 1998 D. Anxo & L. Flood Centre for European Labour Market Studies Department of Economics Göteborg University.
COUNCIL OF THE EUROPEAN UNION. Brussels, 13 June /1/13 REV 1 SOC 409 ECOFIN 444 EDUC 190
 COUNCIL OF THE EUROPEAN UNION Brussels, 13 June 2013 10373/1/13 REV 1 SOC 409 ECOFIN 444 EDUC 190 COVER NOTE from: to: Subject: The Employment Committee Permanent Representatives Committee (Part I) / Council
Exploring differences in financial literacy across countries: the role of individual characteristics, experience, and institutions
 Exploring differences in financial literacy across countries: the role of individual characteristics, experience, and institutions Andrej Cupák Pirmin Fessler Maria Silgoner Elisabeth Ulbrich July 26,
Business cycle volatility and country zize :evidence for a sample of OECD countries. Abstract
 Business cycle volatility and country zize :evidence for a sample of OECD countries Davide Furceri University of Palermo Georgios Karras Uniersity of Illinois at Chicago Abstract The main purpose of this
Capital allocation in Indian business groups
 Capital allocation in Indian business groups Remco van der Molen Department of Finance University of Groningen The Netherlands This version: June 2004 Abstract The within-group reallocation of capital
Flash Eurobarometer 458. Report. The euro area
 The euro area Survey requested by the European Commission, Directorate-General for Economic and Financial Affairs and co-ordinated by the Directorate-General for Communication This document does not represent
2. Employment, retirement and pensions
 2. Employment, retirement and pensions Rowena Crawford Institute for Fiscal Studies Gemma Tetlow Institute for Fiscal Studies The analysis in this chapter shows that: Employment between the ages of 55
IS THERE ANY PREFERED COMPETITIVENESS INDICATOR IN EXPLAINING FOREING TRADE IN EURO AREA COUNTRIES? COMPNET December 12 th 2013
 IS THERE ANY PREFERED COMPETITIVENESS INDICATOR IN EXPLAINING FOREING TRADE IN EURO AREA COUNTRIES? COMPNET December 12 th 2013 Styliani Christodoulopoulou Based on joint work with Olegs Tkacevs With input
Inflation Differentials in the Euro Area
 Inflation Differentials in the Euro Area Borka Babic, Economics INTRODUCTION Inflation varies considerably across the euro area member states with low inflation in Germany and inflation significantly above
Harmonized Household Budget Survey how to make it an effective supplementary tool for measuring living conditions
 Harmonized Household Budget Survey how to make it an effective supplementary tool for measuring living conditions Andreas GEORGIOU, President of Hellenic Statistical Authority Giorgos NTOUROS, Household
Mortgage Rates, Household Balance Sheets, and Real Economy
 Mortgage Rates, Household Balance Sheets, and Real Economy May 2015 Ben Keys University of Chicago Harris Tomasz Piskorski Columbia Business School and NBER Amit Seru Chicago Booth and NBER Vincent Yao
Investment in France and the EU
 Investment in and the EU Natacha Valla March 2017 22/02/2017 1 Change relative to 2008Q1 % of GDP Slow recovery of investment, and with strong heterogeneity Overall Europe s recovery in investment is slow,
Appendix B: Methodology and Finding of Statistical and Econometric Analysis of Enterprise Survey and Portfolio Data
 Appendix B: Methodology and Finding of Statistical and Econometric Analysis of Enterprise Survey and Portfolio Data Part 1: SME Constraints, Financial Access, and Employment Growth Evidence from World
Euro area competitiveness developments
 Euro area competitiveness developments La competitivité belge. Analyses et enjeux Bureau fédéral du Plan Brussels, 17 November 2009 Reinhard Felke Head of Unit the economy of the euro area and EMU DG ECFIN,
Business cycle fluctuations Part II
 Understanding the World Economy Master in Economics and Business Business cycle fluctuations Part II Lecture 7 Nicolas Coeurdacier nicolas.coeurdacier@sciencespo.fr Lecture 7: Business cycle fluctuations
Increasing the fiscal sustainability of health care systems in the European Union to ensure access to high quality health services for all
 Increasing the fiscal sustainability of health care systems in the European Union to ensure access to high quality health services for all EPC Santander, 6 September 2013 Christoph Schwierz Sustainability
European Commission Directorate-General "Employment, Social Affairs and Equal Opportunities" Unit E1 - Social and Demographic Analysis
 Research note no. 1 Housing and Social Inclusion By Erhan Őzdemir and Terry Ward ABSTRACT Housing costs account for a large part of household expenditure across the EU.Since everyone needs a house, the
Inflation and competitiveness divergences in the euro area countries:
 Inflation and competitiveness divergences in the euro area countries: causes, consequences and policy responses Lucas Papademos Vice-President of the European Central Bank The ECB and its Watchers IX Frankfurt,
The Labor Market Consequences of Adverse Financial Shocks
 13TH JACQUES POLAK ANNUAL RESEARCH CONFERENCE NOVEMBER 8 9, 2012 The Labor Market Consequences of Adverse Financial Shocks Tito Boeri Bocconi University and frdb Pietro Garibaldi University of Torino and
Households capital available for renovation
 Households capital available for Methodical note Copenhagen Economics, 22 February 207 The task at hand has been twofold: firstly, we were to calculate an estimate of households average capital available
Deposit Insurance and Banks Deposit Rates: Evidence From a EU Policy
 Deposit Insurance and Banks Deposit Rates: Evidence From a EU Policy Matteo Gatti Tommaso Oliviero EUI University of Naples and CEF May 1, 2017 Motivation In 2009 EU raised deposit insurance limit to e100,
Appendix A. Additional Results
 Appendix A Additional Results for Intergenerational Transfers and the Prospects for Increasing Wealth Inequality Stephen L. Morgan Cornell University John C. Scott Cornell University Descriptive Results
Survey on the access to finance of enterprises in the euro area. October 2014 to March 2015
 Survey on the access to finance of enterprises in the euro area October 2014 to March 2015 June 2015 Contents 1 The financial situation of SMEs in the euro area 1 2 External sources of financing and needs
3 The recent strength of survey-based indicators: what does it tell us about the depth and breadth of real GDP growth?
 3 The recent strength of survey-based indicators: what does it tell us about the depth and breadth of real GDP growth? Prepared by Gabe de Bondt and Magnus Forsells Recent opinion surveys point to a solid
Aging, Immigration and the Welfare State in Austria
 Aging, Immigration and the Welfare State in Austria Thomas Davoine with Helmut Hofer, Christian Keuschnigg and Philip Schuster Institute for Advanced Studies (IHS, Vienna) Vienna, -3 September 03 / 3 Content
Flash Eurobarometer 386 THE EURO AREA REPORT
 Eurobarometer THE EURO AREA REPORT Fieldwork: October 2013 Publication: November 2013 This survey has been requested by the European Commission, Directorate-General for Economic and Financial Affairs and
Estimating Okun s Law for Malta
 MPRA Munich Personal RePEc Archive Estimating Okun s Law for Malta Abdellah KORI YAHIA central bank of malta 7 January 2018 Online at https://mpra.ub.uni-muenchen.de/83961/ MPRA Paper No. 83961, posted