Determinants of the Incidence of Loan Modifications. April 2011
|
|
|
- David Hall
- 6 years ago
- Views:
Transcription
1 DRAFT - PLEASE DO NOT CITE OR QUOTE WITHOUT PERMISSION OF THE AUTHORS Determinants of the Incidence of Loan Modifications Vicki Been and Mary Weselcouch*; Ioan Voicu and Scott Murff** April 2011 * Furman Center for Real Estate and Urban Policy, New York University. * * Office of the Comptroller of the Currency. The views expressed in this paper are those of the authors alone and do not necessarily reflect those of the Office of the Comptroller of the Currency or the Department of the Treasury. We thank Sewin Chan, Kostas Tzioumis, Michael Gedal, and participants at the OCC Economics Seminar, the Furman Center s Brown Bag Lunch series, the Property Law Colloquium at Brooklyn Law School, the NYU Law School Law and Economics Workshop, and the NYU Law School LLM Honors Seminar for their comments and suggestions. We also are grateful to the OCC Economics Department for their hospitality and financial support for Vicki Been and Mary Weselcouch. Finally, we thank Andrew Tschirhart for excellent research assistance.
2 1. Overview Loan modifications give borrowers in default 1 the opportunity to reduce their interest rate, extend the term of their loan, reduce their principal balance, or add missed payments to the principal (Mason, 2007; Adelino, Gerardi, and Willen, 2009). If a loan modification helps a borrower to stay current on his or her loan, the modification may allow the borrower to avoid both the financial costs of foreclosure and the disruption and social and psychological costs of moving, and may save the borrower s credit record (Kingsley, Smith, and Price, 2009; Schloemer, Li, Ernst, and Keest, 2006). Successful modifications help the neighborhood as well, by avoiding vacancies and high rates of turnover (and the crime and other negative impacts that they may cause), avoiding decreases in neighboring property values associated with foreclosures, and promoting stability (and the social cohesion it produces) (Immergluck and Smith, 2006; Schuetz, Been, and Ellen, 2008; Harding, Rosenblath, and Yao, 2009). Lenders and investors in securitized mortgages may benefit from modifications by avoiding the costs associated with foreclosure, such as reduced property values, loss of income and deterioration in quality as the property sits vacant, and legal and administrative fees (Pennington-Cross, 2006). Policymakers have put considerable emphasis on the desirability of modifications to help borrowers avoid losing their homes through foreclosures. A chronology of the modification programs lenders and the federal government have adopted over the past few years is attached as Appendix A. Most recently, modifications play a central role in the federal Making Home Affordable Plan the Obama administration announced in February 2009 (U.S. Department of Treasury, 2009a). The plan includes financial incentives for servicers to complete modifications of delinquent loans, principal reduction rewards for borrowers who stay current, incentive 1 Some modifications are arranged before default, but such loans are excluded from the analysis in this paper for reasons we discuss in the Data section. 2
3 payments to servicers and borrowers for modifying at-risk loans before they become delinquent, and an insurance fund to encourage lenders to modify loans even if home prices fall in the future. Through the Home Affordable Modification Program (HAMP), the U.S. Department of the Treasury has worked to standardize loan modification practices throughout the mortgage industry by partnering with banks to develop uniform guidelines for loan modifications (U.S. Department of Treasury, 2009b). For policymakers as well as lenders and investors, two issues are critical. First, those decisionmakers need to understandthe determinants of successful modifications those that allow the homeowner to stay current over the long-term. The performance of modified loans to date has been disappointing. Most recently, Fitch Research estimated in February 2011 that although redefault rates on modifications are improving, 60% -70% of modifications on subprime and Alt-A products will redefault within 12 months and redefault rates on prime loans are projected at 50-60% within 12 months of modification (Fitch Ratings, 2011). Agarwal and his colleagues find that 34% of loans receiving modifications in 2008 and the first two quarters of 2009 were 60+ days past due within just six months of modification (Agarwal, et al., 2010). Moody s Investor Services found that of the loans modified in the first half of 2010, 25% were in default again within six months, down from 31% for those loans modified in 2009 (Bay, 2011). Second, policymakers, lenders, investors and servicers need to better understand how to achieve the efficient level of modifications. The efficient level of modifications depends, of course, upon accurate assessments of the long-term success rates of modifications versus accurate assessments of the full extent of losses incurred when the loans are not modified. To our knowledge, no one has attempted to quantify what the efficient level of modifications would be, but the perception of many policy-makers is that the number of modifications agreed to has 3
4 been woefully inadequate. Too little is known even about the most basic questions about the determinants of modifications that would help us understand those two issues: Which borrowers receive modifications? Are certain loan provisions associated with the likelihood that the loan will be modified? Do the characteristics or identity of lenders or servicers affect the propensity of borrowers to receive modifications? Do characteristics of the property, or the neighborhood in which it is located, affect the propensity of loans to be modified? What role, for example, does residential segregation the concentration of minorities in a neighborhood play in the propensity of borrowers to get modifications? In this paper, we shed new light on these issues about the borrowers and loans receiving modifications by using a unique combination of data on borrowers in New York City. In a subsequent paper, we will then use that information to examine the features of the borrower, loan, lender, neighborhood and property that predict which modifications will succeed in keeping borrowers in their homes over the long term. This paper will build upon the existing literature by combining a dataset the Furman Center for Real Estate and Urban Policy has built on borrower, neighborhood, and property characteristics for loans originated in New York City with the OCC s Mortgage Metrics dataset to examine the determinants of loan modifications. Identifying the features of borrowers, loans, lenders, servicers, properties and neighborhoods that are associated with loan modifications will allow lenders and policy-makers to target modification programs for distressed mortgage borrowers more effectively. The unusually rich combination of data also will allow us to assess whether borrowers and servicers are acting rationally in deciding whether to modify a loan, analyze whether models that do not incorporate the detailed borrower and neighborhood data we 4
5 provide may be misleading, and assess whether there are any characteristics of loans, borrowers or neighborhoods that make modifications especially challenging given the current economic and regulatory framework. 2. Background and Literature Review When a borrower falls behind on her home mortgage payments, a variety of resolutions or outcomes are possible. First, if the borrower is delinquent or in default, but has not yet received a notice of foreclosure (lis pendens), the borrower and/or lender (or servicer acting on behalf of the lender or on behalf of the investors in securitized mortgages) have several options: (i) the borrower can cure the delinquency or default by making some or all of the missed payments; (ii) the borrower and the lender can agree to modify the loan; (iii) the borrower can refinance the mortgage; (iv) the borrower can sell the property either for enough to pay off the balance remaining on the mortgage, or through a short sale, whereby the lender agrees to accept a purchase price of less than the balance remaining in satisfaction of the mortgage; (v) the borrower can pre-pay the mortgage by drawing on other resources; or (vi) the borrower can continue to be delinquent or in default, but the lender can choose to forbear on the delinquency or default without beginning foreclosure, or set a repayment plan in which the borrower typically pays back any late payments in small installments on top of the existing mortgage installments. Second, if the lender/servicer has begun the foreclosure process, either by filing a lis pendens in a judicial foreclosure state or by sending a Notice of Default to the borrower in a non-judicial foreclosure state 2, the borrower can pursue any of those six paths, and in addition may: (vii) give the lender/servicer a deed in lieu of foreclosure; (viii) lose the property to the lender/servicer in 2 In this paper, we focus only on loans in New York, a judicial foreclosure state where a lis pendens can be filed if a borrower is at least 90 days delinquent. 5
6 the foreclosure auction ( REO property); or (ix) lose the property to a third party in a foreclosure auction. Either before or after the foreclosure process has officially begun, therefore, the lender/servicer and borrower may reach an agreement to modify the terms of the loan. According to U.S. Department of Treasury (2008, 2010b), the number of loan modifications issued has been consistently increasing since October 2007 (the inception of the OCC data collection), with over 1.5 million permanent modifications completed nationally as of June The literature about the determinants of modification, however, is thin. Cordell, Dynan, Lehnert, Liang, and Mauskopf (2008) suggest as a theoretical matter that securitization may negatively affect the probability of modification, because modifications of non-gse securitized mortgages are hampered by servicers lack of investment in staff and technology needed for modifications, by the lack of guidance servicers have received from private Mortgage Backed Securities pools about how to determine which mortgages should be modified, and by the high delinquency recidivism rate of such mortgages. In addition, the authors assert that subprime loans are especially challenging to modify because it is more difficult to make such mortgages affordable than it is to do so with prime mortgages, and because subprime mortgages are more often paired with junior liens. Empirically, Piskorski, Seru, and Vig (2009) find that delinquent loans held in the lender s portfolio were less likely to foreclose than securitized loans, and posit that servicers of securitized mortgages face significant costs associated with renegotiating loans that discourage them from making modifications. The authors use loan level data from Lender Processing Services (LPS) (formerly called McDash Analytics) on first lien loans, and restrict the analysis to fully documented loans in order to address potential selection bias between securitized loans and those held by a bank. 6
7 In contrast, Foote, Gerardi, Goette, and Willen (2009) find that securitized and nonsecuritized loans are modified at about the same rate. The authors find evidence that most modifications result in increased monthly payments, and that modifications that result in increased monthly payments are much more likely to end in foreclosure than those that result in lower payments. The authors did not have access to direct information about modifications in data they were using -- the LPS data, and therefore use an indirect method to identify modifications. Adelino, Gerardi, and Willen (2009) suggest that mortgages in default that are subprime and have lower credit scores and higher loan-to-value ratios (LTVs) are more likely to receive modifications than other mortgage loans in default. The authors use a sample of loans from LPS and a series of logit models to estimate the marginal effects of different loan characteristics on the probability of modification. However, like Foote, Gerardi, Goette, and Willen (2009), they were unable to access specific information about modifications, and had to use an indirect identification process. Agarwal (2010) and his colleagues use the OCC s mortgage metrics database (the same database that we use in this paper) to evaluate the modification or other outcome of mortgages that became seriously delinquent between January 2008 and June Using regression analysis in which the dependent variable is the probability of one of the possible outcomes of the delinquency within six months of the delinquency, they find that the likelihood of modification of securitized loans is up to 70% lower that the likelihood for portfolio loans. They also find considerable variation in the practices of different servicers that cannot be explained by differences in the loans they service; indeed the identity of the servicer explains as much variation in modification terms as the characteristics of the borrowers. They find that greater 7
8 reductions in mortgage payments or interest rates are associated with lower default rates in the six months following modification. However, the models they used to study the outcomes of delinquent loans do not account for the competing risk nature of these outcomes, thus raising concerns about model mis-specification biases. Additionally, their models for the performance of modified loans include only one modification feature (e.g., interest rate reduction) at a time, thus raising concerns about omitted variable bias in the coefficient of the included feature (which may be correlated with the omitted features). There is more research on outcomes after default other than modifications. Ambrose and Capone (1996), for example, focus on foreclosure and find that, after default, the foreclosure rate of minority borrowers is very similar to that of white borrowers, and lenders tend to offer minorities more time to work out their situation before initiating foreclosure. Their analysis is limited, however, to descriptive statistics, and does not control for the influence of other potentially relevant variables. In addition, their analysis may not be representative of the current conditions because it is based on data from the beginning of the 1990s, a period long before the onset of massive securitization, when lending standards may have been different. Capozza and Thomson (2006) analyzed a rich set of data on a sample of 6,000 subprime mortgages issued by a single lender that were at least 90 days delinquent on September 30, 2001 to identify determinants of the mortgages status eight months later. They found that loans with high interest rate premia were less likely to be foreclosed, perhaps because lenders have a greater incentive to forbear when the loan carries an interest rate favorable to the lender. They also found that lenders are more likely to foreclose on loans with fixed interest rates, standard documentation and high loan-to-value ratios, and less likely to foreclose during times of declining interest rates or high levels of economic growth (perhaps because defaults when the 8
9 economy is strong are more likely to have been triggered by the borrower s bad luck, such as a health crisis or divorce). Lenders also are more likely to forbear when the borrower has made more payments, and when the payment to income ratio is high. The generalizability of these findings may be limited, however, because the loans were issued by a single lender, and were originated prior to 2001, before the boom in subprime home purchase mortgage lending and the recent dramatic rise and fall of housing prices. Pennington-Cross (2006) used a sample of 5,000 fixed rate subprime loans to estimate a competing risk multinomial logit model of the outcomes of delinquency (defined as termination, cure, partial cure, or REO), and found that almost all loans that began the foreclosure process were ultimately terminated. He found that several borrower, loan, and neighborhood factors, including the equity in the home, local unemployment rates and market interest rates, influence the probability of these outcomes. More recently, Pennington-Cross and Ho (2010) used a sample of 173,000 fixed and adjustable rate mortgages originated between 1998 and 2005 to estimate a competing risk model of loan terminations through default or prepayment. They found evidence that borrowers who expect to sell their property or refinance their loan self select into using ARMs. They also found that the magnitude of the payment shock when the ARM interest rate resets is highly correlated with the propensity to default, with larger payment shocks increasing the default probability. Voicu, Jacob, Rengert, and Fang (2011) merged data from Loan Performance Corp. with that from the Home Mortgage Disclosure Act dataset to study the determinants of a variety of default resolutions. They found that product features affect the probability of various outcomes: ARMs, interest-only, and loans with low- or no-documentation are more likely to enter foreclosure proceedings conditional on default, and more likely (conditional on entering 9
10 foreclosure proceedings) to end up as REO. They also found that demographics affect default outcomes. Owner-occupancy is associated with lower likelihood of foreclosure initiation and REO, and greater likelihood of curing default. Non-Hispanic Asians are more likely than non- Hispanic whites to terminate their loans as REO if they enter foreclosure, and are less likely to cure at all stages of the process. Non-Hispanic blacks are less likely to enter foreclosure if they default than are non-hispanic whites. Additionally, default outcomes are impacted by local legal, economic and housing market conditions, and the equity in the home. In a 2009 study, Abt Associates used data on loans in five mid-atlantic states and Washington, D.C. for which Wells Fargo serves as the trustee. They found evidence to suggest that there is wide variation across servicers in the incidence of loan modifications and other outcomes. However, their sample was limited both geographically and by the servicers involved. The existing literature, accordingly, does not focus much on the determinants of modifications, for which high quality data has only recently become available. The research on the determinants of other outcomes upon default can help to inform our understanding of what might determine the propensity of distressed borrowers to receive modifications. But modifications are likely to be influenced by somewhat different factors, both because modifications require more interaction between the borrower and lender than many of the other outcomes studied, and because the political and economic climate of the foreclosure crisis may be leading to modifications that would not take place in less difficult times. But even if the determinants of, e.g., cure, are similar to the determinants of modification, the existing literature on those other outcomes is limited by its focus on either single lenders or a constrained range of mortgage products. 10
11 3. Theoretical Model and Empirical Strategy This paper provides an empirical analysis of the factors that determine the outcomes of seriously delinquent loans (loans at least 60 days delinquent). Theoretically, the outcomes are the process of a negotiation between the borrower and the lender (or servicer acting on behalf of either the lender or the investor if the mortgage has been securitized). For expositional ease, we will refer to the borrower s counterparty in the negotiations as the servicer. The borrower is acting to minimize the loss of any equity she has invested, minimize the costs of the delinquency, and minimize the cost of carrying the mortgage in the future. The servicer is acting to maximize the return the mortgage provides to the investors or lender. The servicer may have interests that differ from the lender s or investors, of course, so a more accurate and complete model would account for the different interests of the borrower, lender/investor and servicer. We have almost no information about the servicers involved in the mortgages we study, however, because the identities of the servicers were withheld in the data. Further, the interests of the servicers are tied to the structure of their compensation for foreclosing on the loan versus the compensation received for other outcomes. Those incentives may explain why a servicer would allow a delinquent loan to remain delinquent without taking any action to foreclose or otherwise address the delinquency, or may explain why a servicer would foreclose on a loan rather than reach a modification or other workout. Unless those incentives depend upon characteristics of the borrower, loan, property or neighborhood, however, it is reasonable to assume that although the servicer may not be a faithful agent in deciding where to draw the line between the number of loans foreclosed versus modified, for example, its decision about which loans to foreclose versus modify should not be distorted by its own interests and should be subject to monitoring by the lender/investor. 11
12 We further assume that a servicer acting as a faithful agent of the lender or investor in deciding which outcomes are appropriate for a loan with particular characteristics is basing that decision on the net present value test set forth in the Hope for Homeowners Act of 2008: (a)in General-Except as may be established in any investment contract between a servicer of pooled residential mortgages and an investor, a servicer of pooled residential mortgages... (2) shall be deemed to act in the best interests of all such investors and parties if the servicer agrees to or implements a modification or workout plan, provided that any mortgage so modified meets the following criteria:... (C) The anticipated recovery on the principal outstanding obligation of the mortgage under the modification or workout plan exceeds, on a net present value basis, the anticipated recovery on the principal outstanding obligation of the mortgage through foreclosure. (emphasis added). In addition, we assume that the servicer is cognizant of the incentive effects that its actions on one mortgage might have on borrowers who hold similar mortgages and are not in default. In other words, the servicer will seek to avoid granting modifications where doing so might encourage similarly situated borrowers to strategically default. Our empirical strategy to explore the determinants of the outcomes of delinquent loans employs multinomial logit models in a hazard framework to explain how loan, borrower, and neighborhood characteristics affect which of the following five groups of outcomes, as depicted in Figure 1, results from a seriously delinquent loan: (1) the borrower cures the delinquency (all past due amounts are paid by the borrower, or the loan balance is paid off via a regular sale or refinance); (2) the servicer modifies the loan; (3) the borrower and servicer agree on some other non-liquidation workout (i.e., forbearance, repayment plan, FHA partial claim, 3 loan 3 An FHA partial claim might be used if the Federal Housing Administration (FHA) insured the loan. A one-time payment is made by the FHA to the lender to cover all or a portion of the default; the borrower is required to sign an interest free note for the amount of the advance claim payment payable to the FHA; the promissory note is not due and payable until the homeowner either pays off the first mortgage or no longer owns the property 12
13 reaged/deferred/extended, 4 other 5 ); (4) the borrower suffers a liquidation (short sale, deed in lieu, foreclosure auction sale or REO); or (5) the loan becomes more months delinquent. 6 Although our data includes detailed information on the type of modification (e.g., interest rate reduced; term extended; principal write-down, etc.), we do not distinguish among the different types in this paper primarily due to the large number of types and the relatively small number of loans in a given type. These features of the modification data together with the large number of categorical covariates used in the empirical model and the large sample size make the estimation practically infeasible if detailed modification types were included. 7 The data is organized in event history format, with each observation representing one month in which a seriously delinquent loan remains in default, to allow for time-varying covariates. A loan drops out of the sample after one of the outcomes 1 to 4 occurs. With the data structured in event history format, the multinomial logit has the same likelihood function as a discrete time proportional hazards model (Allison, 1995). In addition, the multinomial logit model directly accounts for the competing risks of the various outcomes (i.e., in each month, the loan can be in only one state - delinquent, cured, modified, etc.) by imposing the restriction that 4 "Reaged/Deferred/Extended" includes, according to the data provider, workouts where there has been an agreement between servicer and borrower to defer principal and interest but with no other terms to enhance affordability. 5 "Other" typically includes, according to the data provider, alternative loss mitigation strategies designed to provide temporary help, such as partial claims and Fannie Mae s HomeSaver Advance. The former is similar to the FHA partial claim except that the insurer is a private entity. The latter is designed for the borrower who is otherwise capable of meeting his obligations and will be able to resume timely payments once the arrearage is brought current; under the program, Fannie Mae authorizes its servicers to offer an unsecured personal loan that will enable a qualified borrower to cure the payment default on a Fannie Mae owned or securitized loan; this personal loan has fewer up-front costs and can be put in place more quickly than many other options. 6 The Cure outcome also includes loans that become 30-day delinquent, as long as they stay 30 DPD until the end of the study period or become current by then, with none of the other outcomes occurring; however, if a loan becomes 30DPD or current and then reverts to serious delinquency, we consider the loan seriously delinquent and follow it until the end of the study period or until another outcome occurs whichever comes first. 7 More specifically, the small number of observations for a given modification type together with the large number of categorical covariates would likely result in many empty cells which would make it impossible to reliably estimate many coefficients in the multinomial logit models we use. In addition, the large number of modification types together with the large sample size would require extraordinary computer resources to estimate our multinomial logit models. 13
14 the sum of the probabilities of the possible outcomes is equal to one. In the multinomial logit framework, the probability of each of the 5 outcomes described above is given by: PROB(O it j) 1 e 4 j 1 j X it e j X it, for j=1, 2, 3, 4 PROB(O it j) j 1 e X it j, for j=5, where PROB(O it = j) is the probability that the ith loan will have outcome j in month t, outcome (5), the loan becoming additional months delinquent, is the reference outcome, X it are the explanatory variables, and β j are the coefficients to be estimated. To put this notation in the hazard framework, Prob(O it =j) is the hazard rate for outcome j. For example, if outcome j is (1), cure, then Prob(O it =j) is the conditional probability that the loan will leave delinquency through cure in month t conditional on the loan surviving in delinquency until then. We include time since default among the covariates to allow the hazard rate to be timedependent. The coefficient estimates are used to calculate the marginal effects of the explanatory variables on the probability of each outcome. To control for city-, state-, or nationwide macroeconomic factors, we include quarterly fixed effects. To control for systematic changes in mortgage lending over time, we include origination year fixed effects. To control for unobserved heterogeneity and possible dependence among observations for the same loan, we use a cluster-robust variance estimator that allows for clustering by loan. The independence of irrelevant alternatives (IIA) assumption 8 - a main drawback of the multinomial logit model - is not a concern in our case, because the Small-Hsiao test cannot reject the IIA assumption for our data. 8 This assumption implies that the odds ratio of a pair of outcomes is independent of any of the alternative outcomes. 14
15 4. Data Description To investigate the determinants of modifications, we analyze outcomes between January 2008 and January 2010 for all first lien mortgages originated in New York City from 2004 to 2008 and still active as of January 1, 2008 in OCC Mortgage Metrics. OCC Mortgage Metrics is a special extract of the LPS Applied Analytics database that includes detailed information about loan modifications not usually reported in LPS. 9 As with the standard LPS database, Mortgage Metrics includes loans serviced by 12 large mortgage servicers covering approximately twothirds of all mortgages outstanding in the United States and includes all types of mortgages serviced, including subprime mortgages. 10 Nationally, the loans in the OCC Mortgage Metrics dataset represent a large share of the overall mortgage industry, but they do not represent a statistically random sample of all mortgage loans. For example, only the largest servicers are included in the OCC Mortgage Metrics, and a large majority of the included servicers are national banks. Thus, the characteristics of these loans may differ from the overall population of mortgages in the United States. For example, subprime mortgages are underrepresented and conforming loans sold to the GSEs are overrepresented in the OCC Mortgage Metrics data (U.S. Department of Treasury, 2008). An observation in the data set is a loan in a given month. Although we look at 9 In addition, the quality of OCC Mortgage Metrics data is likely higher than that of the LPS data because the OCC and OTS went to great lengths to standardize the reporting of the variables across lenders and to correct data entry errors. On the other hand, the LPS data follows loan performance since origination, while the OCC Mortgage Metrics follows loan performance only since the beginning of The number of servicers in the OCC Mortgage Metrics has varied over time since the onset of the data collection in 2007, primarily due to mergers and acquisitions among the initial servicers that provided the data. As of the end of 2009, the servicers in the OCC Mortgage Metrics included nine national banks and three thrifts with the largest mortgage-servicing portfolios among national banks and thrifts (U.S. Department of Treasury, 2010). The OCC Mortgage Metric extract for New York City includes 11 servicers. 15
16 originations between 2004 and 2008, monthly performance history for those loans is only available from January 2008 through January If a loan was originated in 2004 and went through foreclosure proceedings in 2007, therefore, we will never see that loan. Although OCC Mortgage Metrics provides detailed information on borrower characteristics, loan terms, payment history and modifications, it contains no information on borrower race or gender and provides little information about property or neighborhood characteristics. We therefore supplement the loan level data with information from multiple sources. To match loan level information from the OCC Mortgage Metrics database to other sources, we relied on mortgage deeds contained within the New York City Department of Finance s Automated City Register Information System (ACRIS). Using a hierarchical matching algorithm, we were able to match 65 percent of the loans in the OCC Mortgage Metrics database back to the deeds records, which thus gave us the exact location of the mortgaged property. 11 This 65 percent sample is not significantly different from the full universe in terms of the loan and borrower characteristics that we use in the analyses below. 11 Our procedure for matching OCC Mortgage Metrics to ACRIS is similar to the method used by Chan et al. (2010) to match LoanPerformance to ACRIS. Our data from ACRIS do not include Staten Island and thus we had to drop this borough from our analysis. We merged OCC Mortgage Metrics loans to ACRIS mortgage deeds using three common fields: origination or deed date, loan amount and zip code, using six stages of hierarchical matching. At the end of each stage, loans and deeds that uniquely matched each other were set aside and considered matched, while all other loans and deeds enter the next stage. Stage 1 matched loans and deeds on the raw values of date, loan amount and zip code. Stage 2 matched the remaining loans and deeds on the raw values of date and zip code, and the loan amount rounded to $1,000. Stage 3 matched on the raw values of date and zip code, and the loan amount rounded to $10,000. Stage 4 matched on the raw values of zip code and loan amount, and allowed dates to differ by up to 60 days. Stage 5 matched on the raw value of zip code, loan amount rounded to $1,000, and allowed dates to differ by up to 60 days. Stage 6 matched on the raw value of zip code, loan amount rounded to $10,000, and allowed dates to differ by up to 60 days. We believe it is valid to introduce a 60-day window because in ACRIS, there may be administrative lags in the recording of the deeds data. The chance of false positive matching is low because we are matching loans to the full universe of deed records, and only considering unique matches. The relatively low match rate of 65 percent is due to the fact that we were unable to match loans made on coop units in the OCC Mortgage Metrics data to ACRIS deeds because coop mortgages are recorded differently in ACRIS and do not list a loan amount. During our study period, 28.2% of residential property sales in the four boroughs studied were coops. Further, our match rate was lowest (44%) in Manhattan where 48% of sales during the study period were of coop units. This evidence suggests that had we been able to exclude coop loans from our original OCC Mortgage Metrics dataset prior to matching to ACRIS, our final match rate would have been much higher (around 90%). 16
17 After we had a unique parcel identifier matched to each loan record, we were able to match on many other sources. First, we attach some additional borrower characteristics, including race and ethnicity, from Home Mortgage Disclosure Act (HMDA) data. 12 Second, we incorporate information on whether the borrower took on additional mortgage debt following loan origination, obtained from the New York City Department of Finance (DOF) s Automated City Register Information System (ACRIS). Third, we merge information from the DOF s Real Property Assessment Database (RPAD) on building characteristics. Fourth, we merge information on whether the borrower received foreclosure prevention counseling or other assistance (including legal services) from any of the non-profit organizations coordinated by the Center for New York City Neighborhoods (CNYCN) 13. Fifth, we merge in repeat sales house price indices the Furman Center for Real Estate and Urban Policy compiles to track appreciation in 56 different community districts of New York City. 14 Sixth, we link information on the demographic characteristics of census tracts using the 2000 Census. Seventh, we add the rate of mortgage foreclosure notices (lis pendens) at the census tract level. 15 Eighth, we attach monthly crime rates at the census tract level using a database obtained from the New York City Police Department. Finally, using all loans in the LPS data (not just the seriously delinquent ones), we 12 We merged HMDA records to ACRIS deeds based on date, loan amount and census tract, using the same six stage hierarchical matching technique as for the OCC Mortgage Metrics-ACRIS match. We then paired each of the OCC Mortgage Metrics records with HMDA records based on the unique deed identification number from ACRIS. In the end, we were able to match 73 percent of the OCC Mortgage Metrics-ACRIS matched loans (or 48 percent of all OCC Mortgage Metrics loans) to the HMDA records. While other researchers have matched loan level data (such as OCC Mortgage Metrics) directly to HMDA by using the zip code as a common geographic identifier, our matching strategy is likely more reliable as it uses a more precise common geographical identifier (census tract). 13 CNYCN is a non-profit organization, funded by grants from government, foundations, and financial institutions, to coordinate foreclosure counseling, education, and legal services from a variety of non-profit providers throughout New York City to homeowners and tenants at risk of losing their home to foreclosure. CNYCN directs borrowers facing trouble with their mortgages who call 311 or CNYCN directlyto local foreclosure counseling or legal services. Each of its partner organizations then reports back to CNYCN on which borrowers received foreclosure prevention counseling or legal services. 14 See Armstrong et al. (2009) for a description. We transform quarterly indices into monthly series by linear interpolation. 15 The lis pendens are from Public Data Corporation. The rate is computed as the number of lis pendens per 1000 housing units recorded over the 6-month period preceding the month of loan performance. 17
18 construct each servicer s share of the loans which were originated in the zip code between 2004 and 2008 and were outstanding and serviced by one of the LPS servicers at some point in 2008 or When available, we matched data at the observation level to show information about the specific property being studied. When observation level data was not available (e.g., educational attainment) or was not appropriate (e.g., 6 month prior neighborhood lis pendens rate) we used neighborhood level data instead. We define neighborhood as a census tract, the smallest geographic level available, whenever possible. However, for several data sources, census tract data was not available, so we had to use community district or zip code level data. 16 The change in the unemployment rate and the rate of house price appreciation were calculated at the community district level, and the servicer s share of the outstanding loans was computed at the zip code level; all other neighborhood characteristics are census tract level. To illustrate the relative size of each jurisdiction, Figure 2 shows census tract boundaries, community district boundaries and foreclosures in the four boroughs of New York City in Descriptive Statistics Table 1 presents descriptive statistics for the dataset used in the estimation, organized in four panels: A distribution of outcomes; B loan characteristics; C borrower and property characteristics; and D neighborhood characteristics. Panel A shows that only 9 percent of the seriously delinquent loans in our data received a modification, and another 8 percent received 16 Community districts are political units unique to New York City. Each of the 59 community districts has a Community Board whose members are appointed by the Borough President of that district; half of the members are nominated by the City Council members who represent the district. The Community Boards review applications for zoning changes and other land use proposals, and make non-binding recommendations about those proposals. They also recommend budget priorities. 17 For readability purposes, we do not show zip code boundaries in this map. We note however that the typical zip code size, both in terms of area and population, is larger than the typical census tract size but smaller than the typical community district size. 18
19 other workouts including a repayment plan (1.3%), a forbearance plan (0.5%), or an undefined workout (6.3%). About 15 percent of the loans were cured through the borrower s own efforts, about 5 percent experienced liquidation, and the remaining loans (almost two thirds of the total) remained in serious delinquency during the whole study period. The shares of loans going into particular outcomes may differ between New York City and other cities or the nation as a whole for two reasons: 1) house prices in New York City peaked later and have fallen less precipitously than in many other cities and 2) New York State has a longer, more protracted judicial foreclosure process than most states. Panel B presents descriptive statistics for the characteristics of the loans in our dataset. Our dataset covers a range of loan products. Of the 29,366 seriously delinquent loans in our dataset, there is a nearly even split between prime and non-prime loans, 60% have fixed interest rates while the remainder have adjustable rate mortgages, 20% were interest only at origination and 78% are conventional mortgages. Home purchase loans make up 43% the loans in our sample, while 35% are refinances. Our sample also includes a mix of loans that have been privately securitized, bought by the GSEs and held in portfolio. This robust mix of loan products, uses and investors allows us to advance the literature because our conclusions are not limited to only one loan type or group of loans. The servicers in our sample serviced an average of 18% of the outstanding loans in each zip code of the loan origination. The relative interest rate at origination for FRMs is calculated as the interest rate minus the Freddie Mac average interest rate for prime 30-year fixed rate mortgages during the month of origination. For ARMs, it is the interest rate minus the six-month London Interbank Offered Rate (LIBOR) at origination. In our sample, over 40% of the fixed rate loans have relative 19
20 interest rates between 0 and 1 percent and nearly 50% of the adjustable rate loans have relative interest rates between 2 and 4 percent at origination. Because certain characteristics of the loans change over time, we construct loan-months for every month during our study period in which a loan was active, for a total of 258,326 loanmonths. The last two descriptives in Panel B are measured across all loan-months in our sample, and show that in 33% of the loan months, the borrower had a junior lien on the property, originated either at the same time as the first lien or after the first lien but prior to the loanmonth. The average LTV for all of the loan months in our sample was 101.8%. 18 This reflected an average 24 percentage point increase in LTV since origination. As Panel C shows, nearly 90% of the borrowers in our sample report that they are owneroccupiers. The property types in the sample are relatively evenly mixed between single family homes or condominiums and 2-4 family homes. That mix is fairly reflective of the owneroccupied housing stock in New York City. According to the 2009 American Community Survey, just 42 percent of homeowners in New York City live in single-family homes, compared to 88 percent nationwide, 86 percent in Los Angeles and 57 percent in Chicago. The remainder of the homeowners in New York City live in one unit of a two to four unit building or own a condominium or cooperative apartment in a larger building. We constructed borrower months for those borrower level variables that change over time. The current FICO score (reported quarterly for each borrower) has a mean of 556 across all borrower-months, and 75% of borrower-months have FICO scores of 620 or less. On average, FICO scores of delinquent borrowers in our sample declined by 111 points from origination to the month being studied. Foreclosure counseling is also measured in loan-months to ensure that we are capturing 18 LTV is based on the first lien only. We do not have data on outstanding balances, delinquencies or other outcomes for junior liens. 20
21 counseling that occurred prior to the outcome; 2.2 percent of all borrowers received counseling at some point prior to the outcome (or the end of the study period if no resolution occurred). The characteristics of the neighborhoods in which the properties in our sample are located (shown in Panel D) largely mirror the neighborhood characteristics of the four boroughs of New York City included in our analysis, except that properties in our sample are: (1) more likely to be located in neighborhoods with high concentrations of non-hispanic blacks; (2) less likely to be located in neighborhoods with high concentrations of Hispanics; and (3) more likely to be in neighborhoods with median incomes between $40,000 and $60,000 and less likely to be in neighborhoods with median incomes less than $20,000 or more than $60, Panel D also reveals some interesting neighborhood shifts from loan origination to loan month studied. On average, the community district unemployment rate increased by two percentage points. Further, in the neighborhoods where the loans in our sample are located, house prices decreased by an average of 19.3 percent between origination and the loan month being studied. Our model also includes servicer fixed effects. Panel E shows the range of FICO scores and LTV ratios at the time of loan origination for the delinquent loans in our sample across the 11 servicers covered in the OCC Mortgage Metrics Data for New York City. 20 Average FICO scores range from 656 to 698. LTVs range from.451 to.800. For this analysis, we chose to focus on seriously delinquent loans because borrowers who receive modifications without ever being seriously delinquent may differ from seriously delinquent borrowers who receive modifications in several ways. First, those borrowers who 19 Not surprisingly, given that owner-occupier borrowers are by definition homeowners, properties in our sample are located in neighborhoods with higher homeownership rates than the average neighborhood in the four boroughs we studied. 20 Note, however, that our models only have 9 servicer dummy variables (one of which is excluded as the reference servicer) because two servicers had too few loans to be accounted for with separate indicators. 21
22 receive modifications without ever being seriously delinquent may be savvier and better able to negotiate the modification process than the seriously delinquent borrowers who receive modifications. Second, borrowers who have never been seriously delinquent may receive modifications because loan servicers target certain borrowers for modifications (e.g., borrowers for whom the default is deemed imminent due to a forthcoming lay-off or other event that will affect the ability to pay in the foreseeable future). Third, borrowers who receive modifications without being seriously delinquent may have loans that are systematically different in ways that made those loans easier or more attractive for servicers to modify. Although we are unable to empirically explore the first and second hypotheses, Table 2 presents descriptive evidence that supports the third hypothesis 5. Results Table 3 presents odds ratio estimates for the multinomial logistic regression described above. Below, we review in detail the results on the determinants of loans modifications (which are the focus of this paper) and provide an overview of the results for the other default outcomes included in the analysis. 5.1 Determinants of Modifications Loan characteristics. The first set of rows in Table 3 show the impact the loan type has on outcomes. Loans that the servicer defines as non-prime at origination were more likely to be modified than prime loans. However, adjustable rate and interest only mortgages were less likely to be modified than fixed rate mortgages, perhaps because these risky loans would require the most drastic modifications. Fully documented loans are more likely to be modified than no- 22
23 doc loans, perhaps because lenders require full documentation before issuing a modification. The purpose of the loan (whether for home purchase or refinance) does not affect the likelihood of receiving a modification. Contrary to Foote, Gerardi, Goette, and Willen (2009), but consistent with Piskorski, Seru, and Vig (2009) we found that loans held in portfolio were significantly more likely to be modified than securitized loans held by private investors. Securitized loans guaranteed by the GSEs were less likely than all other loans to be modified, perhaps because the incentives the servicers of GSE loans had, or the processes they used, may have been systematically different. We next focus on the pricing of loans at origination. For FRMs, interest rate spreads above the market average rate are associated with a lower likelihood of modification. Consistent with other research (Chan, et al 2010), if we interpret the loan pricing terms to reflect ex ante risk pricing by lenders, these coefficients could be picking up some borrower risk that is not reflected in the specific risk controls we include in our model. If so, the servicer might be wary of extending modifications to borrowers that the originating lender had evaluated as being more risky. For ARMs, loans with higher interest rates at origination are more likely to be modified, with the highest likelihood when the rate was up to two points higher than the index. It may be that teaser rates for ARMs make the interest rate at origination for ARMs a less accurate signal of borrower risk than the rate at origination for FRMs. Or higher rates at origination for ARMs may be associated with lower probabilities of default after reset (because the adjustment may be lower than the adjustments of low teaser rates), and thereby make the borrower a more attractive candidate for modification. We find that the likelihood that a loan is modified decreases as the time since the initial adjustment increases. Again, this finding may reflect a reasonable concern 23
24 of either the borrower or the servicer about the likelihood that the modification will be successful in the long run. Defaults further out from the adjustment may be more likely to be related to job loss or other crises that would make any modification difficult to sustain, while delinquencies soon after an adjustment may signal that the family is just having trouble with the increase, but is otherwise still solvent. A property's current LTV has a significant, large, and monotonically increasing effect on the likelihood of modification. As LTV increases, the servicer may realize that the lender or investor would lose more if the servicer forecloses on a property rather than modifying, and thus be more inclined to keep the borrower in the property by modifying. Consistent with the findings of Cordell, et al (2008), if the property has a second lien attached to it, the loan is significantly less likely to be modified. Without the cooperation of the second lien holder, it makes no sense for a servicer to modify a loan. Older loans are more likely to be modified, perhaps indicating a servicer's willingness to work with a borrower who has a track record of being reliable. A longer time in default is associated with a decreased propensity for modifications, perhaps because borrowers who want modifications seek them out very soon after defaulting on their loan or because servicers target modifications to borrowers who have only recently become delinquent. Finally, we find that the propensity to modify loans does not vary substantially across servicers. Only 3 out of the 8 servicer dummy variables included in our model have statistically significant odds ratios with respect to the modification outcome. 21 Additionally, we find little variation in the probability of modification with respect to the servicer s presence in the neighborhood, as measured by the share of loans the servicer serviced in the neighborhood in recent years. These findings may reflect the increasing government efforts to standardize the 21 In addition, one of the 3 statistically significant odds ratio s is only significant at the 10 percent level. 24
25 modification process across servicers, or may reflect the fact that securitization of the loans may have made it impossible for any particular servicer to benefit the lenders/investors it is working for by coordinated action on particular loans. Property and Borrower characteristics. Consistent with prior literature and the current regulatory framework, loans on owner-occupied properties are more likely to be modified than investor-owned properties. Further, loans on 2-4 unit or 5+ unit rental apartment buildings are less likely to be modified than loans on single-family buildings or condo units. A greater decline in a borrower s FICO score from loan origination to the first delinquency (so, before the delinquency itself had an impact on the score) is correlated with a lesser likelihood of the loan being modified. Servicers may see borrowers whose FICO scores had declined greatly as bad candidates for modifications because they appear to be undergoing some other financial hardship. However, controlling for this decline in the model, borrowers with higher current FICO scores were less likely to receive modifications, perhaps indicating that servicers were unwilling to modify loans for borrowers that may be strategically defaulting. The race or ethnicity of the borrower had no significant impact on the likelihood that a loan would be modified, except in one respect: non-hispanic Asians were less likely to have their loans modified than non-hispanic whites. Consistent with Fang, Jacob and Voicu (2009), one possible explanation for this racial disparity is that language barriers may make the complex negotiations needed to secure a modification more challenging for Asian borrowers. We did not find a significant relationship between a borrower's receipt of foreclosure counseling and the likelihood that their loan would be modified. However, just 2.2 percent of the borrowers in our sample had received counseling. 25
26 Neighborhood characteristics. Table 3 also explores how the housing market conditions in a neighborhood affect the likelihood that a loan on a property within the neighborhood will be modified. Loans on properties in neighborhoods with high foreclosure rates in the six months prior to the loan month being studied are less likely to be modified, and the likelihood decreases as the foreclosure rate increases. One of the strongest predictors of modification in our model is how the rate of house price depreciation compares to rates in other neighborhoods. 22 Specifically, in neighborhoods where properties have lost value since the loan was originated, the probability of getting a modification is higher in those neighborhoods with lower rates of depreciation, relative to other comparable neighborhoods. By comparison, the probability of modification varies little with the appreciation rate in neihborhoods in which housing values have increased since the loan was originated. Loans on properties in neighborhoods with just above 0 appreciation rate and those in neighborhoods with just below 0 appreciation rate have similar probability of receiving a modification (i.e., there is no discrete jump in the probability of modification around the 0 appreciation rate). These findings suggest that servicers acting to minimize lender/investors losses may be wary of offering modifications in the hardest hit neighborhoods because those may have little chance of recovering in the short term. The lower the depreciation rate the stronger the servicer s incentives to modify in order to minimize lender/investor s losses. However, as we move into the positive appreciation territory, we would expect struggling borrowers to have options to cure on their own, such as selling the home for the full amount of the loan or refinancing, so the borrowers may be less likely to seek modifications. The net effect of the borrowers and servicers incentives is consistent with the 22 The results pertain to house price appreciation since origination. We also experimented with recent house price appreciation (appreciation over the four quarters preceding the performance quarter) and the effects are consistent (similar significance levels and slightly lower magnitude) 26
27 flattening out of the relationship between the modification probability and appreciation rates across neighborhoods that have not lost value. Loans on properties in neighborhoods that are greater than 60% black or greater than 40% Hispanic are more likely to be modified than loans on properties in other neighborhoods. One possible explanation is that foreclosure outreach efforts are targeted to primarily minority neighborhoods, which are thought to be more vulnerable to foreclosure. Several findings suggest that servicers are less likely to modify loans of borrowers who the servicers fear may be especially likely to strategically default. Loans in neighborhoods with high educational attainment, for example, are less likely to be modified. Neighborhood educational attainment is likely to be a rough proxy for borrower educational attainment, and lenders may suspect that those borrowers may be more financially sophisticated and therefore more likely to strategically default. Loans in neighborhoods where many households have children also are less likely to be modified, which may reflect servicers assumptions that those families are unlikely to actually walk away from their homes but may default strategically in order to reduce their payments through modifications. On the other hand, in neighborhoods with homeownership rates above 60% (a very high rate for New York City) borrowers are more likely to receive modifications. Other demographic characteristics, including the percentage of a neighborhood s population that is foreign-born, the percentage of its population over 65 years old, and its median household income, were not significant predictors of modification. 5.2 Determinants of Other Outcomes Cure by borrower. In general our findings regarding the determinants of a borrower curing the delinquency themselves are consistent with prior literature. Borrowers who are more 27
28 financially stable (as indicated by higher FICO scores or FICO scores that have declined less) and live in neighborhoods whose residents have higher incomes and greater educational attainment, are more likely to cure the delinquency through their own actions, a sale or a refinance. Borrowers who took out loans that were less risky at origination those with fixed rate, full documentation, lower relative interest rates, or lower current LTVs, and those without junior liens also were more likely to cure their delinquencies themselves. Those findings may indicate that savvier borrowers may be able to refinance their loans or otherwise catch up on missed payments. Borrowers in neighborhoods with higher foreclosure rates in the 6 months prior to the loan month were less likely to cure on their own, possibly indicating that they had lost one of the options for curing: the ability to sell. Borrowers who received foreclosure counseling were less likely to cure on their own, but this may be a selection effect: borrowers may seek counseling only when they have run out of other options and cannot cure on their own. Other non-liquidation workouts. We would expect the characteristics of borrowers coming to some sort of non-liquidation workout to be similar to borrowers who get modifications, and in many ways they are. The likelihood of coming to a non-liquidation workout decreases as relative interest rates rise. Although this runs contrary to the findings of Capozza and Thomson (2006), our data set covers multiple servicers--with great variability in outcomes across servicers--as well as both prime and non-prime loans and so our findings are more generalizable than theirs. Similar to modified loans, borrowers with higher current FICO scores were less likely to get a non-liquidation workout than those with very low scores. Servicers may be loathe to offer workout options to borrowers with high FICO scores because they want to avoid rewarding otherwise financially healthy borrowers with workouts after strategic defaults. 28
29 There are two loan-related predictors of non-liquidation workouts that contrast with our modification findings: (1) loans guaranteed by GSEs are more likely to get a non-liquidation workout than those held in private securitization and (2) while adjustable rate loans were less likely to be modified than fixed rate loans, they are more likely to get another non-liquidation workout. The latter finding seems to indicate that although servicers may be wary to modify the riskier loans, they may be willing to pursue other, less extensive workouts perhaps in response to the strong criticism they face about these loans. Servicer fixed effects are some of the strongest predictors of non-liquidation workouts in our model. 6 out of the 8 servicer dummy variables have statistically significant and quite large odds ratios with respect to non-liquidation workouts. There could be several reasons for this finding. First, the government efforts to make the loss mitigation process more uniform across servicers have focused more on modifications than on other alternative strategies. Second, servicers may differ in their institutional ability to offer workouts. And, third, the pool of loans that each servicer oversees may be systematically different and some servicers may have more loans in their portfolio that are better candidates for workouts for other reasons. Borrowers receiving foreclosure counseling through one of the non-profit partners coordinated by the Center for New York City Neighborhoods were significantly more likely to obtain a non-liquidation workout than those who did not. So, even though we did not find that counseling had a significant effect on the likelihood that a borrower s loan would be modified, it does appear that foreclosure counseling helps borrowers to stay in their homes. However, it also may be true that borrowers who most want to stay in their homes are the ones seeking out foreclosure counseling, and hence, there is probably some self-selection bias here. 29
30 Liquidation. Our findings on the likelihood that a servicer will complete foreclosure of a property through liquidation support some of the findings of prior research. We found little difference in the liquidation rate based on the race or ethnicity of the borrowers, affirming the descriptive findings of Ambrose and Capone (1996). In neighborhoods with positive price appreciation (since loan origination), we found servicers more likely to liquidate the property when the appreciation rate is higher, whereas in neighborhoods which have lost value, servicers are less likely to liquidate when the depreciation rate is lower. 23 In addition, we find that loans guaranteed by the GSEs are less likely to be liquidated. We also find that investor owned properties are more likely to be liquidated, which follows conventional wisdom. Borrowers with FICO score that declined from origination to delinquency were more likely to have their property liquidated. A FICO score that already declined prior to the delinquency probably indicates that the borrower was suffering from financial hardship beyond just the cost of the mortgage payments. Such borrowers were probably not good candidates for modifications or other nonliquidation workouts. Loans on properties in neighborhoods with higher concentrations of non- Hispanic blacks or Hispanics are less likely to be liquidated than loans on properties in neighborhoods with lower percentages of such minorities. We also found that loans in neighborhoods with higher percentages of foreign-born or high educational attainment are less likely to be liquidated, although these differences are statistically significant only at the 10 percent level. As community district unemployment rates increased in the year prior to the loanmonth being studied, the likelihood of liquidation increased. Liquidation was the only outcome for which the change in the unemployment rate had a significant effect in our model, albeit at the 10% level. As with non-liquidation workouts, servicer fixed effects are very strong predictors of liquidation, with 6 out of the 8 servicer indicators having statistically significant and large odds 23 Note, however that these effects are statistically significant only at the 10 percent level. 30
31 ratios with respect to this outcome. Finally, the borough fixed effects in our model indicate that properties in Queens are significantly more likely to be liquidated than properties in the other boroughs, probably because properties in Queens that are liquidated spend less time from lis pendens to liquidation. Sensitivity Analysis. Because we focused our analysis on New York City, for which much detailed data is available, we were able to include both variables that are not available in national models (foreclosure counseling, borrowers race and the presence of a junior lien) and variables that have not been used in national models before but that could be added (neighborhood foreclosure rate and neighborhood house price appreciation). As Table 4 shows, our fully controlled model is a slightly better fit for explaining the incidence of modifications than the models that have fewer controls. However, with few exceptions, all of the variables in the fully controlled model point in the same direction and have similar magnitudes as in the leaner models. The one stark exception is the neighborhood racial composition. In the simplest model, borrowers in black and Hispanic neighborhoods appear to be less likely to cure the delinquency on their own. However, when we add in the neighborhood 6-month prior foreclosure rate and neighborhood house price appreciation, these differences disappear. 6. Conclusion The rich data set used in this paper allowed us to improve on the existing literature by assessing the impact that loan, servicer, borrower and neighborhood characteristics have on the outcome of a seriously delinquent loan. The OCC s MortgageMetrics data allowed us to pay particular attention to the determinants of loan modifications. Although our work is limited to the context of New York City, we believe our results may be generalizable to many other areas. 31
32 Manhattan may be a fairly unique housing market, but the majority of the mortgages we examine were originated in the other boroughs, which are similar in density, housing stock, and other measures to many other cities across the country. For example, most foreclosures in the city have taken place in the outer borough neighborhoods with a high concentration of one- and twofamily housing, and most of the homes affected by foreclosure are one- to four- family homes. More importantly perhaps, we can not think of strong reasons why the more distinct economic environment of New York City would affect the relationships between loss mitigation outcomes and their determinants. 24 Indeed, our analysis on New York City confirms the basic findings with respect to the relatively narrow set of variables used in national-level analyses, even when controlling for data which are difficult to incorporate or have not been previously used in national models. We find that both borrowers and servicers appear to be acting to minimize their (or their lender/investors ) losses in their propensity to cure, modify, come to another non-liquidation workout or liquidate the property. As we would expect, current LTV is one of the strongest and most statistically significant predictors of either cure or modification, with the likelihood of curing falling and the likelihood of modifications rising as the LTV rises. Our evidence suggests that borrowers who live in highly educated, high income neighborhoods and have high credit scores or FICO scores that have declined less since loan origination are likely to find a way to cure on their own. The neighborhood's housing price appreciation also is a strong predictor of outcomes. Our findings suggest that servicers may be wary of offering modifications and more likely to liquidate the loan in neighborhoods with high house price depreciation rates because those 24 Housing and labor market variables may have smaller variation in the stronger housing and labor markets of New York City, however this would only affect the precision of the coefficients on those variables. 32
33 neighborhoods may have little chance of recovering in the short term. We also find that in neighborhoods with positive appreciation, the servicers are more likely to foreclose the higher the appreciation rate, perhaps because they expect to sell the property quicker and/or at higher price through a foreclosure auction or resale and thus profit from (or lose less from) the foreclosure. Especially risky loan characteristics, including junior liens, ARMs, interest only loans, very high interest rate loans and loans without full documentation result in bad outcomes for both the borrowers and the servicers. Unsurprisingly, having any of these high risk (and now relatively unavailable) characteristics on a loan made a borrower less likely to be able to cure the default on their own. Most of these characteristics also made it less likely that a loan would be modified, either because the cost of modification would be too high for the most exotic loans (such as interest only) or because the actual process of modifying is more difficult, as in the case of junior liens that would require coordination with another servicer or in the case of loans originated without the full documentation necessary to complete a modification. Additional evidence that servicers are acting to minimize lender s or investors losses in their modification decisions can be gleaned from the finding that adjustable rate loans are more likely to be modified immediately prior to or following the initial rate adjustment than many months after the rate adjustment. As more time passes from adjustment, a borrower s delinquency likely has less to do with the payment shock at adjustment and more to do with some unobserved financial difficulty such as the loss of a job. Taking this into account, it appears that servicers are modifying loans when the borrower could afford payments were it not for the payment shock of the adjustment. 33
34 We find no evidence that servicers are discriminating by race in their decisions about whether to modify loans, offer other workouts, or foreclose. In this analysis, we cannot, however, rule out the possibility that the terms of modifications or other workouts might differ by race or some other characteristics of borrowers. Although an individual borrower's race is not a good predictor of the outcome of delinquency, the race of the neighborhood in which the property is located is a good predictor of loan modifications and liquidations. Our model includes controls for many demographic characteristics of a neighborhood, as well as the recent foreclosure rate in the neighborhood, but even controlling for those factors, neighborhoods with large shares of black and Hispanic residents are more likely to get modifications and to avoid foreclosure. This could be because foreclosure prevention efforts are concentrated in minority neighborhoods. Although we find that foreclosure counseling does not significantly increase the likelihood of a loan being modified, it does have a significant and positive effect on the likelihood of the borrower and servicer agreeing on some other workout. Finally, servicers do not vary considerably in their grants of modifications, however there is significant variation in their propensity to offer other non-liquidation workouts and to pursue liquidation. These findings may be due, at least in part, to the fact that the government efforts to make the loss mitigation process more uniform across servicers have focused, so far, more on modifications than on other alternative strategies. They may also reflect some unobservable factors about the loans or staffing, training, or incentive differences among servicers. Our study suggests that modification programs may need to be refined in several ways. First, modification programs should learn from counseling programs. We find that borrowers who receive counseling services are more likely to come to some sort of workout agreement with the servicer, but are no more likely to have their loan be formally modified. If this is because 34
35 none of the currently available modification programs are a good fit for these borrowers, then the modification programs should be revised accordingly. Further, we found that local house price dynamics are a good predictor of whether a loan will be modified. Although the Furman Center neighborhood level repeat sales indices in New York City are more detailed than indices available in other areas, there are opportunities to include house price dynamics in the criteria to determine eligibility for a modification. Case- Shiller constructs zip code level house price appreciation indices for purchase and makes tiered indices available at the MSA level without charge. Finally, our findings suggest a need for additional attention to certain servicers. Even controlling for characteristics of the loan, borrower, property and neighborhood, servicers have pursued liquidations and non-liquidation workouts other than modifications at wildly different rates. This suggests that some servicers may need additional incentives to avoid liquidation or need more time and assistance to build the capacity to do so. We plan to extend this study by analyzing the default rate and determinants of outcomes for borrowers who have gotten modifications. That extension will reveal what characteristics of a modification will most likely predict success while controlling for characteristics of the borrower, the neighborhood and the original loan. 7. Bibliography Abt. Associates. (2009). Loan Modifications as a Response to the Foreclosure Crisis: An Examination of Subprime Loan Outcomes in Maryland and Surrounding States. Adelino, M., Gerardi, K., and Willen, P. S. (2009). Renegotiating Home Mortgages: Evidence from the Subprime Crisis. Draft Manuscript. 35
36 Agarwal, S., Amromin, G., Itzhak, B., Chomisisengphet, S., and Evanoff, D. (2010), Market- Based Loss Mitigation Practices for Troubled Mortgages Following the Financial Crisis. Fisher College of Business Working Paper Series Allison, P.D Survival Analysis Using the SAS system: A Practical Guide. Gary, Thousand Oaks, CA: Sage Publications. Ambrose, B. W. and Capone, C. A. (1996). Cost-Benefit Analysis of Single Family Foreclosure Alternatives. Journal of Real Estate Finance and Economics, 13(2), Bay, C. (2011). Moody s Takes a Closer Look at the Dynamics of Mortgage Default, DSNews.com. Available at Capozza, D. R., and Thomson, T. A. (2006). Subprime Transitions: Lingering or Malingering in Default? The Journal of Real Estate Finance and Economics, 33(3), Chan, S., Gedal, M., Been, V., and Haughwout, A. (2010). The Role of Neighborhood Characteristics in Mortgage Default Risk: Evidence from New York City. Furman Center Working Paper. Cordell, L., Dynan, K., Lehnert, A., Liang, N., and Mauskopf, E. (2008). The Incentives of Mortgage Servicers: Myths and Realities. Finance and Economics Discussion Series, Working Paper No , Divisions of Research and Statistics and Monetary Affairs, Federal Reserve Board, Washington, D.C. Fitch Ratings (2011). U.S. RMBS Servicers Loss Mitigation and Modification Efforts Update III. Fitch Ratings Structured Finance U.S. Residential Mortgage Special Report. Foote, C., Gerardi, K., Goette, L., and Willen, P. (2009). Reducing Foreclosures: No Easy Answers. National Bureau of Economic Research, Working Paper No Harding, J.P., Rosenblath, E., and Yao, V.W. (2009). The contagion effect of foreclosed properties. Journal of Urban Economics, 66, Immergluck, D. and Smith, G. (2006). The Impact of Single-Family Mortgage Foreclosures on Neighborhood Crime. Housing Studies, 21(6), Kingsley, G. T., Smith, R., and Price, D. (2009). The Impacts of Foreclosures on Families and Communities. The Urban Institute. Mason, J. R. (2007). Mortgage Loan Modification: Promises and Pitfalls. Available at 36
37 SSRN: Pennington-Cross, A. (2006). The Duration of Foreclosures in the Subprime Mortgage Market: A Competing Risks Model with Mixing. Federal Research Bank of St. Louis Working Paper No A, April Pennington-Cross, A. and Ho, G. (2010) The Termination of Subprime Hybrid and Fixed-Rate Mortgages. Real Estate Economics 38(3), Piskorski, T., Seru, A., and Vig, V. (2009). Securitization and Distressed Loan Renegotiation: Evidence from the Subprime Mortgage Crisis. Chicago Booth School of Business, Research Paper No Schuetz, J., Been, V., and Ellen, I. G. (2008). Neighborhood Effects of Concentrated Mortgage Foreclosures. Journal of Housing Economics, 17(4), Schloemer, E., Li, W., Ernst, K., and Keest, K. (2006). Losing Ground: Foreclosures in the Subprime Market and Their Cost to Homeowners. The Center for Responsible Lending. pdf U.S. Department of Treasury. (2008). OCC Mortgage Metrics Report, October 2007 March U.S. Department of Treasury. (2009a). Homeowner Affordability and Stability Plan. Press Release, February 18, U.S. Department of Treasury. (2009b). Making Home Affordable. Press Release, March 4, U.S. Department of Treasury. (2010a). OCC and OTS Mortgage Metrics Report, Fourth Quarter U.S. Department of Treasury. (2010b). OCC and OTS Mortgage Metrics Report, Second Quarter Voicu, I., Jacob, M., Rengert, K., and Fang, I Subprime Loan Default Resolutions: Do They Vary across Mortgage Products and Borrower Demographic Groups? The Journal of Real Estate Finance and Economics, forthcoming. 37
38 Appendix Evolution of Loan Modification Policies August 2007: The Bush Administration announces the FHASecure refinancing program for borrowers delinquent on their adjustable rate mortgages or current on fixed or adjustable rate mortgages. The program offered borrowers the option to refinance into a tradition, fixed rate, FHA guaranteed loan. The program required proof of a dependable income and the ability to make future mortgage payments. FHASecure was ended in December 2008 and only refinanced about 4,000 loans. October 10 th, 2007: the US Treasury Department and the U.S. Department of Housing and Urban Development (HUD) announces the HOPE NOW initiative to help homeowners avoid foreclosure. HOPE NOW consists of mortgage servicers, mortgage insurers, GSEs, non-profits, mortgage-related trade associations and mortgage counselors, and seeks to coordinate the efforts of those organizations to keep homeowners in their homes. HOPE NOW helps distressed homeowners to communicate with their servicers in order to negotiate home modifications. July, 2008: Congress authorizes the Federal Housing Administration (FHA) under the Housing and Economic Recovery Act (HERA) to insure up to $300 billion in loans through a new program, HOPE for Homeowners. This program required existing lenders to accept as payment in full of the original first lien mortgage an amount equal to no more than 90 percent of the current appraised value of the property (87 percent after payment of the upfront premium to 38
39 FHA) a substantial principal write-down in many cases. Hope for Homeowners was voluntary for both borrowers and lenders, and resulted in very few modifications. November 11 th, 2008: The Federal Housing Finance Agency announces a new streamlined loan modification program, modeled largely on the FDIC s IndyMac protocol (IndyMac was a mortgage company taken over by the FDIC). The program encourages servicers to restructure loans for eligible borrowers so that monthly mortgage payments are no more than 38% of a borrower s monthly gross income. Servicers can reduce monthly mortgage payments by lowering the interest rate, extending the life of the loan, deferring the payment of some of the principal, or a mix of these actions. Eligible loans include Fannie Mae and Freddie Mac loans along with portfolio loans by participating servicers. Borrowers under this program must be at least 90 days delinquent, owe more than 90% of the value of their homes, must have not filed for bankruptcy, and must certify that they are suffering some sort of economic hardship. Servicers are awarded $800 by the government for each loan that they modify. February 18 th, 2009: The Obama administration announces the Homeowner Affordability and Stability Plan, which includes a plan to help financially distressed homeowners. Two weeks later, the details of this plan, the Making Home Affordable (MHA) plan, are announced. MHA has many components, including the Home Affordable Refinance Program (HARP), the Home Affordable Unemployment Program (UP), the Second Lien Modification Program (2MP), and the Home Affordable Foreclosure Alternatives Program (HAFA). The key component of MHA regarding loan modifications, however, is the Home Affordable Modification Program (HAMP).. HAMP provides a streamlined structure for modifications and financial incentives for servicers 39
40 to modify loans. The program requires that servicers reduce monthly payments to 38% of gross monthly income, after which Treasury will match the servicer dollar-for-dollar for the cost of further reducing the monthly payment to 31% of gross income. Servicers also receive an upfront payment of $1,000 for each modification, and a further $1,000 per year for three years if the borrower remains in the HAMP program. In order to receive a modification under HAMP, a borrower must meet the following conditions: (1) the property must be owner-occupied and the borrower s primary residence, (2) the property must be a single-family property with a maximum unpaid principal balance of s $729,750 or less, (3) the loan must have originated on Jan. 1, 2009 or before, and (4) the monthly payment must be more than 31% of the homeowner s gross monthly income. If a borrower is eligible, a servicer will adjust the monthly mortgage payment to 31% of a borrower s total monthly income by first reducing the interest rate to as low as 2%, then if necessary, extending the loan term to 40 years, and finally, if necessary, forbearing a portion of the principal until the loan is paid off and waiving interest on the deferred amount. If these conditions are met, a servicer will then apply a Net Present Value (NPV) test to determine whether the value of the loan to the investor will be greater if the loan is modified ( The incentives provided by HAMP will be included in this figure. If the modified loan is worth more than the loan without the modification, the servicer is required to provide the modification on a (usually three month) trial basis ( If the modified loan is not worth more than the loan in its original state, it is at the servicer s discretion whether to modify the loan. 40
41 The purpose of the trial period is to provide immediate relief for the borrower while providing a check that the modification is sustainable for the borrower and that the borrower indeed meets the qualification requirement of HAMP. If the borrower makes timely payments for the duration of the trial period and no problems are found with the borrower s financial information, the servicer will execute a permanent modification. The modified rate will remain constant for the first five years, and then can only increase 1% until it reaches whatever the market rate was at the time the modification was set. As a part of the Helping Families Save Their Homes Act of 2009, HAMP also now covers FHA loans under a sub-program, FHA-HAMP, which combines a loan modification with a partial claim, which is a one-time loan offered only in conjunction with FHA loans to help borrowers get current on their loans by repaying past due interest and escrow. Like the rest of HAMP, FHA-HAMP covers homeowners in default as well as homeowners facing imminent default, and requires a three-month trial period. May 20 th, 2009: President Obama signs the Helping Families Save Their Homes Act of The act was originally intended to allow bankruptcy judges to modify the principals of mortgages in bankruptcy courts, but that provision was eliminated from the bill before passage by Congress. The legislation increases legal protections for servicers against lawsuits by investors, and it allows FHA lenders to make more significant modifications for FHA loans. 41
42 Table 1. Descriptive Statistics A. Outcomes of Seriously Delinquent Loans Outcome % of all loans Cure 15.0 Modification 9.4 Other Workout Repayment Plan FHA Partial Claim Forbearance Plan Other Reaged/Deferred/Extended 0.2 Liquidation 5.6 Delinquency Continues 61.5 B. Loan Characteristics Variable Mean Credit Class Prime Non-Prime (missing credit class indicator) Product Description FRM ARM 2/ ARM 3/ ARM (other) Other ARM * Margin at Origination (ARM * missing margin at origination indicator) Interest Only at Origination (missing interest only indicator) Full Documentation (missing full documentation indicator) Product Group Government (FHA, VA) Conventional with PMI Conventional Other Loan Purpose Home Purchase Refinance Home Improvement (missing loan purpose indicator) Relative interest rate at origination (FRMs): 3 < >
43 (missing interest rate indicator) Relative interest rate at origination (ARMs): 2 < > (missing interest rate indicator) Debt-to-income at origination <45% % >50% (missing DTI indicator) Investor type Private Investor GSE Held in Portfolio (missing investor type indicator) Percentage of outstanding loans in neighborhood serviced by the servicer log (Current Unpaid Balance) Number of months post-adjustment (ARMs): 2 before 1st adjust or no adjust > Loan Age (months) Default Time (months) Current LTV Mean <80% % % >120% (missing LTV indicator) LTV increase between origination and current month 4, (missing LTV increase indicator) Has a Junior Lien on the Property Number of Loans 29,366 Number of Loan-Months 258,326 C. Borrower and Property Characteristics Variable Mean Owner Occupier Property Type Single Family or Condo Family Family Borrower Race/Ethnicity Non-Hispanic Black Non-Hispanic Asian 0.085
44 Non-Hispanic Other Non-Hispanic White Hispanic (missing race/ethnicity indicator) Received Foreclosure Counseling Current FICO Score 4 Mean < > (missing FICO score indicator) FICO Score decline between origination and current month (missing FICO Score decline indicator) Number of Loans 29,366 Number of Loan-Months 258,326 D. Neighborhood Characteristics Estimation Sample NYC (4 boroughs) Variable Mean Mean Neighborhood Racial Composition % Non-Hispanic Black <20% % % % >80% % Hispanic <20% % >40% % Non-Hispanic Asian <20% % >40% Other Neighborhood Characteristics % Foreign Born <20% % % >60% % >65 Years Old <10% % >20% % of households with Children <25% %
45 >=50% Median Household Income (1999) <$20, $20,000-40, $40,000-60, >$60, % of adults with a Bachelor's degree or higher <20% % % >60% Homeownership Rate <20% % % >60% Origination Year Borough Manhattan Bronx Brooklyn Queens Quarter of Loan Performance Crime Rate Change in Unemployment Rate Recent Foreclosure Rate <1% % % >3% Positive HP Appreciation HP Appreciation Number of Loans 29,366 Number of Loan-Months 258,326
46 E. Servicer Characteristics: Mean FICO and LTV at Origination 4 Servicer FICO LTV Notes Statistics based on the loan-month-level sample are represented with gray shading. The other statistics are based on the loan-level sample. 1) The mean is computed using only the ARMs with non-missing margin 2) The means are computed using only the ARMs 3) The means are computed using only the FRMs 4) The mean is computed using only non-missing values 5) This variable and its missing value indicator are not included in regressions due to high correlation with the house price appreciation. 6) Although this variable varies with the loan-month, the mean is computed at the loan level and thus represents the share of borrowers who received counseling before the default resolution occurred (or before the end of the study period if no resolution was reached).
47 Table 2. Characteristics of Loans Modified Before and After Becoming 60+DPD Modified Before Becoming 60+ DPD Modified After Becoming 60+ DPD (used in our analysis) Variable Mean Mean Absolute Difference in Means N Relative interest rate at origination (FRMs): 1 < > (missing interest rate indicator) Relative interest rate at origination (ARMs): 2 < > (missing interest rate indicator) Investor type Private Investor GSE Held in Portfolio (missing investor type indicator) Product Group Government (FHA, VA) Conventional with PMI Conventional Other Product Description Fixed ARM 2/ ARM 3/ ARM (other) Other ARM * Margin at Origination (ARM * missing margin at origination indicat Interest Only at Origination (missing interest only indicator) Full Documentation (missing full documentation indicator) Credit Class Prime Non-Prime (missing credit class indicator) Notes: 1) The means are computed using only the FRMs 2) The means are computed using only the ARMs 3) The mean is computed using only the ARMs with non-missing margin
48 Table 3. Multinomial Logistic Regression Results for Determinants of Outcomes (Odds Ratio Estimates) Odds Ratio 1 Variable Cure Modification Other Workout Liquidation Credit Class Non-Prime *** (missing credit class indicator) 0.703*** 0.781** 0.692*** 1.639*** Product Description [REF: FRM] ARM 2/ *** 0.220*** ARM 3/ ** 0.246*** 1.476** ARM (other) *** 1.426** Other *** ARM * Margin at Origination (ARM * missing margin at origination indicator) 0.706*** 0.821* 0.691*** 1.293** Interest Only at Origination 0.868** 0.674*** (missing interest only indicator) 0.814** * Full Documentation 1.241*** 1.229*** (missing full documentation indicator) 1.772*** *** Product Group [REF: Conventional] Government (FHA, VA) Conventional with PMI Other ** Loan Purpose [REF: Home Improvement] Home Purchase Refinance * (missing loan purpose indicator) Relative interest rate at origination (FRMs) [REF: <0] *** 0.363*** *** 0.310*** 0.809** *** 0.360*** 0.424*** 2.400*** > *** 0.216*** 0.188** (missing interest rate indicator) 0.744*** 0.309*** 0.745*** Relative interest rate at origination (ARMs) [REF: <0] *** 0.667*** ** *** * 1.314* 0.393*** > * *** 1.03 (missing interest rate indicator) *** Number of months post-adjustment (ARMs) [REF: <0] * * *** > *** ** Debt-to-income at origination [REF: <45%] 45-50% *** * >50% (missing DTI indicator) *** 0.829** 1.343*** Investor type [REF: Private Investor] GSE 1.111** 0.672*** 2.003*** 0.712*** Held in Portfolio *** 1.710*** (missing investor type indicator) ** 1.242*** 5.893*** Current LTV [REF: <80%] % 0.712*** 1.578*** % 0.621*** 2.182*** >120% 0.623*** 2.668*** (missing LTV indicator) 0.779*** 1.461*** 2.035*** 3.297*** Has a Junior Lien on the Property 0.860*** 0.863*** log (Current Unpaid Balance) 0.526*** 1.119*
49 Loan Age 1.011** 1.017*** ** Default Time 0.843*** 0.986*** 0.913*** 1.183*** Percentage of outstanding loans in neighborhood serviced by the servicer 2.090* Borrower and Property Characteristics Owner Occupier *** 1.302*** 0.807*** Property Type [REF: Single Fam & Condo] 2-4 Family *** Family ** Current FICO Score [REF: <560] *** 0.757*** 1.272*** * 0.568*** 0.685*** 1.254* ** 0.502*** 0.517*** *** 0.653*** > ** 0.476*** 0.716** (missing FICO score) 1.337*** 0.576*** 0.663** 5.192*** FICO Score decline between origination and delinquency 0.997*** 0.996*** 0.998*** 1.002*** (missing FICO Score decline indicator) 0.688*** 0.709*** 0.683*** 0.717** Borrower Race/Ethnicity [REF: Non-Hispanic White] Non-Hispanic Black Non-Hispanic Asian * Non-Hispanic Other 0.743* ** Hispanic 0.775*** * (missing race/ethnicity) Received Foreclosure Counseling 0.480*** *** Neighborhood Characteristics Recent Foreclosure Rate [REF: <1] 1-2% 0.820*** 0.850*** % 0.735*** 0.857** >3% 0.699*** 0.762*** 0.867* Positive HP Appreciation Positive HP Appreciation * HP Appreciation * Negative HP Appreciation * HP Appreciation *** * Neighborhood Racial Composition [REF: 0-20%] % Non-Hispanic Black 20-40% % * 60-80% *** ** >80% *** *** % Hispanic 20-40% 0.887** ** >40% ** ** % Non-Hispanic Asian 20-40% >40% % Foreign Born [REF: 0-20%] 20-40% % * >60% * % >65 Years Old [REF: 0-10%] 10-20% >20% * % of households with Children [REF: 0-25%] 25-50% 0.890* 0.781*** >=50% 0.829* 0.743** Median Household Income (1999) [REF: 0-$20,000] $20,000-40, **
50 $40,000-60, *** >$60, ** ** % of adults with a Bachelor's degree or higher [REF: 0-20%] 20-40% 1.110** % 1.293*** >60% ** * Homeownership Rate [REF: 0-20%] 20-40% * % 0.839*** >60% ** Crime Rate 1.761** 1.975*** Change in Unemployment Rate * Origination year [REF: 2004] *** * Borough [REF: Manhattan] Bronx 0.658*** Brooklyn 0.691*** Queens 0.588*** *** Quarter of Loan Performance [REF: ] ** 1.695*** 1.481*** 1.406** ** 1.575*** * * * 1.774*** *** * *** * *** ** Servicer fixed effects included Psuedo-R N 258,326 Notes: 1) The reference outcome for the odds ratio computation is "Delinquency Continues" *** denotes results that are statistically significant at the 1 percent level ** denotes results that are statistically significant at the 5 percentlevel * denotes results that are statistically significant at the 10 percent level
51 Table 4. Sensitivity Analyses without Counseling, Individual Race, Junior Lien, Baseline Model without Counseling, Individual Race, Junior Lien Neigborhood Foreclosure Rate and HP Appreciation Odds Ratio 1 Odds Ratio 1 Odds Ratio 1 Variable Cure Modification Other Workout LiquidationCure Modification Other Workout LiquidationCure Modification Other Workout Liquidation Credit Class Non-Prime *** *** *** (missing credit class indicator) 0.703***0.781** 0.692*** 1.639*** 0.698*** 0.780** 0.689*** 1.634*** 0.689*** 0.774** 0.686*** 1.656*** Product Description [REF: FRM] ARM 2/ ***0.220*** *** 0.224*** *** 0.233*** ARM 3/ ** 0.246*** 1.476** ** 0.250*** 1.479** ** 0.262*** 1.491** ARM (other) *** 1.426** *** 1.422** *** 1.428** Other *** *** *** ARM * Margin at Origination (ARM * missing margin at origination indicator) 0.706***0.821* 0.691*** 1.293** 0.705*** 0.819* 0.693*** 1.298** 0.705*** 0.798** 0.692*** 1.306** Interest Only at Origination 0.868** 0.674*** *** 0.670*** *** 0.674*** (missing interest only indicator) 0.814** * * * Full Documentation 1.241***1.229*** *** 1.238*** *** 1.238*** (missing full documentation indicator) 1.772*** *** *** *** *** *** Product Group [REF: Conventional] Government (FHA, VA) * Conventional with PMI * *** Other ** ** ** Loan Purpose [REF: Home Improvement] Home Purchase Refinance * * * (missing loan purpose indicator) * * Relative interest rate at origination (FRMs) [REF: <0] ***0.363*** *** 0.364*** *** 0.369*** ***0.310*** 0.809** *** 0.312*** 0.806** *** 0.320*** 0.808** ***0.360*** 0.424*** 2.400*** 0.503*** 0.362*** 0.425*** 2.410*** 0.499*** 0.374*** 0.426*** 2.416*** > ***0.216*** 0.188** *** 0.216*** 0.187** *** 0.220*** 0.189** (missing interest rate indicator) 0.744***0.309*** 0.745*** *** 0.311*** 0.742*** *** 0.315*** 0.745*** Relative interest rate at origination (ARMs) [REF: <0] *** 0.667*** *** 0.666*** *** 0.664*** ** *** ** *** ** *** * 1.314* 0.393*** * 1.319* 0.396*** * 1.311* 0.399*** > * *** * *** * *** (missing interest rate indicator) *** *** *** Number of months post-adjustment (ARMs) [REF: <0] * * * * * * *** *** *** > *** ** *** ** *** ** Debt-to-income at origination [REF: <45%] 45-50% *** * *** * *** * >50% (missing DTI indicator) *** 0.829** 1.343*** 1.082* 1.228*** 0.834** 1.352*** 1.083* 1.230*** 0.833** 1.354*** Investor type [REF: Private Investor]
52 GSE 1.111** 0.672*** 2.003*** 0.712*** 1.115** 0.672*** 2.005*** 0.711*** 1.115** 0.667*** 2.004*** 0.710*** Held in Portfolio *** 1.710*** *** 1.718*** *** 1.721*** 1.03 (missing investor type indicator) ** 1.242*** 5.893*** ** 1.238** 5.880*** * 1.240*** 5.864*** Current LTV [REF: <80%] % 0.712***1.578*** *** 1.569*** *** 1.415*** % 0.621***2.182*** *** 2.187*** *** 1.707*** >120% 0.623***2.668*** *** 2.681*** *** 1.781*** (missing LTV indicator) 0.779***1.461*** 2.035*** 3.297*** 0.777*** 1.456*** 2.032*** 3.300*** 0.777*** 1.319*** 1.981*** 3.260*** Has a Junior Lien on the Property 0.860***0.863*** log (Current Unpaid Balance) 0.526***1.119* *** * *** 1.168** Loan Age 1.011** 1.017*** ** 1.010** 1.016** ** 1.009* 1.020*** ** Default Time 0.843***0.986*** 0.913*** 1.183*** 0.843*** 0.986*** 0.913*** 1.183*** 0.842*** 0.985*** 0.912*** 1.183*** Percentage of outstanding loans in neighborhood serviced by 2.090* * * the servicer Borrower and Property Characteristics Owner Occupier *** 1.302*** 0.807*** 0.902* 1.237*** 1.304*** 0.810*** 0.900* 1.252*** 1.308*** 0.809*** Property Type [REF: Single Fam & Condo] 2-4 Family *** *** * 0.848*** Family ** ** ** Current FICO Score [REF: <560] *** 0.757*** 1.272*** *** 0.757*** 1.264*** *** 0.756*** 1.266*** * 0.568*** 0.685*** 1.254* 1.121* 0.566*** 0.687*** 1.241* 1.121* 0.570*** 0.687*** 1.245* ** 0.502*** 0.517*** ** 0.497*** 0.514*** ** 0.503*** 0.514*** *** 0.653*** *** 0.651*** *** 0.650*** > ** 0.476*** 0.716** * 0.471*** 0.714** * 0.479*** 0.714** (missing FICO score) 1.337***0.576*** 0.663** 5.192*** 1.333*** 0.574*** 0.663** 5.188*** 1.324*** 0.579*** 0.661** 5.158*** FICO Score decline between origination and delinquency 0.997***0.996*** 0.998*** 1.002*** 0.997*** 0.996*** 0.998*** 1.002*** 0.997*** 0.996*** 0.998*** 1.002*** (missing FICO Score decline indicator) 0.688***0.709*** 0.683*** 0.717** 0.682*** 0.704*** 0.679*** 0.711** 0.680*** 0.704*** 0.678*** 0.718** Borrower Race/Ethnicity [REF: Non-Hispanic White] Non-Hispanic Black Non-Hispanic Asian * Non-Hispanic Other 0.743* ** Hispanic 0.775*** * (missing race/ethnicity) Received Foreclosure Counseling 0.480*** *** Neighborhood Characteristics Recent Foreclosure Rate [REF: <1] 1-2% 0.820***0.850*** *** 0.848*** % 0.735***0.857** *** 0.854** >3% 0.699***0.762*** 0.867* *** 0.759*** 0.871* Positive HP Appreciation Positive HP Appreciation * HP Appreciation * * Negative HP Appreciation * HP Appreciation *** * *** * Neighborhood Racial Composition [REF: 0-20%] % Non-Hispanic Black 20-40% * **
53 40-60% * * 0.860** * 60-80% *** ** *** ** 0.810*** 1.260*** ** >80% *** *** *** *** 0.830*** *** % Hispanic 20-40% 0.887** ** 0.869** ** 0.852*** * >40% ** ** ** ** 0.840** ** % Non-Hispanic Asian 20-40% * >40% * % Foreign Born [REF: 0-20%] 20-40% % * >60% * * * % >65 Years Old [REF: 0-10%] 10-20% >20% * * * % of households with Children [REF: 0-25%] 25-50% 0.890* 0.781*** * 0.779*** ** 0.763*** >=50% 0.829* 0.743** ** 0.741** ** 0.702*** Median Household Income (1999) [REF: 0-$20,000] $20,000-40, ** ** ** $40,000-60, *** *** *** >$60, ** ** ** ** *** ** % of adults with a Bachelor's degree or higher [REF: 0-20%] 20-40% 1.110** ** *** 1.101* % 1.293*** *** *** >60% ** * ** * ** * Homeownership Rate [REF: 0-20%] 20-40% * * * % 0.839*** *** *** >60% ** ** ** Crime Rate 1.761** 1.975*** *** 1.995*** ** 1.873** Change in Unemployment Rate * * * Origination year [REF: 2004] *** * ** * ** Borough [REF: Manhattan] Bronx 0.658*** *** *** Brooklyn 0.691*** *** *** Queens 0.588*** *** 0.575*** *** 0.536*** ** Quarter of Loan Performance [REF: ] ** 1.695*** 1.481*** 1.406** 1.155** 1.701*** 1.481*** 1.408** 1.161** 1.630*** 1.463*** 1.394** ** 1.575*** ** 1.585*** ** 1.441*** * * ** * ** * 1.774*** * 1.797*** * *** * *** * 0.619*** * 0.696*** * *** * *** * *** 0.725* 1.405* 0.641
54 *** ** 0.511*** ** 0.534*** ** Servicer fixed effects included Psuedo-R N 258, , ,326 Notes: 1) The reference outcome for the odds ratio computation is "Delinquency Continues" The grey shading and bold font indicate estimates with more important differences in statistical signficance relative to the estimates from the preceding panel (i.e., either significant vs. not significant or significant at 10% level vs 1% or 5% level) *** denotes results that are statistically significant at the 1 percent level ** denotes results that are statistically significant at the 5 percentlevel * denotes results that are statistically significant at the 10 percent level

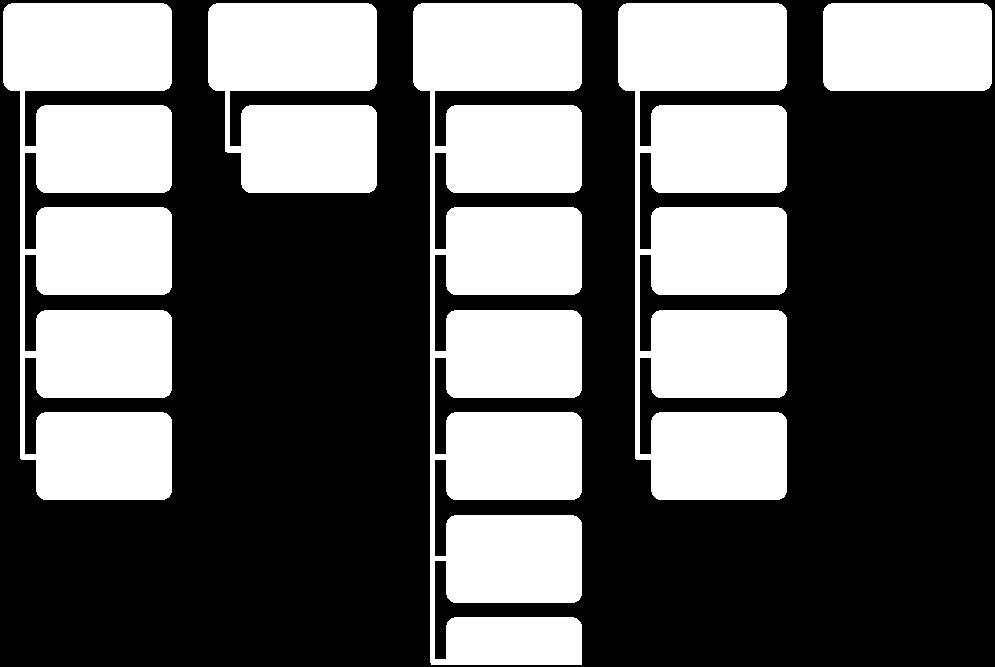
55 Figure 1: Outcome Categories
Performance of HAMP Versus Non-HAMP Loan Modifications Evidence from New York City
 NELLCO NELLCO Legal Scholarship Repository New York University Law and Economics Working Papers New York University School of Law 1-1-2012 Performance of HAMP Versus Non-HAMP Loan Modifications Evidence
Pathways after Default: What Happens to Distressed Mortgage Borrowers and Their Homes?
 NELLCO NELLCO Legal Scholarship Repository New York University Law and Economics Working Papers New York University School of Law 10-1-2011 Pathways after Default: What Happens to Distressed Mortgage Borrowers
The Foreclosure Crisis in NYC: Patterns, Origins, and Solutions. Ingrid Gould Ellen
 The Foreclosure Crisis in NYC: Patterns, Origins, and Solutions Ingrid Gould Ellen Reasons for Rise in Foreclosures Risky underwriting Over-leveraged borrowers High debt to income ratios Economic downturn
Homeowner Affordability and Stability Plan Fact Sheet
 Homeowner Affordability and Stability Plan Fact Sheet The deep contraction in the economy and in the housing market has created devastating consequences for homeowners and communities throughout the country.
Supplementary Results for Geographic Variation in Subprime Loan Features, Foreclosures and Prepayments. Morgan J. Rose. March 2011
 Supplementary Results for Geographic Variation in Subprime Loan Features, Foreclosures and Prepayments Morgan J. Rose Office of the Comptroller of the Currency 250 E Street, SW Washington, DC 20219 University
Statement of Donald Bisenius Executive Vice President Single Family Credit Guarantee Business Freddie Mac
 Statement of Donald Bisenius Executive Vice President Single Family Credit Guarantee Business Freddie Mac Hearing of the U.S. Senate Committee on Banking, Housing and Urban Affairs Chairman Dodd, Ranking
A Nation of Renters? Promoting Homeownership Post-Crisis. Roberto G. Quercia Kevin A. Park
 A Nation of Renters? Promoting Homeownership Post-Crisis Roberto G. Quercia Kevin A. Park 2 Outline of Presentation Why homeownership? The scale of the foreclosure crisis today (20112Q) Mississippi and
Fannie Mae Reports Net Income of $5.1 Billion for Second Quarter 2012
 Contact: Pete Bakel Resource Center: 1-800-732-6643 202-752-2034 Date: August 8, 2012 Fannie Mae Reports Net Income of $5.1 Billion for Second Quarter 2012 Net Income of $7.8 Billion for First Half 2012
The High Cost of Segregation: Exploring the Relationship Between Racial Segregation and Subprime Lending
 F u r m a n C e n t e r f o r r e a l e s t a t e & u r b a n p o l i c y N e w Y o r k U n i v e r s i t y s c h o o l o f l aw wa g n e r s c h o o l o f p u b l i c s e r v i c e n o v e m b e r 2 0
LISC Building Sustainable Communities Initiative Neighborhood Quality Monitoring Report
 LISC Building Sustainable Communities Initiative Neighborhood Quality Monitoring Report Neighborhood:, Kansas City, MO The LISC Building Sustainable Communities (BSC) Initiative supports community efforts
Loan Modifications and Redefault Risk An Examination of Short-term Impacts
 Loan Modifications and Redefault Risk An Examination of Short-term Impacts Roberto G. Quercia, Lei Ding, and Janneke Ratcliffe * Abstract One promising strategy to stem the flood of home foreclosure is
Memorandum. Sizing Total Exposure to Subprime and Alt-A Loans in U.S. First Mortgage Market as of
 Memorandum Sizing Total Exposure to Subprime and Alt-A Loans in U.S. First Mortgage Market as of 6.30.08 Edward Pinto Consultant to mortgage-finance industry and chief credit officer at Fannie Mae in the
A look Behind the numbers Winter Behind the numbers. A Look. Distressed Loans in Ohio:
 A look Behind the numbers Winter 2013 Published By The Federal Reserve Bank of Cleveland Behind the numbers A Look written by Lisa Nelson and Francisca G.-C. Richter 9 147 3 Distressed Loans in Ohio: Recent
Federal Reserve Bank of Chicago
 Federal Reserve Bank of Chicago The Role of Securitization in Mortgage Renegotiation Sumit Agarwal, Gene Amromin, Itzhak Ben-David, Souphala Chomsisengphet, and Douglas D. Evanoff WP 2011-02 The Role of
First wave: Driven by loan terms & home values. Second wave: Driven by unemployment. Various local, state and federal responses
 Sustainable Loan Modifications June 2009 J. Michael Collins Introduction Foreclosures at record levels First wave: Driven by loan terms & home values» Concentration in sand states and LMI communities (but
ONLINE APPENDIX. The Vulnerability of Minority Homeowners in the Housing Boom and Bust. Patrick Bayer Fernando Ferreira Stephen L Ross
 ONLINE APPENDIX The Vulnerability of Minority Homeowners in the Housing Boom and Bust Patrick Bayer Fernando Ferreira Stephen L Ross Appendix A: Supplementary Tables for The Vulnerability of Minority Homeowners
OCC and OTS Mortgage Metrics Report Disclosure of National Bank and Federal Thrift Mortgage Loan Data
 OCC and OTS Mortgage Metrics Report Disclosure of National Bank and Federal Thrift Mortgage Loan Data January June 2008 Office of the Comptroller of the Currency Office of Thrift Supervision Washington,
Comments on Understanding the Subprime Mortgage Crisis Chris Mayer
 Comments on Understanding the Subprime Mortgage Crisis Chris Mayer (Visiting Scholar, Federal Reserve Board and NY Fed; Columbia Business School; & NBER) Discussion Summarize results and provide commentary
during the Financial Crisis
 Minority borrowers, Subprime lending and Foreclosures during the Financial Crisis Stephen L Ross University of Connecticut The work presented is joint with Patrick Bayer, Fernando Ferreira and/or Yuan
Foreclosure Delay and Consumer Credit Performance
 Foreclosure Delay and Consumer Credit Performance May 10, 2013 Paul Calem, Julapa Jagtiani & William W. Lang Federal Reserve Bank of Philadelphia The views expressed are those of the authors and do not
One Industry s Risk is Another Community s Loss: The Impact of Clustered Mortgage Foreclosures on Neighborhood Property Values in Philadelphia
 One Industry s Risk is Another Community s Loss: The Impact of Clustered Mortgage Foreclosures on Neighborhood Property Values in Philadelphia Presentation before the Federal Reserve Bank of Philadelphia
The Obama Administration s Efforts To Stabilize The Housing Market and Help American Homeowners
 The Obama Administration s Efforts To Stabilize The Housing Market and Help American Homeowners May 2011 U.S. Department of Housing and Urban Development Office of Policy Development Research U.S Department
An Empirical Study on Default Factors for US Sub-prime Residential Loans
 An Empirical Study on Default Factors for US Sub-prime Residential Loans Kai-Jiun Chang, Ph.D. Candidate, National Taiwan University, Taiwan ABSTRACT This research aims to identify the loan characteristics
The Obama Administration s Efforts To Stabilize The Housing Market and Help American Homeowners
 The Obama Administration s Efforts To Stabilize The Housing Market and Help American Homeowners April 2012 U.S. Department of Housing and Urban Development Office of Policy Development Research U.S Department
Fannie Mae Reports Third-Quarter 2011 Results
 Contact: Number: Katherine Constantinou 202-752-5403 5552a Resource Center: 1-800-732-6643 Date: November 8, 2011 Fannie Mae Reports Third-Quarter 2011 Results Company Focused on Providing Liquidity to
The Untold Costs of Subprime Lending: Communities of Color in California. Carolina Reid. Federal Reserve Bank of San Francisco.
 The Untold Costs of Subprime Lending: The Impacts of Foreclosure on Communities of Color in California Carolina Reid Federal Reserve Bank of San Francisco April 10, 2009 The views expressed herein are
Did Affordable Housing Legislation Contribute to the Subprime Securities Boom?
 Did Affordable Housing Legislation Contribute to the Subprime Securities Boom? Andra C. Ghent (Arizona State University) Rubén Hernández-Murillo (FRB St. Louis) and Michael T. Owyang (FRB St. Louis) Government
Ben S Bernanke: Reducing preventable mortgage foreclosures
 Ben S Bernanke: Reducing preventable mortgage foreclosures Speech of Mr Ben S Bernanke, Chairman of the Board of Governors of the US Federal Reserve System, at the Independent Community Bankers of America
Fannie Mae Reports Third-Quarter 2010 Results
 Resource Center: 1-800-732-6643 Contacts: Number: Todd Davenport 202-752-5115 5214a Date: November 5, 2010 Fannie Mae Reports Third-Quarter 2010 Results Net Loss of $1.3 Billion Reflects Stabilizing Credit-Related
1. Modification algorithm
 Internet Appendix for: "The Effect of Mortgage Securitization on Foreclosure and Modification" 1. Modification algorithm The LPS data set lacks an explicit modification flag but contains enough detailed
Fannie Mae Reports Net Income of $10.1 Billion and Comprehensive Income of $10.3 Billion for Second Quarter 2013
 Resource Center: 1-800-732-6643 Contact: Pete Bakel 202-752-2034 Date: August 8, 2013 Fannie Mae Reports Net Income of $10.1 Billion and Comprehensive Income of $10.3 Billion for Second Quarter 2013 Fannie
Fannie Mae Reports Net Income of $2.8 Billion and Comprehensive Income of $2.8 Billion for First Quarter 2017
 Resource Center: 1-800-232-6643 Contact: Date: Pete Bakel 202-752-2034 May 5, 2017 Fannie Mae Reports Net Income of 2.8 Billion and Comprehensive Income of 2.8 Billion for First Quarter 2017 Fannie Mae
National Housing Market Summary
 1st 2017 June 2017 HUD PD&R National Housing Market Summary The Housing Market Recovery Showed Progress in the First The housing market improved in the first quarter of 2017. Construction starts rose for
National Foreclosure Mitigation Counseling Program Evaluation. Final Report, Rounds 3 Through 5
 National Foreclosure Mitigation Counseling Program Evaluation Final Report, Rounds 3 Through 5 Prepared by Kenneth M. Temkin Neil S. Mayer Charles A. Calhoun Peter A. Tatian with Taz George Prepared for
The subprime lending boom increased the ability of many Americans to get
 ANDREW HAUGHWOUT Federal Reserve Bank of New York CHRISTOPHER MAYER Columbia Business School National Bureau of Economic Research Federal Reserve Bank of New York JOSEPH TRACY Federal Reserve Bank of New
Fannie Mae Reports Net Income of $2.0 Billion and Comprehensive Income of $2.2 Billion for Third Quarter 2015
 Resource Center: 1-800-732-6643 Contact: Date: Pete Bakel 202-752-2034 November 5, 2015 Fannie Mae Reports Net Income of 2.0 Billion and Comprehensive Income of 2.2 Billion for Third Quarter 2015 Fannie
Strategic Default, Loan Modification and Foreclosure
 Strategic Default, Loan Modification and Foreclosure Ben Klopack and Nicola Pierri January 17, 2017 Abstract We study borrower strategic default in the residential mortgage market. We exploit a discontinuity
Federal Reserve Bank of Chicago
 Federal Reserve Bank of Chicago Market-Based Loss Mitigation Practices for Troubled Mortgages Following the Financial Crisis Sumit Agarwal, Gene Amromin, Itzhak Ben-David, Souphala Chomsisengphet, and
Workout Hierarchy for Fannie Mae Conventional Loans NOTE: Refer to the Fannie Mae Servicing Guide
 Workout Hierarchy for Fannie Mae Conventional Loans The following table is a summary of Fannie Mae workout options available to assist borrowers experiencing financial hardship. The servicer must first
Assumptions, Mistakes, Successes, and Moving Forward: An Empirical Analysis of Foreclosures in North Minneapolis and Foreclosure Policies
 Assumptions, Mistakes, Successes, and Moving Forward: An Empirical Analysis of Foreclosures in North Minneapolis and Foreclosure Policies CURA Housing Forum Friday, December 18, 2009 Thanks and Disclaimers
If ineligible for the HAMP, is the borrower experiencing a temporary or long-term hardship?
 Loan Workout Hierarchy For Fannie Mae Conventional Loans The following table identifies the Fannie Mae loss mitigation options that are available to assist borrowers experiencing financial hardship. The
Announcement December 8, Amends these Guides: Selling and Servicing
 Announcement 08-31 December 8, 2008 Amends these Guides: Selling and Servicing Fannie Mae 2009 Single-Family Master Trust Agreement, the Amended and Restated 2007 Single-Family Master Trust Agreement,
The Obama Administration s Efforts To Stabilize the Housing Market and Help American Homeowners
 The Obama Administration s Efforts To Stabilize the Housing Market and Help American Homeowners February 2015 U.S. Department of Housing and Urban Development Office of Policy Development and Research
Fannie Mae Reports Net Income of $4.6 Billion and Comprehensive Income of $4.4 Billion for Second Quarter 2015
 Resource Center: 1-800-732-6643 Contact: Date: Pete Bakel 202-752-2034 August 6, 2015 Fannie Mae Reports Net Income of 4.6 Billion and Comprehensive Income of 4.4 Billion for Second Quarter 2015 Fannie
Why is Non-Bank Lending Highest in Communities of Color?
 Why is Non-Bank Lending Highest in Communities of Color? An ANHD White Paper October 2017 New York is a city of renters, but nearly a third of New Yorkers own their own homes. The stock of 2-4 family homes
Executive Summary Chapter 1. Conceptual Overview and Study Design
 Executive Summary Chapter 1. Conceptual Overview and Study Design The benefits of homeownership to both individuals and society are well known. It is not surprising, then, that policymakers have adopted
Fannie Mae 2010 First Quarter Credit Supplement. May 10, 2010
 Fannie Mae 2010 First Quarter Credit Supplement May 10, 2010 1 These materials present tables and other information about Fannie Mae, including information contained in Fannie Mae s Quarterly Report on
The Obama Administration s Efforts To Stabilize the Housing Market and Help American Homeowners
 The Obama Administration s Efforts To Stabilize the Housing Market and Help American Homeowners August 2015 U.S. Department of Housing and Urban Development Office of Policy Development and Research U.S
Now What? Key Trends from the Mortgage Crisis and Implications for Policy
 THE FUTURE OF FAIR HOUSING and FAIR CREDIT Sponsored by: W. K. KELLOGG FOUNDATION Now What? Key Trends from the Mortgage Crisis and Implications for Policy DAN IMMERGLUCK School of City and Regional Planning,
RE: Servicer Compliance with Newly Enacted Statutory Changes to the New York State Mortgage Foreclosure Law / Chapter 507 of the Laws of 2009
 By E mail March 2, 2010 RE: Servicer Compliance with Newly Enacted Statutory Changes to the New York State Mortgage Foreclosure Law / Chapter 507 of the Laws of 2009 Dear SONYMA Servicer: On December 15,
Out of the Shadows: Projected Levels for Future REO Inventory
 ECONOMIC COMMENTARY Number 2010-14 October 19, 2010 Out of the Shadows: Projected Levels for Future REO Inventory Guhan Venkatu Nearly one homeowner in ten is more than 90 days delinquent on his mortgage
Testimony of Dean Baker. Before the Subcommittee on Housing and Community Opportunity of the House Financial Services Committee
 Testimony of Dean Baker Before the Subcommittee on Housing and Community Opportunity of the House Financial Services Committee Hearing on the Recently Announced Revisions to the Home Affordable Modification
Credit-Induced Boom and Bust
 Credit-Induced Boom and Bust Marco Di Maggio (Columbia) and Amir Kermani (UC Berkeley) 10th CSEF-IGIER Symposium on Economics and Institutions June 25, 2014 Prof. Marco Di Maggio 1 Motivation The Great
New Construction and Mortgage Default
 New Construction and Mortgage Default ASSA/AREUEA Conference January 6 th, 2019 Tom Mayock UNC Charlotte Office of the Comptroller of the Currency tmayock@uncc.edu Konstantinos Tzioumis ALBA Business School
A Look Behind the Numbers: FHA Lending in Ohio
 Page1 Recent news articles have carried the worrisome suggestion that Federal Housing Administration (FHA)-insured loans may be the next subprime. Given the high correlation between subprime lending and
Written for state Housing Finance Agencies (HFAs), this report furthers the work of the Innovations in Manufactured Homes (I M HOME) initiative s
, this report furthers the work of the Innovations in Manufactured Homes (I M HOME) initiative s") Written for state Housing Finance Agencies (HFAs), this report furthers the work of the Innovations in Manufactured Homes (I M HOME) initiative s explorations into manufactured home mortgage data. This
Written for state Housing Finance Agencies (HFAs), this report furthers the work of the Innovations in Manufactured Homes (I M HOME) initiative s explorations into manufactured home mortgage data. This
Freddie Mac Standard and Streamlined Modification Reference Guide. April 2015
 Freddie Mac Standard and Streamlined Modification Reference Guide April 2015 Table of Contents Introduction... 1 What is a Loan Modification?... 1 Freddie Mac Standard Modifications... 2 Ineligible Criteria
Mortgage Rates, Household Balance Sheets, and the Real Economy
 Mortgage Rates, Household Balance Sheets, and the Real Economy Ben Keys University of Chicago Harris Tomasz Piskorski Columbia Business School and NBER Amit Seru Chicago Booth and NBER Vincent Yao Fannie
The Obama Administration s Efforts To Stabilize The Housing Market and Help American Homeowners
 The Obama Administration s Efforts To Stabilize The Housing Market and Help American Homeowners November 2012 U.S. Department U.S Department of Housing of Housing and Urban and Urban Development Development
The Impact of Foreclosures on Economic Recovery in Virginia
 The Impact of Foreclosures on Economic Recovery in Virginia February, 2012 Brian Koziol Housing Policy and Research Analyst www.phonehome.org 804.354.0641 Where you live makes all the difference About
Loan Product Steering in Mortgage Markets
 Loan Product Steering in Mortgage Markets CFPB Research Conference Washington, DC December 16, 2016 Sumit Agarwal, Georgetown University Gene Amromin, Federal Reserve Bank of Chicago Itzhak Ben David,
Glossary. An item of value that you own.
 Term A adjustable-rate mortgage (ARM) amortization amortized annual percentage rate (APR) appraisal appreciation assessment fees asset association fees Definition A mortgage loan with an interest rate
National Foreclosure Mitigation Counseling Program
 National Foreclosure Mitigation Counseling Program National Foreclosure Mitigation Counseling Program Congressional Update Activity through January 31, 2010 Executive Summary NeighborWorks America (as
Fannie Mae Reports Net Income of $1.8 Billion for Third Quarter 2012
 Contact: Pete Bakel 202-752-2034 Date: November 7, 2012 Resource Center: 1-800-732-6643 Fannie Mae Reports Net Income of $1.8 Billion for Third Quarter 2012 Company Generates Net Income of $9.7 Billion
Fannie Mae 2009 Second Quarter Credit Supplement. August 6, 2009
 Fannie Mae 2009 Second Quarter Credit Supplement August 6, 2009 1 These materials present tables and other information about Fannie Mae, including information contained in Fannie Mae s Quarterly Report
Loan Workout Hierarchy for Fannie Mae Conventional Loans
 Loan Workout Hierarchy for Fannie Mae Conventional Loans The following table identifies the Fannie Mae loss mitigation options that are available to assist borrowers experiencing financial hardship. Generally,
Mortgage Rates, Household Balance Sheets, and Real Economy
 Mortgage Rates, Household Balance Sheets, and Real Economy May 2015 Ben Keys University of Chicago Harris Tomasz Piskorski Columbia Business School and NBER Amit Seru Chicago Booth and NBER Vincent Yao
Did Bankruptcy Reform Cause Mortgage Defaults to Rise? 1
 Did Bankruptcy Reform Cause Mortgage Defaults to Rise? 1 Wenli Li, Federal Reserve Bank of Philadelphia Michelle J. White, UC San Diego and NBER and Ning Zhu, University of California, Davis Original draft:
Working Papers. Redefault Risk in the Aftermath of the Mortgage Crisis: Why Did Modifications Improve More Than Self-Cures? WP November 2018
 Working Papers WP 18-26 November 2018 https://doi.org/10.21799/frbp.wp.2018.26 Redefault Risk in the Aftermath of the Mortgage Crisis: Why Did Modifications Improve More Than Self-Cures? Paul Calem Federal
Working Papers WP January 2018
 Working Papers WP 18-02 January 2018 https://doi.org/10.21799/frbp.wp.2018.02 Redefault Risk in the Aftermath of the Mortgage Crisis: Why Did Modifications Improve More Than Self-Cures? Paul Calem Federal
Impact of Information Asymmetry and Servicer Incentives on Foreclosure of Securitized Mortgages
 Impact of Information Asymmetry and Servicer Incentives on Foreclosure of Securitized Mortgages Dimuthu Ratnadiwakara March 2016 ABSTRACT In this paper I examine how servicer characteristics affect foreclosure
Fannie Mae Reports Fourth-Quarter and Full-Year 2008 Results
 Resource Center: 1-800-732-6643 Contact: Number: Brian Faith 202-752-6720 4624a Date: February 26, 2009 Fannie Mae Reports Fourth-Quarter and Full-Year 2008 Results Fourth-Quarter Loss of $25.2 Billion
6/18/2015. Residential Mortgage Types and Borrower Decisions. Role of the secondary market Mortgage types:
 Residential Mortgage Types and Borrower Decisions Role of the secondary market Mortgage types: Conventional mortgages FHA mortgages VA mortgages Home equity Loans Other Role of mortgage insurance Mortgage
Subprime Lending in Washington State
 sound research. Bold Solutions.. Policy BrieF. March 9, 2009 The High Cost of Subprime Lending in Washington State By Jeff Chapman Executive Summary In Washington State in 2006, African- American and Hispanic
Kim Manturuk American Sociological Association Social Psychological Approaches to the Study of Mental Health
 Linking Social Disorganization, Urban Homeownership, and Mental Health Kim Manturuk American Sociological Association Social Psychological Approaches to the Study of Mental Health 1 Preview of Findings
A Look at Tennessee Mortgage Activity: A one-state analysis of the Home Mortgage Disclosure Act (HMDA) Data
 Data") September, 2015 A Look at Tennessee Mortgage Activity: A one-state analysis of the Home Mortgage Disclosure Act (HMDA) Data 2004-2013 Hulya Arik, Ph.D. Tennessee Housing Development Agency TABLE OF CONTENTS
September, 2015 A Look at Tennessee Mortgage Activity: A one-state analysis of the Home Mortgage Disclosure Act (HMDA) Data 2004-2013 Hulya Arik, Ph.D. Tennessee Housing Development Agency TABLE OF CONTENTS
Fannie Mae 2011 Third-Quarter Credit Supplement. November 8, 2011
 Fannie Mae 2011 Third-Quarter Credit Supplement November 8, 2011 This presentation includes information about Fannie Mae, including information contained in Fannie Mae s Quarterly Report on Form 10-Q for
Home Financing in Kansas City and Its Contribution to Low- and Moderate-Income Neighborhood Development
 FEBRUARY 2007 Home Financing in Kansas City and Its Contribution to Low- and Moderate-Income Neighborhood Development JAMES HARVEY AND KENNETH SPONG James Harvey is a policy economist and Kenneth Spong
An Evaluation of Research on the Performance of Loans with Down Payment Assistance
 George Mason University School of Public Policy Center for Regional Analysis An Evaluation of Research on the Performance of Loans with Down Payment Assistance by Lisa A. Fowler, PhD Stephen S. Fuller,
Residential Mortgage Default and Consumer Bankruptcy: Theory and Empirical Evidence*
 Residential Mortgage Default and Consumer Bankruptcy: Theory and Empirical Evidence* Wenli Li, Philadelphia Federal Reserve and Michelle J. White, UC San Diego and NBER February 2011 *Preliminary draft,
Internet Appendix for Did Dubious Mortgage Origination Practices Distort House Prices?
 Internet Appendix for Did Dubious Mortgage Origination Practices Distort House Prices? John M. Griffin and Gonzalo Maturana This appendix is divided into three sections. The first section shows that a
TRENDS IN DELINQUENCIES AND FORECLOSURES IN SOUTHERN CALIFORNIA
 TRENDS IN DELINQUENCIES AND FORECLOSURES IN SOUTHERN CALIFORNIA April 2009 Melody Nava, Community Development Department, Federal Reserve Bank of San Francisco Outline of Presentation National Trends Rising
Fannie Mae 2009 First Quarter Credit Supplement. May 8, 2009
 Fannie Mae 2009 First Quarter Credit Supplement May 8, 2009 1 These materials present tables and other information about Fannie Mae, including information contained in Fannie Mae s Quarterly Report on
M E M O R A N D U M Financial Crisis Inquiry Commission
 M E M O R A N D U M Financial Crisis Inquiry Commission To: From: Commissioners Ron Borzekowski Wendy Edelberg Date: July 7, 2010 Re: Analysis of housing data As is well known, the rate of serious delinquency
Washington, D.C. Metropolitan Area Foreclosure Monitor: Technical Appendix
 Washington, D.C. Metropolitan Area Foreclosure Monitor: Technical Appendix and Revised March, 2011 Geography of Data The Washington metropolitan region spans three states and the District of Columbia.
TRENDS IN DELINQUENCIES AND FORECLOSURES IN CALIFORNIA
 TRENDS IN DELINQUENCIES AND FORECLOSURES IN CALIFORNIA April 2009 Community Development Department, Federal Reserve Bank of San Francisco Outline of Presentation National Trends Rising foreclosures House
U.S. Residential. Mortgage Default. Performance Update. & Market Analysis
 2016 U.S. U.S. RESIDENTIAL MORTGAGE DEFAULT PERFORMANCE UPDATE & MARKET ANALYSIS The residential mortgage servicing industry is worlds away from where it was six years ago at the peak of the housing crisis,
The state of the nation s Housing 2013
 The state of the nation s Housing 2013 Fact Sheet PURPOSE The State of the Nation s Housing report has been released annually by Harvard University s Joint Center for Housing Studies since 1988. Now in
What Fueled the Financial Crisis?
 What Fueled the Financial Crisis? An Analysis of the Performance of Purchase and Refinance Loans Laurie S. Goodman Urban Institute Jun Zhu Urban Institute April 2018 This article will appear in a forthcoming
Loan Originations and Defaults in the Mortgage Crisis: The Role of the Middle Class. Internet Appendix. Manuel Adelino, Duke University
 Loan Originations and Defaults in the Mortgage Crisis: The Role of the Middle Class Internet Appendix Manuel Adelino, Duke University Antoinette Schoar, MIT and NBER Felipe Severino, Dartmouth College
Experian-Oliver Wyman Market Intelligence Reports Strategic default in mortgages: Q update
 2011 topical report series Experian-Oliver Wyman Market Intelligence Reports Strategic default in mortgages: Q2 2011 update http://www.marketintelligencereports.com Table of contents About Experian-Oliver
Preliminary Analysis of Program Effects. November 2009
 National Foreclosure Mitigation Counseling Program Evaluation November 2009 Prepared by Neil Mayer Peter A. Tatian Kenneth Temkin Charles A. Calhoun With Randy Rosso Kaitlin Franks David Price Elizabeth
Understanding the Foreclosure Crisis in California
 Understanding the Foreclosure Crisis in California John Olson Community Development Department Federal Reserve Bank of San Francisco June 4, 2008 Analysis of First American LoanPerformance data provided
Remarks by Governor Edward M. Gramlich At the Financial Services Roundtable Annual Housing Policy Meeting, Chicago, Illinois May 21, 2004
 Remarks by Governor Edward M. Gramlich At the Financial Services Roundtable Annual Housing Policy Meeting, Chicago, Illinois May 21, 2004 Subprime Mortgage Lending: Benefits, Costs, and Challenges One
Federal National Mortgage Association
 UNITED STATES SECURITIES AND EXCHANGE COMMISSION Washington, D.C. 20549 Form 10-K ANNUAL REPORT PURSUANT TO SECTION 13 OR 15(d) OF THE SECURITIES EXCHANGE ACT OF 1934 For the fiscal year ended December
HOUSING FINANCE REFORM DEBATE: HOW CAN THE FHA MEET THE FUTURE NEEDS OF US HOUSING? #LiveAtUrban
 HOUSING FINANCE REFORM DEBATE: HOW CAN THE FHA MEET THE FUTURE NEEDS OF US HOUSING? #LiveAtUrban Mission Critical: Retooling FHA to Meet America s Housing Needs Carol Galante January 9, 2018 FHA: An Important
Outcome Analyses 4/27/2011. National Foreclosure Mitigation Counseling (NFMC) Program
 Program") National Foreclosure Mitigation Counseling Program Evaluation Does Foreclosure Counseling Help Troubled Homeowners? April 28, 2011 Neil S. Mayer, Principal Neil Mayer and Associates Kenneth Temkin, Principal
National Foreclosure Mitigation Counseling Program Evaluation Does Foreclosure Counseling Help Troubled Homeowners? April 28, 2011 Neil S. Mayer, Principal Neil Mayer and Associates Kenneth Temkin, Principal
Federal National Mortgage Association
 UNITED STATES SECURITIES AND EXCHANGE COMMISSION Washington, D.C. 20549 Form 10-Q QUARTERLY REPORT PURSUANT TO SECTION 13 OR 15(d) OF THE SECURITIES EXCHANGE ACT OF 1934 n For the quarterly period ended
Increasing homeownership among
 Subprime Lending and Foreclosure in Hennepin and Ramsey Counties: An Empirical Analysis by Jeff Crump Increasing homeownership among low-income and minority communities is a major goal of housing policy
Individual and Neighborhood Effects on FHA Mortgage Activity: Evidence from HMDA Data
 JOURNAL OF HOUSING ECONOMICS 7, 343 376 (1998) ARTICLE NO. HE980238 Individual and Neighborhood Effects on FHA Mortgage Activity: Evidence from HMDA Data Zeynep Önder* Faculty of Business Administration,