2016 ANNUAL REPORT AND FINANCIAL STATEMENTS
|
|
|
- Bruce Ramsey
- 5 years ago
- Views:
Transcription


1 2016 ANNUAL REPORT AND FINANCIAL STATEMENTS
2


3 Table of Contents Who We Are Transcentury s Historical Timeline TCL s Geographical Presence Value Drivers Directors and Statutory Information Board of Directors Group Corporate Team Division Team Corporate Governance Principal Shareholders and Distribution of Shareholding Chairman s Statement Chief Executive s Statement Report of the Directors Directors Remuneration Report Statement of Directors Responsibilities Report of the Independent Auditors Consolidated Statement of Profit or Loss and Other Comprehensive Income Company Statement of Profit & Loss and Other Comprehensive Income Consolidated Statement of Financial Position Company Statement of Financial Position Consolidated Statement of Changes In Equity Company Statement of Changes In Equity Consolidated Statement of Cash Flows Company Cash Flow Statement Notes To The Consolidated Financial Statements Composition of Net Asset And Fair Value Proxy Form
 countries in East, Central and Southern Africa.")


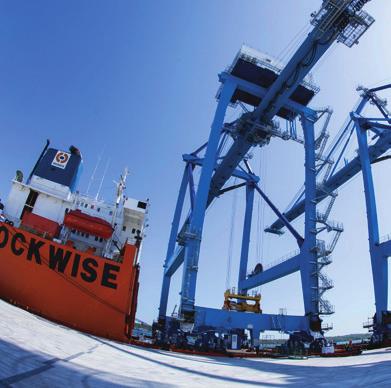
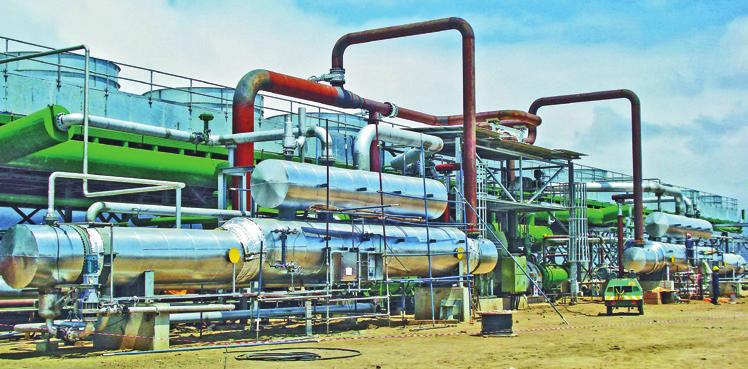
4 Who we are TransCentury is an Infrastructure Company listed on the Nairobi Securities Exchange with three (3) Divisions across twelve (12) countries in East, Central and Southern Africa. Power Division Engineering Division of industrial equipment Infrastructure Projects Division infrastructure to support key pillars of the domestic and export economy TransCentury delivers value through three divisions to four main markets ENERGY / INFRASTRUCTURE COMMERCIAL RESIDENTIAL MINING / INDUSTRIAL OUR INVESTMENT PRESENCE Kenya Tanzania Uganda Zambia DRC South Africa Ethiopia South Sudan Rwanda Burundi Zimbabwe Mozambique 4 ANNUAL REPORT AND FINANCIAL STATEMENTS FOR THE YEAR ENDED 31ST DECEMBER 2016
: 2015 2014 RVR exit 2012 Disposal of Non-Core Assets: CBL &")

 December 2010 CDC (100%) September 2007 Tanelec (70%) 2008")
")

5 TransCentury s Historical Timeline Civicon Congo (+34%): 2014 & Civicon Africa Group (+16%): RVR exit 2012 Disposal of Non-Core Assets: CBL & Funds October 2011 Civicon (62%) Kuramo Capital s US$ 20m Equity Injection December 2013 Total Assets reach KES 23.8 billion (all-time high) July 2011 Lists on the Nairobi Securities Exchange June 2011 Tanelec Zambia (80%) December 2010 CDC (100%) September 2007 Tanelec (70%) 2008 March 2011 Issues fi rst ever listed convertible Eurobond by East African entity April 2009 Share begin trading Over-the-Counter market August 2007 Kewberg (100%) December 2006 RVR (34%) April 2005 AEA (94%) 2006 Fulltime management team engaged February 2004 E.A. Cables (64%) Incorporation ANNUAL REPORT AND FINANCIAL STATEMENTS FOR THE YEAR ENDED 31ST DECEMBER
6 TCL s Geographical Presence 6 ANNUAL REPORT AND FINANCIAL STATEMENTS FOR THE YEAR ENDED 31ST DECEMBER 2016


 increasing to 67.")

7 Value Drivers In the East African region, growth prospects are stronger, driven by increased public infrastructure investment, and improved business environment... Attractiveness of the East Africa Region Sub-Saharan Africa (SSA) experienced a slowdown in economic activity in 2016 driven by sharp decline in commodity prices. However, the economies are forecasted to pick up to 2.6 percent in 2017 and to 3.2 percent in 2018, predicated on moderately rising commodity prices and reforms to tackle macroeconomic imbalances. In the East African region, growth prospects are stronger, driven by increased public infrastructure investment, and improved business environment. In addition, these economies are more diversified and less dependent on commodities, providing a shield against the impact of global commodity price shocks. Underlying drivers of growth are in place and growth is projected to remain strong over the medium term. One such driver is the accelerating urbanization creating demand for infrastructure development. The Brookings Institution estimates that by 2030, the 20 fastest-growing cities globally will be in Africa, with the number of large cities (with 5 million to 10 million people) in Africa quadrupling from three in 2014 to 12 in 2030, and the number of medium-sized cities (with 1 million to 5 million people) increasing to 67. Urban population growth is key to attaining middle income status and the region we operate in is expected to experience a higher growth rate than the average for Sub-Saharan Africa. East Africa is also a relatively stable region compared to other Sub-Saharan African countries. High GDP growth in operating region Source: International Monetary Fund Urbanisation in select African Countries Source: CIA World fact book ANNUAL REPORT AND FINANCIAL STATEMENTS FOR THE YEAR ENDED 31ST DECEMBER


8 Value Drivers (continued) Opportunity in Regional Infrastructure Development Governments across East Africa continue to increase their development spend in line with their aspirations to transform into middle-income economies. Regional governments have launched well-articulated national development plans which stipulate the roadmap to achieve the targets. To support the development of the economies, governments across the region have enacted and enhanced public-sector procurement laws that give preference to locally manufactured goods and services. The Group is well positioned to benefit from the resultant demand due to increased production capacity, good track record and wide regional footprint. On Power infrastructure, increased electrification efforts by regional governments has seen great progress made in the connection of population to the Electricity grid. Existing low connection rates provide huge opportunities as governments work towards universal access to power. The Group s Power Division as well as our Engineering Division continue to supply products and partner in the construction of power infrastructure. This trend is projected to continue and will result in increased utilization of installed capacities. Electrification Growth rate vs growth in capacity (MW) Source: World Energy Outlook, Kengen, World Bank & KPMG (KPMG Sub-Saharan Africa power outlook 2016) Installed Capacity (MW) Source: Electricity Regulatory Authority - Uganda, TANESCO - Tanzania, US Energy Information Administration 8 ANNUAL REPORT AND FINANCIAL STATEMENTS FOR THE YEAR ENDED 31ST DECEMBER 2016
9 Directors and Statutory Information DIRECTORS Shaka Kariuki, Chairman Appointed 28th March 2017 Zephaniah Mbugua Peter Kanyago Retired 30th June 2016 Robin Kimotho Retired 30th June 2016 Dennis Awori Resigned 8th June 2017 Michael Waweru Retired 30th June 2016 Nganga Njiinu Appointed 1st July 2016 Wale Adeosun Appointed 28th March 2017 Kamal Pallan Appointed 28th March 2017 Stephen Njoroge Waruhiu Appointed 26th April 2017 Ephraim Kariithi Njogu Appointed 26th April 2017 SECRETARY Virginia Ndunge Kaplan & Stratton Advocates 9 th Floor, Williamson House 4 th Ngong Avenue PO Box 40111, Nairobi GPO AUDITORS KPMG Kenya 8 th Floor, ABC Towers Waiyaki Way PO Box Nairobi GPO REGISTERED OFFICE 8th Floor, West End Towers Off Waiyaki Way PO Box Nairobi GPO PRINCIPAL PLACE OF BUSINESS 8th Floor, West End Towers Off Waiyaki Way PO Box Nairobi GPO ADVOCATES Muthaura Mugambi Ayugi & Njonjo Advocates 4 th Floor, West Wing, Capitol Hill Square Off Chyulu Road, Upper Hill PO Box Nairobi City Square Kaplan & Stratton Advocates 9 th Floor, Williamson House 4 th Ngong Avenue PO Box Nairobi GPO SHARE REGISTRARS Cooperative Bank of Kenya Limited Share Registration Services 13 th Floor, Cooperative Bank House Haile Selassie Avenue PO Box 48231, Nairobi GPO BANKERS Citibank NA-Kenya Branches PO Box Nairobi GPO Commercial Bank of Africa Limited PO Box Nairobi GPO Co-operative Bank of Kenya Limited PO Box Nairobi GPO Kenya Commercial Bank Limited PO Box Nairobi GPO National Industrial Credit Bank Limited PO Box Nairobi GPO Standard Bank (Mauritius) Limited 6 th Floor, Medine Mews Building La Chaussee Street Port Louis, Mauritius Equity Bank Limited Lavington Supreme PO Box Nairobi City Square Standard Chartered Bank Kenya Limited 48 Westlands Road PO Box Nairobi GPO UBA Kenya Bank Limited Apollo Centre 1 st Floor Ring Road PO Box Nairobi GPO ANNUAL REPORT AND FINANCIAL STATEMENTS FOR THE YEAR ENDED 31ST DECEMBER


10 Board of Directors Shaka Kariuki, Chairman Previously, Shaka served in a number of leadership roles at the $9 billion Deseret Mutual Benefit Administrators (DMBA), most recently as Head of Global Equity Markets across asset classes, Head of Fixed Income, and Portfolio Manager of Global Private Equity. Shaka also headed the investments of DMBA Affiliates in Developed and Emerging Markets (UK, Canada, New Zealand, Australia, Philippines, Samoa), including Africa. Prior to DMBA, Shaka was a Senior Member of the Global Finance team at Agilent Technologies where he managed finance teams in Asia, Europe, Japan and USA. Prior to Agilent, Shaka was an Associate in the Investment Banking Division of First Security Van Kasper. Shaka also worked at Choice Hotels International in the mergers & acquisitions department. He is the former Chairman of Deseret First Credit Union. He currently serves as Executive Chairman of NAS Foods in Ethiopia, and is on the Board of Leon Business Solutions in Zimbabwe, Solo in Nigeria, Sepfluor in South Africa and the Marriott School of Management at Brigham Young University. Shaka holds a B.S. in Economics, an MBA with an emphasis in Finance from Brigham Young University, and a Masters in Government from Harvard University. He is a member of the CFA Institute. Zephaniah Mbugua, Director Mr. Mbugua is a graduate of Makerere University with a BSc in Chemistry and Mathematics. He is a successful serial entrepreneur, developing businesses and partnership across Africa for the last 37 years. He is a founder member and Chief Executive Officer of Abcon Group, a holding company with varied business interests. He is also a director of Proctor & Allan EA Ltd, Britam Insurance (Tanzania), Stockport Exploration Inc. and Zeniki Investment Ltd. Nganga Njiinu, CFA, CEO Since joining TransCentury Group in 2008, Njiinu has held various roles in corporate finance, portfolio management, business development as well as originating and developing opportunities in the infrastructure space. Prior to Joining TransCentury, Njiinu worked for Coldwell Banker Residential Brokerage in the USA for 7 years, where he was involved in strategy, financial planning and analysis as well as evaluation and integration of acquisitions. Njiinu has an MBA in Finance and Investment Management from the University of Dallas in Irving, Texas and a Bachelor of Science in International Business from United States International University. Njiinu is also a CFA charter holder. Stephen Njoroge Waruhiu, Director Stephen Waruhiu is the Managing Director of Lloyd Masika Limited, a leading Real Estate Agency firm. He is a registered and licensed Valuer and Estate Agent with over 35 years of experience in private practice in Kenya, and has also undertaken property consultancy in the wider East African region. He serves in the Boards of Rea Vipingo Limited, Kakuzi Plc and International House Limited as a Director. Stephen holds a B.A Honours degree in Land Economics and is a full member of The Institution of Surveyors of Kenya. 10 ANNUAL REPORT AND FINANCIAL STATEMENTS FOR THE YEAR ENDED 31ST DECEMBER 2016

 now Communication Authority (CA), where he was also a member and Chair of the Finance Matters")


11 Board of Directors (continued) Njogu Ephraim Kariithi, H.S.C, Director Njogu Kariithi has vast experience in management of public resources in the Kenyan economic environment and in consultancy and advisory activities. He sits in the board of LSG Sky Chefs Kenya Ltd, the 2nd inflight Catering Company in Kenya as well as in the board of Old Mutual Investment Services Ltd. Between 2006 and 2012, Njogu served as a director at the Communication Commission of Kenya (CCK) now Communication Authority (CA), where he was also a member and Chair of the Finance Matters Committee for more than 4 years. In 2009, Njogu was appointed by the then Minister for Planning, to serve as a member of the National Governing Council for preparation of a second government review by African Peer Review Mechanism (APRM) programme. He is a founding member of TransCentury Group and also served as a honorary secretary during the formative years. He holds an M.Sc Degree in Management and Organizational Development from United States International University as well as an M.Sc Degree in Human Biology from Loughborough University of Technology in Leicestershire, England. Walé F. Adeosun, CFA, Director Kamal Pallan, Director Previously, Kamal served in a number of different executive roles at JPMorgan, most recently as Managing Director for the Global Custody business in the Americas. He was also a Product Executive in JPMorgan s ADR business where he led the issuance of GDRs and ADRs for companies from emerging and frontier markets. Prior to JPMorgan, Kamal was an Engagement Manager in the New York office of McKinsey & Company, serving global corporations in financial services, media, and entertainment. He has also worked in business development at GE Capital and as an investment analyst at the International Finance Corporation (IFC) where he focused on equity and debt investments in the Oil, Gas & Mining sector, including initiatives in Africa. Kamal Pallan received his MBA from the Wharton School of the University of Pennsylvania and a BSE in Chemical Engineering summa cum laude from the University of Pennsylvania. Virginia Ndunge, Company Secretary Virginia Ndunge is a Certified Public Secretary and a member of the Institute of the Certified Public Secretaries of Kenya (ICPSK). She holds a Bachelor of Commerce degree in Finance and Diploma in Project Management. She has substantial experience in Company Secretarial having worked with Emu Registrars, Certified Public Secretarial for over 12 years. In July 2013, she joined Kaplan and Stratton Advocates where she is the Head of Company Secretarial Division. Previously, Walé was Treasurer and Chief Investments Officer (CIO) at Rensselaer Polytechnic Institute (RPI), where he oversaw $850 million in endowment and pension assets. He led RPI s increased investment in alternative investments, spearheading RPI s investment effort in emerging frontier markets, including Africa. From 1999 to 2004, Wale was a Managing Director in the Investments Group of The MacArthur Foundation in Chicago. Walé served as former Chair of the Investment Advisory Committee for the $180 Billion New York State Common Retirement Fund. He also serves as President of the Nigeria Higher Education Foundation (NHEF). Walé was awarded the Chartered Financial Analyst designation in 1995 and is a member of the CFA Institute. He was also appointed to President Obama s Presidential Council on Doing Business in Africa. Walé received his MBA from John M. Olin School of Business at Washington University in Saint Louis, MO with a concentration in Finance, and his BA in Economics and Business Administration from Coe College, Cedar Rapids, IA. ANNUAL REPORT AND FINANCIAL STATEMENTS FOR THE YEAR ENDED 31ST DECEMBER


12 Group Corporate Team Nganga Njiinu Group Chief Executive Officer Martin Munyiri Group Head of Finance John Mugo Division Principal, Power Geoffrey Njue Group Internal Auditor Phyllis Gachau Group Communications Manager Florence Murerwa Group Human Resource Manager 12 ANNUAL REPORT AND FINANCIAL STATEMENTS FOR THE YEAR ENDED 31ST DECEMBER 2016


 Ltd.")


13 Divisions Team Jason Horsey Chief Executive Officer Civicon Group Moiz Karachiwalla Civicon Group Ben Kiilu Business Development Roberto Artuso Head of Projects Civicon Group Nicholas Kithinji AEA Ltd Anthony Mwangi Chief Finance Officer AEA Ltd David Alumasa AEA Ltd. Phili Fundu Cablerie du Congo Peter Arina Chief Executive Officer East African Cables Ltd Joseph Kinyua East African Cables Ltd Geoffrey Odhiambo East African Cables (TZ) Ltd Steven Wanyoike Kewberg Cables and Braids (PTY) Ltd. Zahir Saleh Tanelec Group Justin Gitia Tanelec Group Charles Moono Tanelec Zambia Edrick Mwenda Tanelec Group ANNUAL REPORT AND FINANCIAL STATEMENTS FOR THE YEAR ENDED 31ST DECEMBER
14 Corporate Governance Corporate Governance provides the structure through which the strategic objectives of the Company are set, and the means of attaining them as well as monitoring performance. TransCentury in its decision-making processes observes the highest ethical standards and benchmarks on global best practices in compliance with the applicable legal principles, its corporate vision, mission and core values for sustainability of the Company. Statement of Compliance The Board and management of TransCentury are in compliance with the Capital Markets Authority (CMA) Corporate Governance Guidelines as part of the obligations as a listed company, as well as ascribing to the ethical standards prescribed in the charter and the Company code of conduct. BOARD OF DIRECTORS As at 31st December 2016, the Board consisted of the outgoing Chairman, Mr. Z.G. Mbugua, one non-executive director, Mr. Dennis Awori, and the Chief Executive Officer (CEO), Mr. Nganga Njiinu. Subsequently, the following have since been appointed to the Board: Mr. Shaka Kariuki (incoming Chairman), Mr. Wale Adeosun, Mr. Kamal Pallan, Mr. Stephen Waruhiu and Mr. Ephraim Njogu. The directors biographies appear on page 10 and 11. All non-executive directors on TransCentury s board are independent of management and have diverse skills, experience and competencies appropriate for effective management of the company s business. The board meets at least on a quarterly basis during the year, with additional meetings when necessary. The directors are given appropriate and timely information so that they can maintain full and effective control over strategic, financial, operational and compliance issues. Except for the direction and guidance on general policy, the board has delegated authority for conduct of day to day business to the CEO. The Board nonetheless retains responsibility in maintaining the company s overall internal control on financial, operational and compliance issues. All our directors have also attended various corporate governance courses organized by accredited institutions. All non-executive directors are subject to periodic reappointment in accordance with company s Article of Association which requires that one third of the longest serving directors (since their last election) retire by rotation every year and if eligible their names are submitted for re-election at the Annual General Meeting. The composition of the Board and attendance during the year is as shown below: Member Mr. Shaka Kariuki** Chairman Mr. Z. G. Mbugua Non-Executive Director Mr. Nganga Njiinu* Executive Director Mr. Wale Adeosun** Non-executive Director Mr. Kamal Pallan** Non-executive Director Mr. Stephen Njoroge Waruhiu*** Non-executive Director Mr. Ephraim Kariithi Njogu*** Non-executive Director Dr. G. Kiuna**** Executive Director Mr. J. Karago***** Non-executive Director Mr. P. T. Kanyago****** Non-executive Director Mr. R. Kimotho****** Non-executive Director Mr. Michael Waweru****** Non-executive Director Amb. Dennis Awori Non-executive Director******* Ms. V. Ndunge Company Secretary *Appointed 1st July 2016 **Appointed 28th March 2017 ***Appointed 26th April 2017 ****Resigned 14th January 2016 *****Resigned 15th January 2016 ******Retired 30th June 2016 *******Resigned 8th June 2017 OF THE BOARD Attendance 0/14 14/14 12/14 0/14 0/14 0/14 0/14 2/14 2/14 9/14 9/14 8/14 9/14 14/14 The following standing committees assist the Board in the discharge of its duties. These committees meet regularly under the terms of reference set by the board. Audit and Risk Committee The Board has constituted an audit and risk committee which meets at least quarterly. It included two nonexecutive directors: Mr. Peter Kanyago and Mr. Robin Kimotho. Most members retired hence there was lack of quorum for meetings and the audit and risk committee was substituted by the main board meetings. 14 ANNUAL REPORT AND FINANCIAL STATEMENTS FOR THE YEAR ENDED 31ST DECEMBER 2016
15 Corporate Governance (continued) Subsequently, Mr. Kamal Pallan, Amb. Dennis Awori and Mr. Ephraim Kariithi Njogu have joined the committee. Its responsibilities include review of financial information, in particular half year and annual financial statements, compliance with accounting standards, liaison with external auditors, remuneration of external auditors and maintaining oversight on internal control systems. Other responsibilities are to receive and consider the company s annual budget. The committee is guided by a charter from the Board which outlines its mandate. The Chief Executive Officer, Head of Finance and Group Internal Auditor are regularly invited. The members of the audit committee, together with a record of their attendance at scheduled meetings during the year are set out below: Member Kamal Pallan* Non-executive Director Ephraim Kariithi Njogu** Non-executive Director Mr. P. Kanyago *** Chairman Mr. R. Kimotho*** Non-executive Director Mr. Dennis Awori**** Non-executive Director *Appointed 28th March 2017 **Appointed 26th April 2017 ***Retired 30th June 2016 ****Resigned 8th June 2017 Strategy and Investment Committee Attendance 0/2 0/2 2/2 2/2 0/2 The main responsibility of the Committee is to chart the strategy of the Group and to oversee implementation of strategic decisions of the board which include product and or geographical diversification, strategic partnerships and also review proposals involving capital expenditure. Most members retired hence there was lack of quorum for meetings and the strategy and investment committee was substituted by the main board meetings. Nominations and Remuneration Committee The main responsibilities of the Committee are to nominate TCL and subsidiary companies board members, appointment of TCL and subsidiary CEO s and succession planning. The Committee also determines the company s remuneration policy for employees, management and non-executive directors. The committee submits its findings and recommendations at the quarterly board meetings. Most members retired during the year hence there was lack of quorum for meetings and the nominations and remuneration committee was substituted by the main board meetings. SHAREHOLDERS The company is committed to ensuring that shareholders and the financial markets are provided with full and timely information about its performance. In the year, the company accomplished this objective through website updates, publications and distribution of its Annual Report and release of notices in the national press. The company also holds statutory meetings as required. In this regard, the company complies with the obligations contained in the Nairobi Securities Exchange s Listing Rules, the Capital Markets Authority Act and Kenyan Companies Act. LOANS The aggregate amounts of emoluments paid to the directors for services rendered during this financial year ended 31 December 2016 are disclosed in the financial statements. Neither at the end of the financial year nor at any time during the year did there exist any arrangement to which the company is a party, whereby a director might acquire benefits by means of acquisition of the company s shares. All business transactions with the directors or related parties are carried out at arm s length. Such transactions have been disclosed. The Board recognizes that managing risk to ensure an optimal mix between risk and return is an integral part of achieving corporate goals. The board has put in place processes for identifying, assessing, managing and monitoring risks to ensure that the company s business objectives are achieved and risks mitigated. The company has defined procedures and financial controls to ensure the reporting of complete and accurate accounting information. They cover systems for obtaining authority for major transactions and for ensuring compliance with the laws and regulations that have significant financial implications. The Board approves company policies and procedures whereas the management implements the Board s risk management policy. Procedures are also in ANNUAL REPORT AND FINANCIAL STATEMENTS FOR THE YEAR ENDED 31ST DECEMBER
16 Corporate Governance (continued) place to mitigate investment risks and manage the risk profile of the investment portfolio. A comprehensive management accounting system is in place providing financial and operational performance measurement indicators. Regular senior management meetings are held to monitor performance and to agree on measures to drive improvement. The company is committed to provide equal opportunity to all employees and applicants on the basis of merit. Our practice is to create a meritocratic culture in all our businesses across the African continent. The directors attach great importance to the need to conduct the business and operations of the company with integrity and in accordance with internationally developed principles on good governance. The company adopts the best principles of good corporate culture that requires the directors and all employees to maintain the highest personal and ethical standards and to act in good faith and in the interest of the company. The company has developed and implemented a code of conduct that sets out guidelines and rules, which are based on good governance principles of: Full compliance with the law Application of best accounting practices 16 ANNUAL REPORT AND FINANCIAL STATEMENTS FOR THE YEAR ENDED 31ST DECEMBER 2016
17 Principal Shareholders and Distribution of Shareholding SHARE REGISTER DETAILS Directors interests in the shares of the company, the distribution of the Company shareholding and analysis of the ten (10) major shareholders as at 31st December 2016 were as follows: DIRECTORS INTEREST Name of Director No. of Shares % Shareholding Ephraim Kariithi Njogu* 12,520, Zephaniah Gitau Mbugua* 11,984, Stephen Njoroge Waruhiu* 9,862, Total 34,368, * See the shareholding details below MAJOR SHAREHOLDERS Name of Shareholder No of Shareholders No of Shares held % Shareholding Standard Chartered Nominees A/C KE ,065, Anne Pearl Karimi Gachui 21,240, Michael Gitau Waweru 21,216, Peter Tiras Kanyago 15,664, Ephraim Kariithi Njogu* 12,520, Zephaniah Gitau Mbugua* 11,984, Gath Properties Limited 10,933, Robin Munyua Kimotho 10,851, Standard Chartered Nominees A/C KE ,437, Stephen Njoroge Waruhiu* 9,862, SUB-TOTAL ,777, OTHERS 1, ,649, TOTAL ISSUED SHARES 1, ,426, DISTRIBUTION OF SHAREHOLDING Shares range No. of Shareholders No. of Shares held % Shareholding , , ,076, ,001-10, ,488, , , ,180, ,001-1,000, ,524, Above 1,000, ,012, TOTAL 1, ,426, SHAREHOLDER ANALYSIS BY DOMICILE Domicile No. of Shareholders No. of shares held % Shareholding Local individuals 1, ,633, Local institutions ,152, East African individuals 6 51, Foreign individuals , Foreign institutions 8 55,804, Total 1, ,426, ANNUAL REPORT AND FINANCIAL STATEMENTS FOR THE YEAR ENDED 31ST DECEMBER

18 Chairman s Statement...let me reassure you that Transcentury is comprised of great businesses and the solid foundation laid over the years has allowed us to focus on resolving the historical challenges that we faced and to steer the company in line with our strategic goal of investing across Africa and building a world-class business... Dear Stakeholders, I am delighted to present to you the audited financial statements for the year ended 31st December At the start, let me reassure you that Transcentury ( TCL or Group ) is comprised of great businesses and the solid foundation laid over the years has allowed us to focus on resolving the historical challenges that we faced and to steer the company in line with our strategic goal of investing across Africa and building a world-class platform. As you may be aware, in the last few years, the Group has implemented a significant capital investment program. However, during the 2014/2015 period, volatility in commodities and regional currencies, prolonged production interruption and disruption of some of our markets due to political instability, significantly impacted our working capital and debt positions. While we weathered these challenges and responded with well thought out strategies, 2016 presented a unique challenge due to perceived uncertainty around the Group s resolution of a Eurobond that was maturing in March This led to a reactionary credit freeze to some of our businesses, inevitably worsening our working capital position and groupwide debt burden. The challenges faced in 2016 have spurred a critical transformation which is necessary to shed historical challenges and spark the next phase of growth As part of the process the Group launched a comprehensive restructuring and reorganization of its Capital structure, (Improving balance sheet) organization design (strengthening human capacity and alignment to business strategy) and strengthened corporate governance and oversight. It is also worth noting that the Group entered into an equity transaction whose effect was to inject USD 20m equity into the business, reduce maturing loan liabilities by USD 40m and further USD 20m restructured into a 3-year loan which reduced cashflow pressures. 18 ANNUAL REPORT AND FINANCIAL STATEMENTS FOR THE YEAR ENDED 31ST DECEMBER 2016
19 Chairman s Statement (continued) Through our Power and Engineering Divisions, the Group continued to make an impact in the infrastructure sector in Africa where we have continued to see attractive returns for our shareholders. I am pleased to report that the Power Division which boasts regional power houses East African Cables and Tanelec, experienced substantial increases in order book from local utilities as regional governments heightened electrification efforts. As we anticipated, improvement in enforcement of regulation on the local content bill in Kenya, gazetted in 2014, has presented great opportunities for local manufacturers. In the year under review, the 2014 law was further strengthened by the inclusion of a local content development and enforcement committee. It is important to highlight that the law stipulates that between 30-90% of Cables and Conductors procured ought to be sourced locally. Similarly, in Tanzania, the Group Power Division subsidiaries have worked closely with the Government to promote local industry by demonstrating and availing sufficient local capacity to meet demand and therefore support local procurement. This has led to the first full local tender award for conductors and transformers to Group subsidiaries. Our factories now boast the highest capacity in the region and are well positioned to partner with regional utilities in their electrification drive. In the Engineering Division, the cyclical nature of the business compounded by the unavailability of credit in the first half of 2016 led to a 47% drop in revenue. In the second half, however the Division made remarkable progress in turning the tide with the closure of an impressive order book of USD 120 million whose implementation commences in To address the historical cyclicality, the Division continues to diversify into new sectors through fostering strategic partnerships with key technical partners in target sectors. Through our subsidiary AEA, the Group continues to be the sole representative of key international brands in weighing, coding, bearings, and more recently pothole patching technology. The Division is strategically positioned to leverage on the opportunities available in this sector. Business Environment In the year under review, the Sub-Saharan Africa (SSA) economy decelerated from 3.3% in 2015 to 1.4%. This was attributed to a sharp decline in commodity prices, especially oil that was triggered by high production and inventories. The region also experienced severe drought during this period, however, there are modest recovery expectations driven by a rise in commodity prices, higher public spending and fading drought effects. The Kenyan economy remained stable registering growth of 5.8% up from 5.7% recorded in 2015 with annual average inflation easing to 6.3% from 6.6% in the same period. Government expenditure on development grew from USD 5,579 million to USD 7,039 million. Unlike in 2015, the Kenyan shilling remained relatively stable weakening marginally from KES 98.3 in 2015 to KES in Key to note is the growth in private consumption supported by rising income, a growing middle class with a higher disposable income and ongoing favorable demographic transitions. In addition, fiscal expansion driven by public investments and transfers to county governments spawned growth in devolved units. On the flip side, the coming into force in quarter four of the banking amendment Act 2016 which capped interest rates reduced the financial sectors appetite for lending to the private sector. Uganda registered growth of 4.9%, while Government expenditure on development grew to USD 2,497 million compared to USD 2,060 million the previous year. The country experienced relative stability despite 2016 being an election year and forecasts on economic prospects are promising with investment in infrastructure having a strong impact on economic growth. The power sector is poised for growth, with a total of eight generation projects including two funded hydropower projects scheduled to be commissioned in In addition, developments around Lake Albert where oil reserves are located have been intensified and will go a long way in diversifying and broadening the economy. Tanzania continues to make important economic and structural reforms to sustain its economic growth rate. The country recorded highest regional growth of 6.6% while government expenditure on development increased from USD 2,427 million in the previous year to USD 2,741 million in The services, industry and construction sectors experienced major growth while reduced electricity costs boosted industrial production. South Africa, Africa s most advanced economy had its GDP decelerate substantially to 0.3% on account of lower commodity prices, higher borrowing costs,...the group has successfully closed an equity transaction whose effect is to inject USD 20m equity into the business and reduce maturing loan liability, further reducing cash flow pressures... ANNUAL REPORT AND FINANCIAL STATEMENTS FOR THE YEAR ENDED 31ST DECEMBER
 between 2017-2019.")
20 Chairman s Statement (continued) diminishing confidence in the economy and weakening currency. However, public sector infrastructure spending is estimated to total R billion (USD 75 billion) between These funds will be used to expand power-generation capacity, upgrade and expand the transport network, sectors where the specialized cables manufactured by our business in South Africa are used. Strategic Themes As we look forward, the Group will continue to focus on key strategic themes that influence our way of doing business; 1. Build and support strong Brands in the Group: To reinforce our leadership position in the sectors we operate in, we will invest in our brands. The Group s portfolio already boasts some of the biggest brands in the region. 2. Focus on Infrastructure as primary strategy: Transcentury is a leader in infrastructure development and has made tremendous contributions in the region. Our focus remains in this sector. 3. Organization Realignment: This will be a key enabler in achieving set goals allowing for better investment oversight, alignment of business operations and synergies across the Group. 4. Capital Management: This remains our sole responsibility as we endeavor to deliver attractive shareholder returns through strategic investment and divestment, judicious distribution and allocation of capital. Corporate Governance In the year under review, the Board appointed Mr. Nganga Njiinu as the Chief Executive Officer. Mr. Njiinu has a tenure stretching over eight (8) years with TransCentury Group. He brings to the position in depth experience in both operating businesses and investments. He has held leadership roles in portfolio management, business transformation, corporate finance and strategy, and infrastructure projects development. The Board and I congratulate Njiinu on his appointment. As noted earlier in the Statement, the Group has started on a best-in-class implementation of corporate governance at the Board level and also at the operating businesses. At the Board level, for example, we have approved a Resolution that Board members cannot report to themselves. We have also introduced a cap on Board members service to six (6) years to allow for new members with fresh ideas to join the Board. At the operating company level, we have designed reporting lines to have the subsidiaries report directly to the Group and to strengthen the reporting lines. These are just a couple of examples of the significant changes being put in place and that you will see in evidence in ANNUAL REPORT AND FINANCIAL STATEMENTS FOR THE YEAR ENDED 31ST DECEMBER 2016
21 Chairman s Statement (continued) Events after the reporting Period Completion of Kuramo Capital Equity Injection Transaction In the first quarter of 2017, the Group completed an equity transaction resulting in Kuramo Capital acquiring a 24.99% shareholding in TCL by allotment of 93,776,173 new ordinary shares of the Company. This also led to the appointment of three (3) new Non-Executive Directors. Reconstitution of the Board In addition to the three above, the Board appointed an additional two (2) non-executive directors in line with corporate governance best practice. The Board, in line with the intent to have rotation and change in leadership, appointed me as Chairman. I am honored by the appointment and pledge to work diligently to realize the Group s objectives and the shareholders. Outlook Regional economies are projected to continue with a growth trajectory with Kenya, Uganda, and Tanzania, projected growth of 5.3%, 5% and 6.8% respectively. The macroeconomic environment is promising with the development and completion of major infrastructure projects in the region such as the Standard Gauge Railway, the Lake Turkana Wind Project, and others. The ongoing Lamu Port Southern Sudan-Ethiopia Transport (LAPSSET) Corridor project, among others, present vast opportunities for the Group. While working capital constraints remain a significant challenge for the operating businesses, the Board together with management has a clear turnaround plan that will ensure the businesses are sufficiently capitalized and return to profitability. Appreciation I would like to take this opportunity to thank all TransCentury investors for your continued support and believe in the TransCentury story. To my fellow Board of Members, I thank you for your unwavering dedication towards achieving set objectives and to all our stakeholders and partners, thank you for walking with us and lending us your expertise in various aspects of our business. Finally, to our esteemed teams across the Group, for your hard work, resilience and ongoing commitment, you remain the greatest asset to the TransCentury Group. Yours sincerly Shaka Kariuki Chairman of the Board The Group continues to execute its growth strategy that is driven by the initiatives mentioned above. With the implementation of the new organization structure, improved capital structure and injection of additional working capital, I am optimistic about the future of the Group. These initiatives will further strengthen the Group s financial performance and return it to profitability. Our Engineering Division continues to attract a robust project pipeline and with its long history of delivering exceptional projects, the Division is well positioned as the local partner of choice. We expect additional income streams to the Division with the introduction of modern technologies to address unique regional inefficiencies. The Power Division is well placed to deliver on the strong order book they opened 2017 with. The growth in development in power infrastructure across the region likewise provides great opportunities for the Division. There could not have been a better time to increase production capacity in the Division s plants, and this strategic decision continues to give the businesses an upper hand in addressing the market. ANNUAL REPORT AND FINANCIAL STATEMENTS FOR THE YEAR ENDED 31ST DECEMBER

 I would like to start by highlighting the exceptional backdrop in the year under review.")

22 Chief Executive s Statement...we reduced loss after tax by 64% to KShs 864 million from a loss of KShs 2,423 million reported in 2015, grew our orderbook, and closed the year with positive cash generated from operations... Dear Investors It gives me great pleasure to present to you a business over-view of the year 2016 and the performance outlook. Net Loss (KShs billion) I would like to start by highlighting the exceptional backdrop in the year under review. In 2016 the business faced an extremely challenging environment due to limited access to credit largely as a result of perceived uncertainties around the Group s ability to pay or refinance a maturing Eurobond. This came as we just concluded a 4-year, KShs 4 billion capital investment and capacity enhancement program which, coupled with unfavourable macro-economic environment in 2015, had impacted our working capital and debt positions. While we started 2016 with greatly improved capacity and capability to meet market demand, the constrained access to credit slowed our order generation and execution leading to the Group recording a 31% drop in revenue. However, during the year, we made progress in key areas that we had promised we will be focusing on, specifically deleveraging the business, improvement in our cost structure, better working capital management and broadening of our markets to increase utilization on newly installed capacity. On the back of these initiatives, we reduced loss after tax by 64% to KShs 864 million from a loss of KShs 2,423 million reported in 2015, grew our orderbook, and closed the year with positive cash generated from operations. Group Debt (KShs billion) 22 ANNUAL REPORT AND FINANCIAL STATEMENTS FOR THE YEAR ENDED 31ST DECEMBER 2016

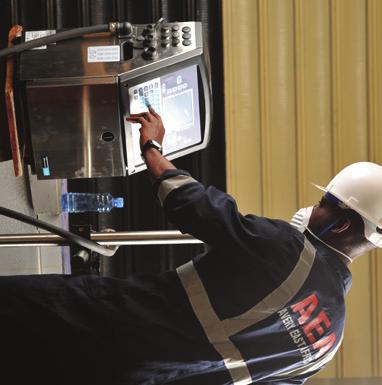
23 Chief Executive s Statement (continued) During the year, we entered into a KShs 2 billion equity transaction, further highlighting the strong fundamentals shining through and growth prospects yet to be realized. In addition, we reduced our total debt exposure by KShs 6 billion, significantly reducing short-term cash pressure and improving the Group s financial flexibility. In our 2015 Annual Report, we had projected strong demand for our products from continued public and private investments in regional infrastructure and had noted that the Group was well positioned as a result of the investment phase that we had just concluded. I am glad to report that we saw this starting to come through with a record increase in order book in 2016, resulting in increased capacity utilization across facilities that supply the regional power utilities from less than 10% in the past to 40%. On the back of this success, we have rolled over into 2017 the largest contracted order book in our history. Going forward, increased stakeholder engagement in our operating markets and enhanced local content laws will further drive demand which we are well positioned to meet with the available capacity headroom. On regional performance, we recorded a 44% increase in revenues from Tanzania, Uganda, Rwanda and Democratic Republic of Congo, increasing the revenue contribution from these markets to 36% up from 17% in In line with our focus on prudent working capital management, initiative undertaken during the year saw the Group release KShs 3.3 billion from inventory and receivables, leading to a positive cash from operations position of KShs 0.8 billion. Cash from Operations (KShs billion) Let us now turn our attention to the Divisions performance. The Power Division recorded a marginal 6% drop in revenue despite limited access to credit and an 8% drop in the London Metal Exchange (LME) metal price for Copper. Operating loss however reduced by 18% driven by improvement in margins. In this Division, we saw a significant increase in the utility business driven by aggressive commercial activity and capacity availability in our plants. The Division exited the year with a contracted order book in excess of KShs 4 billion with strong projected demand driven by continued electrification to meet set development goals and enhanced local content laws. In addition, growth of regional economies will continue to spur private sector demand driven by the construction sector and industrialisation, leading to great prospects in private uncontracted business. To sustain improvements in working capital management, the Division implemented measures aimed at enhancing its customer credit policy to promote cash or near cash trading terms, and adopting a just-in-time inventory system that is synchronized to market demand. The Division has deployed a proprietary lead generation and tracking information system that puts the businesses in direct contact with the end-consumers. This has enabled the Division to thoughtfully implement sales channels that improve the consumers experience and drive faster cash conversion. The Engineering Division had a 47% drop in revenues year on year attributed to a business down-cycle and compounded by limited access to credit which temporarily hampered its ability to participate in project bids and consequently revenue generation. Despite this challenge, the Division impressively delivered an unprecedented order book from new revenue streams. The orderbook currently stands in excess of KShs 12 billion whose execution is projected to be over the next 24 months. This increase was supported by a drive to diversify operations beyond traditional sources of revenue to new growth areas such as road construction among others. In the year under review, the division successfully participated in landmark projects including the Lake Turkana Wind Power Project in Kenya, upgrading of axle load control solutions on Kenyan highways and hydro power projects among others. We are quite pleased with our experience and competitive position in specialized engineering and although this business is prone to cyclicality, the capacity we have built over the years gives us the capability to diversify. To the extent we cannot eliminate cycles, we have responded with an ongoing organization redesign to create a responsive and fit for purpose structure that will ensure we are consistent in delivering a positive bottom line. I am confident that the Division s will remain a strong player in the region s infrastructure development. Summary and Outlook TransCentury started out by mobilizing local capital to acquire and build businesses of scale that needed transformation to reach their full potential. Since its foundation in 1997, the Group has recorded remarkable successes in various aspects including turning around some erstwhile struggling businesses and creating giants ANNUAL REPORT AND FINANCIAL STATEMENTS FOR THE YEAR ENDED 31ST DECEMBER
24 Chief Executive s Statement (continued)...we continue to build on our key strategic themes with focus on disciplined capital allocation through strategic investments and exits, optimization of our assets by a constant drive to increase utilization, and putting the right funding in place to exploit the great opportunities we have in front of us. Total Assets (KES bn) in their sectors. The Group has also tremendously transformed into a Pan-African organisation that has attracted considerable foreign capital and now boasts of a diverse board representation with global exposure and a management team with deep hands-on experience. We continue to draw on this strong foundation and great experience across our teams to steer the Group through the transitory turbulence and embark on profitable growth. As we look at the year ahead and beyond, we continue to build on our key strategic themes with focus on disciplined capital allocation through strategic investments and exits, optimization of our assets by a constant drive to increase utilization, and putting the right funding in place to exploit the great opportunities we have in front of us. On the funding side, the just completed equity transaction provides a positive catalyst in our quest to put the right funding in place to support business requirements and further improve our capital structure. The Group is also reviewing its debt-financing relationships with a view of rationalizing the number and matching tenor with funding need. On capital allocation, we are constantly looking out for the right investment opportunities as well as continue to review performance of our existing assets versus expectations, and where necessary, exit and redeploy capital to opportunities and assets that meet our return expectations. On asset optimization, we continue to challenge our businesses to improve operationally and increase utilization of existing assets. To support this, we will continue to relook at our organization design as well as enhancement of our human capital to drive performance. We are in the process of developing a dynamic organization structure that will enhance synergies and accountability at all levels, and improve control over invested capital. This process will also ensure a consistent approach to managing our business and people and is a demonstrable commitment to deliver long term value. Initial work commenced in October 2016 and implementation is ongoing. Finally, let me take this opportunity to further assure you that the focus of the leadership team at TransCentury is to return the Group into profitability and growth. Appreciation I take this opportunity to appreciate our clients and partners, all the staff at TransCentury Group and our stakeholders for your support, not forgetting the Board of Directors for their role in providing guidance and support throughout the year. Yours Sincerely, Nganga Njiinu, CFA Chief Executive Officer 24 ANNUAL REPORT AND FINANCIAL STATEMENTS FOR THE YEAR ENDED 31ST DECEMBER 2016
25 Report of the Directors The directors have pleasure in submitting their report together with the audited Group and Company financial statements for the year ended 31 December 2016, which disclose the state of affairs of the Group and Company. 1. Activities The Group s principal activity is investment in power infrastructure, transport infrastructure and engineering across Africa. 2. Results The Group s and Company s results for the year are set out on pages and 40 respectively. 3. Dividends The directors do not recommend the payment of a dividend (2015 Nil). 4. Directors The directors of the Company who served during the year up to the date of this report are set out on page Business Overview (a) Principal Risk Management (i) Strategic Risk Political instability The Group has operations in different jurisdictions which are affected by the political climate there. The Group has diversified operations across different countries, mitigating material impact on the business in case of unfavourable political climate in one country. Where an adverse political climate persists, we take proactive measures to safeguard our people and assets. Change in laws and regulations Any changes in laws and regulations have the potential to affect the Group either positively or negatively. Through our legal counsel, we obtain and assess the impact of any laws and regulations and put in place measures to align our businesses in order to ensure prudent capital allocation decisions and continue to deliver on our performance goals. Erosion of market share The Group strives to be the market leader in the sectors it operates in by offering customers the right solutions at the right time, in the right quality and at the most competitive price. Competition is the natural outcome in a free enterprise environment and we believe that a level playing field is key for all industry players. The Group continuously monitors the competitive landscape and strives to ensure that it excels at offering the best value for money to our customers. Change in consumer needs and technology trends The Group is a leader in bringing innovative solutions to the market. We constantly engage with customers and other stakeholders to understand their needs and how we can improve our product and service offering in order to serve them better. We incorporate more efficient and effective information and communication tools in managing client relations and business performance. ANNUAL REPORT AND FINANCIAL STATEMENTS FOR THE YEAR ENDED 31ST DECEMBER
26 Report of the Directors (continued) 5. Business Overview (continued) (a) Principal Risk Management (continued) (ii) Operational Risks Compliance to laws and regulations The Group is fully compliant with applicable laws and regulations in the markets and sectors we operate in. Global commodity price fluctuations The Group s operating businesses are affected by the price fluctuations in key commodities. We have adopted supplier agreements and pricing models that enable us to insulate the business from adverse price movements and ensure that there is sufficient compensation for value add. On the market side, upward fluctuation of some commodities may present demand risk for our engineering business, especially where customers delay projects due to collapse of commodity prices. An example is the oil price collapse that has impacted on the exploration activity in the region. We manage this risk through diversification of revenue streams. Supplier risk The Group ensures that all critical materials and supplies have multiple suppliers in an effort to address any supply-related risks. We constantly monitor global trends in the sourcing of key raw materials and align our procurement decisions to mitigate stock-out risks. Financing and currency risk Financing requirements for the Group are met through a mix of internally generated funds and debt. Debt in hard currency faces a depreciation risk due to fluctuations in the local currency. On the flip side, borrowing costs for local currency debt tend to be higher. The Group incurs a significant portion of its cost of production in hard currency including key raw materials and spare parts. The Group is able to obtain revenues in both local and hard currency, predominantly dollars, allowing us to operate a natural hedge. (b) Analysis of development and performance of the business in 2016 (i) Resolution of Convertible Eurobond In 2011 the Group issued a United States Dollar (USD) denominated convertible bond through one of its subsidiaries, TC Mauritius Holdings Limited amounting to USD 60,270,000 (KShs 5.1 billion). The convertible bond had a term of 5 year and matured on 25 March The Group successfully resolved the convertible bond during the year. (ii) Improvement in Capital Structure During the year, the Group strengthened its balance sheet by reducing our debt exposure by KShs 6 billion, resulting in a net reduction in debt of KShs 4 billion. This has significantly improved our balance sheet and eased short-term liquidity pressures. (iii) Improvement in Order Book The Group experienced a record increase in order book in 2016, closing the year with an orderbook in excess of KShs 16 billion. This increase has been driven by an aggressive drive of our commercial activity, Capital enhancement, improved regulation and enforcement of local content laws. (iv) Regional Diversification of Revenue Streams In 2016, the Group increased revenues from Tanzania, Uganda, Rwanda and Democratic Republic of Congo by 44%, increasing the contribution of these markets to 36% of total revenues compared to 17% in Regional diversification helps the Group continue to deliver performance despite any localised challenges in a given market, as happened in 2016 where revenues in South Sudan dropped by 98% as a result of the ongoing conflict experienced in that market. 26 ANNUAL REPORT AND FINANCIAL STATEMENTS FOR THE YEAR ENDED 31ST DECEMBER 2016
27 Report of the Directors (continued) 5. Business Overview (continued) (c) Analysis of the company s financial position at the end of the year The Group incurred a loss of KShs 0.86 billion during the year ended 31 December 2016 (2015 KShs 2.4 billion), and as of that date, the Group s current liabilities exceeded its current assets by KShs 5.6 billon (2015- KShs 5.1 billion). The Group has put in place detailed action plans to ensure it meets its obligations as and when they fall due. Key of these are: Restructure of balance sheet structure to avail funding for growth. Organisation alignment to develop a dynamic structure that is responsive to market changes. Increased utilisation of expanded manufacturing capacity to achieve better efficiencies and margins Disciplined management of working capital in order to enhance cash generation Strengthening of linkages with customers through information and technology leading to enhanced profitability. (d) Main trends affecting future development The following key trends have an effect on our business and demonstrate the opportunity in the markets and sectors we operate in: Low electricity access rates in Sub-Saharan Africa, creating a window of opportunity for existing players. Government-driven national development plans seeking to propel the economies to middle-income levels, including development of power generation plants, transmission and distribution infrastructure, further expanding the need for TransCentury Group s products and services. Growth in access to electricity stimulating private sector demand for our products and services. The enforcement of the Government s policy favouring local sourcing of key products and services. Construction and industrialisation as a result of increasing urbanisation and transition to middle income economies creating demand for construction services, industrial and electrical products. Development of the oil & gas sector. The discovery of natural resources such as on-shore oil in Northern Kenya and the large gas deposits in Southern Tanzania is creating significant opportunities as the Group continues to serve its oil and gas clients on their infrastructure needs. Expanded and modernized facilities across the Group will provide additional capacity and flexibility to offer a wide product range to cover the Eastern and Central African region. (e) Environment matters The operating Divisions have well-documented health, safety and environment policies and procedures. The Group strives at benchmarking the policies and procedures in line with international best practice. (f) Information on Employees Group Headquarters Kenya Uganda Tanzania Zambia DRC South Africa TOTAL TOTAL The Group directly employed 1,550 staff members by the end of 2016, spread across 6 countries. The Group also provides indirect employment opportunities for our suppliers and partners across the regions. (g) Social and community issues CSR The Group has partnered with technical institutions to provide internship opportunities to students in the electrical and electronics, engineering, building and construction faculties. This is in addition to scholarship support to top performing students in the mentioned faculties as well as upgarding of facilities and learning tools. ANNUAL REPORT AND FINANCIAL STATEMENTS FOR THE YEAR ENDED 31ST DECEMBER
28 Report of the Directors (continued) 5. Business Overview (continued) (h) Contractual Agreements The Group and its subsidiaries enter into contractual arms-length agreements in the normal course of business. These agreements are subject to laid down internal procedures and approvals to protect the Group from unanticipated negative consequences. AEA, a subsidiary company, holds exclusive distribution and agency rights for various mission critical products such as Weighing (Avery Weigh Tronix-UK, Avery Berkel-UK, Railweight-UK, IRCanada and Salter Brecknell-UK), Coding (Videojet-USA), Industrial products (INA/FAG-Germany and Redhill-UK), Generators (TCL Power/CGM-Italy, General Electric-USA and Turbomach-USA) and the recently introduced rapid road maintenance technology known as Velocity Patching (Velocity-UK). 6. Auditors The auditors of the company, KPMG Kenya, continue in office in accordance with the requirements of the Kenyan Companies Act, Relevant audit information The directors in office at the date of this report confirm that: (i) There is no relevant audit information of which the Group and Company s auditor is unaware; and (ii) Each of the directors have taken all the steps that they ought to have taken as a director so as to be aware of any relevant audit information and to establish that the Group and company s auditor is aware of that information. 8. Approval of financial statements The financial statements were approved at a meeting of the directors held on 8th June 2017 BY ORDER OF THE BOARD Virginia Ndunge Secretary Date: 8th June ANNUAL REPORT AND FINANCIAL STATEMENTS FOR THE YEAR ENDED 31ST DECEMBER 2016
29 Directors Remuneration Report The Directors Remuneration Report sets out the policy that the Group and Company has applied to remunerate executive and non-executive directors. The report has been prepared in accordance with the relevant provisions of the CMA code of Corporate Governance and the requirements of the Kenyan Companies Act, The Group and Company s Nominations and Remuneration Committee of the board is responsible for overseeing and monitoring the company s corporate governance policies, practices and guidelines. The Committee is mandated to review the remuneration of non-executive directors to ensure that the same is competitive and aligned with the business strategy and long-term objectives of the Company. Executive Directors Executive directors are remunerated in accordance with the staff remuneration policy. Their remuneration package comprises a base salary, pension and other benefits designed to recognize the skills and experience of executive directors. Non-Executive Directors In recognition of their contribution to the Company, non-executive directors receive fees as well as sitting allowances for Board and Committee meetings. The fees are approved by Shareholders at Annual General Meetings and is payable on a monthly basis. The non-executive directors are not covered by the Company s incentive programs and do not receive performance-based remuneration. No pension contributions are payable on their fees. Travel and related expenses The Company, however reimburses travel and accommodation expenses related to attendance at Board meetings. There is in place a travel policy for directors. Others During the year under review, there was no arrangement to which the Group and Company was a party where directors acquired benefits by means of transactions in the Group and Company s shares outside applicable law. The Group has a strict insider trading policy to which the directors and senior management must adhere to. There were no directors loans at any time during the year ended. The aggregate amount of emoluments received by the executive and non-executive directors from the Group and Company during the year ended 31st December 2016 was KShs 43 million and KShs 7 million (2015- KShs 45 million and KShs 11 million) respectively as disclosed under Note 28(a). ANNUAL REPORT AND FINANCIAL STATEMENTS FOR THE YEAR ENDED 31ST DECEMBER
30 Statement of Directors Responsibilities The directors are responsible for the preparation and fair presentation of the consolidated and company financial statements of TransCentury Limited set out on pages 38 to 115 which comprise the consolidated and company statements of financial position at 31st December 2016, the consolidated and company statements of profit or loss and other comprehensive income, the consolidated and company statements of changes in equity, the consolidated and company statements of cash flows for the year then ended, and notes to the financial statements which include a summary of significant accounting policies and other explanatory information. The directors responsibilities include: determining that the basis of accounting described in Note 2 is an acceptable basis for preparing and presenting the financial statements in the circumstances, preparation and fair presentation of financial statements in accordance with International Financial Reporting Standards and in the manner required by the Kenyan Companies Act, 2015 and for such internal control as the directors determine is necessary to enable the preparation of financial statements that are free from material misstatements, whether due to fraud or error. Under the Kenyan Companies Act, 2015, the directors are required to prepare financial statements for each financial year which give a true and fair view of the state of affairs of the group and the company as at the end of the financial year and of the operating results of the group for that year. It also requires the Directors to ensure the group keeps proper accounting records which disclose with reasonable accuracy the financial position of the group and the company. The directors accept responsibility for the annual financial statements, which have been prepared using appropriate accounting policies supported by reasonable and prudent judgements and estimates, in compliance with International Financial Reporting Standards and in the manner required by the Kenyan Companies Act, The directors are of the opinion that the financial statements give a true and fair view of the state of the financial affairs of the group and the company and of the group operating results. The directors further accept responsibility for the maintenance of accounting records which may be relied upon in the preparation of financial statements, as well as adequate systems of internal financial control. The directors have made an assessment of the company and its subsidiaries ability to continue as a going concern and have no reason to believe the company and its subsidiaries will not be a going concern for at least the next twelve months from the date of this statement based on initiatives disclosed at note 2(f ). Approval of the financial statements The consolidated and separate financial statements, as indicated above, were approved by the Board of Directors on 8th June 2017 and were signed on its behalf by: Shaka Kariuki Chairman Nganga Njiinu Director Date: 8th June ANNUAL REPORT AND FINANCIAL STATEMENTS FOR THE YEAR ENDED 31ST DECEMBER 2016
31 Report of the Independent Auditors Report on the audit of the consolidated and separate financial statements Opinion We have audited the consolidated and company financial statements of TransCentury Limited set out on pages 38 to 115 which comprise the consolidated and company statements of financial position as at 31 December 2016, and the consolidated and company statements of profit or loss and other comprehensive income, the consolidated and company statements of changes in equity, the consolidated and company statements of cash flows for the year then ended, and notes to the financial statements, including a summary of significant accounting policies and other explanatory information. In our opinion, the accompanying consolidated and separate financial statements give a true and fair view of the consolidated and separate financial position of TransCentury Limited as at 31 December 2016, and of its consolidated and separate financial performance and consolidated and separate cash flows for the year then ended in accordance with International Financial Reporting Standards and the requirements of the Kenyan Companies Act, Basis for opinion We conducted our audit in accordance with International Standards on Auditing (ISAs). Our responsibilities under those standards are further described in the Auditor s Responsibilities for the Audit of the Consolidated and Separate Financial Statements section of our report. We are independent of the Group and Company in accordance with the International Ethics Standards Board for Accountants Code of Ethics for Professional Accountants (IESBA Code) together with the ethical requirements that are relevant to our audit of the financial statements in Kenya, and we have fulfilled our other ethical responsibilities in accordance with these requirements and the IESBA Code. We believe that the audit evidence we have obtained is sufficient and appropriate to provide a basis for our opinion. Key audit matters Key audit matters are those matters that, in our professional judgment, were of most significance in our audit of the consolidated and company financial statements of the current period. These matters were addressed in the context of our audit of the consolidated and company financial statements as a whole, and in forming our opinion thereon, and we do not provide a separate opinion on these matters. ANNUAL REPORT AND FINANCIAL STATEMENTS FOR THE YEAR ENDED 31ST DECEMBER
32 Report of the Independent Auditors (continued) Report on the audit of the consolidated and separate financial statements (continued) Key audit matters (continued) Going Concern (applicable to the consolidated and separate financial statements) See Note 2(f) to the financial statements Key audit matter The directors have prepared the financial statements on the basis of accounting applicable to a going concern and have disclosed considerations informing their judgement in Note 2(f ). We considered the following financial and operational indicators in application of the going concern basis of accounting and the related disclosures in these financial statements: the losses incurred by the group and the company in the current year as well as in prior years; the net current liability position of the group and the company as at 31 December 2016; the group s and the company s significant loans due to mature within the next 12 months from 31 December 2016; and the negotiations with key lenders for restructuring of the debt agreements. Due to the significant judgements and assumptions made by the directors in their evaluation of the group s and the company s ability to continue as going concerns, we considered this to be a key audit matter. How the matter was addressed Our audit procedures in this area included, among others evaluation of the directors assessment of the group s and the company s going concern for at least the next 12 months from the approval of these financial statements by: examining the group s and the company s forecast cash flows and understanding the underlying assumptions that the directors have used in preparing these cash flow forecasts. This involved evaluating the reasonableness of these forecasts based on evidence provided to support the underlying assumptions, including inspection of the order book under execution in 2017; recalculating the forecast compliance with the terms of the bank covenants to which the group and the company are subject, taking account of the relevant terms of the securitised debt structure; understanding the status of the ongoing debt restructuring negotiations with existing lenders through reading of correspondence between the directors and the existing lenders; comparing the actual performance after year end for the first quarter of 2017 to the budget in order to determine the reasonableness of the budget and the projected performance; and evaluation of the appropriateness of the disclosures made in the financial statements in respect of going concern. 32 ANNUAL REPORT AND FINANCIAL STATEMENTS FOR THE YEAR ENDED 31ST DECEMBER 2016
33 Report of the Independent Auditors (continued) Report on the audit of the consolidated and separate financial statements (continued) Key audit matters (continued) Valuation of unquoted investments (applicable to the consolidated and separate financial statements) See Note 14(b) to the financial statements Key audit matter The valuation of unquoted investments is determined by the Group and Company through application of valuation techniques which involved the exercise of significant judgment by the Group and Company as well as the use of assumptions and estimates which include a comparison of price to net assets value of companies similar to those the Group and Company has invested in. Valuation of unquoted investments is a key audit matter due to the estimation uncertainty and significant judgement involved in determination of inputs used in the valuation model. How the matter was addressed Our procedures included, among others; inspection of the valuation done by management which included: evaluating the methodologies, inputs and assumptions used by the Group and company in determining fair values; using our in-house valuation specialists to assist us in evaluating the valuation techniques, assumptions and methodologies used by the Group and Company, in particular, those relating to the cash flow projections, growth rates, terminal values and discount rates and re-performed an independent valuation assessment, considering sensitivities of the fair values to key factors used; and evaluating the appropriateness of the disclosures made in the financial statements in respect of the fair valuation in line with IFRS 13, Fair Value Measurements. Impairment of trade and other receivables (applicable to the consolidated and separate financial statements) See Note 17 to the financial statements Key audit matter Impairment loss on trade and other receivables represent directors estimation of loss that would occur from the Group and Company s trade and other receivable portfolios as at the end of period. Impairment of trade and other receivables is considered a key audit matter because the directors make significant and subjective judgments over both timing of recognition of impairment and the estimation of the size of any such impairment. How the matter was addressed Our audit procedures included, among others; understanding and evaluating key controls over the credit management process, to assess if the credit assessment on the counterparties were appropriate and doubtful accounts were identified, on a timely basis, as impaired; evaluating the key assumptions and judgments made by the directors that underlie the calculation of impairment loss, such as the timing of cash flows and identification of the triggering event; performing substantive procedures to evaluate the completeness of the customer accounts included in the impairment calculation; and inspecting on a sample basis, the aging of the invoices, subsequent receipts and making inquiry about potential disputes on the invoiced amounts. ANNUAL REPORT AND FINANCIAL STATEMENTS FOR THE YEAR ENDED 31ST DECEMBER
34 Report of the Independent Auditors (continued) Report on the audit of the consolidated and separate financial statements (continued) Key audit matters (continued) Recognition of deferred tax asset (applicable to the consolidated financial statements) See note 24 to the financial statements. Key audit matter In arriving at the deferred tax asset and liability recognised on the consolidated statement of financial position at 31 December 2016, the group recognised deferred tax assets relating to unused tax losses. The recoverability of recognised deferred tax asset is, in part, dependent on the group and company s ability to generate future taxable profits sufficient to utilise deductible temporary differences and tax losses before they expire. We determined this to be a key audit matter due to the inherent uncertainty in forecasting the amount and timing of future taxable profits and the reversal of temporary differences and utilisation of tax losses. How the matter was addressed Our audit procedures included, among others, evaluating the tax computations performed by the Group s and company s tax agents to assess the recognition and measurement of the current and deferred tax assets and liabilities and evaluate compliance with the relevant tax legislation; challenging directors assumptions used to determine the manner in which the timing differences, including the recoverability of the deferred tax assets that would be realised by comparing assumptions to evidence obtained in respect of other areas of the audit, including cash flow forecasts, business plans, and minutes of directors meetings as well as our knowledge of the business; assessing whether the conditions for recognition of deferred tax asset on unutilised tax losses in IAS 12, Income taxes have been met; and assessing the adequacy of the Group s and Company s disclosure included in Note 24 relating to deferred taxes. Goodwill impairment (applicable to the consolidated financial statements) See Note 13 to the financial statements Key audit matter Under IFRSs, the Group is required to annually test the amount of goodwill for impairment. Goodwill impairment is a key audit matter because the assessment process is complex and highly judgmental and is based on assumptions that are affected by expected future market or economic conditions, particularly those in Mauritius, South Africa and Tanzania. A small change in the key assumptions used could give rise to an impairment of the goodwill balance in the future. How the matter was addressed Our audit procedures included, among others, using a valuation expert to evaluate the assumptions and methodologies used by the Group, in particular those relating to the forecasted revenue growth and profit margins for Civicon Africa Group Limited, Tanelec Limited and TransCentury Holdings Pty Limited; evaluating the performance of the subsidiaries to identify indicators of impairment of goodwill relating to those subsidiaries; challenging those assumptions to which the outcome of the impairment test is most sensitive, that is, those that have the most significant effect on the determination of the recoverable amount of goodwill; and assessing the adequacy of the Group s disclosures included in Note 13 to the consolidated financial statements. 34 ANNUAL REPORT AND FINANCIAL STATEMENTS FOR THE YEAR ENDED 31ST DECEMBER 2016
35 Report of the Independent Auditors (continued) Report on the audit of the consolidated and separate financial statements (continued) Key audit matters (continued) Measurement of investment in subsidiaries (applicable to the separate financial statements) See notes 14(c) to the financial statements. Key audit matter The Company s investment in subsidiaries is accounted for at fair value. The fair value of investments in subsidiaries is determined by the Company using valuation techniques such as discounted cash flow method, enterprise value to earnings before interest, tax and depreciation multiple. These valuation techniques involves the exercise of significant judgment, use of assumptions and estimates by the directors. Investment in subsidiaries is a key audit matter because of the significance of the amounts involved and the related estimation uncertainty, particularly on the use of unobservable inputs in the valuation. How the matter was addressed Our procedures involved among others; evaluating the methodologies, inputs and assumptions used by the directors in determining fair values; we used our in-house valuation specialists to assist us in evaluating the valuation techniques, assumptions and methodologies used by the Group and Company, in particular, those relating to the cash flow projections, growth rates, terminal values and discount rates used in the valuation model; we challenged assumptions used in the valuation model based on our understanding of the company and it s subsidiaries; and evaluating the appropriateness of the disclosures made in the financial statements in respect of the fair valuation in line with IFRS 13, Fair Value Measurements. Contingent liabilities in respect of claim and litigations (applicable to the consolidated financial statements See notes 32 to the financial statements. Key audit matter The Group is subject to claims, which could have an impact on the Group s results if the potential exposures were to materialise. In the normal course of business, potential exposures may arise from general legal proceedings, product liability and guarantees. Whether there is a liability is inherently uncertain, the amounts involved are potentially significant and the application of accounting standards to determine the amount, if any, to be provided as a liability, is inherently subjective. This is considered a key audit matter because the directors apply significant judgment when considering whether, and how much, to provide for the potential exposure of each litigation or make disclosures in the financial statements. How the matter was addressed Our audit procedures in this area included, among others: performing control assessment of the processes and controls put in place by the directors over claims and litigations; holding discussions with the Group s management regarding the nature of all significant on-going claims and legal cases, and to validate the latest status and accounting and disclosure implications. obtaining legal confirmations from the Company and Group s external counsel for significant litigation matters to ensure completeness of provisioning and to evaluate their assessment of exposures; analysing correspondence with regulators for potential exposures; Assessing the adequacy of the Group s disclosures in relation to contingencies. ANNUAL REPORT AND FINANCIAL STATEMENTS FOR THE YEAR ENDED 31ST DECEMBER
36 Report of the Independent Auditors (continued) Report on the audit of the consolidated and separate financial statements (continued) Other information The directors are responsible for the other information. The other information comprises the information included in the 2016 Annual Report And Financial Statements, but does not include the consolidated and separate financial statements and our auditors report thereon. Our opinion on the consolidated and separate financial statements does not cover the other information and we do not and will not express any form of assurance conclusion thereon. In connection with our audit of the consolidated and separate financial statements, our responsibility is to read the other information identified above and, in doing so, consider whether the other information is materially inconsistent with the consolidated and separate financial statements or our knowledge obtained in the audit, or otherwise appears to be materially misstated. If, based on the work we have performed on the other information that we obtained prior to the date of this auditor s report, we conclude that there is a material misstatement of this other information, we are required to report that fact. We have nothing to report in this regard. Responsibilities of the directors for the consolidated and separate financial statements As stated on page 30, the directors are responsible for the preparation of the consolidated and company financial statements that give a true and fair view in accordance with International Financial Reporting Standards and the requirements of the Kenyan Companies Act, 2015, and for such internal control as the directors determine is necessary to enable the preparation of consolidated and separate financial statements that are free from material misstatement, whether due to fraud or error. In preparing the consolidated and company financial statements, the directors are responsible for assessing the group s and the company s ability to continue as a going concern, disclosing, as applicable, matters related to going concern and using the going concern basis of accounting unless the directors either intend to liquidate the group and/or the company or to cease operations, or have no realistic alternative but to do so. The directors are responsible for overseeing the Group and Company s financial reporting process. Auditor s responsibilities for the audit of the consolidated and separate financial statements Our objectives are to obtain reasonable assurance about whether the consolidated and separate financial statements as a whole are free from material misstatement, whether due to fraud or error, and to issue an auditor s report that includes our opinion. Reasonable assurance is a high level of assurance, but is not a guarantee that an audit conducted in accordance with ISAs will always detect a material misstatement when it exists. Misstatements can arise from fraud or error and are considered material if, individually or in the aggregate, they could reasonably be expected to influence the economic decisions of users taken on the basis of these consolidated and separate financial statements. As part of an audit in accordance with ISAs, we exercise professional judgement and maintain professional skepticism throughout the audit. We also: - Identify and assess the risks of material misstatement of the consolidated and separate financial statements, whether due to fraud or error, design and perform audit procedures responsive to those risks, and obtain audit evidence that is sufficient and appropriate to provide a basis for our opinion. The risk of not detecting a material misstatement resulting from fraud is higher than for one resulting from error, as fraud may involve collusion, forgery, intentional omissions, misrepresentations, or the override of internal control. - Obtain an understanding of internal control relevant to the audit in order to design audit procedures that are appropriate in the circumstances, but not for the purpose of expressing an opinion on the effectiveness of the group s and the company s internal control. - Evaluate the appropriateness of accounting policies used and the reasonableness of accounting estimates and related disclosures made by the directors. 36 ANNUAL REPORT AND FINANCIAL STATEMENTS FOR THE YEAR ENDED 31ST DECEMBER 2016
37 Report of the Independent Auditors (continued) Responsibilities of the directors for the consolidated and separate financial statements (continued) Auditor s responsibilities for the audit of the consolidated and separate financial statements (continued) - Conclude on the appropriateness of the directors use of the going concern basis of accounting and based on the audit evidence obtained, whether a material uncertainty exists related to events or conditions that may cast significant doubt on the group s and the company s ability to continue as a going concern. If we conclude that a material uncertainty exists, we are required to draw attention in our auditor s report to the related disclosures in the consolidated and separate financial statements or, if such disclosures are inadequate, to modify our opinion. Our conclusions are based on the audit evidence obtained up to the date of our auditor s report. However, future events or conditions may cause the group and / or the company to cease to continue as a going concern. - Evaluate the overall presentation, structure and content of the consolidated and separate financial statements, including the disclosures, and whether the consolidated and separate financial statements represent the underlying transactions and events in a manner that achieves fair presentation. - Obtain sufficient appropriate audit evidence regarding the financial information of the entities or business activities within the group to express an opinion on the consolidated financial statements. We are responsible for the direction, supervision and performance of the group audit. We remain solely responsible for our audit opinion. We communicate with the directors regarding, among other matters, the planned scope and timing of the audit and significant audit findings, including any significant deficiencies in internal control that we identify during our audit. We also provide the directors with a statement that we have complied with relevant ethical requirements regarding independence, and to communicate with them all relationships and other matters that may reasonably be thought to bear on our independence, and where applicable, related safeguards. From the matters communicated with the directors, we determine those matters that were of most significance in the audit of the consolidated and separate financial statements of the current period and are therefore the key audit matters. We describe these matters in our auditor s report unless law or regulation precludes public disclosure about the matter or when, in extremely rare circumstances, we determine that a matter should not be communicated in our report because the adverse consequences of doing so would reasonably be expected to outweigh the public interest benefits of such communication. Report on other legal and regulatory requirements As required by the Kenyan Companies Act, 2015 we report to you, based on our audit, that: (i) We have obtained all the information and explanations, which to the best of our knowledge and belief were necessary for the purpose of our audit; (ii) In our opinion, proper books of account have been kept by the Company, so far as appears from our examination of those books; and (iii) The Company s statement of financial position is in agreement with the books of account. The Engagement Partner responsible for the audit resulting in this independent auditors report is FCPA Eric Aholi - P/1471. KPMG Kenya Certified Public Accountants 8th Floor, ABC Towers ABC Place, Waiyaki Way PO Box Nairobi Date: 8th June 2017 ANNUAL REPORT AND FINANCIAL STATEMENTS FOR THE YEAR ENDED 31ST DECEMBER
38 Consolidated Statement of Profit or Loss and other Comprehensive Income Note KShs 000 KShs 000 Revenue 5(a) 8,177,350 11,790,227 Cost of sales 5(c) (7,109,323) ( 9,259,631) Gross profit 1,068,027 2,530,596 Other income 5(b) 2,064,969 94,903 Operating expenses 5(c) (2,591,643) ( 2,499,253) Profit before depreciation and finance costs 541, ,246 Impairment losses 4(a) ( 724,202) ( 371,576) Depreciation and amortisation 6 ( 719,184) ( 802,019) Results from operating activities ( 902,033) ( 1,047,349) Exchange losses 7(a) ( 94,012) ( 1,117,495) Interest expenses 7(b) ( 619,056) ( 791,229) Net finance costs ( 713,068) ( 1,908,724) Loss before income tax (1,615,101) ( 2,956,073) Income tax credit 8(a) (i) 751, ,499 Loss for the year ( 863,890) ( 2,422,574) Other comprehensive income Items that will never be reclassified to profit or loss Revaluation of property, plant and equipment 9-705,240 Revaluation of prepaid operating lease rentals , ,370 Related tax 8(a) (ii) ( 98,469) ( 460,384) 229,219 1,074,226 Items that are or may be reclassified to profit or loss Net change in fair value of available-for-sale financial assets 14 (d) ( 171,764) ( 16,746) Exchange differences on translation of foreign subsidiaries ( 52,005) ( 431,746) ( 223,769) ( 448,492) Total other comprehensive income net of income tax 5, ,734 Total comprehensive income for the year ( 858,440) ( 1,796,840) The notes set out on pages 48 to 115 form an integral part of these financial statements. 38 ANNUAL REPORT AND FINANCIAL STATEMENTS FOR THE YEAR ENDED 31ST DECEMBER 2016
39 Consolidated Statement of Profit or Loss and other Comprehensive Income Loss after tax is attributable to: Note KShs 000 KShs 000 Equity holders of the company (440,135) (1,988,223) Non-controlling interest (NCI) 14(e) (423,755) ( 434,351) Loss for the year (863,890) (2,422,574) Total comprehensive income for the year is attributable to: Equity holders of the company (487,215) (1,887,771) Non-controlling interest (371,225) 90,931 Total comprehensive income for the year (858,440) (1,796,840) BASIC AND DILUTED EARNINGS PER SHARE (KShs) 22(a) ( 1.56) (7.09) The notes set out on pages 48 to 115 form an integral part of these financial statements. ANNUAL REPORT AND FINANCIAL STATEMENTS FOR THE YEAR ENDED 31ST DECEMBER
40 Company Statement of Profit or Loss and other Comprehensive Income Note KShs 000 KShs 000 Income Revenue 5(a) 261, ,940 Other income/(loss) 5(b) 400 ( 44) 261, ,896 Operating expenses 5(c) (318,371) (362,325) Loss before depreciation and finance costs ( 56,826) (63,429) Impairment losses 4 (a) (262,303) - Depreciation and amortisation 6 ( 4,411) ( 4,620) Results from operating activities (323,540) ( 68,049) Foreign exchange loss 7(a) 53,876 (293,366) Finance cost 7(b) ( 54,119) ( 71,115) Net finance cost ( 243) (364,481) Loss before income tax ( 323,783) (432,530) Income tax expense 8(a) (i) ( 11,377) ( 2,359) Loss for the year (335,160) (434,889) Other comprehensive income Items that are or may be reclassified to profit or loss Net change in fair value of available-for-sale financial assets 14(d ) 987,702 (407,179) Other comprehensive income 987,702 (407,179) Total comprehensive income for the year 652,542 (842,068) The notes set out on pages 48 to 115 form an integral part of these financial statements. 40 ANNUAL REPORT AND FINANCIAL STATEMENTS FOR THE YEAR ENDED 31ST DECEMBER 2016
41 Consolidated Statement of Financial Position ASSETS Note KShs 000 KShs 000 Non-current assets Property, plant and equipment 9 7,557,934 7,836,618 Investment property , ,252 Prepaid operating lease rentals 12 1,668,419 1,409,032 Intangible assets 13 2,853,305 2,851,345 Quoted investments 14(a) Unquoted investments 14(b) 364, ,203 Deferred tax asset 24(a) 630, ,738 13,189,323 13,104,427 Current assets Inventories 16 1,265,223 1,899,763 Trade and other receivables 17 3,734,610 6,391,777 Tax recoverable 8(d) 352, ,651 Assets held for sale ,626 - Cash and cash equivalents 18(a) 124, ,363 5,722,229 8,713,554 TOTAL ASSETS 18,911,552 21,817,981 EQUITY AND LIABILITIES Capital and reserves (Pages 43-44) Share capital , ,142 Share premium , ,101 Revenue reserves 21(a) ( 1,499,203) ( 1,015,597) Translation reserve 21(b) ( 77,341) ( 77,814) Available-for-sale reserve 21(c) 142, ,067 Revaluation reserve 21(d) 1,698,847 1,538,394 Total equity attributable to equity holders of the company 1,026,496 1,464,293 Non-controlling interest 14(e) 1,472,284 2,081,477 Convertible loan 23(b) 1,331,086 - Total equity 3,829,866 3,545,770 LIABILITIES Non-current liabilities Deferred tax liability 24(b) 703, ,473 Liability for staff gratuity 25 41,871 45,707 Convertible loan 23(b) 718,630 - Bond non-current portion 23(a) 1,232,332 - Long term loan non-current portion 26 1,023,449 3,511,955 3,719,601 4,437,135 Current liabilities Bank overdraft 18(a) 320, ,074 Long term loan current portion 26 5,292,164 2,827,692 Trade and other payables 27 4,900,924 4,273,688 Bond current portion 23(a) 821,592 6,083,468 Tax payable 8(d) 27,017 11,910 Unclaimed dividends ,362,085 13,835,076 Total liabilities 15,081,686 18,272,211 TOTAL EQUITY AND LIABILITIES 18,911,552 21,817,981 The financial statements on pages 38 to 115 were approved by the Board of Directors on 8 June 2017 and were signed on its behalf by: Shaka Kariuki Nganga Njiinu Director Director The notes set out on pages 48 to 115 form an integral part of these financial statements. ANNUAL REPORT AND FINANCIAL STATEMENTS FOR THE YEAR ENDED 31ST DECEMBER
 10,123,245 8,979,295 Loans to subsidiaries 15 856,720 808,015 Deferred tax asset 24(a) 1,722 1,480 11,258,925 10,226,624 Current assets Trade and")
42 Company Statement of Financial Position ASSETS Note KShs 000 KShs 000 Non-current assets Property and equipment 9 4,804 9,154 Quoted investments 14(a) Unquoted investments 14(b) 272, ,441 Investment in subsidiaries 14(c) 10,123,245 8,979,295 Loans to subsidiaries , ,015 Deferred tax asset 24(a) 1,722 1,480 11,258,925 10,226,624 Current assets Trade and other receivables , ,675 Tax recoverable 8(d) 2,087 5,205 Cash and bank balances 18(a) 1,182 7, , ,593 TOTAL ASSETS 11,912,806 11,157,217 EQUITY AND LIABILITIES Capital and reserves (Page 45) Share capital , ,142 Share premium , ,101 Revenue reserves 21(a) ( 606,838) ( 271,678) Available-for-sale reserve 21(c) 8,634,609 7,646,907 Total equity 8,789,661 8,080,472 Non-current liabilities Long term loan non-current portion ,233 Current liabilities Long term loan current portion 26 2,594,364 1,780,338 Trade and other payables , ,930 Unclaimed dividends ,123,145 2,128,512 Total liabilities 3,123,145 3,076,745 TOTAL EQUITY AND LIABILITIES 11,912,806 11,157,217 The financial statements on pages 38 to 115 were approved by the Board of Directors on 8 June 2017 and were signed on its behalf by: Shaka Kariuki Director Nganga Njiinu Director The notes set out on pages 48 to 115 form an integral part of these financial statements. 42 ANNUAL REPORT AND FINANCIAL STATEMENTS FOR THE YEAR ENDED 31ST DECEMBER 2016
43 Consolidated Statement of Changes in Equity Available Non- Share Share Revaluation Translation for sale Revenue controlling Total 2016: capital premium reserves reserve reserve reserves Total interest equity KShs 000 KShs 000 KShs 000 KShs 000 KShs 000 KShs 000 KShs 000 KShs 000 KShs 000 Balance at 1 January , ,101 1,538,394 (77,814) 314,067 (1,015,597) 1,464,293 2,081,477 3,545,770 Total comprehensive income for the year net of tax Loss for the year ( 440,135) ( 440,135) ( 423,755) ( 863,890) Other comprehensive income Revaluation of leases, property, plant and equipment , ,381 98, ,688 Deferred tax on revaluation - - (68,928) (68,928) (29,541) (98,469) Exchange differences (35,768) - - ( 35,768) ( 16,237) ( 52,005) Net change in fair value of available-for-sale financial assets (171,764) - ( 171,764) - ( 171,764) Transfer from translation reserves ,241 - ( 36,241) Transfer from revaluation reserve Total other comprehensive income , (171,764) ( 36,241) ( 47,079) 52,529 5,450 Total comprehensive income , (171,764) ( 476,376) ( 487,214) ( 371,226) ( 858,440) Transactions with owners of the Company Issue of new shares on bond Conversion , ,647-56,647 Acquisition of NCI without change in control (Note 14(f )) ( 7,230) ( 7,230) ( 237,967) ( 245,197) Total transactions with owners of the company , ( 7,230) 49,417 ( 237,967) ( 188,550) Balance at 31 December , ,177 1,698,847 (77,341) 142,303 (1,499,203) 1,026,496 1,472,284 2,498,780 The notes set out on pages 48 to 115 form an integral part of the financial statements. ANNUAL REPORT AND FINANCIAL STATEMENTS FOR THE YEAR ENDED 31ST DECEMBER
44 Consolidated Statement of Changes in Equity Available Non- Share Share Revaluation Translation for sale Revenue controlling Total 2015: capital premium reserves reserve reserve reserves Total interest equity KShs 000 KShs 000 KShs 000 KShs 000 KShs 000 KShs 000 KShs 000 KShs 000 KShs 000 Balance at 1 January , , , , ,813 1,278,346 3,558,722 2,536,003 6,094,725 Total comprehensive income for the year net of tax Loss for the year ( 1,988,223) (1,988,223) ( 434,351) (2,422,574) Other comprehensive income Revaluation of leases, property, plant and equipment , , ,397 1,534,610 Deferred tax on revaluation - - (236,764) ( 236,764) ( 223,620) ( 460,384) Exchange differences (435,251) - - ( 435,251) 3,505 ( 431,746) Net change in fair value of available-for-sale financial assets (16,746) - ( 16,746) - ( 16,746) Transfer from translation reserves ,749 - ( 93,749) Transfer from revaluation reserve - - ( 8,440) 7, Total other comprehensive income ,009 (333,822) (16,746) ( 92,989) 100, , ,734 Total comprehensive income ,009 (333,822) (16,746) (2,081,212) (1,887,771) 90,931 (1,796,840) Transactions with owners of the Company Acquisition of NCI without change in control (Note 14(f )) ,073 - ( 212,731) ( 206,658) ( 505,429) ( 712,087) Dividend paid ( 40,028) ( 40,028) Total transactions with owners of the company ,073 - ( 212,731) ( 206,658) ( 545,457) ( 752,115) Balance at 31 December , ,101 1,538,394 ( 77,814) 314,067 (1,015,597) 1,464,293 2,081,477 3,545,770 The notes set out on pages 48 to 115 form an integral part of the financial statements. 44 ANNUAL REPORT AND FINANCIAL STATEMENTS FOR THE YEAR ENDED 31ST DECEMBER 2016
45 Company Statement of Changes in Equity Share Share Available for Revenue capital premium sale reserve reserves Total KShs 000 KShs 000 KShs 000 KShs 000 KShs : Balance at 1 January , ,101 7,646,907 (271,678) 8,080,472 Total comprehensive income for the year Loss for the year (335,160) (335,160) Other comprehensive income for the year Net change in fair value of available-for-sale financial assets , ,702 Total comprehensive income ,702 (335,160) 652,542 Transactions with owners of the Company Issuance of new shares/conversion of bond , ,647 Balance as at 31 December , ,177 8,634,609 (606,838) 8,789, : Balance at 1 January , ,101 8,054, ,211 8,922,540 Total comprehensive income for the year Loss for the year (434,889) ( 434,889) Other comprehensive income for the year Net change in fair value of available-for-sale financial assets - - ( 407,179) - ( 407,179) Total comprehensive income - - ( 407,179) (434,889) ( 842,068) Balance as at 31 December , ,101 7,646,907 (271,678) 8,080,472 The notes set out on pages 48 to 115 form an integral part of the financial statements. ANNUAL REPORT AND FINANCIAL STATEMENTS FOR THE YEAR ENDED 31ST DECEMBER
46 Consolidated Statement of Cash Flows Note KShs 000 KShs 000 Net cash flows from operating activities Loss before taxation (1,615,101) (2,956,073) Adjustment for non-cash items (1,233,886) 1,230,767 Operating loss before working capital changes (2,848,987) (1,725,306) Working capital changes: Trade and other receivables 2,657,167 ( 505,189) Inventories 634,540 ( 39,755) Trade and other payables 18 (b) 382,039 1,604,413 Provision for staff gratuity ( 3,836) ( 13,441) Cash generated from/(used in) operations 820,923 ( 679,278) Income tax paid 8(e) ( 153,872) ( 87,838) Dividends paid to non-controlling interest - ( 40,028) Net cash flows from/(used in) operating activities 667,051 ( 807,144) Cash flows from/(used in) investing activities Purchase of property, plant and equipment 9 ( 518,559) ( 909,453) Purchase of intangible assets 13(a) ( 6,383) ( 6,280) Proceeds from disposal of property, plant and equipment 33,514 19,711 Net cash flows used in investing activities ( 491,428) ( 896,022) Cash flows from financing activities Acquisition of non-controlling interests - ( 712,087) Proceeds from loans and borrowing 26 3,107,349 7,043,479 Repayment of loans and borrowing 26 (3,131,383) (4,227,286) Interest paid on convertible bond 23 - ( 348,891) Proceeds from Kuramo convertible loan 23(b) 2,049,716 - Partial settlement of convertible bond 23(a) (1,994,709) - Net cash flows from financing activities 30,973 1,755,215 Net increase in cash and cash equivalents 206,596 52,049 Cash and cash equivalents at 1 January 18 (a) ( 402,711) ( 454,760) Cash and cash equivalents at 31 December 18 (a) ( 196,115) ( 402,711) The notes set out on pages 48 to 115 form an integral part of these financial statements. 46 ANNUAL REPORT AND FINANCIAL STATEMENTS FOR THE YEAR ENDED 31ST DECEMBER 2016
47 Company Statement of Cash Flows Note KShs 000 KShs 000 Net cash flows from operating activities Loss before taxation (323,783) ( 432,530) Adjustment for non-cash items 7,819 46,797 Operating loss before working capital changes ( 315,964) ( 385,733) Working capital changes: Trade and other receivables 18(b) 323, ,175 Trade and other payables 180,607 ( 938,848) Loans to related parties ( 48,705) ( 89,820) Cash generated from/(used in) operations 139,646 (1,257,226) Income tax paid 8(e) ( 8,501) ( 2,733) Net cash flows generated from/(used in) operating activities 131,145 (1,259,959) Cash flows from investing activities Purchase of property, plant and equipment 9 ( 467) ( 4,813) Proceeds from disposal of property, plant and equipment Net cash flows generated from/(used in) investing activities 339 ( 4,561) Cash flows from financing activities Proceeds from loans and borrowings 26-1,576,450 Repayment of loans and borrowings 26 ( 134,207) ( 271,859) Interest received 5(a) 50,311 28,982 Interest paid 7(b) ( 54,119) ( 71,115) Net cash flows (used in)/generated from financing activities ( 138,015) 1,262,458 Net increase/ (decrease) in cash and cash equivalents ( 6,531) ( 2,062) Cash and cash equivalents at 1 January 18(a) 7,713 9,775 Cash and cash equivalents at 31 December 18(a) 1,182 7,713 The notes set out on pages 48 to 115 form an integral part of these financial statements. ANNUAL REPORT AND FINANCIAL STATEMENTS FOR THE YEAR ENDED 31ST DECEMBER
48 1. REPORTING ENTITY TransCentury Limited ( TCL ) is a limited liability company incorporated in Kenya under the Kenyan Companies Act, 2015 and is domiciled in Kenya. The consolidated financial statements of the company as at and for the year ended 31 December 2016 comprise the company and its subsidiaries (together referred to as the Group ). The address of its registered office is as follows: 8th Floor, West End Towers Off Waiyaki Way PO Box Nairobi GPO Where reference is made in the accounting policies to Group it should be interpreted as being applicable to the consolidated or company financial statements as the context requires. 2. BASIS OF PREPARATION AND ACCOUNTING (a) Statement of compliance The financial statements have been prepared in accordance with International Financial Reporting Standards (IFRSs) and the requirements of the Kenyan Companies Act, For Kenyan Companies Act, 2015 reporting purposes in these financial statements, the balance sheet is presented by the statement of financial position and the profit and loss account is presented by the statement of profit or loss and other comprehensive income. (b) Basis of measurement The financial statements have been prepared on the historical cost basis except for the following: (c) Functional and presentation currency These financial statements are presented in Kenya Shillings (KShs), which is also the company s functional currency. All financial information presented has been rounded to the nearest thousand (KShs 000) except where otherwise indicated. (d) Use of judgments and estimates The preparation of financial statements in conformity with IFRS requires management to make judgments, estimates and assumptions that affect the application of accounting policies and the reported amounts of assets, liabilities and disclosures of contingent assets and liabilities at the date of the financial statements and the reported amounts of income and expenses during the period. The estimates and assumptions are based on the directors best knowledge of current events, actions, historical experience and various other factors that are believed to be reasonable under the circumstances, the results of which form the basis of making the judgments about the carrying values of assets and liabilities are not readily apparent from other sources. Actual results may differ from these estimates. 48 ANNUAL REPORT AND FINANCIAL STATEMENTS FOR THE YEAR ENDED 31ST DECEMBER 2016
49 2. BASIS OF PREPARATION AND ACCOUNTING (Continued) (d) Use of estimates and judgments (continued) Estimates and underlying assumptions are reviewed on an ongoing basis. Revisions to accounting estimates are recognised in the period in which the estimate is revised and in any future periods affected. The key areas of judgement in applying the entities accounting policies are dealt with in the respective accounting policy note or/and disclosure note. Specifically, critical judgements, assumptions and estimation uncertainties are required in the following: (i) Consolidation Judgement is required on whether the group has defacto control over an investee (note 3 (b) (ii)). Judgement is also made during acquisition of subsidiaries where fair value is measured on a provisional basis. (ii) Revenue recognition Critical estimates are made by directors in determining revenue recognition under the percentage of completion approach for ongoing contracts at the reporting date. Revenue and cost relating to work not certified at the reporting date is accrued on long-term contracts based on experts valuation of work completed and not yet certified at the reporting date. (iii) Lease classification Judgement is required in assessing classification of leases into either finance or operating leases, and in determining whether arrangements contain a lease (Note 3 (f )). (iv) Employee benefits Certain assumptions are made when estimating employee benefits liabilities under gratuity schemes (note 3 (k)). (v) Taxation Recognition of deferred tax assets requires assessment of future taxable profits against which carry forward tax losses can be used (Note 3 (l)). (vi) Impairment tests Key assumptions underlying recoverable amounts are made in determining carrying amounts of goodwill, receivables, investments in subsidiaries, tangible and intangible assets, investment properties etc, especially where indicators of impairment exist. (vii) Recognition and measurement of contingencies Key assumptions are made about the likelihood and magnitude of an outflow of resources. (e) Measurement of fair values A number of the Group s accounting policies and disclosures require the measurement of fair values for both financial and non-financial assets and liabilities. The Group has established control framework with respect to the measurements of fair values. This includes a valuation team that has overall responsibility for overseeing all significant fair measurements, including Level 3 fair values, and reports directly to the Chief Executive Officer (CEO). Significant valuation issues are reported to the Group s Audit Committee. ANNUAL REPORT AND FINANCIAL STATEMENTS FOR THE YEAR ENDED 31ST DECEMBER
50 2. BASIS OF PREPARATION AND ACCOUNTING (Continued) (e) Measurement of fair values (continued) When measuring the fair values of an asset or a liability, the Group uses observable market data as far as possible. Fair values are categorised into different levels in a fair value hierarchy based on the inputs used in the valuation techniques as follows: liability, either directly (i.e. as prices) or directly (i.e. derived from prices) inputs) The Group recognises transfers between levels of the fair value hierarchy at the end of the reporting period during which the change has occurred. Where applicable, further information about the assumptions made in determining fair values is disclosed in the notes specific to that asset or liability. Valuation of unquoted investments and subsidiaries For equity instruments for which no active market exists, the Group uses the price of a recent investment or the earnings multiple to estimate the fair value of these investments. Management uses estimates based on historical data relating to earnings of the investee company and other market based multiples in arriving at the fair value. The primary assumption in employing the earnings multiple method is that the market has assigned an appropriate value to the benchmark company. The methodology and assumptions used for arriving at the market based multiples are reviewed and compared with other methodologies to ensure there are no material variances. Valuation of quoted investments For quoted instruments, the fair value is determined by reference to their value weighted average price at the reporting date. Valuation of investment property An external, independent valuation company, having appropriate recognised professional qualifications and recent experience in the location and category of property being valued, values the Group s investment property. The fair values are based on market values, being the estimated amount for which a property could be exchanged on the date of the valuation between a willing buyer and a willing seller in an arm s length transaction after proper marketing wherein the parties had each acted knowledgeably, prudently and without compulsion. The values adopted in the financial statements are based on professional valuation, performed on a regular basis, by registered valuers. Valuation of property, plant and equipment The fair value of property, plant and equipment recognised as a result of a business combination is based on market values. The market value of property is the estimated amount for which a property could be exchanged on the date of valuation between a willing buyer and a willing seller in an arm s length transaction after proper marketing wherein the parties had each acted knowledgeably, prudently and without compulsion. The market value of items of plant, equipment, fixtures and fittings is based on the professional valuation on the acquisition date performed by registered valuers on an open market value basis. 50 ANNUAL REPORT AND FINANCIAL STATEMENTS FOR THE YEAR ENDED 31ST DECEMBER 2016
51 2. BASIS OF PREPARATION AND ACCOUNTING (Continued) (f) Going concern The Group incurred a loss of KShs 864 million during the year ended 31 December 2016 (2015 KShs 2,423 million), and as of that date, the Group s current liabilities exceeded its current assets by KShs 5,640 million (2015- KShs 5,122 million). The Group has put in place the following initiatives to ensure that it meets its obligations as and when they fall due: (i) Renegotiated terms of the convertible bond: On 24 March 2016, the Group reached an agreement with convertible bondholders the results of which was to reduce the convertible bond debt (see Note 23) included in these financial statements from KShs 6 billion (USD 60 million) to KShs 4 billion (USD 40 million) under the amended terms and conditions of the bond. As part of that reduction, the Group wrote back the principal and the interest charges amounting to KShs 2 billion (USD 19.4 million) during the year and this has reduced liquidity pressures. (ii) Kuramo Capital equity injection: On 14 March 2016, the Group reached an agreement with Kuramo Africa Opportunity Kenyan Vehicle Limited ( Kuramo Capital ), an African focused investment manager to inject USD 20 million (approximately KShs 2 billion) of fresh equity into the business. This investment by this strategic investor complemented other funding options to settle the outstanding convertible bond. The funds from capital injection were received in September 2016 to settle 50% of the bond debt (refer to Note 23). On 3rd April, 2017, the Group completed the transaction resulting to Kuramo Africa Opportunity Kenyan Vehicle Limited ( Kuramo Capital ) acquiring a 24.99% shareholding in TCL by allotment of 93,776,173 new ordinary shares of the Company. This also led to appointment of three (3) new Non-Executive Directors; Shaka Kariuki, Wale F. Adeosun and Kamal Pallan (refer to page 9). The completion of this transaction marks a new chapter, as Group continues to execute its growth strategy that is largely driven by its Power Division s expansion program that has seen the Group clinch major orders especially in the last mile electricity connection in Kenya and the region at large. The Engineering Division has generated a strong pipeline of projects in the transport infrastructure sector and industrial installations both for the Government and private market. The Group s Infrastructure Division continues to consolidate its project pipeline in power generation and most recently the transport sector with the Annuity road project, among others (iii) Rollover loan with bondholders As indicated in (ii) above, the first USD 20 million (KShs 2 billion) of the convertible bond was settled from the equity injection by Kuramo Capital on 25 September Further, the balance of USD 20 million (KShs 2 billion) was converted to unsecured loan repayable over three (3) years period. ANNUAL REPORT AND FINANCIAL STATEMENTS FOR THE YEAR ENDED 31ST DECEMBER
52 2. BASIS OF PREPARATION AND ACCOUNTING (Continued) (f) Going concern (continued) (iv) Group reorganisation and restructuring The Group has contracted the services of an international consultant in Organisation Development to assist in establishment of sound corporate governance and organisation structures to be followed in carrying out its business. The process is a demonstrable commitment to delivering long term value and sustainability of the Group by enhancing synergies, ensuring accountability at all levels, improve effective control of invested capital by the Group Holding Company, and following up of the set guidelines and policies in carrying out the business. The process will also ensure a consistent approach to managing the Group s business and people across the Group. (v) Optimization of capital structure The Group is exploring ways of optimizing its capital structure which could involve raising of additional funds and restructuring of current debt. This process will aim at further strengthening the balance sheet of the Group and achievement of the growth strategy. The Group is also reviewing its banking relationships with a view to reducing the number of relationships and maintain a few key strategic relationships for all working capital and asset financing requirements of the business across the Sub-Saharan Africa. This strategic decision has arisen from the need to achieve economies of scale through consolidation of all existing trade finance and term loan facilities into one global facility with both new and existing lenders. The global facility will comprise of refinancing of existing debt and provision of additional working capital facilities to fund the Group s growth and expansion strategy. (vi) Other initiatives at operating units (Subsidiaries): Additional initiatives have been put in place at operating units to ensure the businesses meet their obligations as and when they fall due. These include:- Expanded capacity: The Group has completed the factory upgrade and modernisation program in the factories resulting in tripling the throughput capacity. This has provided economies of scale in production, shorter conversion cycles and efficiency improvement. The increased capacity has strategically positioned the business to exploit the opportunities emerging in the region. 52 ANNUAL REPORT AND FINANCIAL STATEMENTS FOR THE YEAR ENDED 31ST DECEMBER 2016
53 2. BASIS OF PREPARATION AND ACCOUNTING (Continued) (f) Going concern (continued) (vi) Other initiatives at operating units (Subsidiaries): - continued Creating strong linkages with industry players: Regionally, construction industry continue to expand with Kenya recording a growth of 9.2% in The regional governments have also commissioned aggressive power infrastructure programmes to increase electrification access and to power upcoming mega projects. This will continue to create demand for our products and the business has set up route-to-market channels to build relationships with the key stakeholders in this sector. On the utilities front, the regional governments have enacted laws requiring support for local manufacturers, which in turn increases demand for our products. Arising from the expanded capacity, price competitiveness, and in line with the new procurement rules, the Group has won tenders worth KShs 5.3 billion (Kenya KShs 2.8 billion and in Tanzania subsidiaries KShs 2.5 billion) from the regional utility companies. Enhanced terms for key material suppliers: The Group has negotiated enhanced credit facilities for key raw materials. This initiative allows the business adequate time to procure raw materials, convert to finished goods, sell and collect the receivables, eventually reducing dependency on bank borrowings. Stringent working capital management: The Group has put measures to optimise its working capital by revising its customer credit policy, adopting a just-in-time inventory system and overall cost management. These initiatives have resulted to reduction in the overall cash conversion cycle. On receivables, the Group has revised its trading terms to cash or near cash thereby reducing its average collection period and has also taken severe measures to recover delinquent debts. The Group has obtained favourable court decrees to recover a total of KShs 781 million from defaulting customers and recovery efforts are in place. On inventory, market demand has been synchronised to procurement to ensure lean inventory holding. As a result of these initiatives, the business released KShs 3.3 billion from inventory and receivables to working capital during the year. (Refer to page 46 on Statement of cash flows). Disposal of non-operating assets: As indicated on page 90 and Note 11 (Asset held for sale), our Tanzania Subsidiary has offered for sale a residential property located in Dar es salaam. The sale is expected to be concluded in 2017 and the property is estimated to realise KShs 245 million. The exercise is geared towards achieving lean operations and releasing funds which could be deployed towards more profitable ventures. The directors having taken into account the initiatives above and information at hand are confident that the going concern assumption is appropriate in the preparation of these Group financial statements. The financial statements have therefore been prepared on the basis of accounting policies applicable to a going concern. This basis presumes that funds will be available to finance future operations and that the realisation of assets and settlement of liabilities will occur in the ordinary course of business. ANNUAL REPORT AND FINANCIAL STATEMENTS FOR THE YEAR ENDED 31ST DECEMBER
54 3. SIGNIFICANT ACCOUNTING POLICIES The principal accounting policies adopted in the preparation of these consolidated financial statements are set out below and have been consistently applied to all periods presented in these financial statements and have been consistently applied by Group entities, except where indicated otherwise: (a) Revenue recognition (i) Sale of goods and rendering of services Revenue from sale of goods is recognised when the significant risks and rewards of ownership have been transferred to the buyer, recovery of the consideration is probable, the associated costs and possible return of goods can be estimated reliably and there is no continuing management involvement with the goods. Revenue from services rendered is recognised in profit or loss in proportion to the stage of completion of the transaction at the reporting date. The stage of completion is assessed based on surveys of work done. The revenue is stated net of Value Added Tax (VAT) returns, trade discounts and volume rebates. (ii) Dividends Dividend income is recognised in profit or loss on the date that the Group s right to receive payment is established. (iii) Interest on deposits with financial institutions Interest on deposits with financial institutions is accounted for on a time proportion basis in profit or loss using the effective interest method. (iv) Discount on treasury bills Discount on treasury bills is credited to profit or loss on a straight line basis over the maturity period of the investment. (b) Basis of consolidation (i) Business combinations The Group accounts for business combinations using the acquisition method when control is transferred to the Group. The consideration transferred in the acquisition is generally measured at fair value, as are the identifiable net assets acquired. Any goodwill that arises is tested annually for impairment. Any gain on a bargain purchase is recognised in profit or loss immediately. Transaction costs are expensed as incurred, except if related to the issue of debt or equity securities. The consideration transferred does not include amounts related to the settlement of pre-existing relationships. Such amounts are generally recognised in profit or loss. Any contingent consideration is measured at fair value at the date of acquisition. If an obligation to pay contingent consideration that meets the definition of a financial instrument is classified as equity, then it is not remeasured and settlement is accounted for within equity. Otherwise, subsequent changes in the fair value of the contingent consideration are recognised in profit or loss. 54 ANNUAL REPORT AND FINANCIAL STATEMENTS FOR THE YEAR ENDED 31ST DECEMBER 2016
55 3. SIGNIFICANT ACCOUNTING POLICIES (Continued) (b) Basis of consolidation (continued) (i) Business combinations - continued If share-based payment awards (replacement awards) are required to be exchanged for awards held by the acquiree s employees (acquiree s awards), then all or a portion of the amount of the acquiree s replacement awards is included in measuring the consideration transferred in the business combination. The determination is based on the market-based measure of the replacement awards compared with the market-based measure of the acquiree s awards and the extent to which the replacement awards relate to pre-combination service. (ii) Subsidiaries Subsidiaries are entities controlled by the Group. The Group controls an entity when it is exposed to, or has rights to, variable returns from its involvement in the investee and has the ability to affect those returns through its power over the investee. The financial statements of subsidiaries are included in the consolidated financial statements from the date that control commences until the date that control ceases. The financial statements have been prepared using uniform accounting policies for like transactions and other events in similar circumstances. The consolidated financial statements include the company and its subsidiaries. The significant subsidiaries are as follows: Subsidiary Country of incorporation 2016 % 2015 % Cable Holdings Limited Kenya East African Cables Limited Kenya East African Cables Tanzania Limited Tanzania AEA Limited Kenya TransCentury Holdings (Pty) Limited South Africa Kewberg Cables & Braids (Pty) South Africa Limited South Africa Tanelec Limited Zambia Tanelec Limited Tanzania Crystal Limited Tanzania TC Mauritius Holdings Limited Mauritius Cable Holdings Mauritius Limited Mauritius TC Engineering and Contracting Limited Mauritius TC Railway Holdings Limited Mauritius Safari Rail Company Limited Mauritius Civicon Africa Group Limited* Mauritius Civicon DRC Holdings Limited Mauritius Cableries du Congo Sarl Democratic Republic of Congo * See Note 14(c) for details on change in shareholding during the year. In the company financial statements, investments in subsidiaries are measured at fair value. ANNUAL REPORT AND FINANCIAL STATEMENTS FOR THE YEAR ENDED 31ST DECEMBER
56 3. SIGNIFICANT ACCOUNTING POLICIES (Continued) (b) Basis of consolidation (continued) (iii) Non-controlling interests Non-controlling interests (NCI) are measured at their proportionate share of the acquiree s identifiable net assets at the acquisition date. (iv) Transactions eliminated on consolidation Intra-group balances and transactions, and any unrealised income and expenses arising from intra-group transactions, are eliminated in preparing the consolidated financial statements. (v) Loss of control When the Group loses control over a subsidiary, it derecognises the assets and liabilities of the subsidiary, and any related NCI and other components of equity. Any resulting gain or loss is recognised in profit or loss. Any interest retained in the former subsidiary is measured at fair value when control is lost. (c) Translation of foreign currencies (i) Foreign currency transactions Transactions in foreign currencies are translated to the respective functional currencies of Group entities at exchange rates at the dates of the transactions. Monetary assets and liabilities denominated in foreign currencies at the reporting date are retranslated to the functional currency at the exchange rate at that date. The foreign currency gain or loss on monetary items is the difference between amortised cost in the functional currency at the beginning of the period, adjusted for effective interest and payments during the period, and the amortised cost in foreign currency translated at the exchange rate at the end of the period. Non-monetary assets and liabilities denominated in foreign currencies that are measured at fair value are retranslated to the functional currency at the exchange rate at the date that the fair value was determined. Foreign currency differences arising on retranslation are recognised in profit or loss, except for differences arising on the retranslation of available-for-sale equity instruments. (ii) Foreign operations The consolidated financial statements are presented in Kenya Shillings, which is the group s functional and presentation currency. Each entity in the group determines its own functional currency and items included in the financial statements of each entity are measured using that functional currency. As at the reporting date, the assets and liabilities of foreign subsidiaries are translated into Kenya Shillings at the rate of exchange ruling at the reporting date, and their income statements are translated at the weighted average exchange rates for the period. Exchange differences arising on translation are recognised in other comprehensive income and accumulated in equity in the translation reserve. On disposal of a foreign entity, the deferred cumulative amount recognised in equity relating to that particular foreign operation is recognised through other comprehensive income into profit or loss. Foreign exchange gains and losses arising from a monetary item receivable from or payable to a foreign operation, the settlement of which is neither planned nor likely in the foreseeable future, are considered to form part of a net investment in a foreign operation and are recognised directly in equity. 56 ANNUAL REPORT AND FINANCIAL STATEMENTS FOR THE YEAR ENDED 31ST DECEMBER 2016
57 3. SIGNIFICANT ACCOUNTING POLICIES (Continued) (d) Property, plant and equipment Items of property, plant and equipment are stated initially at historical cost and subsequently at historical costs or the revalued amount (as appropriate) less accumulated depreciation and impairment losses. The revaluation is performed by a professional valuation expert after every three years, and the resulting surplus is recognised in other comprehensive income (OCI) and accumulated in equity under the revaluation reserve. A revaluation increase is recognised in profit or loss to the extent that it reverses a revaluation decrease of the same asset previously recognised in profit or loss. Any revaluation deficits are recognised in profit or loss unless there exists a credit in the revaluation reserve for that asset, in which case they are recognised in OCI. Cost includes expenditure that is directly attributable to acquisition of the asset. When parts of an item of property, plant and equipment have different useful lives, they are accounted for as separate items (major components) of property, plant and equipment. Any gain or loss on disposal of an item of property, plant and equipment (calculated as the difference between the net proceeds from disposal and the carrying amount of the item) is recognised in profit or loss. Subsequent expenditure is only capitalised when it is probable that the future economic associated with the expenditure will flow to the Group. Ongoing repairs and maintenance is expensed as incurred. Depreciation is charged on a straight-line basis over the estimated useful lives of the assets. Land is not depreciated. The annual rates of depreciation used for the current and comparative periods are as follows: motor vehicles and computers 12.5% - 33% The assets residual values, depreciation methods and useful lives are re-assessed and adjusted as appropriate at each reporting date. When revalued assets are sold, any related amount included in the revaluation reserve is transferred to retained earnings. (e) Investment property Held either to earn rental income or for capital appreciation or for both, but not for sale in the ordinary course of business, use in the production or supply of goods or services or for administrative purposes. Investment property is measured at fair value at each reporting date with any change therein recognised in profit or loss. Any gain or loss on disposal of an investment property (calculated as the difference between the net proceeds from disposal and the carrying amount of the item) is recognised in profit or loss. When an investment property that was previously classified as property, plant and equipment is sold, any related amount included in the revaluation reserve is transferred to retained earnings. When the use of a property changes such that it is reclassified as property, plant and equipment, its fair value at the date of reclassification becomes its cost for subsequent accounting. ANNUAL REPORT AND FINANCIAL STATEMENTS FOR THE YEAR ENDED 31ST DECEMBER
58 3. SIGNIFICANT ACCOUNTING POLICIES (Continued) (f) (g) (h) Leases Leases where a significant portion of the risks and rewards of ownership are retained by the lessor, are classified as operating leases. Payments made under operating leases are charged to the statement of comprehensive income on a straight-line basis over the period of the lease. Prepaid operating lease rentals Prepaid operating lease rentals relate to leasehold land. The Group has classified leasehold land as a finance lease and measured the leasehold land at fair value with changes in fair value recognised in other comprehensive income. Impairment (i) Financial assets A financial asset is considered to be impaired if objective evidence indicates that one or more events have had a negative effect on the estimated future cash flows of that asset. An impairment loss in respect of a financial asset measured at amortised cost is calculated as the difference between its carrying amount, and the present value of the estimated future cash flows discounted at the original effective interest rate. Individually significant financial assets are tested for impairment on an individual basis. The remaining financial assets are assessed collectively in groups that share similar credit risk characteristics. All impairment losses are recognised in profit or loss. Impairment losses on available-for-sale financial assets are recognised by reclassifying the losses accumulated in the fair value reserve in equity to profit or loss. The cumulative loss that is reclassified from equity to profit or loss is the difference between the acquisition cost, net of any principal repayment and amortisation, and the current fair value, less any impairment loss recognised previously in profit or loss. An impairment loss is reversed if the reversal can be related objectively to an event occurring after the impairment loss was recognised. (ii) Non-financial assets The carrying amounts of the Group s non-financial assets, other than investment property, inventories and deferred tax assets, are reviewed at each reporting date to determine whether there is any indication of impairment. Goodwill is tested annually for impairment. An impairment loss is recognised if the carrying amount of an asset or its cash-generating unit exceeds its recoverable amount. A cash-generating unit is the smallest identifiable asset group that generates cash flows that largely are independent from other assets and groups. Impairment losses are recognised in profit or loss. Impairment losses recognised in respect of cash-generating units reduce the carrying amount of the other assets in the unit (group of units) on a pro rata basis. The recoverable amount of an asset or cash-generating unit is the greater of its value in use and its fair value less costs to sell. In assessing value in use, the estimated future cash flows are discounted to their present value using a pre-tax discount rate that reflects current market assessments of the time value of money and the risks specific to the asset. Impairment losses recognised in prior periods are assessed at each reporting date for any indications that the loss has decreased or no longer exists. An impairment loss is reversed only to the extent that the asset s carrying amount does not exceed the carrying amount that would have been determined, net of depreciation or amortisation, if no impairment loss had been recognised. An impairment loss in respect of goodwill is not reversed. 58 ANNUAL REPORT AND FINANCIAL STATEMENTS FOR THE YEAR ENDED 31ST DECEMBER 2016
59 3. SIGNIFICANT ACCOUNTING POLICIES (Continued) (i) Inventory Cost of inventories includes expenditure incurred in acquiring the inventories, production or conversion costs and other costs incurred in bringing them to their present location and condition. Work in progress and manufactured finished goods are valued at production cost including direct production costs (cost of materials and labour) and an appropriate proportion of production overheads and factory depreciation. The cost of inventory is based on the weighted average principle. If the purchase or production cost is higher than net realisable value, inventories are written down to net realisable value. Net realisable value is the estimated selling price in the ordinary course of business less the estimated costs of completion and selling expenses. (j) (k) Trade and other receivables Trade and other receivables are stated at amortised cost less an estimate made for doubtful receivables based on a review of all outstanding amounts at year end. Employee benefits (i) Defined contribution plans Some employees of the Group are eligible for retirement benefits under defined contribution plans provided through separate fund arrangements. Contributions to the defined contribution plan are charged to the profit or loss as incurred. (ii) Staff gratuity Unionisable staff for East African Cables Limited, Tanelec Limited and Civicon Limited are eligible to gratuity upon retirement based on the terms stipulated in the respective Collective Bargaining Agreements. A liability is made in the financial statements for the estimated liability of such gratuity payable. Movements in the liability are accounted for in profit or loss. (iii) Leave accrual The monetary value of the unutilised leave by staff as at year end is recognised as an expense in the year and carried in the accruals as a payable. (iv) Termination benefits Termination benefits are recognised as an expense when the Group is demonstrably committed, without realistic possibility of withdrawal, to a formal detailed plan to either terminate employment before the normal retirement date, or to provide termination benefits as a result of an offer made to encourage voluntary redundancy. Termination benefits for voluntary redundancies are recognised as an expense if the Group has made an offer encouraging voluntary redundancy, it is probable that the offer will be accepted, and the number of acceptances can be estimated reliably. ANNUAL REPORT AND FINANCIAL STATEMENTS FOR THE YEAR ENDED 31ST DECEMBER
60 3. SIGNIFICANT ACCOUNTING POLICIES (Continued) (l) Taxation Tax on the operating results for the year comprises current tax and change in deferred tax. Current tax and deferred tax is recognised in profit or loss except to the extent that it relates to items recognised directly in equity or other comprehensive income. Current tax is provided on the results in the year as shown in the financial statements adjusted in accordance with tax legislation. Deferred tax is recognised in respect of temporary differences between carrying amounts of assets and liabilities for financial reporting purposes and the amounts used for taxation purposes. Deferred tax is not recognised for: nor taxable profit or loss; not reverse in the foreseeable future; and A deferred tax asset is recognised only to the extent that it is probable that future taxable profit will be available against which the tax asset can be utilised. Deferred tax assets are reviewed at each reporting date and are reduced to the extent that it is no longer probable that the related tax benefit will be realised. Deferred tax is measured at the tax rates that are expected to apply to temporary differences when they reverse, on the basis of the tax rates enacted or substantively enacted at the reporting date. (m) (n) (o) (p) (q) Cash and cash equivalents For the purposes of the statement of cash flows, cash and cash equivalents comprise of cash in hand, bank balances, and short term deposits net of bank overdrafts. Share capital Incremental costs directly attributable to the issue of ordinary shares, net of any tax effects are recognised as a deduction to equity. Any premium received over and above the par value of the shares is classified as share premium in equity. Earnings per share The Group and Company presents basic and diluted earnings per share (EPS) data for its ordinary shares. Basic EPS is calculated by dividing the profit or loss attributable to ordinary shareholders of the Company by the weighted average number of ordinary shares outstanding during the period. Diluted EPS is determined by adjusting the profit or loss attributable to ordinary shareholders and the weighted average number of ordinary shares outstanding for the effects of all dilutive potential ordinary shares. Related party transactions The group discloses the nature, volume and amounts outstanding at the end of each financial year from transactions with related parties, which include transactions with the directors, executive officers and group or related companies. Dividends Dividends are recognised as a liability in the period in which they are declared. Proposed dividends are treated as a separate component of equity. 60 ANNUAL REPORT AND FINANCIAL STATEMENTS FOR THE YEAR ENDED 31ST DECEMBER 2016
61 3. SIGNIFICANT ACCOUNTING POLICIES (Continued) (r) Financial instruments (i) Classification A financial instrument is a contract that gives rise to both a financial asset of one enterprise and a financial liability of another enterprise. These are classified as follows: Financial assets at fair value through profit or loss: This category has two subcategories; financial assets held for trading, and those designated at fair value through profit or loss at inception. Financial instruments reclassified in this category are those that the Group holds principally for the purpose of short-term profit taking. Loans and receivables are non-derivative financial assets with fixed or determinable payments that are not quoted in an active market other than those that the Group intends to sell in the short term or that it has designated as at fair value through profit or loss or available-for-sale. Loans and receivables comprise trade and other receivables, cash and cash equivalents and balances due from Group companies. Held-to-maturity assets are financial assets with fixed or determinable payments and fixed maturity that the Group has positive intent and ability to hold to maturity. Were the Group to sell other than an insignificant amount of held-to-maturity assets, the entire category would be tainted and reclassified as available-for-sale. Available-for-sale assets are the non-derivative financial assets that are designated as available for sale or are not classified as held for trading purposes, loans and receivables or held to maturity. These include quoted and unquoted investments and investments in funds. The Group classifies non-derivative financial liabilities into the other financial liabilities category. Such financial liabilities are recognised initially at fair value less any directly attributable transaction costs. Subsequent to initial recognition, these financial liabilities are measured at amortised cost using the effective interest method. Other financial liabilities include loans, bank overdrafts, convertible bond, trade and other payables. (ii) Recognition The Group recognises financial assets held for trading and available-for-sale assets on the date it commits to purchase the assets. From this date any gains and losses arising from changes in fair value of the assets are recognised. Held-to-maturity, loans and receivables are recognised on the date they are transferred to the Group. (iii) Measurement Financial instruments are measured initially at fair value, including transaction costs. Subsequent to initial recognition all instruments measured at fair value through profit or loss and all available-forsale assets are measured at fair value, except that any instrument that does not have a quoted market price in an active market and whose fair value cannot be reliably measured is stated at cost, including transaction costs, less impairment losses. ANNUAL REPORT AND FINANCIAL STATEMENTS FOR THE YEAR ENDED 31ST DECEMBER
62 3. SIGNIFICANT ACCOUNTING POLICIES (Continued) (r) Financial instruments (continued) (iii) Measurement continued Loans and receivables and held-to-maturity assets are measured at amortised cost less impairment losses. Amortised cost is calculated on the effective interest method. Premiums and discounts, including initial transaction costs, are included in the carrying amount of the related instrument and amortised based on the effective interest rate of the instrument. Gains and losses arising from a change in the fair value of available-for-sale assets are recognised in other comprehensive income and presented within equity until the instrument is derecognised or impaired, at which time the cumulative gain or loss is recognised in profit or loss and trading instrument gains or losses are recognised in profit or loss in the period they arise. (iv) (v) Offsetting Financial assets and financial liabilities are offset and the net amount reported on the statement of financial position when there is a legally enforceable right to offset the recognised amounts and there is an intention to settle on a net basis, or to realise the asset and settle the liability simultaneously. Derecognition A financial asset is derecognised when the Group loses control over the contractual rights that comprise that asset. This occurs when the rights are realised, expire or are surrendered. A financial liability is derecognised when it is extinguished. (s) Assets held for sale Non-current assets or disposal groups comprising assets and liabilities that are expected to be recovered primarily through sale or distribution than through continuing use are classified as held for sale or distribution. Immediately before classification as held for sale or distribution the assets or components of a disposal group are measured in accordance with the Group s accounting policies. Thereafter generally the assets or disposal group are measured at the lower of their carrying amount and fair value less costs to sell. Any impairment loss on a disposal group is allocated first to goodwill and then to the remaining assets and liabilities on a pro rata basis. Impairment losses on initial classification as held for sale or distribution and subsequent gains and losses on remeasurement are recognised in profit or loss. Gains are not recognised in excess of any cumulative impairment loss. Once classified as held for sale or distribution, assets are no longer amortised or depreciated, and any equity-accounted investee is no longer equity accounted. (t) Intangible assets (i) Goodwill/premium on acquisition All business combinations are accounted for by applying the acquisition method when control is transferred to the group. Goodwill represents the difference between the consideration transferred and the fair value of the net identifiable assets acquired. Goodwill is measured at cost less any accumulated impairment losses. Goodwill is allocated to cash-generating units and is tested annually for impairment and once goodwill is impaired the impairment is not reversed. Bargain purchase arising on an acquisition is recognised directly in profit or loss. 62 ANNUAL REPORT AND FINANCIAL STATEMENTS FOR THE YEAR ENDED 31ST DECEMBER 2016
63 3. SIGNIFICANT ACCOUNTING POLICIES (Continued) (t) Intangible assets (continued) (ii) (iii) Computer software Acquired computer software licences are capitalised on the basis of the costs incurred to acquire and bring to use the specific software. These costs are amortised on a straight line basis over the expected useful lives. Brand Acquired assets are capitalised and are measured at cost less accumulated amortisation and impairment. Amortisation is calculated using the straight-line method over estimated useful life. The estimated useful life of the brand for the current and comparative periods is 20 years. Amortisation methods, useful lives and residual values are reviewed at each reporting date and adjusted if appropriate. (u) Provisions A provision is recognised in the statement of financial position when the company has a legal or constructive obligation as a result of a past event and it is probable that an outflow of economic benefits will be required to settle the obligation. If the effect is material, provisions are determined by discounting the expected future cash flows at a pre-tax rate that reflects current market assessments of the time value of money and, where appropriate, the risks specifics to the liability. (v) Comparatives Where necessary, comparative figures have been adjusted to conform to changes in presentation in the current year and changes in accounting policy. (w) New standards and interpretations adopted (i) New standards, amendments and interpretations effective and adopted during the year The Group and Company has adopted the following new standards and amendments during the year ended 31 December 2016, including consequential amendments to other standards with the date of initial application by the Group and Company being 1 January The nature and effects of the changes are explained below: New standard or amendments Sale or Contribution of Assets between an Investor and its Associate or Joint Venture (Amendments to IFRS 10 and IAS 28) Accounting for Acquisitions of Interests in Joint Operations (Amendments to IFRS 11) Amendments to IAS 16 and IAS 38 Clarification of Acceptable Methods of Depreciations and Amortisation Amendments to IAS 41 - Bearer Plants (Amendments to IAS 16 and IAS 41) Equity Method in Separate Financial Statements (Amendments to IAS 27) IFRS 14 Regulatory Deferral Accounts Investment Entities: Applying the Consolidation Exception (Amendments to IFRS 10, IFRS 12 and IAS 28) Disclosure Initiative (Amendments to IAS 1) ANNUAL REPORT AND FINANCIAL STATEMENTS FOR THE YEAR ENDED 31ST DECEMBER
64 3. SIGNIFICANT ACCOUNTING POLICIES (Continued) (w) New standards and interpretations adopted (continued) (i) New standards, amendments and interpretations effective and adopted during the year - continued Accounting for Acquisitions of Interests in Joint Operations (Amendments to IFRS 11) The amendments require business combination accounting to be applied to acquisitions of interests in a joint operation that constitutes a business. Business combination accounting also applies to the acquisition of additional interests in a joint operation while the joint operator retains joint control. The additional interest acquired will be measured at fair value. The previously held interest in the joint operation will not be re-measured. The amendments apply prospectively for annual periods beginning on or after 1 January The adoption of these changes did not have a significant impact on the financial statements of the Group and Company. Amendments to IAS 41- Bearer Plants (Amendments to IAS 16 and IAS 41) The amendments to IAS 16 Property, Plant and Equipment and IAS 41 Agriculture require a bearer plant (which is a living plant used solely to grow produce over several periods) to be accounted for as property, plant and equipment in accordance with IAS 16 Property, Plant and Equipment instead of IAS 41 Agriculture. The produce growing on bearer plants will remain within the scope of IAS 41.The new requirements are effective from 1 January The Group and Company does not have any bearer plants. Consequently the adoption of these changes did not have a significant impact its financial statements. Clarification of Acceptable Methods of Depreciation and Amortisation (Amendments to IAS 16 and IAS 38) The amendments to IAS 16 Property, Plant and Equipment explicitly state that revenue-based methods of depreciation cannot be used for property, plant and equipment. The amendments to IAS 38 Intangible Assets introduce a rebuttable presumption that the use of revenue-based amortisation methods for intangible assets is inappropriate. The presumption can be overcome only when revenue and the consumption of the economic benefits of the intangible asset are highly correlated, or when the intangible asset is expressed as a measure of revenue. The amendments apply prospectively for annual periods beginning on or after 1 January The adoption of these changes did not affect the amounts and disclosures of the Group s and Company s property, plant and equipment and intangible assets. Equity Method in Separate Financial Statements (Amendments to IAS 27) The amendments allow the use of the equity method in separate financial statements, and apply to the accounting not only for associates and joint ventures but also for subsidiaries. The amendments apply retrospectively for annual periods beginning on or after 1 January The adoption of these changes did not have a significant impact on the financial statements of the Group and Company. 64 ANNUAL REPORT AND FINANCIAL STATEMENTS FOR THE YEAR ENDED 31ST DECEMBER 2016
65 3. SIGNIFICANT ACCOUNTING POLICIES (Continued) (w) New standards and interpretations adopted (continued) (i) New standards, amendments and interpretations effective and adopted during the year - continued IFRS 14 Regulatory Deferral Accounts IFRS 14 provides guidance on accounting for regulatory deferral account balances by first-time adopters of IFRS. To apply this standard, the entity has to be rate-regulated i.e. the establishment of prices that can be charged to its customers for goods and services is subject to oversight and/or approval by an authorised body. The standard is effective for financial reporting years beginning on or after 1 January The adoption of these changes did not have a significant impact on the financial statements of the Group given that it is not a first time adopter of IFRS. Investment Entities: Applying the Consolidation Exception (Amendments to IFRS 10, IFRS 12 and IAS 28) The amendment to IFRS 10 Consolidated Financial Statements clarifies which subsidiaries of an investment entity are consolidated instead of being measured at fair value through profit and loss. The amendment also modifies the condition in the general consolidation exemption that requires an entity s parent or ultimate parent to prepare consolidated financial statements. The amendment clarifies that this condition is also met where the ultimate parent or any intermediary parent of a parent entity measures subsidiaries at fair value through profit or loss in accordance with IFRS 10 and not only where the ultimate parent or intermediate parent consolidates its subsidiaries. The amendment to IFRS 12 Disclosure of Interests in Other Entities requires an entity that prepares financial statements in which all its subsidiaries are measured at fair value through profit or loss in accordance with IFRS 10 to make disclosures required by IFRS 12 relating to investment entities. The amendment to IAS 28 Investments in Associates and Joint Ventures modifies the conditions where an entity need not apply the equity method to its investments in associates or joint ventures to align these to the amended IFRS 10 conditions for not presenting consolidated financial statements. The amendments introduce relief when applying the equity method which permits a non-investment entity investor in an associate or joint venture that is an investment entity to retain the fair value through profit or loss measurement applied by the associate or joint venture to its subsidiaries. The amendments apply retrospectively for annual periods beginning on or after 1 January The adoption of these changes did not have a significant impact on the amounts and disclosures of the Group s and Company s interests in other entities. Disclosure Initiative (Amendments to IAS 1) The amendments provide additional guidance on the application of materiality and aggregation when preparing financial statements. The amendments apply for annual periods beginning on or after 1 January 2016 and early application is permitted. The adoption of these changes did not affect the amounts and disclosures of the Group s and Company s interests in other entities. ANNUAL REPORT AND FINANCIAL STATEMENTS FOR THE YEAR ENDED 31ST DECEMBER
66 3. SIGNIFICANT ACCOUNTING POLICIES (Continued) (w) New standards and interpretations adopted (continued) (i) New standards, amendments and interpretations effective and adopted during the year - continued Annual improvements cycle ( ) various standards Standard IFRS 5 Non-current Assets Held for Sale and Discontinued Operations IFRS 7 Financial Instruments: Disclosures (with consequential amendments to IFRS 1) Amendments Changes in methods of disposal. Adds specific guidance in IFRS 5 for cases in which an entity reclassifies an asset from held for sale to held for distribution or vice versa and cases in which held-for-distribution accounting is discontinued. Servicing contracts. Adds additional guidance to clarify whether a servicing contract is continuing involvement in a transferred asset for the purpose of determining the disclosures required. Applicability of the amendments to IFRS 7 to condensed interim financial statements. Clarifies the applicability of the amendments to IFRS 7 on offsetting disclosures to condensed interim financial statements. IAS 19 Employee Benefits IAS 34 Interim Financial Reporting Discount rate: regional market issue. Clarifies that the high quality corporate bonds used in estimating the discount rate for post-employment benefits should be denominated in the same currency as the benefits to be paid (thus, the depth of the market for high quality corporate bonds should be assessed at currency level). Disclosure of information elsewhere in the interim financial report. Clarifies the meaning of elsewhere in the interim report and requires a cross-reference The adoption of these changes did not have a significant impact on the financial statements of the Group and Company. 66 ANNUAL REPORT AND FINANCIAL STATEMENTS FOR THE YEAR ENDED 31ST DECEMBER 2016
67 3. SIGNIFICANT ACCOUNTING POLICIES (Continued) (w) New standards and interpretations adopted (continued) (ii) New and amended standards and interpretations in issue but not yet effective for the year ended 31 December 2016 A number of new standards, amendments to standards and interpretations are not yet effective for the year ended 31 December 2016, and have not been applied in preparing these financial statements. The Group and Company does not plan to adopt these standards early. These are summarised below; New standard or amendments Disclosure Initiative (Amendments to IAS 7) 1 January 2017 Recognition of Deferred Tax Assets for Unrealised Losses (Amendments to IAS 12) Effective for annual periods beginning on or after 1 January 2017 IFRS 15 Revenue from Contracts with Customers 1 January 2018 IFRS 9 Financial Instruments (2014) 1 January 2018 Classification and Measurement of Share-based Payment Transactions (Amendments to IFRS 2) Applying IFRS 9 Financial Instruments with IFRS 4 Insurance Contracts (Amendments to IFRS 4) IFRIC interpretation 22 Foreign Currency Transactions and Advance Considerations 1 January January January 2018 IFRS 16 Leases 1 January 2019 IFRS 17 Insurance Contracts 1 January 2021 Sale or Contribution of Assets between an Investor and its Associate or Joint Venture (Amendments to IFRS 10 and IAS 28). Disclosure Initiative (Amendments to IAS 7) To be determined The amendments in Disclosure Initiative (Amendments to IAS 7) come with the objective that entities shall provide disclosures that enable users of financial statements to evaluate changes in liabilities arising from financing activities. The International Accounting Standards Board (IASB) requires that the following changes in liabilities arising from financing activities are disclosed (to the extent necessary): (i) changes from financing cash flows; (ii) changes arising from obtaining or losing control of subsidiaries or other businesses; (iii) the effect of changes in foreign exchange rates; (iv) changes in fair values; and (v) other changes. The IASB defines liabilities arising from financing activities as liabilities for which cash flows were, or future cash flows will be, classified in the statement of cash flows as cash flows from financing activities. It also stresses that the new disclosure requirements also relate to changes in financial assets if they meet the same definition. The amendments state that one way to fulfil the new disclosure requirement is to provide a reconciliation between the opening and closing balances in the statement of financial position for liabilities arising from financing activities. Finally, the amendments state that changes in liabilities arising from financing activities must be disclosed separately from changes in other assets and liabilities. The amendments are effective for annual periods beginning on or after 1 January 2017, with early application permitted. Since the amendments are being issued less than one year before the effective date, entities need not provide comparative information when they first apply the amendments. The Group is assessing the potential impact on the financial statements resulting from the application of IAS 7. ANNUAL REPORT AND FINANCIAL STATEMENTS FOR THE YEAR ENDED 31ST DECEMBER
68 3. SIGNIFICANT ACCOUNTING POLICIES (Continued) (w) New standards and interpretations adopted (continued) (ii) New and amended standards and interpretations in issue but not yet effective for the year ended 31 December continued Recognition of Deferred Tax Assets for Unrealised Losses (Amendments to IAS 12) The amendments in Recognition of Deferred Tax Assets for Unrealised Losses clarify the following aspects: to a deductible temporary difference regardless of whether the debt instrument s holder expects to recover the carrying amount of the debt instrument by sale or by use. temporary differences. the utilisation of tax losses, an entity would assess a deferred tax asset in combination with other deferred tax assets of the same type. The amendments are effective for annual periods beginning on or after 1 January 2017 with early application permitted. As transition relief, an entity may recognise the change in the opening equity of the earliest comparative period in opening retained earnings on initial application without allocating the change between opening retained earnings and other components of equity. The Board has not added additional transition relief for firsttime adopters. The adoption of these changes is not expected to affect the amounts and disclosures of the Group s financial statements. IFRS 15 Revenue from Contracts with Customers This standard replaces IAS 11 Construction Contracts, IAS 18 Revenue, IFRIC 13 Customer Loyalty Programmes, IFRIC 15 Agreements for the Construction of Real Estate, IFRIC 18 Transfer of Assets from Customers and SIC-31 Revenue Barter of Transactions Involving Advertising Services. The standard contains a single model that applies to contracts with customers and two approaches to recognising revenue: at a point in time or over time. The standard specifies how and when an IFRS reporter will recognise revenue as well as requiring such entities to provide users of financial statements with more informative, relevant disclosures. The standard provides a single, principles based five-step model to be applied to all contracts with customers in recognising revenue being: Identify the contract(s) with a customer; identify the performance obligations in the contract; determine the transaction price; Allocate the transaction price to the performance obligations in the contract; and recognise revenue when (or as) the entity satisfies a performance obligation. IFRS 15 is effective for annual reporting periods beginning on or after 1 January 2018, with early adoption permitted. The Group and Company is assessing the potential impact on the financial statements resulting from the application of IFRS ANNUAL REPORT AND FINANCIAL STATEMENTS FOR THE YEAR ENDED 31ST DECEMBER 2016
69 3. SIGNIFICANT ACCOUNTING POLICIES (Continued) (w) New standards and interpretations adopted (continued) (ii) New and amended standards and interpretations in issue but not yet effective for the year ended 31 December continued IFRS 9: Financial Instruments (2014) On 24 July 2014 the IASB issued the final IFRS 9 Financial Instruments Standard, which replaces earlier versions of IFRS 9 and completes the IASB s project to replace IAS 39 Financial Instruments: Recognition and Measurement. This standard introduces changes in the measurement bases of the financial assets to amortised cost, fair value through other comprehensive income or fair value through profit or loss. Even though these measurement categories are similar to IAS 39, the criteria for classification into these categories are significantly different. In addition, the IFRS 9 impairment model has been changed from an incurred loss model from IAS 39 to an expected credit loss model. The standard is effective for annual period beginning on or after 1 January 2018 with retrospective application, early adoption permitted. The Group and Company is assessing the potential impact on the financial statements resulting from the application of IFRS 9. Classification and Measurement of Share-based Payment Transactions (Amendments to IFRS 2) The following clarifications and amendments are contained in the pronouncement: Up until this point, IFRS 2 contained no guidance on how vesting conditions affect the fair value of liabilities for cash-settled share-based payments. IASB has now added guidance that introduces accounting requirements for cash-settled share-based payments that follows the same approach as used for equitysettled share-based payments. IASB has introduced an exception into IFRS 2 so that a share-based payment where the entity settles the share-based payment arrangement net is classified as equity-settled in its entirety provided the share-based payment would have been classified as equity-settled had it not included the net settlement feature. Up until this point, IFRS 2 did not specifically address situations where a cash-settled share-based payment changes to an equity-settled share-based payment because of modifications of the terms and conditions. The IASB has introduced the following clarifications: is derecognised and the equity-settled share-based payment is recognised at the modification date fair value to the extent services have been rendered up to the modification date. ANNUAL REPORT AND FINANCIAL STATEMENTS FOR THE YEAR ENDED 31ST DECEMBER
70 3. SIGNIFICANT ACCOUNTING POLICIES (Continued) (w) New standards and interpretations adopted (continued) (ii) New and amended standards and interpretations in issue but not yet effective for the year ended 31 December continued Classification and Measurement of Share-based Payment Transactions (Amendments to IFRS 2) - continued The amendments are effective for annual periods beginning on or after 1 January Earlier application is permitted. The amendments are to be applied prospectively. However, retrospective application if allowed if this is possible without the use of hindsight. If an entity applies the amendments retrospectively, it must do so for all of the amendments described above. The adoption of these changes is not expected to be significant to the amounts and disclosures of the Group and Company s financial statements. Applying IFRS 9 Financial Instruments with IFRS 4 Insurance Contracts (Amendments to IFRS 4) The amendments in Applying IFRS 9 Financial Instruments with IFRS 4 Insurance Contracts (Amendments to IFRS 4) provide two options for entities that issue insurance contracts within the scope of IFRS 4: The application of both approaches is optional and an entity is permitted to stop applying them before the new insurance contracts standard is applied. An entity applies the overlay approach retrospectively to qualifying financial assets when it first applies IFRS 9. Application of the overlay approach requires disclosure of sufficient information to enable users of financial statements to understand how the amount reclassified in the reporting period is calculated and the effect of that reclassification on the financial statements. An entity applies the deferral approach for annual periods beginning on or after 1 January Predominance is assessed at the reporting entity level at the annual reporting date that immediately precedes 1 April Application of the deferral approach needs to be disclosed together with information that enables users of financial statements to understand how the insurer qualified for the temporary exemption and to compare insurers applying the temporary exemption with entities applying IFRS 9. The deferral can only be made use of for the three years following 1 January Predominance is only reassessed if there is a change in the entity s activities. The adoption of these changes is not expected to affect the amounts and disclosures of the Company and Group s financial statements. 70 ANNUAL REPORT AND FINANCIAL STATEMENTS FOR THE YEAR ENDED 31ST DECEMBER 2016
71 3. SIGNIFICANT ACCOUNTING POLICIES (Continued) (w) New standards and interpretations adopted (continued) (ii) New and amended standards and interpretations in issue but not yet effective for the year ended 31 December continued IFRS 16: Leases On 13 January 2016 the IASB issued IFRS 16 Leases, completing the IASB s project to improve the financial reporting of leases. IFRS 16 replaces the previous leases standard, IAS 17 Leases, and related interpretations. IFRS 16 sets out the principles for the recognition, measurement, presentation and disclosure of leases for both parties to a contract, i.e. the customer ( lessee ) and the supplier ( lessor ). The standard defines a lease as a contract that conveys to the customer ( lessee ) the right to use an asset for a period of time in exchange for consideration. A company assesses whether a contract contains a lease on the basis of whether the customer has the right to control the use of an identified asset for a period of time. The standard eliminates the classification of leases as either operating leases or finance leases for a lessee and introduces a single lessee accounting model. All leases are treated in a similar way to finance leases. Applying that model significantly affects the accounting and presentation of leases and consequently, the lessee is required to recognise: a) assets and liabilities for all leases with a term of more than 12 months, unless the underlying asset is of low value. A company recognises the present value of the unavoidable lease payments and shows them either as lease assets (right-of-use assets) or together with property, plant and equipment. If lease payments are made over time, a company also recognises a financial liability representing its obligation to make future lease payments. b) depreciation of lease assets and interest on lease liabilities in profit or loss over the lease term; and c) separate the total amount of cash paid into a principal portion (presented within financing activities) and interest (typically presented within either operating or financing activities) in the statement of cash flows IFRS 16 substantially carries forward the lessor accounting requirements in IAS 17. Accordingly, a lessor continues to classify its leases as operating leases or finance leases, and to account for those two types of leases differently. However, compared to IAS 17, IFRS 16 requires a lessor to disclose additional information about how it manages the risks related to its residual interest in assets subject to leases. The standard does not require a company to recognise assets and liabilities for: (a) (b) short-term leases (i.e. leases of 12 months or less) and; leases of low-value assets The new Standard is effective for annual periods beginning on or after 1 January Early application is permitted insofar as the recently issued revenue Standard, IFRS 15 Revenue from Contracts with Customers is also applied. The Group and Company are assessing the potential impact on the financial statements resulting from the application of IFRS 16. ANNUAL REPORT AND FINANCIAL STATEMENTS FOR THE YEAR ENDED 31ST DECEMBER
72 3. SIGNIFICANT ACCOUNTING POLICIES (Continued) (w) New standards and interpretations adopted (continued) (ii) New and amended standards and interpretations in issue but not yet effective for the year ended 31 December continued Sale or Contribution of Assets between an Investor and its Associate or Joint Venture (Amendments to IFRS 10 and IAS 28) The amendments require the full gain to be recognised when assets transferred between an investor and its associate or joint venture meet the definition of a business under IFRS 3 Business Combinations. Where the assets transferred do not meet the definition of a business, a partial gain to the extent of unrelated investors interests in the associate or joint venture is recognised. The definition of a business is key to determining the extent of the gain to be recognised. The effective date for these changes has now been postponed until the completion of a broader review. The Group and Company are assessing the potential impact on the financial statements resulting from the application of these amendments. IFRIC Interpretation 22 Foreign Currency Transactions and Advance Consideration This Interpretation applies to a foreign currency transaction (or part of it) when an entity recognises a nonmonetary asset or non-monetary liability arising from the payment or receipt of advance consideration before the entity recognises the related asset, expense or income (or part of it). This Interpretation stipulates that the date of the transaction for the purpose of determining the exchange rate to use on initial recognition of the related asset, expense or income (or part of it) is the date on which an entity initially recognises the non-monetary asset or non-monetary liability arising from the payment or receipt of advance consideration. This Interpretation does not apply to income taxes, insurance contracts and circumstances when an entity measures the related asset, expense or income on initial recognition: a) at fair value; or b) at the fair value of the consideration paid or received at a date other than the date of initial recognition of the non-monetary asset or non-monetary liability arising from advance consideration (for example, the measurement of goodwill applying IFRS 3 Business Combinations). The amendments apply retrospectively for annual periods beginning on or after 1 January 2018, with early application permitted. The Group and Company are assessing the potential impact on the consolidated and separate financial statements resulting from the application of these changes. IFRS 17 Insurance Contracts IFRS 17 Insurance Contracts sets out the requirements that an entity should apply in reporting information about insurance contracts it issues and reinsurance contracts it holds. 72 ANNUAL REPORT AND FINANCIAL STATEMENTS FOR THE YEAR ENDED 31ST DECEMBER 2016
73 3. SIGNIFICANT ACCOUNTING POLICIES (Continued) (w) New standards and interpretations adopted (continued) (ii) New and amended standards and interpretations in issue but not yet effective for the year ended 31 December continued IFRS 17 Insurance Contracts - continued An entity shall apply IFRS 17 Insurance Contracts to: (a) (b) (c) insurance contracts, including reinsurance contracts, it issues; reinsurance contracts it holds; and investment contracts with discretionary participation features it issues, provided the entity also issues insurance contracts IFRS 17 requires an entity that issues insurance contracts to report them on the statement of financial position as the total of: (a) (b) the fulfilment cash flows the current estimates of amounts that the entity expects to collect from premiums and pay out for claims, benefits and expenses, including an adjustment for the timing and risk of those amounts; and the contractual service margin the expected profit for providing insurance coverage. The expected profit for providing insurance coverage is recognised in profit or loss over time as the insurance coverage is provided. IFRS 17 requires an entity to recognise profits as it delivers insurance services, rather than when it receives premiums, as well as to provide information about insurance contract profits that the company expects to recognise in the future. IFRS 17 requires an entity to distinguish between groups of contracts expected to be profit making and groups of contracts expected to be loss making. Any expected losses arising from loss-making, or onerous, contracts are accounted for in profit or loss as soon as the company determines that losses are expected. IFRS 17 requires the entity to update the fulfilment cash flows at each reporting date, using current estimates of the amount, timing and uncertainty of cash flows and of discount rates. The entity: (a) (b) accounts for changes to estimates of future cash flows from one reporting date to another either as an amount in profit or loss or as an adjustment to the expected profit for providing insurance coverage, depending on the type of change and the reason for it; and chooses where to present the effects of some changes in discount rates either in profit or loss or in other comprehensive income. IFRS 17 also requires disclosures to enable users of financial statements to understand the amounts recognised in the entity s statement of financial position and statement of profit or loss and other comprehensive income, and to assess the risks the company faces from issuing insurance contracts. IFRS 17 replaces IFRS 4 Insurance Contracts. IFRS 17 is effective for financial periods commencing on or after 1 January An entity shall apply the standard retrospectively unless impracticable. A company can choose to apply IFRS 17 before that date, but only if it also applies IFRS 9 Financial Instruments and IFRS 15 Revenue from Contracts with Customers. The adoption of IFRS 17 will not have an impact on the financial statements of the Group and Company ANNUAL REPORT AND FINANCIAL STATEMENTS FOR THE YEAR ENDED 31ST DECEMBER
74 4. FINANCIAL RISK MANAGEMENT OBJECTIVES AND POLICIES Overview The Group and company has exposure to the following risks from its use of financial instruments: (a) (b) (c) Credit risk; Liquidity risk; and Market risk. This note presents information about the Group and company s exposure to each of the above risks, the Group and company s objectives, policies and processes for measuring and managing risk, and the Group and company s management of capital. Further quantitative disclosures are included throughout these consolidated financial statements. The board of directors has overall responsibility for the establishment and oversight of the Group and company s risk management framework. The finance department identifies, evaluates and hedges financial risks. The Board of Directors oversees how management monitors compliance with the Group and company s risk management policies and procedures and reviews the adequacy of the risk management framework in relation to the risks faced by the Group and company. (a) Credit risk Credit risk is the risk of financial loss to the Group and company if a customer or counterparty to a financial instrument fails to meet its contractual obligations, and arises principally from the Group and company s receivables from customers. The carrying amount of financial assets represents the maximum exposure to credit risk: Consolidated Consolidated Company Company KShs 000 KShs 000 KShs 000 KShs 000 Loans to subsidiaries , ,015 Trade receivables 2,186,771 3,829, Staff debtors 5, Due from related parties , ,553 Cash and bank balances 124, ,363 1,182 7,713 2,315,908 4,064,628 1,480,741 1,707,434 Impairment losses The ageing of trade receivables and amounts due from related parties at the reporting date was: Consolidated Consolidated Company Company KShs 000 KShs 000 KShs 000 KShs 000 Not past due 625, ,259 96,816 63,732 Past due 0-90 days 492, ,870 34,933 25,542 Past due days 812,332 1,037,443 35, ,990 More than one year 1,571,926 2,123, , ,289 3,502,846 4,441, , ,553 Net impairment (1,316,075) ( 612,466) ( 262,303) - 2,186,771 3,829, , , ANNUAL REPORT AND FINANCIAL STATEMENTS FOR THE YEAR ENDED 31ST DECEMBER 2016
75 4. FINANCIAL RISK MANAGEMENT OBJECTIVES AND POLICIES (Continued) (a) Credit risk (continued) Management believes that the unimpaired amounts that are past due are still collectible in full, based on historical payment behaviour and extensive analysis of customer credit risk, including underlying customers credit ratings. The movement in the allowance for impairment in respect of trade receivables during the year was as follows: Consolidated Consolidated Company Company KShs 000 KShs 000 KShs 000 KShs 000 Balance at 1 January 612, , Net impairment loss recognised 724, , ,303 - Bad debts recovered ( 20,593) Balance at 31 December 1,316, , ,303 - (b) Liquidity risk Liquidity risk is the risk that the Group will not be able to meet its financial obligations as they fall due. Liquidity risk arises in the general funding of the company s activities and in the management of positions. It includes both the risk of being unable to fund assets at appropriate maturities and rates and the risk of being unable to liquidate an asset at a reasonable price and in an appropriate time frame. The Group has access to a diverse funding base. Funds are raised mainly from its shareholders, strategic investors, banks and its own internal resources. The Group strives to maintain a balance between continuity of funding and flexibility through the use of liabilities with a range of maturities. The Group continually assesses liquidity risk by identifying and monitoring changes in funding required to meet business goals and targets set in terms of the overall company strategy. In addition, the Group holds a portfolio of liquid assets as part of its liquidity risk management strategy. The table below shows the contractual maturity of financial liabilities as well as contractual interest payments: Group 2016: KShs 000 Due on demand 1-3 months 3-12 months 1-5 years Total Liabilities: Long term loans - 3,550,822 1,741,342 1,023,449 6,315,613 Interest payable on loans - 121, , , ,497 Convertible loans , ,630 Bond 821,592 1,232,332 2,053,924 Bank overdraft 320, ,144 Trade and other payables 4,900, ,900,924 Total financial liabilities 5,221,068 3,672,772 2,806,455 3,107,437 14,807,732 ANNUAL REPORT AND FINANCIAL STATEMENTS FOR THE YEAR ENDED 31ST DECEMBER
76 4. FINANCIAL RISK MANAGEMENT OBJECTIVES AND POLICIES (Continued) (b) Liquidity risk (continued) Group 2015: KShs 000 Due on demand 1-3 months 3-12 months 1-5 years Total Liabilities: Long term loans - 706,923 2,120,769 3,511,955 6,339,647 Interest payable on loans - 87, , , ,411 Convertible bond - - 6,083,468-6,083,468 Bank overdraft 638, ,074 Trade and other payables 4,273, ,273,688 Total financial liabilities 4,911, ,945 8,465,304 3,944,277 18,115,288 Company 2016: KShs 000 Due on demand 1-3 months 3-12 months 1-5 years Total Liabilities: Long term loans 576,073 2,018, ,594,364 Interest payable on loans - 46,606 37,393-83,999 Trade and other payables 528, ,537 Total financial liabilities 1,104,610 2,064,897 37,393-3,206, : Liabilities: Long term loans 576, ,275 1,076, ,233 2,728,571 Interest payable on loans - 10,182 86,159 75, ,200 Trade and other payables 347, ,930 Total financial liabilities 924, ,457 1,163,149 1,024,092 3,248,701 (c) Market risk Market risk is the risk that changes in market prices, such as foreign exchange rates and interest rates will affect the Group s income. The objective of market risk management is to manage and control market risk exposures within acceptable parameters, while optimising the return. (i) Currency risk The Group is exposed to currency risk through transactions in foreign currencies. The company s transactional exposures give rise to foreign currency gains and losses that are recognised in profit or loss. In respect of monetary assets and liabilities in foreign currencies, the Group ensures that its net exposure is kept to an acceptable level by buying foreign currencies at spot rates to enable the Group to meet its obligations. The Group s exposure to foreign currency risk was as follows based on notional amounts in US dollars: 76 ANNUAL REPORT AND FINANCIAL STATEMENTS FOR THE YEAR ENDED 31ST DECEMBER 2016
77 4. FINANCIAL RISK MANAGEMENT OBJECTIVES AND POLICIES (Continued) (c) Market risk (continued) (i) Currency risk - continued Consolidated Consolidated Company Company KShs 000 KShs 000 KShs 000 KShs 000 Loans to subsidiaries , ,015 Cash and bank balances 124,029 56,653 1,182 2,287 Unquoted investments 364, , , ,441 Due from related parties , ,185 Due to related parties - - ( 384,383) ( 142,818) Convertible loans ( 718,630) Bond (2,053,924) Bank overdraft ( 320,144) ( 638,074) - - Bank loans (6,315,613) (6,339,647) (2,018,291) (2,152,498) Net statement of financial position exposure (8,919,997) (6,384,865) ( 650,057) ( 443,388) The following significant exchange rates applied during the year: Closing rate Average rate KShs KShs KShs KShs USD TShs ZAR Sensitivity analysis A 10 percent strengthening of the Kenya Shilling against the US Dollar would have decreased profit or (loss) by amounts shown below. This analysis assumes that all other variables, in particular interest rates, remain constant. The analysis is performed on the same basis for 2015: Consolidated KShs 000 Profit or loss Company KShs 000 At 31 December ,999 65,006 At 31 December ,487 44,339 (ii) Interest rate risk The Group s operations are subject to the risk of interest rate fluctuations to the extent that interest earning assets (including investments) and interest bearing liabilities mature or re-price at different times or in differing amounts. Risk management activities are aimed at optimising net interest income, given market interest rates levels consistent with the company s business strategies. The company does not have any significant interest rate risk exposures as currently all interest bearing borrowings and advances are at a fixed rate. ANNUAL REPORT AND FINANCIAL STATEMENTS FOR THE YEAR ENDED 31ST DECEMBER
78 4. FINANCIAL RISK MANAGEMENT OBJECTIVES AND POLICIES (Continued) (c) Market risk (continued) (ii) Interest rate risk - continued The table below summarizes the interest rate profile of the Group s interest-bearing financial assets and liabilities: Effective interest rate (%) Group KShs 000 KShs 000 Bank loans 10.73% 12.31% 6,206,197 6,339,647 Convertible loan Nil - 718,630 - Bond 8.00% 6.00% 2,053,924 6,083,468 Bank overdraft 11.27% 11.00% 429, ,074 Company 9,408,285 13,061,189 Bank loans 10% 8.00% 2,018,291 2,152,498 Sensitivity analysis for variable interest-bearing liabilities An increase of 10 percentage point in interest rates at the reporting date would increase/ (decrease) profit or loss by the amounts shown below. This analysis assumes that all other variables, in particular foreign currency rates, remain constant. Effect in Kenya Shillings (KShs) Statement of profit or loss and other comprehensive income Consolidated Consolidated Company Company KShs KShs KShs KShs Bank loans 67,788 54,629 20,183 12,054 Bank overdraft 3,608 4, ,396 59,542 20,183 12,054 A decrease of 10 percentage point in interest rates at the reporting date would have had an equal but opposite effect on the profit and loss, on the basis that all other variables remain constant. The interest rate on the convertible bond is fixed at 8% hence changes in market rates would not have an impact on profit or loss. (iii) Market price risk The Group is exposed to equity price risk which arises from available-for-sale financial instruments quoted at the Nairobi Securities Exchange (NSE). The fair values of quoted investments have been disclosed at Note 14(a). Sensitivity analysis to equity price risk A 10 percentage point increase of prices at the NSE would have increased equity by KShs 11,550 ( KShs 16,730) net of tax. There would be no impact to profit or loss as fair value changes are recognized in other comprehensive income. 78 ANNUAL REPORT AND FINANCIAL STATEMENTS FOR THE YEAR ENDED 31ST DECEMBER 2016
79 4. FINANCIAL RISK MANAGEMENT OBJECTIVES AND POLICIES (Continued) (d) Capital management The Group s objectives when managing capital are to safeguard the Group s ability to continue as a going concern in order to provide returns for shareholders and to maintain an optimal capital structure to reduce the cost of capital. In order to maintain or adjust the capital structure, the Group may adjust the amount of dividends paid to shareholders, issue new capital or sell assets to reduce debt. The Board of Directors seeks to maintain a balance between the higher returns that might be possible with higher levels of borrowings and the advantages and security afforded by a sound capital position. There were no changes in the Group s approach to capital management during the year. Neither the Group nor any of its subsidiaries are subject to externally imposed capital requirements. (e) Fair values for financial assets and financial liabilities Fair value is the price that would be received to sell an asset or paid to transfer a liability in an orderly transaction between market participants at the measurement date. The long term loans are subject to variable interest rates and as such reprice with changes in market rates. The Group has not disclosed the fair values of long term loans as the carrying amounts are a reasonable approximation of fair values. The Group has not disclosed the fair values for short-term financial instruments such as trade receivables, cash and bank balances, overdrafts, convertible bond and trade payables as their carrying amounts are a reasonable approximation of fair values. (f) Valuation hierarchy The fair value of financial assets and liabilities measured at fair values was determined as follows: Type Valuation technique Significant unobservable inputs Inter-relationship between significant unobservable inputs and fair value measurement Prices quoted at Nairobi Securities Exchange None Not applicable investments The entity s unquoted investments include investments in: bank of Kenya The Price to Book multiple approach valuation technique was used. Enterprise Value (EV)/ Net Asset Value (NAV) multiple of discount results in (decrease)/ increase in the fair value of the investment NAV multiple results in an increase/ (decrease) in the fair value of the investment. investments The Price to Book multiple approach valuation technique was used. Enterprise Value (EV)/ Net Asset Value discount results in a (decrease)/ increase in the fair value of the investment. NAV multiple results in an increase/ (decrease) in the fair value of the investment. ANNUAL REPORT AND FINANCIAL STATEMENTS FOR THE YEAR ENDED 31ST DECEMBER
80 4. FINANCIAL RISK MANAGEMENT OBJECTIVES AND POLICIES (Continued) (f) Valuation hierarchy (continued) The fair value for the financial assets as at 31 December 2016 and 31 December 2015 is as follows (these have been disclosed at Note 14): Group Level 1 Level 2 Level 3 Total KShs 000 KShs 000 KShs 000 KShs December 2016: Quoted investments Unquoted investments - 364, ,285 Total assets , , December 2015: Quoted investments Unquoted investments - 536, ,203 Total assets , ,442 Company Level 1 Level 2 Level 3 Total KShs 000 KShs 000 KShs 000 KShs December 2016: Quoted investments Unquoted investments - 272, ,269 Total assets , , December 2015: Quoted investments Unquoted investments - 428, ,441 Total assets , , REVENUE, OTHER INCOME AND EXPENSES (a) Revenue Consolidated Consolidated Company Company KShs 000 KShs 000 KShs 000 KShs 000 Sale of goods 4,897,386 5,057, Rendering of services 637, , Construction contract revenue 2,642,713 6,033, Dividends ,619 Interest income ,311 28,982 Technical fees , ,339 8,177,350 11,790, , ,940 (b) Other income (Loss)/gain on sale of property 2,895 ( 2,814) 400 (44) Discount on convertible bond 1,975, Sale of scraps Fair value change on investment property (Note 10) - 40, Other income 86,431 57, ,064,969 94, ( 44) 80 ANNUAL REPORT AND FINANCIAL STATEMENTS FOR THE YEAR ENDED 31ST DECEMBER 2016
81 5. REVENUE, OTHER INCOME AND EXPENSES (Continued) (c) Expenses by nature Cost of sales Consolidated Consolidated Company Company KShs 000 KShs 000 KShs 000 KShs 000 Raw materials 4,721,310 5,142, Direct staff costs 1,447,596 1,690, Equipment hire 464, , Machinery repairs and maintenance 4, , Utility expenses 11, , Freight 15,258 42, Licences, insurance and permits 138, , Subcontracting 162, , Others 141,816 40, ,109,123 9,259, Operating expenses Staff costs 963,273 1,093, , ,203 Directors fees (Note 28(a)) 42,584 42,398 7,093 10,843 Utility fees 104,864 87, Repairs and maintenance 91,341 76, ,619 Office expenses 227, ,699 63,196 5,660 Legal and professional fees 726, ,926 5,015 4,455 Distribution expenses 80,676 59, Others 355, ,333 95, ,545 2,591,643 2,499, , ,325 (d) Staff costs Wages and salaries 2,190,999 2,651, , ,320 Social security contributions 52,758 24, Contribution to defined contribution plans 38,386 35,373 7,669 6,840 Termination benefits 128,726 73, ,410,869 2,784, , ,203 Presented in profit or loss as follows: Cost of sales 1,447,596 1,690, Operating expenses 963,273 1,093, , ,203 2,410,869 2,784, , ,203 ANNUAL REPORT AND FINANCIAL STATEMENTS FOR THE YEAR ENDED 31ST DECEMBER
82 6 RESULTS FROM OPERATING ACTIVITIES Consolidated Consolidated Company Company KShs 000 KShs 000 KShs 000 KShs 000 Results from operating activities are arrived at after charging/(crediting): Depreciation 677, ,807 4,411 4,620 Amortisation of prepaid operating lease rentals 32,508 15, Amortisation of intangible assets 9,456 13, , ,019 4,411 4,620 Impairment of trade receivables (Note 4(a)) 724, , ,303 - Directors emoluments (Note 28(a) 42,584 45,232 7,093 10,843 Auditors remuneration 44,610 40,251 5,015 4,350 Gain/(loss) on disposal of property, plant and equipment 2,895 ( 2,815) 400 ( 44) 7. NET FINANCE COSTS (a) Consolidated Consolidated Company Company KShs 000 KShs 000 KShs 000 KShs 000 Exchange losses Loss/(gain) on exchange ( 94,012) (1,117,495) 53,876 (293,366) (b) Finance costs Interest on convertible bond ( 39,894) ( 335,070) - - Interest on loans (579,162) ( 456,159) ( 54,119) ( 71,115) (619,056) ( 791,229) ( 54,119) ( 71,115) Net finance costs (a+b) (713,068) (1,908,724) ( 243) ( 364,481) 8. INCOME TAX (a) Income tax (credit)/expense Consolidated Consolidated Company Company KShs 000 KShs 000 KShs 000 KShs 000 (i) Amounts recognised in profit or loss Current tax: Charge for the year at 30% 13, ,931 11,619 2,931 Prior year over provision - ( 14,069) ,975 90,862 11,619 2,931 Deferred tax (credit)/ expense: Current year (Note 24(c)) (755,982) (540,169) ( 242) ( 569) Prior year over provision (Note 24(c)) ( 9,204) ( 84,192) - ( 3) (765,186) (624,361) ( 242) ( 572) (751,211) (533,499) (11,377) (2,359) 82 ANNUAL REPORT AND FINANCIAL STATEMENTS FOR THE YEAR ENDED 31ST DECEMBER 2016
83 8. INCOME TAX (continued) (a) (ii) Income tax (credit)/expense (continued) Amounts recognised in other comprehensive income Arising from: Consolidated Consolidated Company Company KShs 000 KShs 000 KShs 000 KShs 000 Prepaid operating lease rentals - 248, Revaluation of property, plant and equipment 98, , , , (b) Reconciliation of effective tax rate Group The tax on the consolidated results differs from the theoretical amount using the basic tax rate as follows: Rate KShs 000 Rate KShs 000 Accounting loss before tax (1,615,101) (2,956,073) Tax at the domestic rate of 30% 30% ( 484,530) 30% ( 886,822) Prior years under provision - Current tax - 1% ( 14,069) - Deferred tax 1% ( 9,204) 3% ( 84,192) Effect of taxes in foreign jurisdictions* 6% ( 98,611) (6%) 177,556 Movement in deferred tax not recognised (10%) 160,675 (5%) 158,901 Tax effect of non-deductible expenses 0% ( 2,237) (5%) 136,911 Tax effect of non-taxable income 20% ( 317,304) 1% ( 21,784) Income tax expense 47% ( 751,211) 18% ( 533,499) * See explanations on page 84 Company Rate KShs 000 Rate KShs 000 Accounting loss before tax (323,783) (432,530) Tax at the domestic rate of 30% 30% ( 97,135) 30% (129,759) Prior years under provision: - Deferred tax 0% - 0% - Movement in deferred tax not recognised (33%) 105,892 (34%) 145,255 Tax effect of non-deductible expenses 1% 2,623 ( 3%) 14,049 Tax effect of non-taxable income ( 4%) ( 3) 7% ( 27,186) Income tax expense 0% ( 11,377) 0 % ( 2,359) ANNUAL REPORT AND FINANCIAL STATEMENTS FOR THE YEAR ENDED 31ST DECEMBER
84 8. INCOME TAX (Continued) (b) Reconciliation of effective tax rate (continued) * TransCentury Holdings Proprietary Limited and Kewberg & Braids Proprietary South Africa Limited operate in South Africa where corporate taxes are 28%. TransCentury Mauritius Limited, Cable Holding Mauritius Limited, TC Railway Holdings Limited and Safari Rail Company Limited operate in Mauritius where the corporate tax rate is 15%. Certain subsidiaries of TransCentury Mauritius Limited operate in South Sudan where tax bands range between 10% and 25%. The directors believe that the accruals for tax liabilities are adequate for all open tax years based on their assessment of many factors, including interpretations of tax law and prior year experience. (c) Movement in unrecognised deferred tax Group Prior year under provision of Movement in At 1 unrecognised unrecognised At : January deferred tax deferred tax December KShs 000 KShs 000 KShs 000 KShs 000 Arising from: Tax losses 258,827 ( 2,329) 181, ,685 Provision 10,824-79,300 90,124 Unrealised exchange loss 110,529 (29,791) (99,812) (19,074) 380,180 (32,120) 160, ,735 Prior year under provision of Movement in At 1 unrecognised unrecognised At : January deferred tax deferred tax December Arising from: KShs 000 KShs 000 KShs 000 KShs 000 Tax losses 176,309-82, ,827 Provision - 15,179 ( 4,355) 10,824 Unrealised exchange loss - 29,791 80, , ,309 44, , ,180 Deferred tax assets have not been recognized in respect of tax losses for some subsidiaries because it is not probable that future taxable profit will be available against which the subsidiaries can use the benefit therefrom. 84 ANNUAL REPORT AND FINANCIAL STATEMENTS FOR THE YEAR ENDED 31ST DECEMBER 2016
85 8. INCOME TAX (Continued) (c) Movement in unrecognised deferred tax (continued) Company Prior year under provision of Movement in At 1 unrecognised unrecognised At : January deferred tax deferred tax December KShs 000 KShs 000 KShs 000 KShs 000 Arising from: Tax losses 115,316 ( 2,329) 126, ,978 Provision 10,824-78,712 89,536 Unrealised exchange loss 110,529 (29,791) (99,812) (19,074) 236,669 (32,120) 105, ,440 Company 2015: Arising from: Tax losses 46,439-68, ,316 Provision 15,179 - (4,355) 10,824 Unrealised exchange loss 29,791-80, ,529 91, , ,669 Deferred tax assets have not been recognized in respect of tax losses for some subsidiaries because it is not probable that future taxable profit will be available against which the subsidiaries can use the benefit therefrom. (d) Tax recoverable/payable account Consolidated Consolidated Company Company KShs 000 KShs 000 KShs 000 KShs 000 Balance as at 1 January 174, ,143 5,205 5,403 Impairment/(offset) during the year Current tax charge (13,975) (104,931) (11,619) (2,931) Prior year over provision - 14, Paid during the year 153,872 87,838 8,501 2,733 Foreign exchange translation differences 11,686 2, Balance as at 31 December 325, ,741 2,087 5,205 Comprising: Current tax recoverable 352, ,651 2,087 5,205 Current tax payable ( 27,017) ( 11,910) - - Balance as at 31 December 325, ,741 2,087 5,205 ANNUAL REPORT AND FINANCIAL STATEMENTS FOR THE YEAR ENDED 31ST DECEMBER
86 9. PROPERTY, PLANT AND EQUIPMENT Group Heavy Free hold Lease hold Furniture, commercial land and land and Plant and fittings and Work in 2016: vehicles buildings buildings machinery Vehicles equipment progress Total KShs 000 KShs 000 KShs 000 KShs 000 KShs 000 KShs 000 KShs 000 KShs 000 Cost/ Valuation: At 1 January ,522, ,071 3,431,798 4,654, , , ,862 12,248,473 Prior year adjustment (1,618) - (1,618) Additions 5,821-27, ,218 8,116 11, , ,559 Transfer from work in progress , (214,972) - Disposals ( 48,779) - - (23,748) ( 15,110) ( 16,567) ( 1,184) ( 105,388) Exchange differences 120,366 22,523 ( 38,667) (160,726) ( 22,129) ( 5,053) 621 ( 83,065) At 31 December ,599, ,594 3,635,290 4,601, , , ,101 12,576,961 Comprising: Cost 2,599, , ,944 1,883,076 84,636 63, ,019 6,230,929 Valuation - 292,080 2,646,346 2,718, , ,323 87,082 6,346,032 2,599, ,594 3,635,290 4,601, , , ,101 12,576,961 Depreciation: At 1 January ,017,493 98, ,269 1,484, , ,279 5,419 4,411,855 Charge for the year 199,766-91, ,832 41,655 23, ,220 Disposals ( 48,505) - ( 11,287) (16,389) ( 10,735) ( 4,837) - ( 91,753) Exchange differences 5,001 5,364 1,390 11,767 ( 3,452) 1,635-21,705 At 31 December ,173, , ,595 1,800, , ,821 5,419 5,019,027 Carrying value: At 31 December , ,096 3,416,695 2,801,624 ( 11,650) 43, ,682 7,557, ANNUAL REPORT AND FINANCIAL STATEMENTS FOR THE YEAR ENDED 31ST DECEMBER 2016
87 9. PROPERTY, PLANT AND EQUIPMENT (Continued) Group Heavy Free hold Lease hold Furniture, commercial land and land and Plant and fittings and Work in 2015: vehicles buildings buildings machinery Vehicles equipment progress Total KShs 000 KShs 000 KShs 000 KShs 000 KShs 000 KShs 000 KShs 000 KShs 000 Cost/ Valuation: At 1 January ,980, ,059 3,154,611 4,456, , , ,801 11,294,951 Additions 420,601 43,636 8, ,241 76,435 28, , ,453 Transfer from work in progress , ,239 - (19,217) (323,650) - Transfer to operating lease rentals (Note 12) - - ( 191,722) ( 191,722) Transfer to intangible assets (Note 13) ( 9,473) ( 9,473) Disposals ( 63,783) - - ( 22,599) (35,094) ( 2,143) - ( 123,619) Revaluation ,450 ( 177,159) - 2, ,097 Exchange differences 184,491 (14,624) ( 101,087) 3,052 30, , ,786 At 31 December ,522, ,071 3,431,798 4,654, , , ,862 12,248,473 Comprising: Cost 2,522, , ,452 1,935, ,759 74,961 57,780 5,902,441 Valuation - 292,080 2,646,346 2,718, , ,323 87,082 6,346,032 2,522, ,071 3,431,798 4,654, , , ,862 12,248,473 Depreciation: At 1 January ,610,708 84, ,659 1,417, , ,401 5,419 3,931,423 Charge for the year 273,094 19,871 72, ,829 51,929 30, ,807 Disposals ( 60,291) - ( 341) ( 9,551) (29,586) ( 1,324) - ( 101,093) Revaluation - - ( 142,047) ( 302,863) - ( 233) - ( 445,143) Exchange differences 193,982 ( 6,239) ( 12,051) 53,553 23,216 1, ,861 At 31 December ,017,493 98, ,269 1,484, , ,279 5,419 4,411,855 Carrying value: At 31 December , ,937 3,294,529 3,170,090 44,941 76, ,443 7, 836,618 ANNUAL REPORT AND FINANCIAL STATEMENTS FOR THE YEAR ENDED 31ST DECEMBER
88 9. PROPERTY, PLANT AND EQUIPMENT (Continued) Company - Furniture, fittings and equipment KShs 000 KShs 000 Cost or valuation: At 1 January 30,181 25,901 Additions 467 4,813 Disposals (14,228) ( 533) At 31 December 16,420 30,181 Depreciation: At 1 January 21,027 16,644 Charge for the year 4,411 4,620 Disposals (13,822) ( 237) At 31 December 11,616 21,027 At 31 December 4,804 9,154 Fully depreciated assets value as at December 2016 amount to KShs 1,075,654,166 ( KShs 501,416,534) with a nominal depreciation of KShs 257,630,618 ( KShs 91,231,231). The work in progress (WIP) relates to ongoing factory upgrades at East African Cables Limited and Tanelec Limited. It also includes factory machines acquired in Cableries Du Congo but not yet installed and commissioned for use. Revaluation The group s property, plant and equipment is revalued once in every three years. The buildings, plant and machinery of East African Cables Limited and its subsidiary, East African Cables (Tanzania) Limited, were last revalued in December 2015 by Lloyd Masika Limited, a firm of independent professional valuers on the basis of open market value for existing use. The increase in net carrying value as a result of the revaluation was dealt with through other comprehensive income. Land and buildings of AEA Limited were professionally valued by an independent professional valuer, Lloyd Masika Limited, on 31 December 2015 in order to reflect the current market valuation in the books of account. The resulting surplus was credited to revaluation reserve. The property, plant and equipment of a subsidiary, Tanelec Limited Tanzania were last revalued in 2016 by Lloyd Jones Limited, a firm of professional valuers on the basis of depreciated replacement cost. The land and property, plant and equipment of one of the subsidiaries, Kewberg Cables & Braids Proprietary Limited were last revalued on 31 December 2014 by an independent valuer, Chris van Rooyen, a professional valuer of Chris van Rooyen Property Valuers CC. The property valuation was performed using the income capitalisation method assuming (a) a capitalisation rate of between 10.50% and 11% and (b) market related rentals. The plant and machinery valuation was performed using the replacement value approach assuming (a) A willing seller and a willing buyer exists, (b) the equipment will be freely exposed to the market, (c) a reasonable time would be allowed for the sale at a static price and (d) all values as indicated are net of removal costs, to determine the current value. 88 ANNUAL REPORT AND FINANCIAL STATEMENTS FOR THE YEAR ENDED 31ST DECEMBER 2016
89 9. PROPERTY, PLANT AND EQUIPMENT (Continued) If the leasehold buildings, plant and machinery were stated on the historical cost basis, the amounts would be as follows: Leasehold land Plant and Group and buildings machinery Total KShs 000 KShs 000 KShs 000 At 31 December 2016: Cost 988,944 1,883,076 2,872,020 Accumulated depreciation (141,540) (1,314,700) (1,456,240) Net carrying value 847, ,376 1,415,780 At 31 December 2015: Cost 785,452 1,935,332 2,720,784 Accumulated depreciation (121,761) (1,079,316) (1,201,077) Net carrying value 663, ,016 1,519,707 Security In 2016, Tanelec Limited appointed Propertywise (T) Limited P. O Box Arusha, an accredited independent valuer to value its leasehold land. The method used by the valuer in determining the fair value of assets is the fair market value. At 31 December 2016, properties of subsidiaries have been charged to secured banking facilities per Note INVESTMENT PROPERTY Consolidated Consolidated Company Company KShs 000 KShs 000 KShs 000 KShs 000 Valuation At 1 January 362, , Transfer to assets held for sale (245,626) Fair value changes - 40, Exchange differences ( 1,626) ( 26,046) - - At 31 December 115, , Revaluation Investment properties comprise of residential houses that have been leased to third parties and are carried at fair value. The investment properties of East African Cables Limited and its subsidiary, East African Cables (Tanzania) Limited, were revalued in December 2015 by Lloyd Masika Limited, a firm of independent professional valuers on the basis of open market value for existing use. The open market values are the estimated amount for which a property could be exchanged on the date of the valuation between a willing buyer and a willing seller in an arm s length transaction after proper marketing wherein the parties had each acted knowledgeably and willingly. The resulting fair value change is dealt with through profit or loss. The fair value at 31 December 2016 is assessed to have remained stable and comparable to the 2015 valuation. The properties are leased on a renewable annual lease. ANNUAL REPORT AND FINANCIAL STATEMENTS FOR THE YEAR ENDED 31ST DECEMBER
90 10. INVESTMENT PROPERTY (Continued) Measurement of fair values The fair values of investment property are categorised as Level 3. (i) Valuation techniques and significant unobservable inputs Type Valuation technique Significant unobservable inputs Inter-relationship between significant unobservable inputs and fair value measurement Investment Property Market approach: The valuation model uses prices and other relevant information generated by market transactions involving identical or similar assets. The fair value is determined as the price that would be paid to sell the land in an orderly transaction to market participants. 1. Property prices in the locality. 2. Infrastructure developments The estimated fair values would increase/ (decrease); 1. If property prices near the location of the property were higher/ (lower). 2. With improvements/ (deterioration) in infrastructure development. (ii) Level 3 fair values Reconciliation of level 3 fair values The following analysis shows reconciliation from the opening balances to the closing balances for level 3 fair values KShs 000 KShs 000 Balance at 1 January 362, ,298 Transfer to assets held for sale (Note 11) (245,626) - Fair value changes ( 1,626) 13,954 Balance at 31 December 115, , ASSET HELD FOR SALE In 2016, the Group committed to a plan to sell the investment property, a residential property on LR NO , Plot 581 situated on Malik Road, Upanga West Area, Dar es salaam, Tanzania with a carrying value of KShs 245,626,000 (2015 KShs 245,626,000). On 31st December, 2015, the property was valued for TZS 6,519,000,000 (KShs 306,750,000) (Land TZS 5,212,772,759 (KShs 254,286,000), Developments TZS 1,306,227,241 (KShs 245,626,000). After removing all costs associated with disposal, it is expected to yield at least TZS 5,220,000,000 (KShs 245,626,000). Efforts to sell have started and a sale is expected by end Efforts to sell have started and a sale is expected with the next 12 months from 31 December The property was previously included under investment property (note 10 above) as at 31 December Group KShs 000 KShs 000 Land and development (Note 10) 245, ANNUAL REPORT AND FINANCIAL STATEMENTS FOR THE YEAR ENDED 31ST DECEMBER 2016
91 12. PREPAID OPERATING LEASE RENTALS Group KShs 000 KShs 000 At 1 January 1,409, ,406 Transfer from property and equipment (Note 9) - 191,722 Amortisation for the year ( 32,508) ( 15,379) Revaluation surplus 327, ,370 Exchange differences ( 35,793) ( 29,087) At 31 December 1,668,419 1,409,032 If the prepaid operating rentals were stated on the historical cost basis, the carrying amount would be as follows: Group: KShs 000 KShs 000 Carrying value of leasehold land at 1 January 579, ,406 Transfer from Property, plant and equipment (Note 9) - 191,722 Amortisation for the year ( 32,508) ( 15,379) Exchange adjustment ( 35,793) ( 29,087) Balance at 31 December 511, ,662 Valuation techniques and significant unobservable inputs Type Valuation technique Significant unobservable inputs Inter-relationship between significant unobservable inputs and fair value measurement Prepaid operating leases Market approach: The valuation model uses prices and other relevant information generated by market transactions involving identical or similar assets. The fair value is determined as the price that would be paid to sell the land in an orderly transaction to market participants 1. Property prices in the locality. 2. Infrastructure developments The estimated fair values would increase/ (decrease); 1. If property prices near the location of the property were higher/ (lower). 2. With improvements/ (deterioration) in infrastructure development. ANNUAL REPORT AND FINANCIAL STATEMENTS FOR THE YEAR ENDED 31ST DECEMBER
92 13. INTANGIBLE ASSETS Group 2016: Software Goodwill Brand Total KShs 000 KShs 000 KShs 000 KShs 000 Cost At 1 January 84,751 2,830,464 29,585 2,944,800 Additions 6, ,383 Exchange differences 3,031 4,971 3,646 11,648 At 31 December 94,165 2,835,435 33,231 2,962,831 Amortisation At 1 January 63,870-29,585 93,455 Amortisation 9, ,456 Exchange differences 2,969-3,646 6,615 At 31 December 76,295-33, ,526 Carrying value At 31 December 17,870 2,835,435-2,853, : Software Goodwill Brand Total KShs 000 KShs 000 KShs 000 KShs 000 Cost At 1 January 70,226 2,520,260 35,036 2,625,522 Additions 6, ,280 Transfer from PPE ( ) 9, ,473 Exchange differences ( 1,228) 310,204 ( 5,451) 303,525 At 31 December 84,751 2,830,464 29,585 2,944,800 Amortisation At 1 January 51,369-35,036 86,405 Amortisation 13, ,833 Exchange differences ( 1,332) - ( 5,451) ( 6,783) At 31 December 63,870-29,585 93,455 Carrying value At 31 December 20,881 2,830,464-2,851,345 Goodwill comprises of: KShs 000 KShs 000 Civicon Africa Group Limited 2,783,031 2,778,295 Tanelec Limited 38,001 38,252 TransCentury Holdings Pty Limited 9,432 13,917 2,830,464 2,830, ANNUAL REPORT AND FINANCIAL STATEMENTS FOR THE YEAR ENDED 31ST DECEMBER 2016
93 13. INTANGIBLE ASSETS (Continued) (a) Goodwill on acquisition of TransCentury Holdings Pty Limited The goodwill recognised represents the excess of the business combination over the acquired business fair value of the identifiable assets and liabilities. The business was acquired at 7 September 2007 and the fair values determined at that date were relied upon to support the carrying value of the goodwill recognised due to the proximity of the year end to the acquisition date. The carrying amount of the goodwill is reviewed annually on the basis of forecast profits of the cash generating assets and forecast sales of the products. (b) Goodwill on acquisition of Civicon Group and Tanelec Zambia Limited (formerly Pende Group) The goodwill recognised represents the excess of the business combination over the acquired business fair value of the identifiable assets and liabilities. The businesses were acquired on 30 September 2011 and 31 May 2011 for Civicon Group and Pende Group respectively and the fair values determined at that date were relied upon to support the carrying value of the goodwill recognised due to the proximity of the year end to the acquisition date. The carrying amount of the goodwill is reviewed annually on the basis of forecast profits of the cash generating assets and forecast sales of the products. (c) Brand In accordance with IFRS 3 Business Combinations, an impairment assessment on the brand was carried out and the brand is fully impaired in these financial statements. (d) Goodwill Impairment testing Goodwill is tested annually for impairment. An impairment loss is recognized if the carrying amount of an asset or its cash-generating unit exceeds its recoverable amount. A cash-generating unit is the smallest identifiable asset group that generates cash flows that largely are independent from other assets and groups. Impairment losses are recognized in profit or loss. Impairment losses recognized in respect of cash-generating units reduce the carrying amount of the other assets in the unit (group of units) on a pro rata basis. The recoverable amount of an asset or cash-generating unit is the greater of its value in use and its fair value less costs to sell. In assessing value in use, the estimated future cash flows are discounted to their present value using a pre-tax discount rate that reflects current market assessments of the time value of money and the risks specific to the asset. Impairment losses recognized in prior periods are assessed at each reporting date for any indications that the loss has decreased or no longer exists. An impairment loss is reversed only to the extent that the asset s carrying amount does not exceed the carrying amount that would have been determined, net of depreciation or amortisation, if no impairment loss had been recognized. An impairment loss in respect of goodwill is not reversed. ANNUAL REPORT AND FINANCIAL STATEMENTS FOR THE YEAR ENDED 31ST DECEMBER
94 14. INVESTMENTS Consolidated Consolidated Company Company (a) Quoted shares KShs 000 KShs 000 KShs 000 KShs 000 Movement during the year: At 1 January Fair value loss in the year ( 74) ( 62) ( 74) ( 62) At 31 December Comprising: Cost 18,006 18,006 18,006 18,006 Cumulative fair value change (17,841) (17,767) (17,841) (17,767) (b) Unquoted shares Development Bank of Kenya Limited: Cost 78,689 78,689 78,689 78,689 Cumulative fair value gain 193, , , , , , , ,441 Mwangaza Limited: Cost 101, , Forex exchange 18,774 18, Cumulative fair value loss ( 28,522) ( 12,942) , , , , , ,441 (c) Investment in subsidiaries fair value Cable Holdings (Kenya) Limited % ( %): KShs 000 KShs 000 Cost 460, ,232 Cumulative fair value gain 1,145,437 1,950,272 1,605,669 2,410,504 AEA Limited % ( %): Cost 49,853 49,853 Cumulative fair value gain 462, , , ,131 Tanelec Limited 70% ( %): Cost 78,720 78,720 Cumulative fair value gain 638, , , ,256 TransCentury Holdings Pty Limited: 100% ( %): Cost 122, ,167 Cumulative fair value gain 457, , , , ANNUAL REPORT AND FINANCIAL STATEMENTS FOR THE YEAR ENDED 31ST DECEMBER 2016
95 14. INVESTMENTS (Continued) (c) Investment in subsidiaries fair value (continued) Crystal Limited % ( %): KShs 000 KShs 000 Cost Cumulative fair value gain TransCentury Mauritius Holdings Limited 100% ( %): Cost 973, ,103 Cumulative fair value gain 5,735,137 3,535,357 6,708,240 4,508,460 Total investment in subsidiaries 10,123,245 8,979,295 Movement during the year: At 1 January 8,979,295 9,382,670 Fair value gain/ (loss) in the year 1,143,950 ( 403,375) At 31 December 10,123,245 8,979,295 Comprising of: Cost 1,684,127 1,684,127 Cumulative fair value gain 8,439,118 7,295,168 Total investment in subsidiaries 10,123,245 8,979,295 Fair value of investment in subsidiaries is determined based on the group s fair value policy per Note 2(e). In 2016, the company acquired an additional 5.5% (KShs 245 million) shareholding in Civicon Africa Group Limited a company incorporated in Mauritius. The additional investment increased the Company s shareholding to 83.5% ( %). The acquisition involved buy out of non-controlling interest during the year and the amount involved has been included in payables as at 31 December 2016 (see note 18(b)). In 2015, the company acquired an additional 16% (KShs 712 million) shareholding in Civicon Africa Group Limited a company incorporated in Mauritius. The additional investment increased the Company s shareholding to 78% ( %). In the year 2005, the company acquired % shareholding in AEA Limited. In year 2007, the company acquired 70% shareholding in Tanelec Limited. The company holds 100% shareholding in Crystal Limited which was acquired in In 2007, the Company acquired 100% shareholding in TransCentury Holdings Pty Limited, a company incorporated in South Africa. The company holds 100% shareholding in TransCentury Mauritius Holdings, a company incorporated in Mauritius. The company was set up in The company holds 100% shareholding in Cable Holdings (Kenya) Limited. ANNUAL REPORT AND FINANCIAL STATEMENTS FOR THE YEAR ENDED 31ST DECEMBER
96 14. INVESTMENTS (Continued) (d) Change in fair value of investments Consolidated Consolidated Company Company KShs 000 KShs 000 KShs 000 KShs 000 Quoted shares ( 74) ( 62) ( 74) ( 62) Unquoted shares (171,690) (16,684) (156,174) ( 3,742) Investment in subsidiaries (Note 14(c)) - - 1,143,950 (403,375) (171,764) (16,746) 987,702 (407,179) Measurement of fair values Valuation techniques and significant unobservable inputs Financial assets measured at fair value at 31 December 2016 and 31 December 2015 Fair value hierarchy Type Valuation technique Significant unobservable inputs Inter-relationship between significant unobservable inputs and fair value measurement Level 2 Investment in subsidiaries TransCentury Limited has investments in the following subsidiaries: Cable Holdings (K) Ltd Valued using the Net assets method. Fair values of net assets in the balance sheet Increase/ (decrease) in fair value of net assets will result to an increase/decrease in the fair value of the investment. AEA Limited Valued using Discounted Cash Flow (DCF) method Weighted Average Cost of Capital (WACC) Increase/ (decrease) in WACC results in a decrease/increase in the fair value of the investment. Increase/ (decrease) in marketability discount results in a (decrease)/increase in the fair value of the investment. Tanelec Limited Valued using DCF method Weighted Average Cost of Capital (WACC) Increase/ (decrease) in WACC results in a (decrease)/increase in the fair value of the investment. Increase/ (decrease) in marketability discount results in a (decrease)/increase in the fair value of the investment. TransCentury Holdings Pty Ltd Valued using DCF method Weighted average cost of capital (WACC) Increase/ (decrease) in WACC results in a decrease/increase in the fair value of the investment. Increase/ (decrease) in marketability discount results in a (decrease)/increase in the fair value of the investment. Net assets method Fair values of net assets in the balance sheet Increase/ (decrease) in fair value of net assets will result to an increase/ (decrease) in the fair value of the investment. 96 ANNUAL REPORT AND FINANCIAL STATEMENTS FOR THE YEAR ENDED 31ST DECEMBER 2016
97 14. INVESTMENTS (Continued) (e) Non-controlling Interest (NCI) The following table summarises the information relating to each of the Group s subsidiaries that has material NCI, before any intra-group eliminations: 31 December 2016: TC Mauritius Tanelec EAC AEA Holdings In KShs 000 Ltd Ltd Ltd Ltd Total NCI percentage 30% 31.6% 6% 16.5%* Non-current assets 1,227,169 5,318, ,946 5,643,684 Current assets 551,139 2,229, ,539 3,409,058 Non-current liabilities ( 205,977) (1,672,873) ( 43,927) (3,538,354) Current liabilities (1,120,860) (3,319,126) (479,597) (5,000,014) Net assets including underlying NCI 451,471 2,556, , ,374 Underlying NCI 85,694 ( 557,457) - (200,580) Net assets excluding underlying NCI 537,165 1,998, , ,794 Net assets attributable to NCI 75,456 1,189,649 6, ,580 1,472,284 Revenue 725,171 3,650, ,417 3,036,178 Loss ( 57,004) ( 582,602) ( 18,498) ( 8,178) OCI 179,872 82,249-53,207 Total comprehensive income 122,868 ( 500,353) ( 18,498) 45,029 (Loss)/profit allocated to NCI ( 15,455) ( 184,255) ( 1,035) ( 223,010) ( 423,755) OCI allocated to NCI 53,963 ( 1,433) ,530 Cash flows from operating activities 183, , , ,283 Cash flows from investment activities ( 1,705) ( 409,766) ( 28,740) ( 290,237) Cash flows from financing activities ( 6,271) ( 53,300) ( 59,796) ( 116,340) Net increase/(decrease) in cash and cash equivalents 175, ,005 43,715 ( 101,294) * Underlying non-controlling interest at Civicon Africa Group Limited ANNUAL REPORT AND FINANCIAL STATEMENTS FOR THE YEAR ENDED 31ST DECEMBER
98 14. INVESTMENTS (Continued) (e) Non-controlling Interest (NCI) (continued) 31 December 2015: TC Mauritius Tanelec EAC AEA Holdings In KShs 000 Ltd Ltd Ltd Ltd Total NCI percentage 30% 31.6% 6% 22%* Non-current assets 939,377 5,439, ,993 5,604,054 Current assets 844,163 2,929, ,927 5,230,072 Non-current liabilities ( 143,462) (2,079,046) - ( 440,913) Current liabilities (1,302,514) (3,139,897) (494,508) (9,688,977) Net assets including underlying NCI 337,564 3,149, , ,236 Underlying NCI 79,085 ( 690,821) - ( 559,599) Net assets excluding underlying NCI 416,649 2,459, , ,637 Net assets attributable to NCI 45,910 1,468,561 7, ,599 2,081,477 Revenue 551,779 3,724, ,773 6,583,707 Loss ( 310,604) ( 741,204) ( 21,881) ( 509,952) OCI 51,428 1,002,154 15,151 37,431 Total comprehensive income ( 259,176) 260,950 ( 6,730) ( 472,521) (Loss)/profit allocated to NCI ( 129,861) ( 358,297) ( 1,223) 55,030 ( 434,351) OCI allocated to NCI 15, , ,282 Cash flows from operating activities ( 151,105) 145, ,184 Cash flows from investment activities ( 14,354) ( 202,212) ( 205) (1,645,604) Cash flows from financing activities 40, , ,883 Net increase/(decrease) in cash and cash equivalents ( 124,937) 204, ( 172,537) * Underlying non-controlling interest at Civicon Africa Group Limited 98 ANNUAL REPORT AND FINANCIAL STATEMENTS FOR THE YEAR ENDED 31ST DECEMBER 2016
99 14. INVESTMENTS (Continued) (f) Acquisition of NCI In 2016, the Group acquired an additional 5.5% interest in Civicon Africa Group Limited for KShs 245 million, increasing its ownership from 78% to 83.5%. In January 2015, the Group had acquired an additional 16% interest in Civicon Africa Group Limited for KShs 712 million in cash, increasing its ownership from 62% to 78%. The Group recognised a decrease in NCI of KShs 238 million, a decrease in retained earnings of KShs 7 million. The impact of the change is as below: KShs 000 KShs 000 Amount of NCI acquired 237, ,429 Consideration paid to NCI (245,197) (712,087) A decrease in equity attributable to owners of the group ( 7,230) (206,658) 15. LOANS TO SUBSIDIARIES Consolidated Consolidated Company Company KShs 000 KShs 000 KShs 000 KShs 000 Payable after 12 months: TransCentury Holdings Proprietary Limited - South Africa , ,237 East Africa Cables Limited , ,090 Tanelec Limited ,598 74, , ,015 Movement during the year: At 1 January , ,195 Issued during the year ,630 99,280 Repaid during the year - - ( 40,925) ( 9,460) At 31 December , ,015 Tanelec Limited In 2011, TransCentury Limited advanced USD 330,000 to Tanelec Limited. The facility was to be utilised to fund the working capital needs of the business. Interest on the loan is charged at a rate of 7.06%. In March 2015, TransCentury Limited advanced USD 400,000 to Tanelec Limited. The facility was to be utilised to fund the working capital needs of the business. Interest on the loan is charged at a rate of 9%. The funds were fully repaid as at 31st December East African Cables Limited TransCentury Limited advanced USD 4,000,000 to East African Cables Limited in April The Facility was to be utilised to fund the working capital needs of the business. Interest on the loan was charged at a rate of 9% at the end of every three (3) months. ANNUAL REPORT AND FINANCIAL STATEMENTS FOR THE YEAR ENDED 31ST DECEMBER
100 15. LOANS TO SUBSIDIARIES (Continued) Kewberg Cables & Braids Proprietary Limited In May 2011 and June 2012, TransCentury Limited advanced USD 300,000 and USD 130,000 respectively to Kewberg Cables & Braids Proprietary Limited. The facilities were to be utilised solely to finance the working capital requirements. The USD 300,000 was interest free and the USD 130,000 facility is charged at a rate of 3.5%. In September 2012 and October 2012 TransCentury Limited advanced ZAR 910,000 and ZAR 12,502,503 to Kewberg Cables & Braids Limited. The facilities were to be utilised solely to finance the working capital and capacity expansion requirements. Interest on both loans is charged at a rate of 8.5% semi-annually. In 2015, TransCentury Limited advanced loan amounting to USD 570,000 to Kewberg Cables & Braids Limited. The facility was to be utilised solely to finance the working capital and capacity expansion requirements. Interest on the loan is charged at a rate of 3.25%. In 2016, TransCentury Limited advanced a loan amounting to USD 560,000 to Kewberg Cables & Braids Limited. The facility was to be utilised solely to finance the working capital and capacity expansion requirements. Interest on the loan is charged at a rate of 3.25%. 16. INVENTORIES Consolidated Consolidated Company Company KShs 000 KShs 000 KShs 000 KShs 000 Raw materials 409, , Finished goods 286, , Work in progress 113, , Goods in transit 7,151 53, Spares and lubricants 116, , Machines 184, , Consumables 167, , Containers - 3, Provision for obsolescence and slow moving stocks ( 19,779) ( 18,700) - - 1,265,223 1,899, Inventories of KShs 4,726,655 (2015 KShs 5,142,574,000) were recognised as an expense during the year and included in cost of sales. 100 ANNUAL REPORT AND FINANCIAL STATEMENTS FOR THE YEAR ENDED 31ST DECEMBER 2016
101 17. TRADE AND OTHER RECEIVABLES Consolidated Consolidated Company Company KShs 000 KShs 000 KShs 000 KShs 000 Trade receivables 3,502,846 4,441, Bad debts provision (1,316,075) ( 612,466) - - 2,186,771 3,829, Sundry receivables and prepayments 1,542,731 2,562,512 27,773 25,969 Staff receivables 5, Due from related parties (Note 28(h)) , ,553 3,734,610 6,391, , , CASH AND BANK (a) Cash and cash equivalents Consolidated Consolidated Company Company KShs 000 KShs 000 KShs 000 KShs 000 Cash and bank balances 124, ,363 1,182 7,713 Bank overdraft (320,144) (638,074) - - Total cash and cash equivalents (196,115) (402,711) 1,182 7,713 Bank overdraft facilities The Group has entered into facilities with various banks which are secured by pledge over various marketable listed stock exchange shares including East African Cables Limited shares equivalent to KShs 2.02 billion (2015 KShs 2.05 billion). A subsidiary of TransCentury Limited, East African Cables Limited, has entered into a facility with the banks and is secured over certain land and buildings for KShs 1,370 million ( KShs 1,370 million) and debentures over all assets of the company for KShs 3.2 billion ( KShs 2.9 billion). The bank facility comprises overdraft, term loan, letters of credit, bonds/guarantee and forex dealing. (b) Notes to the statements of cash flows Group: KShs 000 KShs 000 Movement in trade and other receivables 627,236 1,604,413 Acquisition of non-controlling interest included under payables (245,197) - 382,039 1,604,413 Company: Movement in trade and other receivables 267, ,175 Receivable due to issuance of shares against Convertible bond at subsidiary 56, , ,175 ANNUAL REPORT AND FINANCIAL STATEMENTS FOR THE YEAR ENDED 31ST DECEMBER
102 19. SHARE CAPITAL KShs 000 KShs 000 Group and Company Authorised At 1 January 600, ,000 Authorized during the year: 600,000,000 shares - 300,000 At 31 December 1,200,000,000 (2015-1,200,000,000) ordinary shares of KShs 0.50 each 600, ,000 Issued and fully paid At 1 January 280,284,476 shares 140, ,142 Issued during the year: 1,142,117 shares* At 31 December 281,426,593 ( ,284,476) ordinary shares of KShs 0.50 each 140, ,142 The shareholders are entitled to dividends as declared from time to time and are entitled to one vote per share at general meetings of the Company. All the ordinary shares rank equally with regards to the Company s residual assets. *New shares were issued through conversion of the bond as disclosed under Note 23 (a). The conversion had no impact on the statements of cash flows and resulted into an increase in share premium by KShs 56 million (Note 20). 20. SHARE PREMIUM Consolidated Consolidated Company Company KShs 000 KShs 000 KShs 000 KShs 000 At 1 January 565, , , ,101 Issued during the year* 56,076-56,076 - At 31 December 621, , , , RESERVES (a) (b) (c) (d) Revenue reserves Revenue reserves relate to accumulated profits over the years. Translation reserve The translation reserve comprises all foreign currency differences arising from the translation of the financial statements of foreign operations. Available for sale reserve The available for sale reserve comprises the cumulative net change in the fair value of available-for-sale financial assets until the investment is derecognised. Revaluation reserve The revaluation reserve relates to the revaluation gain/losses on leasehold land, property, plant and equipment and is stated net of defered tax. The reserve is not distributable. 102 ANNUAL REPORT AND FINANCIAL STATEMENTS FOR THE YEAR ENDED 31ST DECEMBER 2016
103 22. PROPOSED DIVIDENDS AND EARNINGS PER SHARE (a) Basic and diluted earnings per share The calculation of basic earnings per share at 31 December 2016 was based on the loss attributable to ordinary shareholders of KShs 440,135,000 (2015 loss of KShs 1,988,223,000) and a weighted average number of ordinary shares outstanding during the year of 281,426,593 ( ,284,476) KShs 000 KShs 000 Loss attributable to ordinary shareholders (440,135) (1,988,223) Basic and diluted earnings per share (KShs) ( 1.56) ( 7.09) Diluted earnings per share is calculated by adjusting the earnings and weighted average number of ordinary shares outstanding during the year for the effects of dilutive options and other dilutive potential ordinary shares. The calculation of diluted earnings per share at 31 December 2016 was based on the loss attributable to ordinary shareholders of KShs 428,955 (2015 loss of KShs 1,988,223,000) and a weighted average number of ordinary shares outstanding after adjustment for all the effects of all dilutive potential ordinary shares of 280,284,476 ( , 284,476). (b) Weighted average number of ordinary shares KShs 000 KShs 000 Issued ordinary shares as at 1 January 280,284, ,117,380 Weighted effect of shares issued in the year 1,142,117 3,167,096 Weighted average number of ordinary shares at 31 December 281,426, ,284,476 (c) Proposed dividends Proposed dividends are accounted for as a separate component of equity until they have been ratified at a General Meeting. During the year, the directors do not recommend any dividends (2015 Nil). 23. CONVERTIBLE BOND AND LOAN (a) Convertible bond In 2011 the Group issued a United States Dollar (USD) denominated convertible bond through one of its subsidiaries, TC Mauritius Holdings Limited amounting to USD 60,270,000 (KShs 5.1bn). The total amount of the convertible bond as at 31 December 2016 was USD 20 million (KShs million) since some of the bond holders converted their portion of the bond to ordinary shares between the year ended 31 December 2011 and 31 December The movement in the bond during the year is as follows: KShs 000 KShs 000 At 1 January 6,083,468 5,386,973 Interest accrued 39, ,070 Interest paid - ( 348,891) Conversion during the year (note 19 & 20) ( 56,647) - Settlement discount (1,975,643) - Settlement to Bondholders (1,994,709) - Forex losses ( 42,439) 710,316 At 31 December 2,053,924 6,083,468 ANNUAL REPORT AND FINANCIAL STATEMENTS FOR THE YEAR ENDED 31ST DECEMBER
104 23. CONVERTIBLE BOND AND LOAN (Continued) (a) Convertible bond (continued) KShs 000 KShs 000 Presented in the statement of financial position as follows: Current 821,592 6,083,468 Non-current 1,232,332 - At 31 December 2,053,924 6,083,468 On 24 March 2016, the group signed an agreement with the bondholders to amend the terms and conditions of the convertible bond. The amendments reduced the convertible bond debt that was payable on 25 March 2016 from USD 59 million to USD 40 million as the final and full settlement of the liability. This resulted into a reduction of the liability recognised at 31 December 2016 by USD 19.4 million (KShs 1.9bn). (b) Convertible loan On 20 September 2016, the Group entered into agreement with Kuramo Capital through its wholly owned subsidiary, TC Mauritius Holdings (TCM) to inject the USD 20 million (KShs 2bn) in exchange for the issuance and allotment of 93,776,173 ordinary shares of USD 13 million (KShs 1.3 billion) in the Company and 70,120 preference shares of USD 7 million (KShs 718 million) in TCM. On 29 June 2016, one of the bond holders converted their portion of the bond to 1,142,117 ordinary shares amounting to KShs 57 million. The KShs 20 million from Kuramo (Convertible Loan) was utilised to settle the Bondholder Payment and as a consequence, the balance of US$ 20 million (KShs 2,049,716,000) being the remaining bond liability was rolled over into a three (3) year unsecured loan at an interest rate of 8%. The bond is now being paid on quarterly basis until 30th September 2018 with a prepayment option. The Convertible Loan was extinguished in exchange for the issue of New Shares as disclosed under Note KShs 000 KShs 000 Convertible to equity* 1,331,086 - Non-current liability 718,630-2,049,716 - *The convertible loan amounts classified as equity were subsequently converted to equity as disclosed under Note ANNUAL REPORT AND FINANCIAL STATEMENTS FOR THE YEAR ENDED 31ST DECEMBER 2016
105 24. DEFERRED TAX (ASSET)/ LIABILITY (a) Deferred tax asset (i) Group Recognised Prior year Exchange At Reclassification through profit (over)/under Recognised rate At 1 January (Note 23(b)) or loss provision in equity Difference 31 December KShs 000 KShs 000 KShs 000 KShs 000 KShs 000 KShs 000 KShs : Property, plant and equipment ( 69,832) - 2, ,636 27,232 Other provisions and accruals 49,706-2, ,540 Tax losses 109, ,602 9,204 - (76,876) 532,401 Unrealised exchange losses 19, (1,544) 18, , ,919 9,204-16, , : Property, plant and equipment ( 12,469) (51,802) ( 377) - (6,494) 1,310 ( 69,832) Other provisions and accruals 6, , ( 775) 49,706 Tax losses 11,973 34,809 64,264 16,103 - (17,678) 109,471 Unrealised exchange losses - ( 3,834) 23, ,393 5,992 (20,708) 130,770 16,211 (6,494) (17,033) 108,738 (ii) Company 2016: Property, plant and equipment 1, , : Property, plant and equipment ,480 ANNUAL REPORT AND FINANCIAL STATEMENTS FOR THE YEAR ENDED 31ST DECEMBER
106 24. DEFERRED TAX ASSET/ (LIABILITY) (Continued) (b) Deferred tax liability Group Recognised Recognised Prior year in other Exchange At Reclassification through profit (over)/under comprehensive rate At 1 January (Note 23(a)(i)) or loss provision income (Note (8)(a)(ii)) Difference 31 December 2016: KShs 000 KShs 000 KShs 000 KShs 000 KShs 000 KShs 000 KShs 000 Staff gratuity liability ( 6,942) - ( 1,461) - - ( 11) ( 8,414) Other provisions and accruals ( 194,581) - (140,437) - - ( 2035) ( 337,053) Unrealised exchange gain ( 46,126) - (126,375) - - ( 769) ( 173,270) Tax losses ( 335,113) - ( 2,410) - - ( 5,713) ( 343,236) Property, plant and equipment 1,462,235-10,620-98,469 ( 6,032) 1,565, ,473 - (260,063) - 98,469 ( 14,560) 703, : Staff gratuity liability ( 6,613) - (583) (6,942) Other provisions and accruals ( 102,391) 119 (98,330) (2,109) - 8,130 (194,581) Unrealised exchange gain ( 25,136) (3,835) (25,097) (466) - 8,408 (46,126) Tax losses ( 116,947) 34,809 (256,219) (685) - 3,929 (335,113) Property, plant and equipment 1,213,242 (51,801) (29,170) (64,721) 453,890 (59,205) 1,462, ,155 (20,708) (409,399) (67,981) 453,890 (38,484) 879, ANNUAL REPORT AND FINANCIAL STATEMENTS FOR THE YEAR ENDED 31ST DECEMBER 2016
107 24. DEFERRED TAX ASSET/ (LIABILITY) (Continued) (c) Deferred tax movement through profit or loss is as follows: Consolidated Consolidated Company Company KShs 000 KShs 000 KShs 000 KShs 000 Current year Deferred tax asset (495,919) (130,770) (242) (569) Deferred tax liability (260,063) (409,399) - - Prior year under provision (755,982) (540,169) (242) (569) Deferred tax asset ( 9,204) ( 16,211) - ( 3) Deferred tax liability - ( 67,981) - - ( 9,204) ( 84,192) - ( 3) 25. STAFF GRATUITY Group Balance at 1 January 45,707 59, Payments made in the year ( 8,671) ( 27,891) - - Accrual for the year 4,835 14, Balance at 31 December 41,871 45, Unionisable staff for East African Cables Limited, Tanelec Limited and Civicon Limited are eligible to gratuity upon retirement based on the terms stipulated in the respective Collective Bargaining Agreements. The gratuity is based on 16 days pay if an employee has served 1-5 years, 20 days pay if an employee has served 6-10 years and 23 days pay if an employee has served 11 years and above. Gratuity is computed at current salary. A provision is made in the financial statements for the estimated liability of such gratuity payable. Consolidated Consolidated Company Company LOANS PAYABLE KShs 000 KShs 000 KShs 000 KShs 000 Bank loans - Long term 1,023,449 3,511, ,233 - Short term 5,292,164 2,827,692 2,018,291 1,204,265 Loans from subsidiaries (Note 28(g)) , ,073 6,315,613 6,339,647 2,594,364 2,728,571 Payable after 12 months 1,023,449 3,511, ,233 Payable within 12 months 5,292,164 2,827,692 2,594,364 1,780,338 6,315,613 6,339,647 2,594,364 2,728,571 Movement in the loans is as shown below: Consolidated Consolidated Company Company KShs 000 KShs 000 KShs 000 KShs 000 Balance at 1 January 6,339,647 3,523,454 2,728,571 1,423,980 Received during the year 3,107,349 7,043,479-1,576,450 Repaid during the year (3,131,383) (4,227,286) ( 134,207) ( 271,859) Balance at 31 December 6,315,613 6,339,647 2,594,364 2,728,571 ANNUAL REPORT AND FINANCIAL STATEMENTS FOR THE YEAR ENDED 31ST DECEMBER
108 26. LOANS PAYABLE (Continued) The major loans at 31 December 2016 had the following terms: TransCentury Limited has two banking facilities with Equity Bank Limited (Kenya), worth USD 20 million and USD 11 million. Both facilities are secured by way of existing corporate guarantees by Cable Holdings (Kenya) Limited and TC Mauritius Holdings Limited for USD 50 million each executed in favour of the Bank, existing charge over the Borrower s shares in East Africa Cables Limited, AEA Limited and TC Mauritius Holdings Limited each executed in favour of the Bank to cover an aggregate of USD77 Million, existing debenture charge over the TransCentury Limited s assets executed in favour of the Bank to cover an aggregate of USD 77 Million and such other security that the Bank may from time to time deem necessary to secure the TransCentury Limited s obligations hereunder. The applicable interest rate on both facilities is 8.5% per annum on the reducing balance basis. A subsidiary of East African Cables Limited, East African Cables (Tanzania) Limited, has a bank overdraft for working capital management and a short term post-import financing loan with Standard Chartered Bank (Tanzania) Limited. The facility is charged against the leasehold land and moveable assets of the subsidiary. A subsidiary, Tanelec Limited, has entered into a bank loan facility with Standard Chartered bank (Tanzania) Limited effective July 2013 amounting to USD 13.6 million. The facility has an interest rate of 6month LIBOR+5% p.a. subject to a minimum interest of 6%. The facility is secured by first charge over Property located on Plot No. 35 Themi Industrial Area, Arusha City and a corporate guarantee by TransCentury Limited to cover the credit facility. A subsidiary, AEA Limited, has a bank facility with Chase Bank (Kenya) Limited for KShs 310 million ( KShs 310 million) secured by its leasehold land and building. Interest is charged at 14% ( %). A subsidiary of Civicon Africa Group Limited, Civicon Kenya Limited, has a working capital facility from Equity Bank Kenya Limited. The facility is secured by way of a Corporate guarantee from TransCentury Limited, the ultimate holding company, for USD47,010,000 ( USD 47,010,000), a first ranking over all asset debenture of USD 47,010,000 ( USD 47,010,000); and a legal charge over the land known as subdivision 2387 (original number 1955 and 2077) Section V, mainland North Mombasa in the amount of USD 5,120,000 ( USD 5,120,000). Interest is charged at a fixed rate of 10% ( %). The subsidiary also has an asset finance facility from Equity Bank (Kenya) Limited which is secured by way of joint registration of the motor vehicles/trucks being financed. The interest rate on the loan was at the rate of 10% ( %). During the year, the Company and its subsidiaries renegotiated with its lenders to extended repayment of borrowings amounting to KShs 2.4 billion which were initially due in 2016, to be repaid in TRADE AND OTHER PAYABLES Consolidated Consolidated Company Company KShs 000 KShs 000 KShs 000 KShs 000 Trade payables 3,621,850 2,650, Sundry creditors 1,279,074 1,623, ,154 53,984 Due to related parties (Note 28(i)) , ,946 4,900,924 4,273, , , ANNUAL REPORT AND FINANCIAL STATEMENTS FOR THE YEAR ENDED 31ST DECEMBER 2016
109 28. RELATED PARTIES TRANSACTIONS The following transactions were carried out with related parties: Consolidated Consolidated Company Company KShs 000 KShs 000 KShs 000 KShs 000 (a) Directors emoluments 42,583 45,232 7,093 10,843 (b) Inter-company sales Group KShs 000 KShs 000 From Tanelec Limited to Civicon Limited From AEA Limited to Civicon Limited 8,663 2,461 From AEA Limited to East African Cables Limited 405 1,712 From AEA Limited to Tanelec Limited - 2,540 From East African Cables Limited to Civicon Limited - 1,441 From East African Cables Limited to Kewberg Limited - 1,039 9,068 9,913 (c) Interest income - Company East African Cables Limited 32,039 11,809 Tanelec Limited 4,323 5,291 Kewberg Cables and Braid (Pty) Limited 13,949 11,882 50,311 28,982 (d) (e) Dividends receivable Company Cable Holdings (Kenya) Limited - 86,536 Technical fees Company Tanelec Limited Tanzania 31,874 21,418 AEA Limited 16,419 16,810 East African Cables Limited 39,859 17,624 Tanelec Zambia 8,664 7,880 Cableries Du Congo - 7,692 Civicon DRC Holdings Limited 114, , , ,339 (f) Loans to subsidiaries Company Payable after 12 months: TransCentury Holdings (Proprietary) Limited - South Africa 466, ,237 East African Cables Limited 358, ,090 Tanelec Limited Tanzania 31,598 74, , ,015 ANNUAL REPORT AND FINANCIAL STATEMENTS FOR THE YEAR ENDED 31ST DECEMBER
110 28. RELATED PARTIES TRANSACTIONS (Continued) KShs 000 KShs 000 (g) Loan from subsidiary Company Cable Holdings (Kenya) Limited (Note 26) 576, ,073 (h) (i) Due from related parties Company Cable Holdings (Kenya) Limited 6,850 69,208 AEA Limited 55,559 49,789 TC Mauritius Holdings 35,272 - East African Cables Limited 76,386 43,166 Crystal Limited 27,578 27,334 Tanelec Limited 212, ,979 Kewberg Cables and Braid (Pty) Limited 53, ,782 Cable Holdings Mauritius Limited 5,002 4,993 TC Railway Holdings Mauritius 3,377 3,372 Safari Rail Company Limited 2,081 2,077 Tanelec Zambia Limited 29,927 20,401 Cableries du Congo 114, ,589 Civicon DRC Holdings Limited - 89,863 Total (Note 17) 622, ,553 Due to related parties - Company Cable Holdings (Kenya) Limited 5,426 5,426 TC Mauritius Holdings Limited - 139,398 TC Holdings Pty Limited 3,776 3,420 Civicon DRC Holdings Limited 203,577 - Civicon Limited 171, ,702 Total (Note 27) 384, ,946 (j) Key management compensation Consolidated Consolidated Company Company KShs 000 KShs 000 KShs 000 KShs 000 Short-term employee benefits 243, ,409 55,562 68,780 Post-employment benefits 17,488 26,424 4,146 5, , ,833 59,708 73,928 (k) Key management transactions Directors control 12.21% of the voting shares of the company. A number of key management personnel or their related parties hold positions in other companies that result in them having control or significant influence over those other companies. A number of these companies transacted with the group during the year. The terms and conditions of these transactions were no more favourable than those available or which might reasonably be expected to be available, in similar transactions with non-key management personnel related companies on an arm s length transaction. 110 ANNUAL REPORT AND FINANCIAL STATEMENTS FOR THE YEAR ENDED 31ST DECEMBER 2016
111 29. SEGMENT INFORMATION (a) Basis of segmentation The Group has two reportable segments which are the strategic business units in the following segments: These business units offer different products and services and are managed separately because they require different technology and marketing strategies. The following summary describes the operations of each reportable segment: Reportable segment Power Engineering Operations and switchgear For each of the units, the group Chief Executive Officer reviews internal management reports. (b) Information about reportable segments Information regarding the results of each reportable segment is described below. Performance is measured based on each segment profit after tax because management believes that this information is the most relevant in evaluating the results of the respective segment relative to other entities that operate in the same industries. ANNUAL REPORT AND FINANCIAL STATEMENTS FOR THE YEAR ENDED 31ST DECEMBER
112 29. SEGMENT INFORMATION (Continued) (b) Information about reportable segments (continued) Year ended 31 December 2016 Intra-group Power Engineering Others adjustments Total KShs 000 KShs 000 KShs 000 KShs 000 KShs 000 Segment revenue 4,427,633 3,758,755 - (9,038) 8,177,350 Operating profit/(loss) ( 854,389) (1,860,681) 1,813,037 - ( 902,033) Finance costs (255,425) (503,111) 45,468 - ( 713,068) Income tax expenses 256, ,780 (11,594) - 751,211 Loss for the year (853,789) (1,857,013) 1,846,912 - ( 863,890) Attributable to: Equity holders (614,117) (1,672,930) 1,846,912 - ( 440,135) Non-controlling interest (239,672) (184,083) - - ( 423,755) Other information: Segment assets 10,099,142 6,838,282 1,974,128-18,911,552 Segment liabilities 8,223,500 5,318,031 1,540,155-15,081,686 Capital expenditure 411, , ,559 Depreciation and amortisation 341, ,314 4, , ANNUAL REPORT AND FINANCIAL STATEMENTS FOR THE YEAR ENDED 31ST DECEMBER 2016
113 29. SEGMENT INFORMATION (Continued) (b) Information about reportable segments (continued) Year ended 31 December 2015 Intra-group Power Engineering Others adjustments Total KShs 000 KShs 000 KShs 000 KShs 000 KShs 000 Segment revenue 4,718,321 7,081,819 - ( 9,913) 11,790,227 Operating profit/(loss) (1,045,425) 292,663 (294,587) - (1,047,349) Finance costs ( 1,022,887) ( 245,894) (639,943) - (1,908,724) Income tax expenses 597,385 ( 63,470) ( 416) - 533,499 Loss for the year ( 1,470,927) ( 17,065) (934,582) - (2,422,574) Attributable to: Equity holders ( 982,769) ( 70,872) (934,582) - (1,988,223) Non-controlling interest ( 488,158) 53, ( 434,351) Other information: Segment assets 11,001,336 8,151,734 2,664,911-21,817,981 Segment liabilities 8,451,824 5,276,723 4,543,664-18,272,211 Capital expenditure 311, ,954 4, ,453 Depreciation and amortisation 338, ,150 4, ,019 Segment assets comprise primarily property, plant and equipment, intangible assets, inventories, receivables and operating cash. They exclude tax and certain intra-group receivables. Segment liabilities comprise operating liabilities. They exclude tax and certain corporate borrowings. Capital expenditure comprises additions to property, plant and equipment and intangible assets. ANNUAL REPORT AND FINANCIAL STATEMENTS FOR THE YEAR ENDED 31ST DECEMBER
114 29. SEGMENT INFORMATION (Continued) (c) Geographic information The geographic information below analyses the group s revenue and non-current assets by the group and subsidiaries country of domicile (i) Revenue KShs 000 KShs 000 Kenya 5,077,211 8,773,316 Tanzania 1,034, ,379 Uganda 905, ,921 Rwanda 125,018 1,250 South Sudan 27, ,544 South Africa 41, ,663 DR Congo 908, ,507 Zambia 58,808 93,647 8,177,350 11,790,227 (ii) Non-current assets Kenya 9,074,769 7,983,801 Tanzania 1,878,955 2,644,346 Uganda 116, ,218 South Sudan 9,082 29,310 South Africa 527, ,790 Mauritius 743, ,103 DR Congo 650, ,332 Zambia 187, ,527 13,189,323 13,104, CAPITAL COMMITMENTS During 2016, the Group entered into a contract to purchase property, plant and equipment for a subsidiary, East African Cables Limited for KShs 29,000,000 (2015 KShs 250,228,000). 31. OPERATING LEASES The group leases a number of office facilities under operating leases. The leases typically run for a period of six years, with an option to renew the lease after that date. Some leases contain escalation clauses that are based on changes in market prices. In 2016, an amount of KShs 6,829,571 (2015 KShs 7,079,211) was recognised in profit or loss for operating lease payments. At 31 December, the Group s minimum lease payments under operating leases fall due as follows: Consolidated and Company KShs 000 KShs 000 Less than one year 3,331 3,071 Between one and five years 3,499 9,213 More than five years - - 6,830 12, ANNUAL REPORT AND FINANCIAL STATEMENTS FOR THE YEAR ENDED 31ST DECEMBER 2016
115 32. CONTINGENCIES A subsidiary of TransCentury Limited, Cable Holdings (Kenya) Limited, has given a guarantee and indemnity and supported a pledge of its shares in East African Cables Limited to secure borrowings by TransCentury Limited, its parent from Equity Bank Limited. The maximum exposure is KShs 2.02 billion (2015 KShs 2.05 billion) plus interest, charges and fees thereon. A subsidiary of TransCentury Limited, Civicon Limited, is a defendant in a legal claim filed by a customer, Kivuwatt Limited, related to work undertaken on a project in Rwanda. Kivuwatt Limited and Civicon Limited have made claims and counterclaims respectively that are the subject of an arbitration process in the International Chamber of Commerce. The hearing of the arbitration case happened in June 2016 and the judgement was pending as at 31 December Based on legal advice received, the directors do not expect the outcome of this case to have a material effect on the financial position of Civicon Limited and the Group, and have not disclosed the estimation of the amounts claimed by the customer as this is not yet fully quantified by experts, and the directors do not want to prejudice the position of Civicon Limited and the Group in the arbitration process. The Group also has outstanding guarantees in favour of third parties totalling to KShs 2,491,387,000 (2015 KShs 1,833,330,000). 33. EVENTS AFTER THE REPORTING PERIOD On 3rd April, 2017, the Group completed the transaction resulting to Kuramo Capital acquiring a 24.99% shareholding in TCL by allotment of 93,776,173 new ordinary shares of the Company of USD 13 million (Kshs 1,331 million) and USD 7 million (KShs 718 million) of preference shares in TCM. ANNUAL REPORT AND FINANCIAL STATEMENTS FOR THE YEAR ENDED 31ST DECEMBER
116 Other Information Composition of Net Asset and Fair Value 31-Dec Dec-15 Net asset value Fair value Net asset value Fair value KShs 000 KShs 000 KShs 000 KShs 000 Cable Holdings (Kenya) Limited * 1,604,884 1,605,669 2,410,50 4 2,410,504 AEA Limited 117, , , ,131 Tanelec Limited 451, , , ,256 TransCentury Holdings Proprietary Limited** (659,279) 579,684 (469,763) 860,892 Crystal Limited (29,774) 52 (29,581) 52 TC Mauritius Holdings Limited *** 514,374 6,708, ,235 4,508,460 Total net asset value (NAV) 1,999,638 10,123,245 3,085,372 8,979,243 No of shares 281,426, ,426, ,284, ,284,476 NAV after tax per share (KShs) Note * This is the holding company for TransCentury s 68.37% shareholding in East Africa Cables Limited Group listed on the Nairobi Securities Exchange. ** Holding company for Kewberg Cables & Braids Proprietary Limited based in South Africa. ***This includes the valuation of Civicon Group. 116 ANNUAL REPORT AND FINANCIAL STATEMENTS FOR THE YEAR ENDED 31ST DECEMBER 2016
117 Proxy Form To: The Company Secretary, TransCentury Limited P.O. Box NAIROBI I.. of being a member/members of hereby appoint.. of.... or failing him. of. as my/our proxy to vote for me/us on my/our behalf at the Annual General Meeting Of the Company to be held on 30 th June, And at any adjournment thereof. Signed/Sealed this. Day of NOTE: The proxy form should be completed and returned not later than 48 hours before the meeting or any adjournment thereof. In case of a Corporation, the Proxy must be executed under the Common Seal. ANNUAL REPORT AND FINANCIAL STATEMENTS FOR THE YEAR ENDED 31ST DECEMBER
118 Notes 118 ANNUAL REPORT AND FINANCIAL STATEMENTS FOR THE YEAR ENDED 31ST DECEMBER 2016
119

709")

120 8th Floor, West End Towers, Waiyaki Way. P. O. Box 42334, GPO, Nairobi, Kenya P: +254 (0) M: +254 (0) E:
ANNUAL REPORT AND FINANCIAL STATEMENTS
 2012 ANNUAL REPORT AND FINANCIAL STATEMENTS Contents Investing in Africa Pages Notice of the annual general meeting 2 Directors, officers and administration 3 Board of directors 4-5 Corporate governance
Trans-Century Group. An Overview INVESTING IN AFRICA
 Trans-Century Group An Overview INVESTING IN AFRICA Contents 1. Executive Summary 2. Power 3. Transport 4. Specialised Engineering 5. Consumer 6. Summary Financials 7. The Team 1 Executive Summary Trans-Century
Page 1. Kenya Commercial Bank Limited
 Page 1 Peter W. Muthoka, MBS, BA (Hons), MA, FKIB, FKIM GROUP CHAIRMAN Kenya Commercial Bank Limited Head Office Kencom House, Moi Avenue P.O. Box 53290-00200 Nairobi, Kenya Telephone: +254 20 3270210/2851210
CIRCULAR TO SHAREHOLDERS
 CIRCULAR TO SHAREHOLDERS Proposed allotment and issue of 6,334,192 new ordinary shares of the Company in exchange for the acquisition of all the issued shares in the capital of Cable Holdings (Kenya) Limited
OVERVIEW OF 2014 PERFORMANCE REPORT OF THE INDEPENDENT AUDITORS TO THE MEMBERS OF TRANSCENTURY LIMITED
 REPORT OF THE INDEPENDENT AUDITORS TO THE MEMBERS OF TRANSCENTURY LIMITED We have audited the financial statements of TransCentury Limited which comprise the consolidated and company statements of financial
Contents REPORT AND FINANCIAL STATEMENTS FOR THE YEAR ENDED 31 DECEMBER
 Contents Contents pages Notice to the annual general meeting 2 Board of directors 4 Management team 6 Corporate governance 8 Chairman s statement 10 Chief executive s statement 12 Directors, officers and
Audited 2015 Full Year Result Presentation. Phillips Oduoza, Group Managing Director/CEO
 Audited 2015 Full Year Result Presentation Phillips Oduoza, Group Managing Director/CEO Good day everyone and thanks for joining this call. The year 2015 was characterised by macroeconomic uncertainties,
TRANSCENTURY LIMITED (TCL) INITIATION OF COVERAGE
 INITIATION OF COVERAGE") TRANSCENTURY LIMITED (TCL) INITIATION OF COVERAGE September 2014 We initiate coverage on Transcentury with a BUY recommendation based on a fair value of KES 34.56. On a relative basis, the stock is trading
TRANSCENTURY LIMITED (TCL) INITIATION OF COVERAGE September 2014 We initiate coverage on Transcentury with a BUY recommendation based on a fair value of KES 34.56. On a relative basis, the stock is trading
Sub Saharan Africa Financial Services Report, & Cytonn Weekly #46/2017
 Sub Saharan Africa Financial Services Report, & Cytonn Weekly #46/2017 Focus of the Week Having established a strong research team and delivery framework in Kenya, we have now launched a Sub Saharan Africa
The changing landscape of cement in sub-saharan Africa Written by: Ielhaam Ismail, Equity Analyst at Prudential Investment Managers
 FUNDS ON FRIDAY b y G l a c i e r R e s e a r c h 08 J u n e 2 0 1 8 V o l u m e 9 61 The changing landscape of cement in sub-saharan Africa Written by: Ielhaam Ismail, Equity Analyst at Prudential Investment
Standard Chartered Bank Kenya Limited 2011 Full Year Results Announcement
 Standard Chartered Bank Kenya Limited 2011 Full Year Results Announcement Introduction The Standard Chartered Bank story is one of consistent delivery and sustained growth. We have the right strategy,
Cement s Changing Landscape ARTICLE SUMMARY
 PRUDENTIAL INSIGHTS Ielhaam Ismail Equity Analyst JUNE 2018 Cement s Changing Landscape ARTICLE SUMMARY One of the industries most likely to benefit from Africa s growing economies and infrastructure expansion
PRESENTATION BY THE KCB GROUP CEO, MR. JOSHUA OIGARA, ON FINANCING A GREEN ECONOMY HELD AT UNEP HEADQUARTERS GIGIRI ON 25 TH JUNE 2014 AT 12NOON
 PRESENTATION BY THE KCB GROUP CEO, MR. JOSHUA OIGARA, ON FINANCING A GREEN ECONOMY HELD AT UNEP HEADQUARTERS GIGIRI ON 25 TH JUNE 2014 AT 12NOON United Nations Under-Secretary General; UNEP Executive Director-
9/22/2010. Growing outside South Africa Clive Tasker, Chief Executive: Standard Bank Africa. Strategy
 Standard d Bank Group Growing outside South Africa Clive Tasker, Chief Executive: Standard Bank Africa Strategy 1 What is our strategy? To build a leading emerging markets financial services organisation
5 September Atlas Mara Limited Interim Results Six Months Ended 30 June 2018
 5 September 2018 Atlas Mara Limited Interim Results Six Months Ended 30 June 2018 Atlas Mara Limited ("Atlas Mara" or the "Company" and, including its subsidiaries, the "Group"), the sub-saharan Africa
Atlas Mara Co-Nvest Limited Interim Management Statement
 18 November 2014 Atlas Mara Co-Nvest Limited Interim Management Statement Atlas Mara Co-Nvest Limited ("Atlas Mara" or the "Company") today publishes its interim management statement for the period up
2018 NATIONAL BUSINESS CONFERENCE DINNER. Transition to High Income Status The Role of Monetary Policy and Communication
 2018 NATIONAL BUSINESS CONFERENCE DINNER Transition to High Income Status The Role of Monetary Policy and Communication Welcome Remarks by Moses D Pelaelo Governor, Bank of Botswana September 9, 2018 Distinguished
About STANLIB STANLIB Kenya. Our clients STANLIB Kenya funds. STANLIB Equity Fund. STANLIB Money Market Fund. STANLIB Balanced Fund.
 STANLIB Kenya 01 About STANLIB STANLIB Kenya 02 Our clients STANLIB Kenya funds 03 STANLIB Equity Fund 04 STANLIB Money Market Fund 05 STANLIB Balanced Fund 06 STANLIB Bond Fund 07 Investment process
Templeton Emerging Markets Smaller Companies Fund
 Franklin Templeton Investment Funds Templeton Emerging Markets Smaller Companies Fund Core Value Fund Profile Fund Details Inception Date 18 October 2007 Investment Style Benchmark(s) Core Value MSCI Emerging
The quest for profitable growth
 Global banking outlook 2015: transforming banking for the next generation The quest for profitable growth We estimate that if the average global bank grew revenues by 17% from FY13 levels, it would be
Headline Verdana Bold. Uganda PPP Act - Implications for Public Sector Accounting Kenneth LEGESI Deloitte (Uganda) Limited
 Limited") Headline Verdana Bold Uganda PPP Act - Implications for Public Sector Accounting Kenneth LEGESI Deloitte (Uganda) Limited About us Kenneth Legesi Infrastructure and Capital Projects / PPP Advisory Deloitte
Headline Verdana Bold Uganda PPP Act - Implications for Public Sector Accounting Kenneth LEGESI Deloitte (Uganda) Limited About us Kenneth Legesi Infrastructure and Capital Projects / PPP Advisory Deloitte
Africa Business Forum, Energy Industry Session
 African Development Bank Energy Financial Solutions, Policy & Regulation Africa Business Forum, Energy Industry Session May 3 rd, 2018 OUTLINE THE ENERGY SECTOR, A STRATEGIC PRIORITY FOR THE AFRICAN DEVELOPMENT
STANLIB Africa Income Fund
 STANLIB Africa Income Fund Why an Africa-focused investment strategy? About STANLIB STANLIB is a Pan-African multi-specialist investment company, active in ten African countries. We have business partners
Dear fellow Shareholders:
 Dear fellow Shareholders: Morgan Stanley made significant progress driving forward our business and strategy during 2010. We leveraged our unique position in the marketplace and our unparalleled global
DIRECTORS AND STATUTORY INFORMATION FOR THE YEAR ENDED 31 DECEMBER 2017
 DIRECTORS AND STATUTORY INFORMATION FOR THE YEAR ENDED 31 DECEMBER 2017 DIRECTORS Mr. Ngeny Biwott - Chairman Mr. Joshua. N. Oigara - Chief Executive Officer & Managing Director Mr. Henry K Rotich - Alternate
Earnings Release 2Q15
 Earnings Release 2Q15 Earnings Release 2Q15 2 Key metrics Credit Suisse (CHF million, except where indicated) Net income/(loss) attributable to shareholders 1,051 1,054 (700) 0 2,105 159 of which from
Address by THE NATIONAL BANK OF KENYA
 CENTRAL BANK OF KENYA Address by PROF. NJUGUNA NDUNG U GOVERNOR CENTRAL BANK OF KENYA at the OFFICIAL LAUNCH OF THE NATIONAL BANK OF KENYA SHARIA COMPLIANT BANKING THE NATIONAL AMANAH Sarova Stanley Hotel
Chairman s Review +8% 3,652 billion. 1,905 million +14%
 ANNUAL REPORT After another positive and fulfilling year, it is fitting for me to pay tribute to our teams across six countries, for their dedication and remarkable effort. INTRODUCTION CHAIRMAN S REVIEW
Investor Briefing & Q Performance. April 2016
 Investor Briefing & Q1 2016 Performance April 2016 Presentation Outline 1. Macro-economic overview 2. Governance & leadership structure 3. Regional expansion and diversification 4. Digital bank 5. SME
African Economic Outlook 2015
 African Economic Outlook 2015 ECA s Contribution to the World Economic and Situation Prospects 2015 (WESP 2015) Link Meeting: 22-24 October 2014 Adam Elhiraika Macroeconomic Policy Division United Nations
Statement by. Vera Songwe, Under-Secretary-General of the United Nations. Executive Secretary of the Economic Commission for Africa
 Statement by Vera Songwe, Under-Secretary-General of the United Nations Executive Secretary of the Economic Commission for Africa Fifty-second session of the Conference of African Ministers of Finance,
Franklin Global Government Bond Fund
 Franklin Templeton Investment Funds Franklin Global Government Bond Fund Fixed Income Fund Profile Fund Details Inception Date 06 September 2013 Investment Style Benchmark(s) Fixed Income Citigroup World
people and culture are key to our success
 april 2018 dear fellow shareholders, 2017 capped Morgan Stanley s journey through a multi-decade period of challenges and recovery. By transforming our business mix and risk profile, and embracing the
CIBC World Markets Frontenac Institutional Investor Conference September 18, Mr. Richard E. Waugh President, Scotiabank
 CIBC World Markets Frontenac Institutional Investor Conference September 18, 2003 Mr. Richard E. Waugh President, Scotiabank Note that accompanying slides can be found in the Investment Community Presentations
/ Financial highlights (1)
") / Financial highlights (1) % change (C$ millions, except per share and percentage amounts) 2001/2000 2001 2000 1999 1998 1997 Earnings Net interest income (2) 23% $ 6,529 $ 5,307 $ 5,152 $ 5,101 $ 5,032
/ Financial highlights (1) % change (C$ millions, except per share and percentage amounts) 2001/2000 2001 2000 1999 1998 1997 Earnings Net interest income (2) 23% $ 6,529 $ 5,307 $ 5,152 $ 5,101 $ 5,032
Franklin GCC Bond Fund
 Franklin Templeton Investment Funds Franklin GCC Bond Fund Fixed Income Fund Profile Fund Details Inception Date 30 August 2013 Investment Style Benchmark(s) Fixed Income Citigroup MENA Broad Index GCC
About STANLIB STANLIB Kenya. STANLIB Kenya Money Market Fund. STANLIB Kenya Balanced Fund. STANLIB Kenya Equity Fund. STANLIB Kenya Bond Fund
 STANLIB Kenya 01 About STANLIB STANLIB Kenya 03 STANLIB Kenya Money Market Fund 04 STANLIB Kenya Balanced Fund 05 STANLIB Kenya Equity Fund 06 STANLIB Kenya Bond Fund 07 Team profiles 09 General information
Franklin Asia Credit Fund
 Franklin Templeton Investment Funds Franklin Asia Credit Fund Fixed Income Fund Profile Fund Details Inception Date 17 November 2014 Investment Style Benchmark(s) Fixed Income JP Morgan Asia Credit Index
Kenya s IMF Standby Facility, & Cytonn Weekly #31/2018
 Kenya s IMF, & Cytonn Weekly #31/2018 Focus of the Week The International Monetary Fund (IMF) recently concluded their visit to Kenya where they were holding discussions with the Kenyan Government on the
CENTRAL BANK OF KENYA
 CENTRAL BANK OF KENYA Speech by PROF. NJUGUNA NDUNG U GOVERNOR CENTRAL BANK OF KENYA at the LAUNCH OF THE KENYA@50 GOLD COMMEMORATIVE COIN Kenyatta International Conference Centre, Nairobi Monday, December
Franklin Mutual European Fund
 Franklin Templeton Investment Funds Franklin Mutual European Fund Deep Value Fund Profile Fund Details Inception Date 3 April 2000 Investment Style Benchmark(s) Deep Value MSCI Europe NETR (Price with
KCB INVESTOR AND MEDIA PRESENTATION 2012 FULL YEAR GROUP AUDITED FINANCIAL RESULTS
 KCB INVESTOR AND MEDIA PRESENTATION 2012 FULL YEAR GROUP AUDITED FINANCIAL RESULTS 1 Outline 1. East Africa Macroeconomic View 2. The Bank at a Glance 3. 2012 full year KCB group Financial Results 4. Future
OM Asset Management Business Review 2016
 OM Asset Business Review 2016 2 Business review Institutional Asset Peter Bain Chief Executive Officer OM Asset (OMAM) We are an institutionally driven, active investment management business delivered
Japan-Africa Public-Private Economic Forum. Summary. Johannesburg, 4 May 2018
 Japan-Africa Public-Private Economic Forum Summary Johannesburg, 4 May 2018 1. Introduction Japan-Africa Public-Private Economic Forum was held in South Africa, 3-4 May 2018, under the presence of Mr.
A Review of Macroeconomic Environment and Economic Implications of 2016/17 Budget
 A Review of Macroeconomic Environment and Economic Implications of 2016/17 Budget BENSON KIRIGA KIPPRA NATIONAL BUDGET REVIEW SEMINAR HILTON HOTEL, 17 TH JUNE 2016 Structure Introduction Priority areas
A live webcast of the Annual General Meetings will also be available on the Goodman website (
 17 November 2016 The Manager Company Notices Section ASX Limited Exchange Centre 20 Bridge Street Sydney NSW 2000 Dear Sir / Madam GOODMAN GROUP (GOODMAN) ANNUAL GENERAL MEETINGS CHAIRMAN S AND CEO S PRESENTATIONS
Nairobi Securities Exchange. 6th June 2015
 Nairobi Securities Exchange Kenya Diaspora Trade and Investment Conference Investment in Securities For The Kenyan Diaspora Geoffrey Odundo Chief Executive 6th June 2015 CONTENTS 1. About the NSE 2. Kenyan
Standard Chartered first half profit up 9% to US$3.95bn
 Standard Chartered first half profit up 9% to US$3.95bn Strong momentum combined with diversity of performance provides real resilience Highlights: Group income climbs 9%, with growth across our markets.
Franklin Global Sukuk Fund
 Franklin Templeton Shariah Funds Franklin Global Sukuk Fund Fixed Income Fund Profile Fund Details Inception Date 10 September 2012 Investment Style Benchmark(s) Fixed Income Dow Jones Sukuk (USD) Index
REGIONAL MATTERS ARISING FROM REPORTS OF THE WHO INTERNAL AND EXTERNAL AUDITS. Information Document CONTENTS BACKGROUND
 2 June REGIONAL COMMITTEE FOR AFRICA ORIGINAL: ENGLISH Sixty-seventh session Victoria Falls, Republic of Zimbabwe, 28 August 1 September Provisional agenda item 19.9 REGIONAL MATTERS ARISING FROM REPORTS
WHAT DRIVES US. Customer perspective Market share Shared Value Brand position STRATEGY: TRANSFORMATIVE PARTNERSHIPS
 FY 2018 RESULTS OUR STRATEGY WHO WE ARE Our Purpose Simplifying your world to enable your progress Our Promise Go Ahead Our Values Inspiring Simple Friendly WHAT DRIVES US Customer perspective Market share
CENTRAL BANK OF KENYA
 CENTRAL BANK OF KENYA Remarks by PROF. NJUGUNA NDUNG U GOVERNOR CENTRAL BANK OF KENYA at the OFFICIAL LAUNCH OF THE EAST AFRICAN PAYMENTS SYSTEM (EAPS) KICC, Nairobi, Kenya Friday, 16 th May 2014 Dr. Enos
WE THANK YOU FOR SPARING YOUR VALUABLE TIME TO BE HERE WITH US THIS EARLY MORNING.
 SPEECH BY THE MANAGING DIRECTOR OF KENYA REINSURANCE CORPORATION LIMITED, MR. JADIAH MWARANIA, DURING THE OFFICIAL RELEASE OF KENYA RE S ANNUAL FINANCILA RESULTS FOR THE YEAR 2011 AT THE HILTON HOTEL,
Leading global banking practices Emilio Pera, May 2013
 Leading global banking practices Emilio Pera, May 203!@# Agenda Banking in Africa 2 Global Banking Outlook 3 Questions/discussion 2 Africa Attractiveness Getting down to business!@# How Infrastructure
Dollar guidance revised upwards; Rupee guidance revised downwards, reflecting appreciating Rupee
 Q1 revenues grew by 25.1% year on year; sequential growth flat Dollar guidance revised upwards; Rupee guidance revised downwards, reflecting appreciating Rupee Bangalore, India July 11, 2007 Highlights
Africa & Middle East. September rd CLSA Investors Forum Sunil Kaushal Regional CEO, Africa & Middle East
 Africa & Middle East September 2016 23 rd CLSA Investors Forum Sunil Kaushal Regional CEO, Africa & Middle East 0 Forward looking statements This document contains or incorporates by reference forward-looking
Corporate Governance Report
 Corporate Governance Report The following report focuses on the activities that took place during 2016 relative to Corporate Governance matters. The standard Corporate Governance practices of the Group
Réunion de Reconstitution 14 th ADF Replenishment Meeting. Economic Outlook of ADF Countries
 Réunion de Reconstitution 14 th ADF Replenishment Meeting Economic Outlook of ADF Countries GDP growth (%) ADF countries showed resilience despite weakening global economy Medium-term economic growth prospects
Paramount Equity Financial Corp. 37 Sandiford Dr, Suite 400 Stouffville, ON L4A 3Z2 Canada
 PARAMOUNT EQUITY FINANCIAL CORPORATION Paramount Equity Financial Corporation (PEFC) is a real estate investment firm and Mortgage Administrator that specializes in the origination and administration of
KEYNOTE ADDRESS BY THE CABINET SECRETARY FOR THE NATIONAL TREASURY AND PLANNING, MR
 KEYNOTE ADDRESS BY THE CABINET SECRETARY FOR THE NATIONAL TREASURY AND PLANNING, MR. HENRY ROTICH, EGH, DURING THE OFFICIAL LAUNCH OF THE 2018/2023 STRATEGIC PLAN AT THE KENYATTA INTERNATIONAL CONVENTION
Standard Chartered Bank in Africa, ECOWAS
 BM15-12E Standard Chartered Bank in Africa, ECOWAS Yasunori Takeuchi, CEO Japan Standard Chartered Bank October 28, 2015 0 Contents Opportunities in Africa Challenges in Africa Japanese Companies in Africa
Sub-Sahara Africa Economic Outlook
 Sub-Sahara Africa Economic Outlook Nicholas Staines and Jean-Paul Mvogo International Monetary Fund Kinshasa, November 2015 nstaines@imf.org and mvogo@imf.org www.imf.org and www.imf.org/kinshasa Regional
Creating value for corporate America
 Creating value for corporate America The Rise of M&A is likely to continue..in the U.S., non- financial companies in the S&P s 500 sit on a record of USD 1.4 trillion cash. Meanwhile borrowing is cheap.
Good morning and welcome to AIA s 2018 interim results presentation. I am Lance Burbidge, Chief Investor Relations Officer.
 AIA Group Limited 2018 Interim Results Analyst Briefing Presentation Transcript 24 August 2018 Lance Burbidge, Chief Investor Relations Officer: Good morning and welcome to AIA s 2018 interim results presentation.
Statement by the President (Dr.Hossein Ghazavi) of the ECO Trade and Development Bank IRAN INVESTMENT SUMMIT Tehran-I.R. of Iran (23-24November 2011)
 of the ECO Trade and Development Bank IRAN INVESTMENT SUMMIT Tehran-I.R. of Iran (23-24November 2011)") Statement by the President (Dr.Hossein Ghazavi) of the ECO Trade and Development Bank IRAN INVESTMENT SUMMIT Tehran-I.R. of Iran (23-24November 2011) Mr. Chairman, Excellencies, Distinguished Guests, Ladies
Statement by the President (Dr.Hossein Ghazavi) of the ECO Trade and Development Bank IRAN INVESTMENT SUMMIT Tehran-I.R. of Iran (23-24November 2011) Mr. Chairman, Excellencies, Distinguished Guests, Ladies
Making choices. EY s attractiveness survey Africa 2015
 Making choices EY s attractiveness survey Africa 2015 Africa attractiveness surveys Background Fifth annual Africa attractiveness survey Analysis of greenfield and brownfield foreign direct investment
Templeton Emerging Markets Fund
 Franklin Templeton Investment Funds Templeton Emerging Markets Fund Core Value Fund Profile Fund Details Inception Date 28 February 1991 Investment Style Benchmark(s) Core Value MSCI Emerging Markets Index
AGM Notes to the Agenda
 Notes to the Agenda for the Annual General Meeting of Koninklijke DSM N.V. to be held on Wednesday 3 May 2017 NOTES TO AGENDA ITEM 2 Annual Report for 2016 by the Managing Board The Managing Board will
International Monetary and Financial Committee
 International Monetary and Financial Committee Thirty-Third Meeting April 16, 2016 IMFC Statement by Pravin Jamnadas Gordhan Minister of Finance, South Africa On behalf of Angola, Botswana, Burundi, Eritrea,
Local currency financing: some considerations for DBSA
 Local currency financing: some considerations for DBSA Prepared by: Tabo Foulo KMI Unit of Strategy Division 9 June, 2016 1 Table of contents Executive Summary 3 1.The context 4 2.Local Currency Financing(LCF)
Policy Recommendations and Options: Harnessing Sovereign Wealth Funds for Sustainable Economic Development in Africa
 The Brown Capital Management Africa Forum Paper No. 5 Policy Recommendations and Options: Harnessing Sovereign Wealth Funds for Sustainable Economic Development in Africa August 2016 O n June 14 2016,
Access Bank Diamond Bank Merger. Creating Nigeria and Africa s Largest Retail Bank
 Access Bank Bank Merger Creating Nigeria and Africa s Largest Retail Bank December 2018 Disclaimer This Investor Presentation (this Presentation ) is being provided in connection with the proposed merger
2017 MONETARY POLICY STATEMENT
 BANK OF BOTSWANA 2017 MONETARY POLICY STATEMENT by Moses D Pelaelo Governor February 27, 2017 Introduction It is indeed a great pleasure and honour to welcome all of you, on behalf of the Board, management
Diversifying Africa s Largest Economy PAPER PRESENTED BY DR.OKECHUKWU E.ENELAMAH HONOURABLE MINISTER OF INDUSTRY, TRADE & INVESTMENT
 Diversifying Africa s Largest Economy PAPER PRESENTED BY DR.OKECHUKWU E.ENELAMAH HONOURABLE MINISTER OF INDUSTRY, TRADE & INVESTMENT AT 4 TH WTO CHINA ACCESSION ROUNDTABLE. PROTOCOL I will like to thank
ANNUAL REPORT OLD MUTUAL UNIT TRUST FUNDS. Abridged Report to Unit Holders for the Year ended 31 December 2017 PLANNING FOR POSITIVE FUTURES
 2017 ANNUAL REPORT OLD MUTUAL UNIT TRUST FUNDS Abridged Report to Unit Holders for the Year ended 31 December 2017 PLANNING FOR POSITIVE FUTURES 2 OLD MUTUAL UNIT TRUST FUNDS ANNUAL REPORT TABLE OF CONTENTS
UnitedHealth Group Fourth Quarter and Year End 2014 Results Teleconference Prepared Remarks January 21, Moderator:
 UnitedHealth Group Fourth Quarter and Year End 2014 Results Teleconference Prepared Remarks January 21, 2015 Moderator: Good morning, I will be your conference facilitator today. Welcome to the UnitedHealth
Waters Corporation Management Presentation
 Waters Corporation Management Presentation Chris O Connell Chairman & Chief Executive Officer January 2019 Cautionary Statements This presentation may contain forward-looking statements regarding future
For personal use only
 19 February 2014 Company Announcements Platform Australian Securities Exchange Limited 20 Bridge Street Sydney NSW 2000 Dear Sir/Madam Aristocrat Leisure Limited 2014 Annual General Meeting In accordance
NAIROBI (Xinhua) -- Investment analysts in Kenya will be regulated under a new proposed law as the country readies itself for several mega projects.
 -- Investment analysts in Kenya will be regulated under a new proposed law as the country readies itself for several mega projects.") 1 Coast Week Kenya to improve profile of investment analysts NAIROBI (Xinhua) -- Investment analysts in Kenya will be regulated under a new proposed law as the country readies itself for several mega projects.
1 Coast Week Kenya to improve profile of investment analysts NAIROBI (Xinhua) -- Investment analysts in Kenya will be regulated under a new proposed law as the country readies itself for several mega projects.
OLD MUTUAL EMERGING MARKETS
 OLD MUTUAL EMERGING MARKETS Capital Markets Day Ralph Mupita, Chief Executive 11 October 2016 INVESTMENT SAVINGS INSURANCE BANKING DISCLAIMER This presentation may contain certain forward-looking statements
In contrast to developed and highly competitive markets like the US and Europe, where private capital is often
 Africa: The Opportunity At Hand Dan POgue & Chris Keller, CFA May 2014 Executive Summary In contrast to developed and highly competitive markets like the US and Europe, where private capital is often used
TRENDS, DYNAMICS, AND CHALLENGES OF CAPITAL FLOWS TO FRONTIER MARKETS
 HIGH-LEVEL CONFERENCE ON MANAGING CAPITAL FLOWS: LESSONS FROM EMERGING MARKETS FOR FRONTIER ECONOMIES MARCH 2, 2015, MAURITIUS TRENDS, DYNAMICS, AND CHALLENGES OF CAPITAL FLOWS TO FRONTIER MARKETS By Henry
Africa & Middle East. Goldman Sachs European Financials Conference. Sunil Kaushal Regional CEO, Africa & Middle East
 Africa & Middle East Goldman Sachs European Financials Conference Sunil Kaushal Regional CEO, Africa & Middle East 0 Forward looking statements This document contains or incorporates by reference forward-looking
SASOL S JOINT PRESIDENTS AND CHIEF EXECUTIVE OFFICERS, BONGANI NQWABABA & STEPHEN CORNELL YEAR-END RESULTS ANNOUNCEMENT (MEDIA)
") SASOL S JOINT PRESIDENTS AND CHIEF EXECUTIVE OFFICERS, BONGANI NQWABABA & STEPHEN CORNELL YEAR-END RESULTS ANNOUNCEMENT (MEDIA) MONDAY, 12 SEPTEMBER 2016 AT 10H00 JOHANNESBURG Page 1 of 9 [BONGANI] SLIDE
SASOL S JOINT PRESIDENTS AND CHIEF EXECUTIVE OFFICERS, BONGANI NQWABABA & STEPHEN CORNELL YEAR-END RESULTS ANNOUNCEMENT (MEDIA) MONDAY, 12 SEPTEMBER 2016 AT 10H00 JOHANNESBURG Page 1 of 9 [BONGANI] SLIDE
BREAKING BARRIERS IN INSURANCE
 BREAKING BARRIERS IN INSURANCE AB Consultants Ltd is an independent market driver seeking to increase insurance penetration in sub-saharan Africa. One of the ways we do this is through trainings meant
2015 ANALYSIS OF CORPORATE GOVERNANCE DISCLOSURES IN ANNUAL REPORTS. Annual Reports December Page 0
 2015 ANALYSIS OF CORPORATE GOVERNANCE DISCLOSURES IN ANNUAL REPORTS Annual Reports 2013 2014 December 2015 Page 0 Table of Contents EXECUTIVE SUMMARY... 2 PRINCIPLE 1: ESTABLISH CLEAR ROLES AND RESPONSIBILITIES...
ASSURANCE & ADVISORY RENEWABLE ENERGY ACCOUNTING & TAX COMPANY PROFILE
 ASSURANCE & ADVISORY RENEWABLE ENERGY ACCOUNTING & TAX COMPANY PROFILE WhoInvestment Holdings (Pty) Ltd NIH is a 100% black owned Consulting and Investment Company. The company consists of three business
REMARKS GOVERNOR CENTRAL BANK OF KENYA
 REMARKS BY PROF. NJUGUNA NDUNG U GOVERNOR CENTRAL BANK OF KENYA at the BANK OF INDIA S 105 TH FOUNDATION DAY CELEBRATIONS Hotel Panafric, Nairobi Tuesday, September 07, 2010 Your Excellency Sibabrata Tripathi,
Zeti Akhtar Aziz: Islamic finance a global growth opportunity amidst a challenging environment
 Zeti Akhtar Aziz: Islamic finance a global growth opportunity amidst a challenging environment Keynote address by Dr Zeti Akhtar Aziz, Governor of the Central Bank of Malaysia, at the State Street Islamic
CENTRAL BANK OF KENYA
 CENTRAL BANK OF KENYA STRENGTHENING REGULATORY FRAMEWORKS IN THE FINANCE INDUSTRY: A KEY ENABLER FOR PRIVATE SECTOR DEVELOPMENT A KEYNOTE SPEECH BY PROF. NJUGUNA NDUNG U GOVERNOR CENTRAL BANK OF KENYA
Our Expertise. IFC blends investment with advice and resource mobilization to help the private sector advance development.
 Our Expertise IFC blends investment with advice and resource mobilization to help the private sector advance development. Where We Work As the largest global development institution focused on the private
PENSION FUNDS & ALTERNATIVE INVESTMENTS AFRICA DATE: MARCH, 2017 VENUE: INTERCONTINENTAL RESORT, BALACLAVA, MAURITIUS
 PENSION FUNDS & ALTERNATIVE INVESTMENTS AFRICA DATE: 15-16 MARCH, 2017 VENUE: INTERCONTINENTAL RESORT, BALACLAVA, MAURITIUS OFFICIAL CONFERENCE REMARKS BY: THAPELO TSHEOLE CHIEF EXECUTIVE OFFICER BOTSWANA
Cheuvreux Technology and IT Day
 Nicolas DUFOURCQ, CFO March 3 rd, 2009 Capgemini is fully equipped to face the downturn 2008: a solid performance predicted and delivered Meeting our guidance on growth and margin, despite a challenging
WELCOME ADDRESS DELIVERED DR ERNEST ADDISON GOVERNOR, BANK OF GHANA KEMPINSKI HOTEL, ACCRA AUGUST 18, 2017
 WELCOME ADDRESS DELIVERED BY DR ERNEST ADDISON GOVERNOR, BANK OF GHANA AT BANK OF GHANA 60 TH ANNIVERSARY LECTURES AND EXHIBITION AT KEMPINSKI HOTEL, ACCRA ON AUGUST 18, 2017 Your Excellency, the President
BUILDING THE FUTURE A LOOK AT THE ECONOMIC POTENTIAL OF EAST AFRICA
 BUILDING THE FUTURE A LOOK AT THE ECONOMIC POTENTIAL OF EAST AFRICA REPORT HIGHLIGHTS: BUILDING THE FUTURE A LOOK AT THE ECONOMIC POTENTIAL OF EAST AFRICA Building the Future: A Look at the Economic Potential
Facts Behind the Figures
 Ecobank Group Facts Behind the Figures Presentation to the Nigeria Stock Exchange 10 June, 2016 1 Forward looking statements This presentation includes forward-looking statements. These statements contain
C API TA L. Executive Summary. ENTO F&B Private Equity Fund DIFC Close-Ended Exempt Fund Regulated by the DFSA
 C API TA L Executive Summary ENTO F&B Private Equity Fund DIFC Close-Ended Exempt Fund Regulated by the DFSA Related Parties Fund Manager C API TAL Fund Administrator External Valuer Auditor Investment
The Five Critical Factors of the LMRI
 FIXED INCOME July 6, 2018 Templeton Global Macro makes a compelling case that finding attractive opportunities in emerging markets lies in distinguishing the more resilient countries from the rest. Here,
STEP MAURITIUS CONFERENCE 2013
 Speech by His Excellency the President of the Republic of Mauritius on the occasion of the Official Opening at the STEP MAURITIUS CONFERENCE 2013 Le Meridien Hotel, Mauritius 09 April 2013 1 Mr. Nick Jacobs,
To us there are no foreign markets. Managed Portfolio Service. Dynamic solutions in an ever changing world
 To us there are no foreign markets. Managed Portfolio Service Dynamic solutions in an ever changing world N38º41 58 W109º42 9 INVESTMENT OUTCOME NEW BEGINNINGS, USA Your world isn t confined to a single