Cross-section Study on Return of Stocks to. Future-expectation Theorem
|
|
|
- Sherman Ward
- 5 years ago
- Views:
Transcription
1 Cross-section Study on Return of Stocks to Future-expectation Theorem Yiqiao Yin B.A. Mathematics 14 and M.S. Finance 16 University of Rochester - Simon Business School Fall of 2015
2 Abstract This paper discusses an application of behavioral finance. To understand Efficient Market Hypothesis, we present a cross-section analysis in this paper with a multi-various regression model. This paper explains return of stock prices by the return of fundamental factors and also compares the coefficients of returns of current fundamentals and that of the fundamentals in previous years. Results show Total Equity is the only fundamental factors that show significance explaining return of stock prices. Furthermore, the result shows that the coefficients of current fundamentals are statistically more significant than the previous ones, which illustrates that market digests all current publicly available information and moves relatively to information at present instead of the past. Last, the paper lands on an introduction of Future-expectation Theorem. 1 Introduction Event studies produce useful evidence on how stock prices respond to information. Returns of stock prices do not follow any scientific equations. This is where event studies can be very useful for to understand the emotional content behind returns of stock prices. Efficient Market Hypothesis states that prices fully reflect available information in the current market. However, there is a developing literature that challenges this topic, arguing instead that stock prices adjust slowly to information. In real life, it is possible for anyone to open up an individual brokerage account and directly participate in the market whether the action is guided by any rationale or not. However, chances that these individuals can actually affect market will not be significant. On the other hand, for anyone with a purchasing power big enough to affect the market or even to manipulate a particular stock, he probably does enough research to persuade him that his action is led by rationale instead of his emotions. John Boggle, the founder of Vanguard, stated in his book The Clash of the Cultures that intelligent investors try to separate their emotions of hope, fear, and greed from their trust in reason, and then expect that wisdom will prevail 1
3 over the long term. Hope, fear, and greed go along with the volatile market of short-term expectations, while trust in reason goes with the real market of long-term intrinsic value. Hence, it is reasonable to assume market fully digests all publicly available information. This paper presents a study to understand market efficient hypothesis. Following the definition of efficient market, the current prices should be correlated with current fundamental data available from the book with higher significances than with past fundamental data. However, to claim market takes time to digest current publicly available information, one needs to show that the current prices relate to current fundamental data in fewer significances than to past fundamental data. This paper shows a cross-section study on an expansion of three-factor model, which will be explained in the next section. Then we analyze the result of the cross-section analysis of the multi-various regression model. The results, as stated in the definition of Efficient Market Hypothesis, persuade us that the current prices of stocks can be described by current fundamental factors with higher significances than by past fundamental factors. This helps to illustrate that market digest publicly available information. The last section of this paper states an important theorem: Future-expectation Theorem. Disregard the size of buying power for an investor, investor will look at whatever information that is persuasive enough for him to make an investment decision that he thinks to be sound. The information can be in the past, at present, or expectation from the future. The final argument this paper makes is that the current return of stock prices is determined by the future-expectation of the everything related to the investment decision, namely Future-expectation Theorem. 2 Multi-various Regression Model Investors analyze the fundamental of a company by determining the intrinsic value. It is a subjective value determined by the experience of an investor on a security. Although there is no rule to calculate intrinsic value, discounted cash flow is a reasonable method to show how much a company truly worth. In this section, 2
4 we explain the rationale behind the selection of independent variables and we seek correlation between crosssection of stock returns and the fundamental indicators. 2.1 Background Intrinsic value is the present value of a company when we discount the future cash flow. We calculate the present value by discounting the future cash flow with discounting factor, a number calculated from debt and equity ratio. This illustration describes that the major investment that a company will purchase in the future can be financed by debt or equity. It is reasonable to assume that debt and equity may be correlated with stock prices. Secondly, investors also use revenues or net income as a major factor to make investment decisions. Although a series of revenues or net income may have more power to make arguments than a single revenue or net income at a particular time, the information from immediate earnings report will affect stock market one direction or another. It is also reasonable to assume that revenues or net income may affect stock prices. From this aspect, we choose the following fundamental indicators as independent variables: Total Liabilities (TL), Total Shareholders Equities (TE), Net Income-to-Revenue (NI/R). 2.2 Three-factor Hypothesis The returns of stocks, assuming market prices rationally reflect all the available information, should correlated with returns of basic fundamental indicators. We therefore have the following three-factor hypothesis with β i to be the coefficient and α to be the error term. T hree factor Hypothesis : dp = β 1 dt L + β 2 dt E + β 3 dni/r + α Under this hypothesis, we look at return of stock prices by looking at the return of three fundamental factors. Instead of claiming a causal effect, this is a mathematical description of the returns of stock prices. 2.3 Multi-various Regression Model 3
5 With the understanding of return of stock prices, we now want to explore if market digest current information as we expected. We are assuming that the three fundamental factors affect all the companies in the sample size in the same way. In this model, we selected thirty companies from Dow Jones Industrial Average (DJIA) to be our sample size. We collected data points annually ten years in the past. We created a cross-section model to understand how important the time difference is when the market digests the publicly available information. We are looking at the returns of these data so we omit the first row of each company (since there is no number before to calculate the return for the first row). Hence, our sample size includes the annual fundamental data of thirty companies ten years in the past. We had each fundamental factors to pair up with the current price. Then we manipulated the fundamental factors one-year in the past and two-year in the past to each pair up with current prices. Hence, we have first derivative (the return in mathematical language) of Total Liabilities (TL), Total Shareholders Equity (TE), and Net Income-to-Revenue (NI/R), and we also have each fundamental factor shifted once and twice in the past, namely T L t 1, T L t 2, T E t 1, T E t 2, NI NI R, and t 1 R t 2. β 7 dni/r Nine factor Hypothesis : dp + β 8 dni/r t 1 + β 9 dni/r t 2 + α = β 1 dt L dt L + β t 1 dt L 2 + β t 2 dt E dt E 3 + β 4 + β t 1 dt E 5 + β t We have Total Liabilities (TL), Total Shareholders Equity (TE), and Net Income-to-Revenue (NI/R) as three independent variables. After the inputs of (T L t 1 ), (T L t 2 ), (T E t 1 ), (T E t 2 ), NI R t 1, and NI R, we are looking at how the fundamental factors at present and in the past (one-year and two-year t 2 in the past) affect the cross-section of return of stock prices. Instead of having an α for each of the thirty companies, we assume that each of the independent variables affect the returns of stock prices the same and we use indicator to separate these companies. An indicator i will be 1 for a particular company and will be 0 for the rest of the companies. We then created a cross-section model with dependent variable to be the returns of stock prices from a sample of thirty companies ten years in the past. Cross section Model 1 : dp = β 1 dt L + β 2 dt L t 1 + β 3 dt L t 2 + β 4 dt E + β 5 dt E t 1 + β 6 dt E t 2 + 4
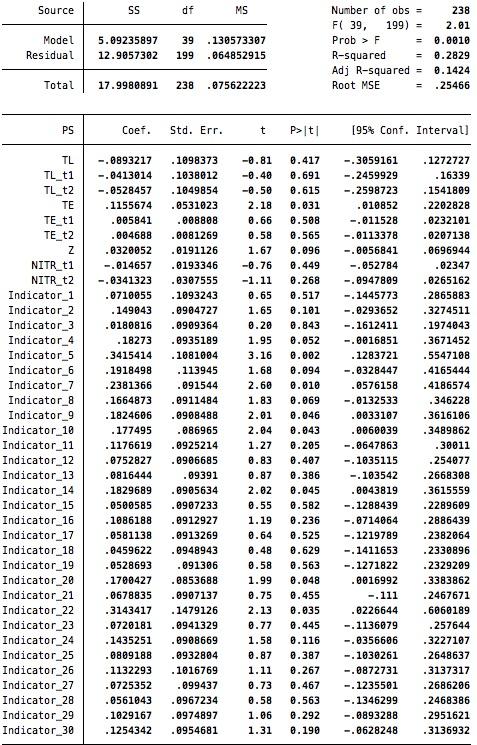
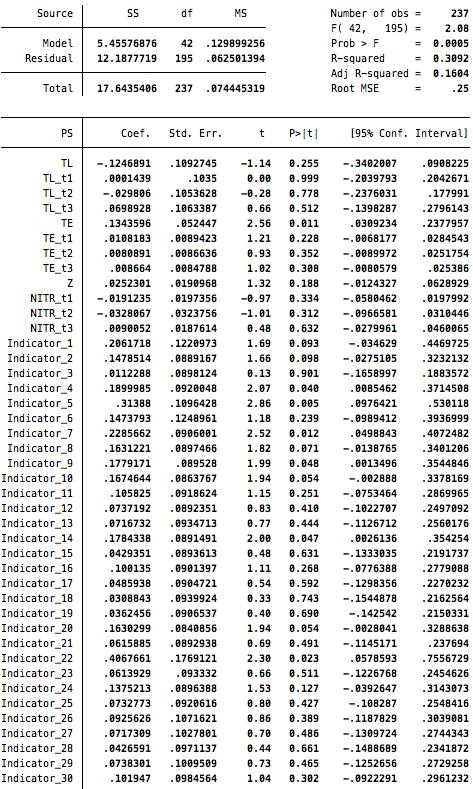
6 dni/r dni/r β 7 + β t 1 dni/r 8 + β t I i, i [1, 30] and i Z. We then shift the returns of the fundamental factors one more unit annually in the past to create T L t 3, T E t 3, and NI/R t 3. We obtain the following model. Under this hypothesis, we assume the return of stock prices can be described by three fundamental factors and with each one of them shifted one-year, two-year, and three-year in the past. β 7 dt E t 2 T welve factor Hypothesis : dp + β 8 dt E t 3 + β 9 dni/r + β 10 dni/r t 1 = β 1 dt L +β 2 dt Lt 1 + β 11 dni/r t 2 +β 3 dt L t 2 +β 4 dt L t 3 + β 12 dni/r t 3 + α. dt E dt E +β 5 +β t We manipulate the indicators and apply the same method to create a cross-section study. We then compare the results of the coefficients among the current fundamental factors and each one of them one-year, two-year, and three-year in the past. β 7 dt E t 2 Cross section Model 2 : dp + β 8 dt E t 3 + β 9 dni/r = β 1 dt L + β 10 dni/r t 1 + β 2 dt L t 1 + β 11 dni/r t 2 + β 3 dt L t 2 + β 4 dt L t 3 + β 5 dt E + β 6 dt E t β 12 dni/r t 3 + I i, i [1, 30] and i Z. 2.4 Result The results show that the variables at present bear coefficients with higher significances statistically. Total Shareholders Equity (TE) has the biggest t value among all and it generates a P-value of 3.1% which is less than 5%, indicating that this fundamental is statistically significant. There are seven indicators (show P-value less than 5%) to be statistically significant to the cross-section return of stock prices. Moreover, we observe from both data sheet that the t-value for each fundamental factor at present is unanimously larger than in the past. This shows that the return of fundamental factors at present explain the return of stock prices more than it could from the past. In other words, the return of fundamental factors at present does not contribute to explain the return of stock prices in the future, which means fundamental numbers from earnings report (10-Q and 10-K) do not help us to predict the return of stock prices in the future. 5
7 Overall from the model, we can only conclude that Total Equity may have some power explaining the returns of cross-section of stock prices. However, there are only so many factors used in this model that the results may lean on Total Equity because of calculation methods. The significance of the coefficient of Total Equity does not prove that Total Equity causes the changes of stock prices. This certainly does not show us that Total Equity can predict the future price actions. We cannot reach any further conclusions about other factors disregard whether they are at present or in the past. The t values of every other factors are insignificant so we fail to reject the null hypothesis for them. This table presents collected data from the first data sheet in the Data Section, including one-year and two-year in the past. Return of Price t value P value TL T L t T L t TE T E t T E t NI/TR NI/T R t NI/T R t This table presents collected data from the second data sheet in the Data Section, including oneyear, two-year, and three-year, in comparison of the first data sheet together. The first column list each fundamental indicator in the model with time shifted one unit, two units, and three units in the past. Table also presents coefficient and the t-value with it for each indicator. 6
8 t, t 1, t 2 t, t 1, t 2, t 3 Return of Price Coefficient t-value Coefficient t-value TL [-0.81] [1.14] T L t [-0.41] [0.00] T L t [-0.50] [-0.28] T L t [0.66] TE [2.18] [2.56] T E t [0.66] [1.21] T E t [0.58] [0.93] T E t [1.02] NI/TR [1.67] [1.32] NI/T R t [-0.76] [-0.97] NI/T R t [-1.11] [-1.01] NI/T R t [0.48] The fact that the returns of fundamental factors show greater significances statistically for crosssection returns of stock prices helps to explain market digest current publicly available information. If market is inefficient and takes time to digest current publicly available information, then the coefficient of past fundamental factors ought to show greater significances than the present ones. We would have seen some significances in the fundamental factors on those that are shifted one unit, two units, or three units in the past, if the past behaviors can predict the future ones. However that is not the result of this model. The results show that Total Equity (TE) and Net Income-to-Total Revenue (NI/TR) at present time, t, are the two most important indicators in describing the cross-section average returns of stocks in Dow Jones Industrial Average. When we traced into the past, the significance fades away and does not contribute to describing the average returns in the cross-section. Hence, market digests publicly available information as the Efficient Market Hypothesis suggested. 7
9 3 Conclusion This models tells us that the returns of Total Liabilities (TL), Total Shareholders Equity (TE), and Net Income-to-Revenue (NI/R) help to explain cross-section of returns of stock prices. Instead of running regression for each of the thirty companies in Dow Jones Industrial Average with ten sample size, a cross-section analysis speaks with more power because of its large sample size. 3.1 Future-expectation Theorem An investor will look at whatever information to make an investment decision. The thinking process may or may not be rational because human beings can get emotional. However, disregard the rationale behind the thinking process, an investor will go through some thoughts before making an investment decision. Thus, we assume that the return of current stock prices must be related to information 1) in the past, 2) at present, or 3) in the future. We have shown that not all fundamental indicators at present can describe cross-section average returns of stocks at great significances. We have also shown in the results in section 2 that the past fundamental indicators do not describe cross-section average returns as well as the present fundamental indicators do. This left us the information in the future, i.e. the future expectation of stock performance. Future-expectation Theorem: the current return of the prices of a stock is determined by futureexpectation of the stock performances. We were looking at thirty companies in Dow Jones Industrial Average and we collected data ten years in the past. This is a data set with over 200 sample sizes and the result can be understood as normal distribution. Under the assumption, all the information taken into consideration can only be in the past, at present, or in the future. The results from the data showed that the returns of fundamental factors at present are generating coefficients more significant statistically than the returns of fundamental factors in the past. We can know that investors would not put too much faith in the historical data when making investment decisions. Besides Total Equity, every other coefficients of returns of fundamental factors at present showed 8
10 insignificance statistically. We test null hypothesis for each one of them except for the coefficient of Total Equity, and we fail to reject the null hypothesis. This is to say, the coefficients of majority of fundamental factors do not show significance statistically and they do not help us describe the current return of stock prices. We reject that the past return of fundamental factors do not contribute to describe the current return of stock prices. We also reject that the current return of fundamental factors do not contribute to current return of stock prices. Then we are left with information from the future. However, no one knows the return of fundamental factors in the future, but investors can apply some ability to figure out an expectation of future performance on a stock. We cannot measure how rational an investor can be. The ability from an investor may come from another person (e.g. financial advisor), experiences from his past knowledge used to predict future, or emotions (hope and fear). In other words, the current return of the prices of a stock is determined by future-expectation of the stock performances. 3.2 Conclusion The result of this paper is to present a behavioral way of understanding Efficient Market Hypothesis. Under modern financial sector, analysts and money managers love to use mathematical tools to identify buy/sell and many methods have been proved to not be able to describe price behaviors consistently. Yet there are still many investors relying on these tools provided by their so-called financial advisors. If these methods, explained and worshiped by majority of financial advisors and analysts on Wall Street, work perfectly fine, then we should be able to see higher significances from the t-value. Moreover, we might even see higher significances for the coefficients of fundamental factors in the past, because a lot of analysts use fundamental factors to predict to the future and they claim past patterns can tell them future price actions. However, the results, unfortunate for these analysts, show us this is not the situation they expect. The Future-expectation Theorem, named it by its definition, is another way of telling us that we cannot conclude anything from the past or present fundamental factors. We are left with the information 9
11 from the third (and last) time periods, the future. In other words, the return of current stock prices, under the assumption that the return of stock prices must be relative to information in at least one of the three time periods, should be relative to the future-expectation of the stock performances. Rather to be a ground-breaking idea, this paper serves as a method to illustrate Benjamin Graham s words, Whenever calculus is brought in, or higher algebra, you could take it as a warning signal that the operator was trying to substitute theory for experience, and usually also to give to speculation the deceptive guise of investment and also Warren Buffett s words, Intrinsic Value is the discounted value of the cash that can be taken out of a business during its remaining life, i.e. future expectation of cash flow from a business. 4 Data This is the data sheet from STATA sofware package used to conduct the cross-section study. The first data sheet is the result for cross-section study of thirty companies ten years in the history with fundamental factors shifted one-year and two-year in the past. The second data sheet is the result for cross-section study of thirty companies ten years in the history with fundamental factors shifted three-year in the past. 10
12 11
13 12
14 5 Acknowledge I want to thank Prof. Olga Itenberg on the advise of selecting standardized variables. I also want to thank Prof. Heikki Rantakari for the instruction of cross-section analysis. I am grateful for my colleague and fellow classmate Luciano Somoza for the support and assistance on this paper. 6 Reference 1. Fama, E., Efficient capital market: a review of theory and empirical work. Journal of Finance, 25, Fama, E., and French, K., Size and Book-to-market Factors in Earnings and Returns. Journal of Finance. Vol. L, No
Absolute Alpha by Beta Manipulations
 Absolute Alpha by Beta Manipulations Yiqiao Yin Simon Business School October 2014, revised in 2015 Abstract This paper describes a method of achieving an absolute positive alpha by manipulating beta.
Empirical Study on Market Value Balance Sheet (MVBS)
") Empirical Study on Market Value Balance Sheet (MVBS) Yiqiao Yin Simon Business School November 2015 Abstract This paper presents the results of an empirical study on Market Value Balance Sheet (MVBS).
Empirical Study on Market Value Balance Sheet (MVBS) Yiqiao Yin Simon Business School November 2015 Abstract This paper presents the results of an empirical study on Market Value Balance Sheet (MVBS).
Absolute Alpha with Limited Leverage
 Absolute Alpha with Limited Leverage Yiqiao Yin University of Rochester, Student February, 2016 Abstract Yin (2015) leaves an open question about leverage, l, a multiplier affecting the return of a portfolio
Factors in the returns on stock : inspiration from Fama and French asset pricing model
 Lingnan Journal of Banking, Finance and Economics Volume 5 2014/2015 Academic Year Issue Article 1 January 2015 Factors in the returns on stock : inspiration from Fama and French asset pricing model Yuanzhen
DOES TECHNICAL ANALYSIS GENERATE SUPERIOR PROFITS? A STUDY OF KSE-100 INDEX USING SIMPLE MOVING AVERAGES (SMA)
") City University Research Journal Volume 05 Number 02 July 2015 Article 12 DOES TECHNICAL ANALYSIS GENERATE SUPERIOR PROFITS? A STUDY OF KSE-100 INDEX USING SIMPLE MOVING AVERAGES (SMA) Muhammad Sohail
City University Research Journal Volume 05 Number 02 July 2015 Article 12 DOES TECHNICAL ANALYSIS GENERATE SUPERIOR PROFITS? A STUDY OF KSE-100 INDEX USING SIMPLE MOVING AVERAGES (SMA) Muhammad Sohail
Module 3: Factor Models
 Module 3: Factor Models (BUSFIN 4221 - Investments) Andrei S. Gonçalves 1 1 Finance Department The Ohio State University Fall 2016 1 Module 1 - The Demand for Capital 2 Module 1 - The Supply of Capital
Dividend Policy: Determining the Relevancy in Three U.S. Sectors
 Dividend Policy: Determining the Relevancy in Three U.S. Sectors Corey Cole Eastern New Mexico University Ying Yan Eastern New Mexico University David Hemley Eastern New Mexico University The purpose of
ECON*6930 W15 Seminar in Security Analysis and Portfolio Management 0.50 Credit weight
 ECON*6930 W15 Seminar in Security Analysis and Portfolio Management 0.50 Credit weight General Course Information Instructor: Email Office Location Office Hours Department/School F. Tapon ftapon@uoguelph.ca
Note on Cost of Capital
 DUKE UNIVERSITY, FUQUA SCHOOL OF BUSINESS ACCOUNTG 512F: FUNDAMENTALS OF FINANCIAL ANALYSIS Note on Cost of Capital For the course, you should concentrate on the CAPM and the weighted average cost of capital.
Assessment on Credit Risk of Real Estate Based on Logistic Regression Model
 Assessment on Credit Risk of Real Estate Based on Logistic Regression Model Li Hongli 1, a, Song Liwei 2,b 1 Chongqing Engineering Polytechnic College, Chongqing400037, China 2 Division of Planning and
Let s now stretch our consideration to the real world.
 Portfolio123 Virtual Strategy Design Class By Marc Gerstein Topic 1B Valuation Theory, Moving Form Dividends to EPS In Topic 1A, we started, where else, at the beginning, the foundational idea that a stock
Inflation and Stock Market Returns in US: An Empirical Study
 Inflation and Stock Market Returns in US: An Empirical Study CHETAN YADAV Assistant Professor, Department of Commerce, Delhi School of Economics, University of Delhi Delhi (India) Abstract: This paper
THE INTERNATIONAL JOURNAL OF BUSINESS & MANAGEMENT
 THE INTERNATIONAL JOURNAL OF BUSINESS & MANAGEMENT The Effect of Dividend Policy on Stock Price Volatility: A Kenyan Perspective Zipporah N. Onsomu Student, MBA (Finance), Bachelor of Commerce, CPA (K),
The Experts Investment And Business Center - Muscat Oman In association with VIBHS
 The Experts Investment And Business Center - Muscat Oman In association with VIBHS Website: www.expertsofoman.com E-mail: rrralzain1840@expertsofoman.com Oman: +968 96 178 605 UAE: +971 50 923 6443 www.vibhs.com
Ownership Structure and Capital Structure Decision
 Modern Applied Science; Vol. 9, No. 4; 2015 ISSN 1913-1844 E-ISSN 1913-1852 Published by Canadian Center of Science and Education Ownership Structure and Capital Structure Decision Seok Weon Lee 1 1 Division
Value Investing in Thailand: The Test of Basic Screening Rules
 International Review of Business Research Papers Vol. 7. No. 4. July 2011 Pp. 1-13 Value Investing in Thailand: The Test of Basic Screening Rules Paiboon Sareewiwatthana* To date, value investing has been
How to Forecast Future Stock Returns: Part 3
 How to Forecast Future Stock Returns: Part 3 Chuck Carnevale - Monday, July 16, 2012 Introduction In Part 1 and Part 2 of this three-part series, we established the basic principles of valuation and provided
The Determinants of Capital Structure: Analysis of Non Financial Firms Listed in Karachi Stock Exchange in Pakistan
 Analysis of Non Financial Firms Listed in Karachi Stock Exchange in Pakistan Introduction The capital structure of a company is a particular combination of debt, equity and other sources of finance that
The Capital Assets Pricing Model & Arbitrage Pricing Theory: Properties and Applications in Jordan
 Modern Applied Science; Vol. 12, No. 11; 2018 ISSN 1913-1844E-ISSN 1913-1852 Published by Canadian Center of Science and Education The Capital Assets Pricing Model & Arbitrage Pricing Theory: Properties
Capital Asset Pricing Model - CAPM
 Capital Asset Pricing Model - CAPM The capital asset pricing model (CAPM) is a model that describes the relationship between systematic risk and expected return for assets, particularly stocks. CAPM is
Deviations from Optimal Corporate Cash Holdings and the Valuation from a Shareholder s Perspective
 Deviations from Optimal Corporate Cash Holdings and the Valuation from a Shareholder s Perspective Zhenxu Tong * University of Exeter Abstract The tradeoff theory of corporate cash holdings predicts that
INTERNATIONAL JOURNAL OF MANAGEMENT (IJM)
") INTERNATIONAL JOURNAL OF MANAGEMENT (IJM) ISSN 0976-6502 (Print) ISSN 0976-6510 (Online) Volume 4, Issue 3, (May - June 2013), pp. 145-150 IAEME: www.iaeme.com/ijm.asp Journal Impact Factor (2013): 6.9071
INTERNATIONAL JOURNAL OF MANAGEMENT (IJM) ISSN 0976-6502 (Print) ISSN 0976-6510 (Online) Volume 4, Issue 3, (May - June 2013), pp. 145-150 IAEME: www.iaeme.com/ijm.asp Journal Impact Factor (2013): 6.9071
ECON FINANCIAL ECONOMICS
 ECON 337901 FINANCIAL ECONOMICS Peter Ireland Boston College Fall 2017 These lecture notes by Peter Ireland are licensed under a Creative Commons Attribution-NonCommerical-ShareAlike 4.0 International
Chapter 18: The Correlational Procedures
 Introduction: In this chapter we are going to tackle about two kinds of relationship, positive relationship and negative relationship. Positive Relationship Let's say we have two values, votes and campaign
ECON FINANCIAL ECONOMICS
 ECON 337901 FINANCIAL ECONOMICS Peter Ireland Boston College Spring 2018 These lecture notes by Peter Ireland are licensed under a Creative Commons Attribution-NonCommerical-ShareAlike 4.0 International
An Analysis of Theories on Stock Returns
 An Analysis of Theories on Stock Returns Ahmet Sekreter 1 1 Faculty of Administrative Sciences and Economics, Ishik University, Erbil, Iraq Correspondence: Ahmet Sekreter, Ishik University, Erbil, Iraq.
EFFICIENT MARKETS HYPOTHESIS
 EFFICIENT MARKETS HYPOTHESIS when economists speak of capital markets as being efficient, they usually consider asset prices and returns as being determined as the outcome of supply and demand in a competitive
Chapter 4 Research Methodology
 Chapter 4 Research Methodology 4.1 Introduction An exchange rate (also known as a foreign-exchange rate, forex rate, FX rate or Agio) between two currencies is the rate at which one currency will be exchanged
Testing for efficient markets
 IGIDR, Bombay May 17, 2011 What is market efficiency? A market is efficient if prices contain all information about the value of a stock. An attempt at a more precise definition: an efficient market is
Impact of Dividends on Share Price Performance of Companies in Indian Context
 Impact of Dividends on Share Price Performance of Companies in Indian Context Kavita Chavali and Nusratunnisa School of Business - Alliance University, Bangalore Abstract The study aims at finding the
The Use of Financial Futures as Hedging Vehicles
 Journal of Business and Economics, ISSN 2155-7950, USA May 2013, Volume 4, No. 5, pp. 413-418 Academic Star Publishing Company, 2013 http://www.academicstar.us The Use of Financial Futures as Hedging Vehicles
Expectations are very important in our financial system.
 Chapter 6 Are Financial Markets Efficient? Chapter Preview Expectations are very important in our financial system. Expectations of returns, risk, and liquidity impact asset demand Inflationary expectations
Cross- Country Effects of Inflation on National Savings
 Cross- Country Effects of Inflation on National Savings Qun Cheng Xiaoyang Li Instructor: Professor Shatakshee Dhongde December 5, 2014 Abstract Inflation is considered to be one of the most crucial factors
Investment Performance of Common Stock in Relation to their Price-Earnings Ratios: BASU 1977 Extended Analysis
 Utah State University DigitalCommons@USU All Graduate Plan B and other Reports Graduate Studies 5-2015 Investment Performance of Common Stock in Relation to their Price-Earnings Ratios: BASU 1977 Extended
High Frequency Autocorrelation in the Returns of the SPY and the QQQ. Scott Davis* January 21, Abstract
 High Frequency Autocorrelation in the Returns of the SPY and the QQQ Scott Davis* January 21, 2004 Abstract In this paper I test the random walk hypothesis for high frequency stock market returns of two
The Lack of Persistence of Employee Contributions to Their 401(k) Plans May Lead to Insufficient Retirement Savings
 Plans May Lead to Insufficient Retirement Savings") Upjohn Institute Policy Papers Upjohn Research home page 2011 The Lack of Persistence of Employee Contributions to Their 401(k) Plans May Lead to Insufficient Retirement Savings Leslie A. Muller Hope College
Upjohn Institute Policy Papers Upjohn Research home page 2011 The Lack of Persistence of Employee Contributions to Their 401(k) Plans May Lead to Insufficient Retirement Savings Leslie A. Muller Hope College
How Are Interest Rates Affecting Household Consumption and Savings?
 Utah State University DigitalCommons@USU All Graduate Plan B and other Reports Graduate Studies 2012 How Are Interest Rates Affecting Household Consumption and Savings? Lacy Christensen Utah State University
RATIONAL BUBBLES AND LEARNING
 RATIONAL BUBBLES AND LEARNING Rational bubbles arise because of the indeterminate aspect of solutions to rational expectations models, where the process governing stock prices is encapsulated in the Euler
DIVIDEND POLICY AND THE LIFE CYCLE HYPOTHESIS: EVIDENCE FROM TAIWAN
 The International Journal of Business and Finance Research Volume 5 Number 1 2011 DIVIDEND POLICY AND THE LIFE CYCLE HYPOTHESIS: EVIDENCE FROM TAIWAN Ming-Hui Wang, Taiwan University of Science and Technology
THE INFLUENCE OF ECONOMIC FACTORS ON PROFITABILITY OF COMMERCIAL BANKS
 THE INFLUENCE OF ECONOMIC FACTORS ON PROFITABILITY OF COMMERCIAL BANKS 1 YVES CLAUDE NSHIMIYIMANA, 2 MIZEROYABADEGE ALYDA ZUBEDA UNILAK University of Lay Adventists of Kigali E-mail: 1 dryvesclaude@gmail.com,
Risk Systems That Read Redux
 Risk Systems That Read Redux Dan dibartolomeo Northfield Information Services Courant Institute, October 2018 Two Simple Truths It is hard to forecast, especially about the future Niels Bohr (not Yogi
August 1 st, Divergence Warning
 Dow Theory for the 21 st Century Schannep Timing Indicator COMPOSITE Indicator Dow Jones: 18,432.24 Divergence Warning S&P 500: 2,173.60 NYSE: 10,785.51 OVERVIEW: On July 11 th both the Dow and the S&P
The Effect of Accounting Information on Stock Price Predictions Through Fluctuation of Stock Price, Evidence From Indonesia
 Journal of Accounting, Business and Finance Research ISSN: 2521-3830 Vol. 4, No. 1, pp. 20-27, 2018 DOI: 10.20448/2002.41.20.27 The Effect of Accounting Information on Stock Price Predictions Through Fluctuation
Stock price synchronicity and the role of analyst: Do analysts generate firm-specific vs. market-wide information?
 Stock price synchronicity and the role of analyst: Do analysts generate firm-specific vs. market-wide information? Yongsik Kim * Abstract This paper provides empirical evidence that analysts generate firm-specific
Firm Financial Performance
 The Relationship between Dividend Payout and Firm Financial Performance Munaza Kanwal (Corresponding author) Department of management sciences Islamia university, Bahawalpur E-mail: Munaza9225@yhaoo.com
CAN AGENCY COSTS OF DEBT BE REDUCED WITHOUT EXPLICIT PROTECTIVE COVENANTS? THE CASE OF RESTRICTION ON THE SALE AND LEASE-BACK ARRANGEMENT
 CAN AGENCY COSTS OF DEBT BE REDUCED WITHOUT EXPLICIT PROTECTIVE COVENANTS? THE CASE OF RESTRICTION ON THE SALE AND LEASE-BACK ARRANGEMENT Jung, Minje University of Central Oklahoma mjung@ucok.edu Ellis,
Foreign exchange rate and the Hong Kong economic growth
 From the SelectedWorks of John Woods Winter October 3, 2017 Foreign exchange rate and the Hong Kong economic growth John Woods Brian Hausler Kevin Carter Available at: https://works.bepress.com/john-woods/1/
MONEY SUPPLY ANNOUNCEMENTS AND STOCK PRICES: THE UK EVIDENCE
 «ΣΠΟΥΔΑΙ», Τόμος 41, Τεύχος 4ο, Πανεπιστήμιο Πειραιώς / «SPOUDAI», Vol. 41, No 4, University of Piraeus MONEY SUPPLY ANNOUNCEMENTS AND STOCK PRICES: THE UK EVIDENCE By N. P. Tessaromatis P. E. Triantafillou
Models for Real-World Investors, and the Abyss Between Value Investing and Financial Engineering, II
 The Abyss p. 1/2 Models for Real-World Investors, and the Abyss Between Value Investing and Financial Engineering, II Donald Richards Penn State University The Abyss p. 2/2 The Abyss Between FE and Value
Predictability of Stock Returns
 Predictability of Stock Returns Ahmet Sekreter 1 1 Faculty of Administrative Sciences and Economics, Ishik University, Iraq Correspondence: Ahmet Sekreter, Ishik University, Iraq. Email: ahmet.sekreter@ishik.edu.iq
Hedging inflation by selecting stock industries
 Hedging inflation by selecting stock industries Author: D. van Antwerpen Student number: 288660 Supervisor: Dr. L.A.P. Swinkels Finish date: May 2010 I. Introduction With the recession at it s end last
An Analysis of Anomalies Split To Examine Efficiency in the Saudi Arabia Stock Market
 An Analysis of Anomalies Split To Examine Efficiency in the Saudi Arabia Stock Market Mohammed A. Hokroh MBA (Finance), University of Leicester, Business System Analyst Phone: +966 0568570987 E-mail: Mohammed.Hokroh@Gmail.com
Why Decades-Old Quantitative Strategies Still Work Today
 Why Decades-Old Quantitative Strategies Still Work Today June 2, 2015 by John Reese Advisor Perspectives welcomes guest contributions. The views presented here do not necessarily represent those of Advisor
Further Test on Stock Liquidity Risk With a Relative Measure
 International Journal of Education and Research Vol. 1 No. 3 March 2013 Further Test on Stock Liquidity Risk With a Relative Measure David Oima* David Sande** Benjamin Ombok*** Abstract Negative relationship
Volume 29, Issue 3. A new look at the trickle-down effect in the united states economy
 Volume 9, Issue 3 A new look at the trickle-down effect in the united states economy Yuexing Lan Auburn University Montgomery Charles Hegji Auburn University Montgomery Abstract This paper is a further
The Rational Part of Momentum
 The Rational Part of Momentum Jim Scott George Murillo Heilbrunn Center for Graham and Dodd Investing Columbia Business School Value Investing Research Consortium 1 Outline The Momentum Effect A Rationality
CHAPTER 1: INTRODUCTION. Despite widespread research on dividend policy, we still know little about how
 CHAPTER 1: INTRODUCTION 1.1 Purpose and Significance of the Study Despite widespread research on dividend policy, we still know little about how companies set their dividend policies. Researches about
CHAPTER III RESEARCH METHODOLOGY
 CHAPTER III RESEARCH METHODOLOGY RESEARCH METHODOLOGY 3.1 STATEMENT OF PROBLEM Housing loan is one of the emerging portfolio of both Private and Public sector banks. The national housing policy of the
FE501 Stochastic Calculus for Finance 1.5:0:1.5
 Descriptions of Courses FE501 Stochastic Calculus for Finance 1.5:0:1.5 This course introduces martingales or Markov properties of stochastic processes. The most popular example of stochastic process is
IMPACT OF FINANCIAL MANAGEMENT ON PROFITABILITY: EVIDENCES FROM TEXTILE SECTOR OF INDIA
 DOI: 10.18843/ijcms/v9i1/07 DOI URL: http://dx.doi.org/10.18843/ijcms/v9i1/07 IMPACT OF FINANCIAL MANAGEMENT ON PROFITABILITY: EVIDENCES FROM TEXTILE SECTOR OF INDIA Dr. Ashvin R. Dave, M.B.A., Ph. D.
CHAPTER 6. Are Financial Markets Efficient? Copyright 2012 Pearson Prentice Hall. All rights reserved.
 CHAPTER 6 Are Financial Markets Efficient? Copyright 2012 Pearson Prentice Hall. All rights reserved. Chapter Preview Expectations are very important in our financial system. Expectations of returns, risk,
PAPER No.14 : Security Analysis and Portfolio Management MODULE No.24 : Efficient market hypothesis: Weak, semi strong and strong market)
") Subject Paper No and Title Module No and Title Module Tag 14. Security Analysis and Portfolio M24 Efficient market hypothesis: Weak, semi strong and strong market COM_P14_M24 TABLE OF CONTENTS After going
Subject Paper No and Title Module No and Title Module Tag 14. Security Analysis and Portfolio M24 Efficient market hypothesis: Weak, semi strong and strong market COM_P14_M24 TABLE OF CONTENTS After going
Impact of Firm s Characteristics on Determining the Financial Structure On the Insurance Sector Firms in Jordan
 Journal of Social Sciences 6 (2): 282-286, 2010 ISSN 1549-3652 2010 Science Publications Impact of Firm s Characteristics on Determining the Financial Structure On the Insurance Sector Firms in Jordan
Analysis on accrual-based models in detecting earnings management
 Lingnan Journal of Banking, Finance and Economics Volume 2 2010/2011 Academic Year Issue Article 5 January 2010 Analysis on accrual-based models in detecting earnings management Tianran CHEN tianranchen@ln.edu.hk
Dividends and Share Repurchases: Effects on Common Stock Returns
 Dividends and Share Repurchases: Effects on Common Stock Returns Nell S. Gullett* Professor of Finance College of Business and Global Affairs The University of Tennessee at Martin Martin, TN 38238 ngullett@utm.edu
MBF2253 Modern Security Analysis
 MBF2253 Modern Security Analysis Prepared by Dr Khairul Anuar L8: Efficient Capital Market www.notes638.wordpress.com Capital Market Efficiency Capital market history suggests that the market values of
Pre-holiday Anomaly: Examining the pre-holiday effect around Martin Luther King Jr. Day
 Utah State University DigitalCommons@USU All Graduate Plan B and other Reports Graduate Studies 5-2016 Pre-holiday Anomaly: Examining the pre-holiday effect around Martin Luther King Jr. Day Scott E. Jones
Examining the relationship between growth and value stock and liquidity in Tehran Stock Exchange
 www.engineerspress.com ISSN: 2307-3071 Year: 2013 Volume: 01 Issue: 13 Pages: 193-205 Examining the relationship between growth and value stock and liquidity in Tehran Stock Exchange Mehdi Meshki 1, Mahmoud
Here is a selection of some of the things that make my book different from other investments books.
 Foundations for Scientific Investing: Capital Markets Intuition and Critical Thinking Skills (7 th Ed) Timothy Falcon Crack timcrack@alum.mit.edu, tcrack@otago.ac.nz ISBN 978 0 9941386 6 8 I wrote this
Testing Capital Asset Pricing Model on KSE Stocks Salman Ahmed Shaikh
 Abstract Capital Asset Pricing Model (CAPM) is one of the first asset pricing models to be applied in security valuation. It has had its share of criticism, both empirical and theoretical; however, with
Portfolio performance and environmental risk
 Portfolio performance and environmental risk Rickard Olsson 1 Umeå School of Business Umeå University SE-90187, Sweden Email: rickard.olsson@usbe.umu.se Sustainable Investment Research Platform Working
FOREX Risk & Money Management. By Low Jie Ji, Research Analyst 1/12/2013. NUS Students Investment Society NATIONAL UNIVERSITY OF SINGAPORE
 FOREX Risk & 1/12/2013 Money Management By Low Jie Ji, Research Analyst NUS Students Investment Society NATIONAL UNIVERSITY OF SINGAPORE Money Management Many traders like to focus on the profit aspect
MULTI FACTOR PRICING MODEL: AN ALTERNATIVE APPROACH TO CAPM
 MULTI FACTOR PRICING MODEL: AN ALTERNATIVE APPROACH TO CAPM Samit Majumdar Virginia Commonwealth University majumdars@vcu.edu Frank W. Bacon Longwood University baconfw@longwood.edu ABSTRACT: This study
ARE LOSS AVERSION AFFECT THE INVESTMENT DECISION OF THE STOCK EXCHANGE OF THAILAND S EMPLOYEES?
 ARE LOSS AVERSION AFFECT THE INVESTMENT DECISION OF THE STOCK EXCHANGE OF THAILAND S EMPLOYEES? by San Phuachan Doctor of Business Administration Program, School of Business, University of the Thai Chamber
Does cost of common equity capital effect on financial decisions? Case study companies listed in Tehran Stock Exchange
 Does cost of common equity capital effect on financial decisions? Case study companies listed in Tehran Stock Exchange Anna Ghasemzadeh * Department of accounting, Bandar Abbas Branch, Islamic Azad University,
Capital allocation in Indian business groups
 Capital allocation in Indian business groups Remco van der Molen Department of Finance University of Groningen The Netherlands This version: June 2004 Abstract The within-group reallocation of capital
Equity Sell Disciplines across the Style Box
 Equity Sell Disciplines across the Style Box Robert S. Krisch ABSTRACT This study examines the use of four major equity sell disciplines across the equity style box. Specifically, large-cap and small-cap
Contrarian Investing..Think Different
 Contrarian Investing..Think Different.!!! Do you know, Why Successful people are different from Mediocre One? What separates Steve jobs, Warren Buffett, Charlie Munger, Elon musk etc. from the crowd. The
Discussion of Limited Partners and the LB0 Process by Paul Schultz and Sophie Shive
 Discussion of Limited Partners and the LB0 Process by Paul Schultz and Sophie Shive Discussion by Adair Morse University of California, Berkeley Southern California Private Equity Conference 2017 Overview
International Review of Management and Marketing ISSN: available at http:
 International Review of Management and Marketing ISSN: 2146-4405 available at http: www.econjournals.com International Review of Management and Marketing, 2017, 7(1), 85-89. Investigating the Effects of
THE PENNSYLVANIA STATE UNIVERSITY SCHREYER HONORS COLLEGE DEPARTMENT OF FINANCE
 THE PENNSYLVANIA STATE UNIVERSITY SCHREYER HONORS COLLEGE DEPARTMENT OF FINANCE EXAMINING THE IMPACT OF THE MARKET RISK PREMIUM BIAS ON THE CAPM AND THE FAMA FRENCH MODEL CHRIS DORIAN SPRING 2014 A thesis
How Markets React to Different Types of Mergers
 How Markets React to Different Types of Mergers By Pranit Chowhan Bachelor of Business Administration, University of Mumbai, 2014 And Vishal Bane Bachelor of Commerce, University of Mumbai, 2006 PROJECT
Historical Analysis of CTA Performance in Q4: Relating Returns to Trends
 Historical Analysis of CTA Performance in Q4: Relating Returns to Trends Robert P. Rotella CEO, President, and Co-CIO Rotella Capital Management, Inc. One issue faced by fund managers is developing expectations
Relationship between abnormal returns on the dividend policy of listed companies in Tehran Stock Exchange
 :504-513 www.amiemt-journal.com Relationship between abnormal returns on the dividend policy of listed companies in Tehran Stock Exchange Ariyan Nasirzadeh, Dr. Hasan Hemati, Mahboobeh Khanahmadi 1,3 Department
ROLE OF FUNDAMENTAL VARIABLES IN EXPLAINING STOCK PRICES: INDIAN FMCG SECTOR EVIDENCE
 ROLE OF FUNDAMENTAL VARIABLES IN EXPLAINING STOCK PRICES: INDIAN FMCG SECTOR EVIDENCE Varun Dawar, Senior Manager - Treasury Max Life Insurance Ltd. Gurgaon, India ABSTRACT The paper attempts to investigate
Module 6 Portfolio risk and return
 Module 6 Portfolio risk and return Prepared by Pamela Peterson Drake, Ph.D., CFA 1. Overview Security analysts and portfolio managers are concerned about an investment s return, its risk, and whether it
Lessons from a Trading Great: Bruce Kovner
 Lessons from a Trading Great: Bruce Kovner Bruce Kovner retired in 2011 from Caxton Associates, the hedge fund he founded and ran for 28 years. Over that time the fund returned an average of 21 percent
Investment Advisory Whitepaper
 Program Objective: We developed our investment program for our clients serious money. Their serious money will finance their important long-term family and personal goals including retirement, college
Impact of Corporate Social Responsibility on Financial Performance of Indian Commercial Banks An Analysis
 Impact of Corporate Social Responsibility on Financial Performance of Indian Commercial Banks An Analysis Rajnish Yadav 1 & Dr. F. B. Singh 2 1 Research Scholar (JRF), Faculty of Commerce, Banaras Hindu
Exploring the Relationship between Market Value and Accounting Numbers of Firms in Pakistan
 Exploring the Relationship between Market Value and Accounting Numbers of Firms in Pakistan SalmanRiaz (Corresponding Author) PhD Scholar, Xidian University PO. Box 338 No. 2, South TaiBai Road, Xi an
Efficient capital markets. Skema Business School. Portfolio Management 1. Course Outline
 Efficient capital markets bertrand.groslambert@skema.edu Skema Business School Portfolio Management 1 Course Outline Introduction (lecture 1) Presentation of portfolio management Chap.2,3,5 Introduction
Church Administration Matters
 Church Administration Matters Greg Hickle Minnesota District Secretary/Treasurer Church Budgeting 101 Except that it has 6 letters many people seem to have the idea that BUDGET is a 4-letter word. Many
A No-Arbitrage Theorem for Uncertain Stock Model
 Fuzzy Optim Decis Making manuscript No (will be inserted by the editor) A No-Arbitrage Theorem for Uncertain Stock Model Kai Yao Received: date / Accepted: date Abstract Stock model is used to describe
Exchange Rate Exposure and Firm-Specific Factors: Evidence from Turkey
 Journal of Economic and Social Research 7(2), 35-46 Exchange Rate Exposure and Firm-Specific Factors: Evidence from Turkey Mehmet Nihat Solakoglu * Abstract: This study examines the relationship between
Riyad Rooly M.S.A 1, Weerakoon Banda Y.K 2, Jamaldeen A. 3. First International Symposium 2014, FIA, SEUSL 23
 Management and Firm Characteristics: An Empirical Study on Pecking Order Theory and Practice on Debt and Equity Issuance Decision of Listed Companies in Sri Lanka Riyad Rooly M.S.A 1, Weerakoon Banda Y.K
DETERMINANTS OF HERDING BEHAVIOR IN MALAYSIAN STOCK MARKET Abdollah Ah Mand 1, Hawati Janor 1, Ruzita Abdul Rahim 1, Tamat Sarmidi 1
 DETERMINANTS OF HERDING BEHAVIOR IN MALAYSIAN STOCK MARKET Abdollah Ah Mand 1, Hawati Janor 1, Ruzita Abdul Rahim 1, Tamat Sarmidi 1 1 Faculty of Economics and Management, University Kebangsaan Malaysia
Can Twitter predict the stock market?
 1 Introduction Can Twitter predict the stock market? Volodymyr Kuleshov December 16, 2011 Last year, in a famous paper, Bollen et al. (2010) made the claim that Twitter mood is correlated with the Dow
A Study on the Relationship between Monetary Policy Variables and Stock Market
 International Journal of Business and Management; Vol. 13, No. 1; 2018 ISSN 1833-3850 E-ISSN 1833-8119 Published by Canadian Center of Science and Education A Study on the Relationship between Monetary
Economics of Behavioral Finance. Lecture 3
 Economics of Behavioral Finance Lecture 3 Security Market Line CAPM predicts a linear relationship between a stock s Beta and its excess return. E[r i ] r f = β i E r m r f Practically, testing CAPM empirically
Derivation of zero-beta CAPM: Efficient portfolios
 Derivation of zero-beta CAPM: Efficient portfolios AssumptionsasCAPM,exceptR f does not exist. Argument which leads to Capital Market Line is invalid. (No straight line through R f, tilted up as far as