PPG Industries, Inc. Second Quarter 2018 Financial Results Earnings Brief July 19, 2018
|
|
|
- Edmund Cory Allison
- 5 years ago
- Views:
Transcription


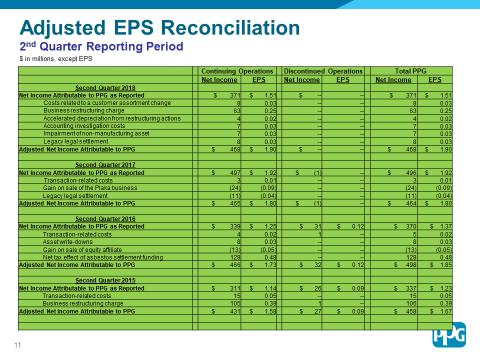
1 PPG Industries, Inc. Second Quarter 2018 Financial Results Earnings Brief July 19, 2018 Second Quarter Financial Highlights PPG second quarter net sales from continuing operations were approximately $4.1 billion, increasing nearly 9 percent versus the prior year. Net sales in local currencies grew by more than 6 percent year-over-year, aided by sales volume growth of more than 3 percent. Aggregate selling prices improved by greater than 2 percent, marking the fifth consecutive quarter of improvement over the previous sequential quarter. Additional detailed sales comparisons for each reporting segment are included on subsequent presentation slides. Reported earnings per diluted share from continuing operations was $1.51. Adjusted earnings per diluted share from continuing operations was $1.90, an increase of nearly 6 percent versus the prior year. The earnings increase was achieved despite elevated raw material and logistics costs, including the impact of higher oil prices, tight supply conditions for certain input costs, and availability of transportation. Raw material costs were also elevated in certain emerging regions due to the strengthening of the U.S. dollar versus the respective local currencies during the quarter. These cost increases were partially offset by continued cost management, including lower manufacturing costs and savings driven by restructuring actions, which have resulted in more than $35 million of savings for the first half Earnings accretive cash deployment continued in the second quarter, including share repurchases totaling about $460 million, which represented nearly 4.4 million shares or nearly 2 percent of total outstanding shares. PPG Second Quarter Net Sales PPG second quarter net sales of approximately $4.1 billion increased by nearly 9 percent, or about $325 million year-over-year. Local currency sales increased by about 6 percent driven by sales volume growth of more than 3 percent. Aggregate selling prices increased by greater than 2 percent year-over-year, and improved sequentially versus the first quarter by 60 basis points, with both business segments realizing increases. Selling price initiatives continued with several businesses announcing additional increases in the second quarter that will be executed in succeeding quarters. Acquisitionrelated sales added less than 1 percent, or about $30 million, driven primarily from The Crown Group acquisition. The U.S. dollar was weaker compared to prior year second quarter, especially against the euro, Chinese yuan, U.K. pound, and Mexican peso, resulting a favorable foreign exchange translation

2 impact of nearly 3 percent, or more than $90 million. During the second quarter, the dollar strengthened versus these same key currencies, resulting in less favorable translation impacts than were realized in the first quarter. For the third quarter, an unfavorable translation impact on net sales of between $70 million to $90 million is expected based on current exchange rates. Additional details on the sales volume results by region and business unit are included later in the presentation materials. Second Quarter Net Sales Volume Aggregate global sales volumes grew by more than 3 percent in the second quarter of Sales volumes modestly benefited from an extra shipping day compared to the second quarter 2017, primarily impacting the distribution businesses in the U.S. and Mexico. For the first half of 2018, sales volumes have increased nearly 2 percent. The focus on raising selling prices resulted in some modest sales volume loss in certain businesses. In the U.S. and Canada region, sales volumes were higher by a low-single-digit percentage. Aerospace coatings, automotive refinish coatings, and packaging coatings had abovemarket sales volume performance driven by customers continuing adoption of PPG s technology advantaged products. Architectural company-owned stores same store sales increased by a high-singledigit percentage and national retails (DIY) sales were up modestly aided by the launch of PPG OLYMPIC stain at The Home Depot. Lower volumes in the architectural coatings independent dealer channel partially offset these gains. The automotive OEM, general industrial coatings and protective and marine coatings businesses had modest regional sales volume growth during the quarter. Sales volumes were modestly higher in the Europe, Middle East, and Africa (EMEA) region. Strong sales volume growth in general industrial coatings, automotive OEM coatings, and packaging coatings was partially offset by a low-single-digit percentage decrease in architectural coatings as consumer sentiment remained subdued. Sales volumes in the protective and marine coatings business continued to be lower due to customer project delays, mostly in the Middle East. In Asia Pacific, sales volumes grew by a mid-single-digit percentage with above market growth in aerospace coatings, automotive refinish coatings, and protective and marine coatings, partially offset by lower sales volumes in packaging coatings. From a country and sub-region perspective, the year-overyear rate of volume growth achieved in China accelerated versus the first quarter. Looking ahead, we expect economic activity in China to be more volatile due to greater uncertainties related to global trade policies and the possibility of further tariffs. Sales volumes in India increased by a high-teen-digit percentage with solid, broad-based growth, while Korea volumes continued to decline due to soft but moderating marine shipbuilding activity and lower automotive OEM coatings demand. Sales volumes expanded in Latin America by a high-single-digit percentage versus the prior year for the second consecutive quarter, with expanded volumes in Mexico, Central America and South America. The regional volume growth was led by automotive OEM coatings, general industrial coatings, packaging coatings and automotive refinish coatings. The architectural coatings business in Mexico grew organic sales by a high-single-digit percentage driven by strong waterborne products and project sales. PPG automotive OEM coatings continued to perform at above-market levels driven by new business secured in The recent and broad trucker s strike in Brazil had a slightly negative impact on sales volumes and costs during the second quarter. Recent currency depreciation in various South American versus the U.S. dollar is resulting in further increases in the cost of raw materials, many of which are priced in U.S. dollars. 2


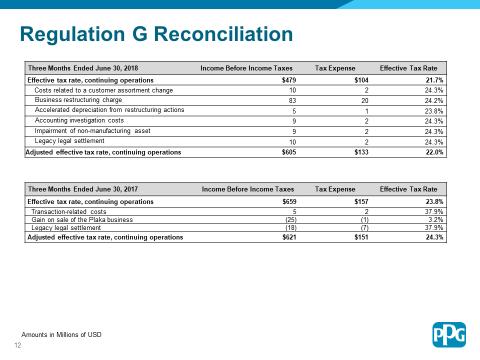
3 PPG Adjusted Earnings Per Diluted Share Second quarter 2018 adjusted earnings per diluted share from continuing operations of $1.90 was an increase of 10 cents, or nearly 6 percent, over the prior year. Financial results from each reportable business segment are provided below and in other presentation materials. Several key factors impacting earnings per diluted share growth were: 3 Aggregate selling prices increased 2.2 percent partially offsetting intensified, midsingle-digit percentage raw material and rising logistics cost inflation. Additional selling price increases have been announced or implemented that are expected to benefit the third quarter A new business restructuring program was initiated, targeting about $85 million in annual savings. Aggregate second half 2018 restructuring savings are expected to be between $45 - $50 million, including carry-over savings from the company s December 2016 restructuring program. The strengthening of the U.S. dollar during the second quarter resulted in less favorable foreign currency translation compared to the first quarter primarily due to the depreciation of the euro, U.K. pound, Mexican peso and Chinese yuan during the second quarter. During the quarter, the company repurchased shares totaling about $460 million. The average number of diluted shares outstanding decreased approximately 5 percent year-over-year. Second quarter corporate expenses were lower year-over-year driven primarily by lower pension and other post-retirement benefit costs as a result of actions taken in the past several years focused on structurally lowering these costs, lower incentive compensation costs, and gains realized on certain intercompany loan foreign exchange transactions. Corporate expenses are expected to total between $75 million and $90 million in the second half The second quarter effective tax rate was 22 percent. The lower current quarter tax rate is primarily attributable to recognizing in the second quarter favorable discrete tax items, which are unpredictable in both magnitude and timing. The Company anticipates its full-year 2018 adjusted effective tax rate will be between 23 percent and 24 percent. A detailed reconciliation of the adjusted second quarter earnings per diluted share and adjusted tax rate figures is included in the presentation materials appendix. Performance Coatings Second quarter net sales for the Performance Coatings segment were about $2.5 billion, up $199 million, or nearly 9 percent, versus the prior year. Sales in local currencies were up about 6 percent year-over-year, led by higher sales volume of nearly 4 percent and selling price increases of nearly 3 percent. Sales volume growth was led by the Asia Pacific region, which had sales volume growth of a lowteen-digit percentage driven by strong growth in
4 4 all businesses in the region. In addition, this segment benefited from favorable foreign currency translation of about $55 million, or more than 2 percent. Segment income of $428 million increased by $23 million year-over-year, or about 6 percent, primarily due to strong sales volumes, higher selling prices, and restructuring savings, partly offset by inflation in raw material and logistics costs. In addition, segment income increased due to favorable foreign currency translation of about $10 million. Approximately $5 million was spent during the quarter to support additional growth initiatives. From a business unit perspective, automotive refinish coatings organic sales grew by a mid-single-digit percentage year-over-year, led by above-market performance in all major regions. In addition, each key product segment delivered solid sales volume growth. We expect sales volumes to increase at a more modest pace in the third quarter, primarily driven by the U.S. and Canada where industry collision claims were down in the second quarter and miles driven have been flat. Aerospace coatings sales volumes grew by a low-teen-digit percentage, including above-market volume growth in the U.S. and Asia supported by technology advantaged products. Consistent with the prior quarter, Aerospace sales grew across all major platforms. Similar trends are anticipated for the third quarter Architectural coatings - EMEA sales volumes declined by a low-single-digit percentage year-over-year. While year-over-year sales volume performance improved versus the first quarter, volumes remain impacted by soft regional consumer demand. Looking ahead, we expect overall demand patterns to be consistent to those experienced in the first half of the year, with the potential for lower industry demand in the U.K. due to subdued consumer spending relating to apprehension surrounding the BREXIT process. Overall net sales are expected to be lower sequentially due to normal seasonal patterns. Architectural coatings Americas and Asia Pacific sales volumes were slightly higher versus the prior year. This business benefited from one additional shipping day compared to the prior year second quarter relating to a shift in the timing of the Easter holiday. Sales volumes were positive year-over-year in the U.S. and Canada company-owned store network, as well as in Mexico, Central America and China. The architectural coatings business in Mexico grew organic sales by a high-single-digit percentage driven by strong waterborne, roof coatings and project sales. The Mexico business opened about 100 new concessionaire locations during the quarter bringing the total location count to about 4,500. Organic sales volumes increased by a high-single-digit percentage in the U.S. and Canada companyowned stores, marking the third consecutive quarter with at least a mid-single-digit percentage increase. This increase was partially offset by lower independent dealer network sales volumes. The DIY channel was slightly higher compared with the prior year quarter supported by the launch of Olympic stain at THE HOME DEPOT during the quarter. Lower sales volumes are expected in the DIY channel in the third quarter due to the previously communicated customer assortment change. Net of the new stain business at THE HOME DEPOT, the Performance Coatings segment sales are expected to be lower by 200 to 250 basis points in the third and fourth quarters, or an approximate reduction to total company revenue of approximately 120 to 150 basis points. Protective and marine coatings sales volumes increased by a low-single-digit percentage driven by strong protective coatings sales volumes in China. Marine coatings sales volumes were higher off a low base the previous year, and are expected to generally trend modestly positive in the third quarter. Looking ahead, we expect modestly lower sequential sales due to seasonal patterns, no material benefit from acquisition-related sales in the segment and, based on current exchange rates, foreign currency translation is expected to have an unfavorable year-over-year impact on segment sales and income in

5 the third-quarter. In addition, we anticipate that raw material costs will remain elevated in the third-quarter 2018, at similar levels as experienced in the second quarter. We anticipate additional year-over-year growth-related spending of up to $5 million in the third quarter. Industrial Coatings Second quarter net sales for the Industrial Coatings segment were more than $1.6 billion, up about $130 million or nearly 9 percent yearover-year. Segment sales volumes grew by nearly 3 percent, and acquisition-related sales added less than 2 percent, or about $30 million. Selling prices increased by more than 1 percent versus the second quarter In addition, this segment benefited from favorable foreign currency translation of about $35 million, or nearly three percent. Segment income of about $223 million was down $41 million, or about 16 percent yearover-year, including favorable foreign currency translation of approximately $5 million, primarily related to the Chinese yuan, the euro and the Mexican peso. Segment income benefited from improving selling prices, restructuring savings and lower manufacturing costs, which were more than offset by elevated raw material and logistics costs. The raw materials utilized by the businesses in this reporting segment include a variety of oil derivatives. From a business unit perspective, sales volumes were up a low-single-digit percentage in the automotive OEM coatings business versus the prior year, consistent with the overall global industry build rate. PPG s sales volume growth was strongest in Latin America. Sales in the Asia Pacific region were flat compared to last year, primarily due to lower sales in Korea and the OEM industry production exit from Australia late last year. Sales volumes in China were consistent with industry builds. Global automotive industry growth is expected to be similar in the third quarter for most regions. In the U.S., industry production is projected to increase at a high-single-digit percentage reflecting an easier comparison to last year when natural disasters impacted regional auto builds. Aggregate general industrial coatings and specialty coatings and materials businesses sales volumes continued to grow in the second quarter. Sales volumes were the strongest in Europe, Asia-Pacific, and Latin America driven by strong end-use market demand for coil, heavy-duty equipment and electronic materials. Selling prices continued to gain momentum. Acquisition-related sales from The Crown Group, acquired in October 2017, added approximately $30 million in sales at below segment margins but in-line with company expectations. Overall year-over-year growth in this business moderated reflecting comparisons to strong growth in the previous year. We anticipate continued favorable general industrial demand growth trends in the aggregate in the third quarter. Packaging coatings sales volumes were up a mid-single-digit percentage versus the prior year due to ongoing adoption of PPG s new can coating technologies. Sales volumes increased by a high-single-digit percentage in the U.S., Europe, and Latin America. In the Asia Pacific region, volumes decreased stemming from prioritizing selling price increases over volume. We anticipate sales volume growth will continue due to the ongoing industry conversion to BPA-non-intent interior can coatings with PPG s yearover-year aggregate growth rates continuing at an above-market level for the remainder of Looking ahead, we expect modestly lower sequential sales in the third quarter due to seasonal patterns, most notably in the automotive OEM coatings where normal annual production shutdowns are planned. There is greater risk of industrial demand being impacted due to uncertainties regarding global trade policies. We anticipate that the raw material and logistics cost inflationary environment will continue in the third quarter at similar levels as experienced in the second quarter. The company will continue to 5

6 prioritize selling price increases and operating margin recovery, both of which are expected to improve in the third quarter. Based on current exchange rates, foreign currency translation is expected to have a negative impact on segment sales and income in the third quarter Balance Sheet and Cash PPG ended the second quarter with about $1.1 billion in cash and short-term investments. Approximate uses of cash for the second quarter were as follows: Capital expenditures were about $45 million in the quarter. We anticipate capital spending to be up to 3 percent of sales in Dividends paid were $110 million in the second quarter. PPG stock repurchases totaled approximately $460 million in the second quarter. The company has about $2.5 billion remaining under its current share repurchase authorizations, as of the end of the second quarter. The company plans to continue its share repurchase program in the second half of 2018 and, as part of our previously communicated target to deploy $3.5 billion in 2017 and 2018 combined, is committed to deploying a minimum of $2.4 billion during 2018 on acquisitions and share repurchases. The coatings industry continues to have an active pipeline of acquisition candidates. The company continues to have excellent financial flexibility with cash and short-term investments of about $1.1 billion at the end of the second quarter. 6
7 7
8 8 Forward-Looking Statements Statements continued herein relating to matters that are not historical facts are forward-looking statements reflecting PPG s current view with respect to future events and financial performance. These matters within the meaning of Section 27A of the Securities Act of 1933, as amended, and Section 21E of the Securities Exchange Act of 1934, as amended, involve risks and uncertainties that may affect PPG Industries operations, as discussed in the company s filings with the Securities and Exchange Commission pursuant to Sections 13(a), 13(c) or 15(d) of the Exchange Act, and the rules and regulations promulgated thereunder. Accordingly, many factors could cause actual results to differ materially from the forward-looking statements contained herein. Such factors include global economic conditions, increasing price and product competition by foreign and domestic competitors, fluctuations in cost and availability of raw materials, the ability to achieve selling price increases, the ability to recover margins, the ability to maintain favorable supplier relationships and arrangements, the timing of realization of anticipated cost savings from restructuring initiatives, the ability to identify additional cost savings opportunities, difficulties in integrating acquired businesses and achieving expected synergies therefrom, economic and political conditions in international markets, the ability to penetrate existing, developing and emerging foreign and domestic markets, foreign exchange rates and fluctuations in such rates, fluctuations in tax rates, the impact of future legislation, the impact of environmental regulations, unexpected business disruptions, the unpredictability of existing and possible future litigation, including asbestos litigation, and governmental investigations. Such factors also include risks related to the impact of the restatement disclosed in our amended 2017 Annual Report on Form 10-K/A, including the impact on PPG s reputation and commercial contracts, our ability to successfully remediate the material weakness in our internal control over financial reporting disclosed in our amended Annual Report on Form 10-K/A within the time periods and in the manner currently anticipated, the effectiveness of our internal control over financial reporting, including the identification of additional control deficiencies and further expenditures related to our restatement. However, it is not possible to predict or identify all such factors. Consequently, while the list of factors presented here and in our amended Annual Report on Form 10-K/A are considered representative, no such list should be considered to be a complete statement of all potential risks and uncertainties. Unlisted factors may present significant additional obstacles to the realization of forward-looking statements. Consequences of material differences in results compared with those anticipated in the forward-looking statements could include, among other things, lower sales or earnings, business disruption, operational problems, financial loss, legal liability to third parties and similar risks, any of which could have a material adverse effect on PPG s consolidated financial condition, results of operations or liquidity. All information in this release speaks only as of July 19, 2018, and any distribution of this release after that date is not intended and will not be construed as updating or confirming such information. PPG undertakes no obligation to update any forward-looking statement, except as otherwise required by applicable law.
PPG Industries, Inc. First 2018 Financial Results Earnings Brief April 19, 2018
 PPG Industries, Inc. First 2018 Financial Results Earnings Brief April 19, 2018 First Quarter Financial Highlights PPG first quarter net sales from continuing operations were approximately $3.8 billion,
PPG Industries, Inc. Fourth Quarter 2018 Financial Results Earnings Brief January 17, 2019
 PPG Industries, Inc. Fourth Quarter 2018 Financial Results Earnings Brief January 17, 2019 Fourth Quarter Financial Highlights PPG fourth quarter net sales from continuing operations were approximately
PPG Industries, Inc. First Quarter 2019 Financial Results Earnings Brief April 18, 2019
 PPG Industries, Inc. First Quarter 2019 Financial Results Earnings Brief April 18, 2019 First Quarter Financial Highlights PPG first quarter net sales from continuing operations were approximately $3.6
PPG Industries, Inc. Fourth 2017 Financial Results Earnings Brief January 18, 2018
 PPG Industries, Inc. Fourth 2017 Financial Results Earnings Brief January 18, 2018 Fourth Quarter Financial Highlights PPG fourth quarter net sales from continuing operations were approximately $3.7 billion,
PPG Industries, Inc. Fourth 2016 Financial Results Earnings Brief January 19, 2017
 PPG Industries, Inc. Fourth 2016 Financial Results Earnings Brief January 19, 2017 Fourth Quarter Financial Highlights PPG fourth quarter net sales from continuing operations of $3.5 billion were down
PPG Industries, Inc. Second Quarter 2017 Financial Results Earnings Brief July 20, 2017
 PPG Industries, Inc. Second Quarter 2017 Financial Results Earnings Brief July 20, 2017 Second Quarter Financial Highlights Net sales for the second quarter 2017 were $3.8 billion, increasing about 1 percent
PPG Industries, Inc. Second 2016 Financial Results Earnings Brief July 21, 2016
 PPG Industries, Inc. Second 2016 Financial Results Earnings Brief July 21, 2016 Second Quarter 2016 Financial Highlights PPG net sales for the second quarter 2016 were $4.1 billion, down less than one
Third Quarter 2018 Financial Results
 Third Quarter 2018 Financial Results Michael H. McGarry, Chairman and Chief Executive Officer Vincent J. Morales, Senior Vice President and Chief Financial Officer John Bruno, Director, Investor Relations
PPG Industries, Inc. Third 2016 Financial Results Earnings Brief October 20, 2016
 PPG Industries, Inc. Third 2016 Financial Results Earnings Brief October 20, 2016 Third Quarter 2016 Financial Highlights PPG net sales for the third quarter 2016 were $3.8 billion, up almost 2 percent
Fourth Quarter 2018 Financial Results
 Fourth Quarter 2018 Financial Results Michael H. McGarry, Chairman and Chief Executive Officer Vincent J. Morales, Senior Vice President and Chief Financial Officer John Bruno, Director, Investor Relations
PPG Industries, Inc. Second Quarter 2014 Financial Results Earnings Brief July 17, 2014
 PPG Industries, Inc. Second Quarter 2014 Financial Results Earnings Brief July 17, 2014 Second Quarter Financial Summary PPG net sales from continuing operations for the second quarter increased to $4.1
PPG Industries, Inc. Second Quarter 2015 Financial Results Earnings Brief July 16, 2015
 PPG Industries, Inc. Second Quarter 2015 Financial Results Earnings Brief July 16, 2015 Second Quarter Financial Highlights PPG net sales for the second quarter 2015 increased to $4.10 billion versus the
First Quarter 2019 Financial Results
 First Quarter 2019 Financial Results Michael H. McGarry, Chairman and Chief Executive Officer Vincent J. Morales, Senior Vice President and Chief Financial Officer John Bruno, Director, Investor Relations
PPG Industries, Inc. Third Quarter 2015 Financial Results Earnings Brief October 15, 2015
 PPG Industries, Inc. Third Quarter 2015 Financial Results Earnings Brief October 15, 2015 Third Quarter Financial Highlights PPG net sales for the third quarter of 2015 were $3.87 billion versus the prior
PPG Third Quarter 2017 Financial Results
 PPG Third Quarter 2017 Financial Results Michael H. McGarry, Chairman and Chief Executive Officer Vincent J. Morales, Senior Vice President and Chief Financial Officer John Bruno, Director Investor Relations
PPG Fourth Quarter and Full Year 2017 Financial Results
 PPG Fourth Quarter and Full Year 2017 Financial Results Michael H. McGarry, Chairman and Chief Executive Officer Vincent J. Morales, Senior Vice President and Chief Financial Officer John Bruno, Director,
News. PPG reports fourth quarter and full-year 2018 financial results
 News PPG Media Contact: Mark Silvey Corporate Communications +1-412-434-3046 silvey@ppg.com PPG Investor Contact: John Bruno Investor Relations +1-412-434-3466 jbruno@ppg.com investor.ppg.com PPG reports
News. PPG reports second quarter 2016 financial results
 News PPG Media Contact: Mark Silvey Corporate Communications +1-412-434-3046 silvey@ppg.com PPG Investor Contact: Scott Minder Investor Relations +1-412-434-3466 sminder@ppg.com www.ppg.com/investor PPG
PPG. Protecting and. Michael Beautifying H. McGarry the World Chairman and Chief Executive Officer. New York Nov. 28, 2017
 PPG Protecting and Michael Beautifying H. McGarry the World Chairman and Chief Executive Officer Citi Michael Basic Materials H. McGarry Conference New York Nov. 28, 2017 Forward Looking Statements The
PPG Frank S. Sklarsky Executive Vice President and Chief Financial Officer
 PPG Frank S. Sklarsky Executive Vice President and Chief Financial Officer Bank of America s 2016 Agriculture & Chemicals Conference Fort Lauderdale, FL Information current as of March 1, 2016 Forward
2016 THIRD-QUARTER EARNINGS REVIEW October 25, 2016
 2016 THIRD-QUARTER EARNINGS REVIEW October 25, 2016 0 THIRD-QUARTER EARNINGS PRESENTATION WHIRLPOOL CORPORATION ADDITIONAL INFORMATION This presentation contains forward-looking statements about Whirlpool
Q Earnings. July 20, 2016
 Q3 2016 Earnings July 20, 2016 Forward-Looking Statements and Non-GAAP Measures Forward-Looking Statements This presentation contains certain forward-looking statements within the meaning of the U.S. Private
David Navikas Vice President and Controller
 David Navikas Vice President and Controller PPG Industries, Inc. New York City May 18, 2007 Forward-Looking Statement Statements contained herein relating to matters that are not historical facts are forward-looking
Q Earnings Call. April 24, 2013
 Q2 2013 Earnings Call April 24, 2013 Forward-Looking Statements and Non-GAAP Measures Forward-Looking Statements -- This presentation contains certain forward-looking statements within the meaning of the
Thank you and good morning everyone. Welcome to our third quarter 2017 business review.
 Q3 2017 Earnings Call Transcript Inge Thulin & Nicholas Gangestad October 24, 2017 Slide 1, Opening Bruce Jermeland, Director of Investor Relations Thank you and good morning everyone. Welcome to our third
Axalta Coating Systems Ltd.
 Q1 2015 Conference Call May 6, 2015 Notice Regarding Forward Looking Statements, Non-GAAP Financial Measures and Defined Terms Forward-Looking Statements This presentation and the oral remarks made in
Thank you, good morning everyone and welcome to our fourth quarter 2014 business review.
 Q4 2014 Earnings Call Transcript Inge Thulin & Nicholas Gangestad January 27, 2015 Slide 1, Opening Matt Ginter, Vice President, Investor Relations Thank you, good morning everyone and welcome to our fourth
Third Quarter 2012 Earnings Release October 31, 2012
 Third Quarter 2012 Earnings Release October 31, 2012 Alexander M. Cutler Forward-looking statements and non-gaap financial information This presentation contains forward-looking statements concerning the
Q Earnings. October 31, 2018
 Q4 2018 Earnings October 31, 2018 Forward-Looking Statements and Non-GAAP Financial Measures Forward-Looking Statements This presentation contains certain forward-looking statements within the meaning
2017 Third Quarter Business Review
 2017 Third Quarter Business Review (Unaudited) October 24, 2017 1 Earnings Conference Calls Q4: January 25, 2018 2018 Outlook Meeting December 12, 2017 8:00 a.m. - 12:00 p.m. EST 2 Forward looking statement
FRANKLIN ELECTRIC REPORTS 2010 EARNINGS PER SHARE INCREASED 48 PERCENT FROM 2009
 For Immediate Release For Further Information Refer to: John J. Haines 260-824-2900 FRANKLIN ELECTRIC REPORTS 2010 EARNINGS PER SHARE INCREASED 48 PERCENT FROM 2009 Bluffton, Indiana February 28, 2011
FOURTH-QUARTER 2017 EARNINGS REVIEW January 25, 2018
 FOURTH-QUARTER 2017 EARNINGS REVIEW January 25, 2018 GLOBAL OVERVIEW INSERT PHOTO HERE Marc Bitzer Chief Executive Officer 2 2017 FOURTH-QUARTER HIGHLIGHTS Ongoing EPS of $4.10 in Q4 and $13.74 for the
Q Earnings. April 20, 2016
 Q2 2016 Earnings April 20, 2016 Forward-Looking Statements and Non-GAAP Measures Forward-Looking Statements This presentation contains certain forward-looking statements within the meaning of the U.S.
Second-Quarter Earnings Review
 Second-Quarter 2018 Earnings Review GLOBAL OVERVIEW Marc Bitzer President and Chief Executive Officer 2 2018 SECOND-QUARTER HIGHLIGHTS Ongoing EBIT margin expansion despite challenging cost environment
XYLEM INC. Q EARNINGS RELEASE JULY 31, 2018
 XYLEM INC. Q2 2018 EARNINGS RELEASE JULY 31, 2018 Q2 2018 EARNINGS RELEASE FORWARD-LOOKING STATEMENTS This presentation contains information that may constitute forward-looking statements. within the meaning
Q Earnings. November 2, 2016
 Q4 2016 Earnings November 2, 2016 Forward-Looking Statements and Non-GAAP Measures Forward-Looking Statements This presentation contains certain forward-looking statements within the meaning of the U.S.
Our results at a glance
 Report for the first quarter 2014 AkzoNobel I Report for the first quarter 2014 2 AkzoNobel around the world Revenue by destination (44 percent in high growth markets) A North America B Emerging Europe
Financial Information
 Accelerating & profit in H1: Revenue up +4% reported, Adj. EBITA +8%, Net Income +18%, FCF +15% H1 revenue of 12.2bn, +2.7% organic, +4.1% outside Infrastructure H1 adj. EBITA margin up 60bps 1 org., to
Webcast. Fourth Quarter Fiscal Year 2016 Results. Quarter ended February 26, 2016
 Webcast Fourth Quarter Fiscal Year Results Quarter ended February 26, Forward-looking statements From time to time, in written and oral statements, the company discusses its expectations regarding future
XYLEM INC. Q EARNINGS RELEASE MAY 1, 2018
 XYLEM INC. Q1 2018 EARNINGS RELEASE MAY 1, 2018 Q1 2018 EARNINGS RELEASE FORWARD-LOOKING STATEMENTS This presentation contains information that may constitute forward-looking statements. Forward-looking
14375 NW Science Park Drive Portland, OR April 29, 2014
 14375 NW Science Park Drive Portland, OR 97229 April 29, 2014 CFO Commentary on First Quarter 2014 Financial Results, Upward-Revised 2014 Pre-Acquisition Financial Outlook, and Agreement to Purchase prana
Sanford Bernstein Conference Rockwell Automation
 Sanford Bernstein Conference Rockwell Automation Keith D. Nosbusch Chairman and CEO May 31, 2013 Rev 5058-CO900D Safe Harbor Statement This presentation contains statements (including certain projections
2017 THIRD-QUARTER EARNINGS REVIEW October 24, 2017
 2017 THIRD-QUARTER EARNINGS REVIEW October 24, 2017 CAUTIONARY STATEMENT This presentation contains forward-looking statements about Whirlpool Corporation and its consolidated subsidiaries ( Whirlpool
ITT reports 2017 fourth-quarter and full-year results, 2018 guidance
 ITT Inc. 1133 Westchester Ave. White Plains, NY 10604 tel 914 641 2000 Press Release ITT reports 2017 fourth-quarter and full-year results, 2018 guidance 2017 Full-Year Results: Revenue up 8% to $2.6 billion,
2017 First Quarter Business Review
 2017 First Quarter Business Review (Unaudited) April 25, 2017 1 Earnings Conference Calls Q2: July 25, 2017 Q3: October 24, 2017 2018 Outlook Meeting December 12, 2017 2 Upcoming 2017 investor events European
THIRD QUARTER REPORT Period Ended September 30, Management s Discussion and Analysis and Unaudited Consolidated Financial Statements
 THIRD QUARTER REPORT Period Ended 2010 Management s Discussion and Analysis and Unaudited Consolidated Financial Statements MANAGEMENT S DISCUSSION AND ANALYSIS This management s discussion and analysis
Third Quarter Fiscal February 1, :00 am CDT
 Third Quarter Fiscal 2019 February 1, 2019 8:00 am CDT Forward-Looking Statements This presentation contains statements, including information about future financial performance and market conditions,
Second Quarter 2014 Earnings Call July 30, Ilene Gordon, Chairman and CEO Jack Fortnum, Chief Financial Officer
 Second Quarter 2014 Earnings Call July 30, 2014 Ilene Gordon, Chairman and CEO Jack Fortnum, Chief Financial Officer Forward-Looking Statements This presentation contains or may contain forward-looking
Third Quarter 2018 Earnings Release Supplement
 Third Quarter 2018 October 26, 2018 The data in this package should be read in conjunction with Barnes Group Inc. s earnings release and periodic filings with the SEC. Safe Harbor Statement / Non-GAAP
Financial Information
 Financial Information H1 revenues reached 12.8bn up 9.8%, flat org. in Q2 Adj. EBITA reached 1.6bn, up 6.4%, Adj. EBITA margin flat excl. Invensys in a challenging environment 2015 targets: Around flat
XYLEM INC. Q EARNINGS RELEASE OCTOBER 30, 2018
 XYLEM INC. Q3 2018 EARNINGS RELEASE OCTOBER 30, 2018 Q3 2018 EARNINGS RELEASE FORWARD-LOOKING STATEMENTS This presentation contains information that may constitute forward-looking statements. within the
Full-Year 2018 Investor Call
 Full-Year 2018 Investor Call Achieved 2018 core sales and 2018 EPS growth of 11% with continued growth expected in 2019 and beyond. We remain on track to fully achieve our Strategy and Capital Allocation
First Quarter 2018 Conference Call. April 25, 2018
 First Quarter 2018 Conference Call April 25, 2018 Forward-Looking Statements Certain information contained in this presentation constitutes forward-looking statements for purposes of the safe harbor provisions
Mondelēz International 2013 Results. February 12, 2014
 Mondelēz International 2013 Results February 12, 2014 1 Forward-looking statements This slide presentation contains a number of forward-looking statements. Words, and variations of words, such as will,
OWENS-ILLINOIS. Credit Suisse 2018 Basic Materials Conference
 OWENS-ILLINOIS Credit Suisse 2018 Basic Materials Conference ANDRES LOPEZ, CEO JAN BERTSCH, CFO SEPTEMBER 12, 2018 Safe harbor comments Forward-Looking Statements This document contains "forward-looking"
CommScope Reports Fourth Quarter 2017 Results
 CommScope Reports Fourth Quarter 2017 Results Fourth Quarter 2017 Performance o Sales of $1.12 billion, consistent with guidance o GAAP operating income of $92 million and non-gaap adjusted operating income
Q Earnings. July 26, 2017
 Q3 2017 Earnings July 26, 2017 Forward-Looking Statements and Non-GAAP Measures Forward-Looking Statements This presentation contains certain forward-looking statements within the meaning of the U.S. Private
Mondelēz International Q Results. July 27, 2016
 Mondelēz International Q2 2016 Results July 27, 2016 1 Forward-Looking Statements This presentation contains a number of forward-looking statements. Words, and variations of words, such as will, expect,
CommScope Reports Fourth Quarter 2017 Results
 February 15, 2018 CommScope Reports Fourth Quarter 2017 Results Fourth Quarter 2017 Performance Sales of $1.12 billion, consistent with guidance GAAP operating income of $92 million and non-gaap adjusted
A X A L T A C O A T I N G S Y S T E M S. Q FINANCIAL RESULTS October 27, 2016
 A X A L T A C O A T I N G S Y S T E M S Q3 2016 FINANCIAL RESULTS October 27, 2016 Legal Notices Forward-Looking Statements This presentation and the oral remarks made in connection herewith may contain
Third Quarter 2014 Earnings Release October 29, 2014
 Third Quarter 2014 Earnings Release October 29, 2014 Alexander M. Cutler Forward-looking Statements and Non-GAAP Financial Information This presentation or the comments we make on our call today may contain
Earnings Call Presentation
 Exhibit 99.2 February 27, 2017 Earnings Call Presentation 4 th Quarter 2016 Safe Harbor Statement 2 Our disclosures in this presentation, including without limitation, those relating to future financial
Fiscal Year 2016 Fourth Quarter Conference Call
 Fiscal Year 2016 Fourth Quarter Conference Call November 7, 2016 2 Safe Harbor Statement This presentation includes statements related to the expected future results of the company and are therefore forward-looking
NCI Building Systems Reports Fourth Quarter and 2013 Fiscal Year End Results
 NCI Building Systems Reports Fourth Quarter and 2013 Fiscal Year End Results HOUSTON, December 10, 2013 NCI Building Systems, Inc. (NYSE: NCS) today reported financial results for the fourth quarter and
Q Earnings. January 23, 2019
 Q1 2019 Earnings January 23, 2019 Forward-Looking Statements and Non-GAAP Financial Measures Forward-Looking Statements This presentation contains certain forward-looking statements within the meaning
Third Quarter 2017 Earnings Results
 POLARIS INDUSTRIES INC. Third Quarter 2017 Earnings Results October 24, 2017 SAFE HARBOR & NON-GAAP MEASURES Except for historical information contained herein, the matters set forth in this presentation,
Third Quarter 2017 Conference Call. October 27, 2017
 Third Quarter 2017 Conference Call October 27, 2017 Forward-Looking Statements Certain information contained in this presentation constitutes forward-looking statements for purposes of the safe harbor
3Q 2018 Highlights and Operating Results. Products. Technology. Services. Delivered Globally.
 3Q 2018 Highlights and Operating Results Products. Technology. Services. Delivered Globally. Table of Contents Page 3 Safe Harbor Statement and Non-GAAP Financial Measures 4 Sales Overview 9 Overview of
Net income to common stockholders improved $1.4 billion Y-O-Y to a Q3 record of $2.8 billion.
 1 2 3 Q3 global deliveries up 0.1 million units Y-O-Y, a 4% increase. Volume gains primarily in China, offset by reductions in other International Operations. Q3 market share is down 40 bps Y-O-Y, driven
Q4 & Full Year 2017 Financial Results
 Exhibit 99.2 Q4 & Full Year 2017 Financial Results February 6, 2018 Legal Notices Forward-Looking Statements This presentation and the oral remarks made in connection herewith may contain forward-looking
Report. Report for the full-year and fourth quarter 2016
 4 Report Report for the full-year and fourth quarter 2016 16 AkzoNobel I Report for the full-year and the fourth quarter 2016 2 Our results at a glance Full-year: Record ROS, ROI, EBIT, adjusted EPS and
2014 Results and 2015 Outlook
 Leading the world in essentials for a better life. 2014 Results and 2015 Outlook January 23, 2015 Conference Call Reminders Forward-Looking Information Certain matters in this presentation and conference
CommScope Reports Fourth Quarter and Full Year 2018 Results
 CommScope Reports Fourth Quarter and Full Year 2018 Results February 21, 2019 Fourth Quarter 2018 Performance Sales of $1.06 billion GAAP operating income of $49 million Non-GAAP adjusted operating income
3 rd Quarter 2018 Earnings Conference Call. October 25, 2018
 3 rd Quarter 2018 Earnings Conference Call October 25, 2018 Safe Harbor Today s presentation includes forward-looking statements that reflect management s current expectations about the Company s future
October 22, 2013 Media Contact: Patty Seif WILMINGTON, Del Investor Contact:
 October 22, 2013 Media Contact: Patty Seif WILMINGTON, Del. 302-774-4482 patricia.r.seif@dupont.com Investor Contact: 302-774-4994 DuPont Delivers 3Q 2013 Operating Earnings of $.45 per Share Sales Increase
2016 INVESTOR MEETINGS FIRST QUARTER 2016 WHIRLPOOL CORPORATION
 2016 INVESTOR MEETINGS FIRST QUARTER 0 FIRST-QUARTER INVESTOR MEETINGS WHIRLPOOL CORPORATION ADDITIONAL INFORMATION This Presentation contains forward-looking statements about Whirlpool Corporation and
BARNES GROUP INC. REPORTS FOURTH QUARTER AND FULL YEAR 2018 FINANCIAL RESULTS
 Barnes Group Inc. 123 Main Street Bristol, CT 06010 NEWS RELEASE Fourth Quarter 2018: REPORTS FOURTH QUARTER AND FULL YEAR 2018 FINANCIAL RESULTS Record Quarterly Sales of $384 million, up 3% from last
DuPont Segment Commentary
 This data should be read in conjunction with the Company s third quarter earnings news release dated October 22, and DuPont s 3Q Earnings Conference Call presentation materials posted on the Investor Center
Corning Incorporated Investor Relations t CORNING One Riverfront Plaza Corning, NY 14831
 Corning Incorporated Investor Relations t 1-888-CORNING One Riverfront Plaza Corning, NY 14831 f 1-607-974-8091 irinfo@corning.com www.corning.com/investor_relations News Release FOR RELEASE JANUARY 29,
901 S. Central Expressway, Richardson, TX 75080
 901 S. Central Expressway, Richardson, TX 75080 FOSSIL GROUP REPORTS THIRD QUARTER RESULTS Net Sales Increase 18% to $810 Million Diluted EPS Increases 25% to $1.58 Maintains Full Year EPS Guidance and
KeyBanc Industrial, Automotive & Transportation Conference May 29, 2014
 KeyBanc Industrial, Automotive & Transportation Conference May 29, 2014 Forward-Looking Statements Certain information contained in this presentation constitutes forward-looking statements for purposes
ACTUANT REPORTS THIRD QUARTER RESULTS; UPDATES FISCAL 2018 GUIDANCE
 For Immediate Release N86 W12500 Westbrook Crossing Menomonee Falls, WI 53051 Contact: Karen Bauer Communications & Investor Relations Leader 262-293-1562 ACTUANT REPORTS THIRD QUARTER RESULTS; UPDATES
July 28, 2016 Conference Call Slide Presentation HARLEY-DAVIDSON, INC SECOND QUARTER UPDATE
 HARLEY-DAVIDSON, INC. 2016 SECOND QUARTER UPDATE JULY 28, 2016 2016 SECOND QUARTER UPDATE THIS PRESENTATION SUPPORTS THE AUDIO CONFERENCE CALL CONFERENCE CALL PARTICIPANTS Introduction Business Perspectives
Fourth Quarter and Full Year 2018 Financial Review. January 28, 2019
 Fourth Quarter and Full Year 2018 Financial Review January 28, 2019 Forward-Looking Statements Certain statements in this financial review relate to future events and expectations and are forward-looking
Q Earnings. January 24, 2018
 Q1 2018 Earnings January 24, 2018 Forward-Looking Statements and Non-GAAP Measures Forward-Looking Statements This presentation contains certain forward-looking statements within the meaning of the U.S.
UNITED STATES SECURITIES AND EXCHANGE COMMISSION Washington, D.C FORM 8-K
 UNITED STATES SECURITIES AND EXCHANGE COMMISSION Washington, D.C. 20549 FORM 8-K CURRENT REPORT Pursuant to Section 13 or 15(d) of the Securities Exchange Act of 1934 Date of Report (Date of earliest event
FOR IMMEDIATE RELEASE CONTACT: Media: Ben Deutsch (404) Investors: Ann Taylor (404) THE COCA-COLA COMPANY REPORTS
 Investors: Ann Taylor (404) THE COCA-COLA COMPANY REPORTS") Media Relations Department P.O. Box 1734, Atlanta, GA 30301 Telephone (404) 676-2121 FOR IMMEDIATE RELEASE CONTACT: Media: Ben Deutsch (404) 676-2683 Investors: Ann Taylor (404) 676-5383 THE COCA-COLA
Media Relations Department P.O. Box 1734, Atlanta, GA 30301 Telephone (404) 676-2121 FOR IMMEDIATE RELEASE CONTACT: Media: Ben Deutsch (404) 676-2683 Investors: Ann Taylor (404) 676-5383 THE COCA-COLA
Colgate-Palmolive Company First Quarter 2017 Earnings Release Prepared Remarks Friday, April 28, 2017
 This commentary, the remarks made during our first quarter 2017 earnings release conference call and our first quarter 2017 earnings press release furnished to the SEC are integrally related and are intended
McCormick & Company, Inc. 2nd Quarter 2017 Financial Results and Outlook June 29, 2017
 McCormick & Company, Inc. 2nd Quarter 2017 Financial Results and Outlook June 29, 2017 1 The following slides accompany a June 29, 2017 presentation to investment analysts. This information should be read
1 st Quarter 2018 Earnings Conference Call. April 26, 2018
 1 st Quarter 2018 Earnings Conference Call April 26, 2018 Safe Harbor Today s presentation includes forward-looking statements that reflect management s current expectations about the Company s future
Second Quarter 2018 Earnings Release July 31, 2018
 Second Quarter 2018 Earnings Release July 31, 2018 Craig Arnold Forward-looking Statements and Non-GAAP Financial Information This presentation or the comments we make on our call today contain forward-looking
Second Quarter 2015 Conference Call
 Second Quarter 2015 Conference Call July 28, 2015 1 Forward Looking and Cautionary Statements Certain statements in this presentation constitute forward looking statements within the meaning of the US
Stock Symbol: TSX CCL.A and CCL.B. CCL Industries Reports a 25% Increase in Third Quarter 2012 Net Earnings and Declares Dividend Results Summary
 CCL Industries Inc. 105 Gordon Baker Road, Suite 500, Toronto, Ontario M2H 3P8 Telephone: (416) 756-8500 Fax: (416) 756-8555 News Release Stock Symbol: TSX CCL.A and CCL.B For Immediate Release Tuesday,
Fourth Quarter 2017 Conference Call. February 8, 2018
 Fourth Quarter 2017 Conference Call February 8, 2018 Forward-Looking Statements Certain information contained in this presentation constitutes forward-looking statements for purposes of the safe harbor
Thank you and good morning everyone. Welcome to our second quarter 2018 business review.
 Q2 2018 Earnings Call Transcript Inge Thulin, Michael Roman & Nicholas Gangestad July 24, 2018 Slide 1, Cover Page Slide 2, Upcoming Investor Events Bruce Jermeland, Director of Investor Relations Thank
Press release Vevey, February 15, Nestlé reports full-year results for 2017
 Press release Vevey, February 15, 2018 Follow today's events live 09:00 CET Press conference webcast 14:00 CET Investor call audio webcast Full details: www.nestle.com/media/mediaeventscalendar/allevents/-full-year-results
GLOBAL OVERVIEW. Marc Bitzer. President and Chief Executive Officer
 Third-Quarter Second-Quarter 2018 2018 Earnings Review GLOBAL OVERVIEW Marc Bitzer President and Chief Executive Officer 2 2018 THIRD-QUARTER HIGHLIGHTS All-time record ongoing EPS of $4.55 and EBIT margin
GENERAL MILLS REPORTS FISCAL 2019 FIRST-QUARTER RESULTS
 News/Information Investor Relations P. O. Box 1113 Minneapolis, MN 55440 FOR IMMEDIATE RELEASE September 18, 2018 Contact: (analysts) Jeff Siemon: 763-764-2301 (media) Kelsey Roemhildt: 763-764-6364 GENERAL
Q Earnings. October 28, 2015
 Q4 2015 Earnings October 28, 2015 Forward-Looking Statements and Non-GAAP Measures Forward-Looking Statements This presentation contains certain forward-looking statements within the meaning of the U.S.
Intuit Annual Revenue Grows 11 Percent; GAAP Operating Income Grows 26 Percent
 Intuit Annual Revenue Grows 11 Percent; GAAP Operating Income Grows 26 Percent Annual Non-GAAP Operating Income Exceeds $1 Billion for First Time; Strong Fourth-Quarter Results Led by Double-Digit Growth