PPG Industries, Inc. Fourth Quarter 2018 Financial Results Earnings Brief January 17, 2019
|
|
|
- Dustin Bruce Montgomery
- 5 years ago
- Views:
Transcription


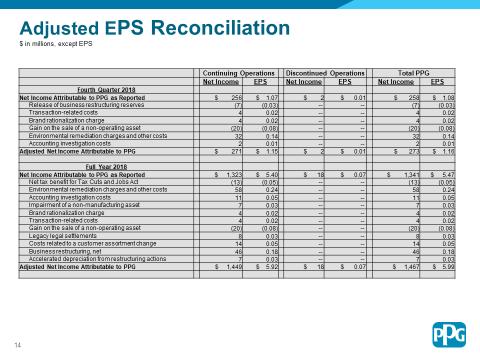
1 PPG Industries, Inc. Fourth Quarter 2018 Financial Results Earnings Brief January 17, 2019 Fourth Quarter Financial Highlights PPG fourth quarter net sales from continuing operations were approximately $3.6 billion, down about 1 percent versus the prior year. Net sales in local currencies grew by about 2 percent versus the prior year, aided by improved selling prices of greater than 2 percent. More detailed sales comparisons for the company and each reporting segment are included on subsequent presentation slides. Reported earnings per diluted share from continuing operations were $1.07. Adjusted earnings per diluted share from continuing operations were $1.15. Earnings continued to be impacted by higher year-over-year raw material costs, which was mostly related to carry-forward inflation. In addition, logistics costs remained at elevated levels. These cost increases were partially offset by more than $20 million of savings from previously announced restructuring actions and continued discretionary cost management. The strengthening of the U.S. dollar during the fourth quarter resulted in unfavorable foreign currency translation of approximately $10 million primarily due to the depreciation of the euro, U.K. pound, Mexican peso and several emerging region currencies in the fourth quarter. The fourth quarter adjusted effective tax rate was about 26 percent. The higher current quarter tax rate is primarily attributable to the timing of recognizing unfavorable discrete tax items, which are unpredictable in both magnitude and timing. Earnings-accretive cash deployment continued in the fourth quarter, including share repurchases totaling over $400 million, which represented about 4 million shares or approximately 2 percent of total outstanding shares. In October, PPG announced the acquisition of SEM, an automotive refinish manufacturer, and subsequently closed the transaction in December. In addition, the company recently announced two other acquisitions; Whitford Worldwide Company, a global manufacturer that specializes in low-friction and nonstick coatings for industrial applications and consumer products, and Hemmelrath, a manufacturer of coatings for automotive original equipment manufacturers (OEMs). The Whitford acquisition is currently expected to close by the end of the first quarter and the Hemmelrath acquisition is expected to close at some point in the second quarter, both pending required regulatory approvals.


2 2 PPG Fourth Quarter Net Sales PPG fourth quarter net sales of $3.6 billion were down by $37 million year-over-year, including unfavorable foreign currency translation of approximately $110 million, or about 3 percent. Excluding the unfavorable impact from the previously announced customer assortment changes in the U.S. architectural coatings business, sales growth was about 3 percent in constant currency. Aggregate selling prices increased by more than 2 percent year-over-year, with solid contributions from both reporting segments. This marked the seventh consecutive quarter of improvement over the previous sequential quarter. Additional selling price initiatives continue. Acquisition-related sales added about $15 million, including the SEM acquisition. The U.S. dollar was stronger compared to the prior year fourth quarter, especially against the euro, Mexican peso, and British pound, resulting in an unfavorable foreign exchange translation impact of about 3 percent. Additional details on the sales volume results by region and business unit are included later in the presentation materials. Fourth Quarter Net Sales Volume Aggregate global sales volumes were down less than 1 percent in the fourth quarter of Excluding the unfavorable impact from the previously announced customer assortment changes in the U.S. architectural business, sales volume growth would have been slightly favorable to the prior year s fourth quarter. In the U.S. and Canada region, sales volumes were down by a low-single-digit percentage versus the prior year. Aerospace, automotive, and packaging coatings had above-market sales volume performance driven by customers continued adoption of PPG s technology advantaged products. Same store sales for architectural coatings company-owned stores increased by a low-single-digit percentage. Lower sales volumes in the U.S. and Canada architectural coatings national retail do-it-for-yourself (DIY) and independent dealer channels and the automotive refinish coatings business more than offset these gains. The general industrial coatings and marine coatings businesses had solid regional sales volume growth during the quarter. Sales volumes were higher in the Europe, Middle East, and Africa (EMEA) region. Strong sales volume growth in general industrial and aerospace was offset by lower sales volumes in the automotive OEM coatings business. Sales volumes grew a low-single-digit percentage in the architectural EMEA coatings business led by solid growth from the Northern and Eastern countries in the continent. Automotive builds in this region are forecasted to fall in the first quarter 2019 compared to the prior year quarter.

3 3 Industry demand was soft in China during the fourth quarter evidenced by the manufacturing PMI of less than 50 for the month of December. This contributed to sales volumes in Asia-Pacific being down by a low-single digit percentage year-over-year. Strong sales volumes in aerospace coatings and protective and marine coatings were offset by sharply lower volumes in automotive OEM coatings of about 15 percent. Industry auto production rates in China fell about the same amount during the fourth quarter compared to the prior year. In addition, general industrial and packaging coatings volumes fell a lowsingle-digit percentage as a result of the soft industrial production demand. From a country and subregion perspective, sales volumes grew in India, Australia, Korea, and Southeast Asia versus the prior year, but modestly decreased in China. Looking ahead, we expect regional sales volumes in automotive OEM and general industrial coatings to remain negative in the first quarter as industrial activity in China is anticipated to continue to be more volatile, partially due to the impact of global trade policies. Sales volumes expanded in Latin America by a low-single-digit percentage versus the prior year capping a solid year of growth from this region. Most of the businesses had aggregate growth in this region during the fourth quarter with strong results in the protective, packaging and automotive refinish coatings businesses. The architectural coatings business in Mexico grew organic sales by a mid-single-digit percentage despite difficult comparisons to the prior year period when there was a sharp increase in demand due to post earthquake activity. PPG Full-Year Net Sales PPG s full-year net sales totaled approximately $15.4 billion, up more than 4% compared to the prior year. Acquisition-related sales benefited net sales by nearly 1 percent with the largest contribution coming from the October 2017 acquisition of The Crown Group. Year-over-year sales volumes, excluding acquisition-related sales, grew nearly 1 percent, led by growth from emerging regions and Europe. From a business unit perspective, aerospace, protective, marine, general industrial, and packaging coatings provided the largest contributions to the overall sales volume gains. Foreign currency translation was modestly favorable to net sales year-over-year. Favorable currency translation impacts experienced in the first half of 2018 offset unfavorable impacts during the second half of the year. The company s largest foreign currency translation exposures remained the same as last year. In 2018, overall pricing for the company increased by more than 2 percent versus the prior year. The company s 2018 regional sales mix was largely consistent with prior-year results. Sales in the U.S. and Canada were about 42 percent, with sales in the U.S. representing slightly less than 40 percent of the total company revenues.

4 Performance Coatings Fourth quarter net sales for the Performance Coatings segment were about $2.1 billion, up 1 percent versus the prior year. Selling prices increased by nearly 3 percent. Segment sales volumes were flat compared to the prior year. Excluding the unfavorable impact from the previously announced customer assortment changes in the U.S. architectural business, sales volumes grew about 2 percent. Sales volume growth continued in emerging regions, which, in aggregate, grew by a mid-single-digit percentage consistent with the growth experienced in the third quarter Segment sales were negatively impacted by unfavorable foreign currency translation of about $55 million, or nearly 3 percent. Segment income was about $260 million, comparable to the fourth quarter Earnings were favorably impacted by higher selling prices and restructuring savings offset by lower sales volumes, raw material and logistics cost inflation, and unfavorable foreign currency translation. From a business unit perspective, automotive refinish coatings organic sales were flat year over year. Sales volumes were impacted by lower sales in the U.S. from continued customer inventory destocking, which is expected to be completed as of year-end, and we expect the business to return to growth in the first quarter. The automotive refinish business continues to grow as evidenced by a net addition of nearly 4,000 body shops in Aerospace coatings sales volumes grew by a low-teen-digit percentage for the second consecutive quarter, as strong industry demand continued and including above-market volume growth in every major region, supported by technology-advantaged products. Consistent with the prior quarter, aerospace sales grew across all major platforms. We expect continued strong performance in the first quarter albeit with growth rates slightly below the past two quarters as year-over-year comparisons become more challenging due to strong growth in the prior year. Year-over-year organic sales improved by a mid-single-digit percentage in architectural coatings EMEA. Solid volume growth in Northern and Eastern Europe was offset by lower volumes in Southern Europe. Overall, first quarter net sales are expected to be similar sequentially due to normal seasonal patterns with results remaining uneven by country. Focus remains on potential lower industry demand in the U.K. due to the potential for subdued consumer spending as a result of continued apprehension surrounding the BREXIT process. Architectural coatings Americas and Asia Pacific organic sales volumes were lower by a mid-single-digit percentage primarily driven by the customer assortment changes in the U.S. DIY channel. The U.S. and Canada company-owned store network grew organic sales by a low-single-digit percentage. Growth was more tepid than the fourth quarter due to a difficult comparison to the prior year. The Mexico-based PPG- Comex architectural coatings businesses grew organic sales by a mid-single-digit percentage as positive demand trends continued. The PPG-Comex business opened approximately 200 new concessionaire locations in 2018, bringing the total location count to over 4,600. Aggregate protective and marine coatings sales volumes increased by a high-single-digit percentage driven by strong protective coatings sales volumes in China and better marine coatings year-over-year off a low prior year sales base. Solid growth is expected to continue into

5 Full-year segment net sales were approximately $9.1 billion, increasing by about 4 percent, or $357 million year over year, including favorable foreign currency translation of about $75 million, or less than 1 percent. Net sales in local currencies improved by about 3 percent versus the prior year. Segment sales volumes were up approximately 1 percent, and acquisition-related sales added less than 1 percent. Looking ahead, year-over-year raw material cost inflation is expected in the first half of 2019, primarily due to carry-over inflation. Acquisition-related sales are forecasted to add about $15 million of sales growth primarily from the SEM acquisition. Based on current exchange rates, we expect foreign currency translation to have an unfavorable impact on segment sales of about $100 million. Additionally, further selling price increases in 2019 are expected as we work to continue to offset the cumulative impact of raw material inflation over the past nine quarters. Net sales in this segment are expected to be lower by approximately 200 to 250 basis points or $50 to $55 million in both the first and second quarters due to the customer assortment change that occurred in The impact will be larger than the fourth quarter due to the seasonality of the U.S. DIY business. Industrial Coatings Fourth quarter net sales for the Industrial Coatings segment were more than $1.5 billion, down about $50 million or nearly 3 percent year-over-year. Segment sales volumes were lower by nearly 2 percent, impacted by soft industry demand in China. Selling prices increased sequentially versus the third quarter 2018 and were up nearly 2 percent compared to prior year. This segment was impacted by unfavorable foreign currency translation of about $55 million, or nearly 4 percent. Segment income of about $185 million was down about $30 million, or about 15 percent year-over-year, including unfavorable foreign currency translation of approximately $5 million, primarily related to the Chinese yuan and the euro. Segment income benefited from improving selling prices and restructuring savings, which were more than offset by elevated raw material and logistics costs and lower sales volumes. From a business unit perspective, sales volumes were down a mid-single-digit percentage in the automotive OEM coatings business versus the prior year, which was consistent with the overall global industry auto build rate. PPG s sales volume grew in the U.S. and Canada region. Sales in Asia were lower compared to last year, primarily due to lower automotive production in China. Global automotive industry demand is expected to remain soft in the first quarter for most regions with greater volatility expected in China. General industrial coatings and specialty coatings and materials sales volumes were up a low-single-digit percentage in the fourth quarter. Sales volumes growth was the strongest in general industrial coatings Europe due to share gains. Sales volumes in China were impacted by lower coil, extrusion, and appliance end market demand. Selling prices continued to gain momentum. Similar to the third quarter, overall year-over-year growth in this business moderated, reflecting comparisons to strong growth in the previous year. We anticipate continued favorable general industrial demand growth trends, in aggregate, in the first quarter. In addition, we expect that the Whitford acquisition will close during the latter portion of the first quarter, pending required regulatory approvals, and therefore will not provide meaningful sales or earnings benefit in the quarter. 5

6 Packaging coatings sales volumes were up a low-single-digit percentage versus the prior year, as yearover-year growth moderated reflecting strong prior year gains and due to more modest customer adoption rates for new technologies. Sales volumes increased the most in the U.S. and Latin America. In the Asia Pacific region, sales volumes were slightly lower, impacted by slower industrial activity in China. We anticipate sales volume growth will continue to moderate due to more modest customer adoption rates for new technologies and the anniversary of prior-year customer conversions. Looking ahead, we expect that greater volatility in global industrial demand will continue through the first quarter with inconsistencies by region. The carryover impact from first half 2018 cost inflation and significantly unfavorable foreign currency translation will impact first quarter earnings. The company will continue to prioritize implementing selling price increases that were announced in the fourth quarter and operating margin recovery. Cash PPG ended the fourth quarter with about $1 billion in cash and short-term investments. Cash generated from continuing operations was more than $800 million in the fourth quarter, and totaled approximately $1.5 billion for the full year. Approximate uses of cash for the fourth quarter and full year were as follows: Capital expenditures were about $185 million in the quarter and approximately $410 million, or about 2.5 percent of sales, for the full year. We anticipate capital spending to be in the range of 2.5 -to- 3.0 percent of sales in Dividends paid were about $115 million in the fourth quarter and about $450 million for the full year. In October 2018, the company raised it is per share dividend by 7 percent. PPG has paid annual dividends for 119 consecutive years, including 47 consecutive years of increased annual payouts. Cash spending for acquisitions completed in 2018 was about $380 million. This included the acquisitions of SEM, PaintZen, Hodij, and ProCoatings. The announced acquisitions of Whitford and Hemmelrath are expected to be completed in PPG stock repurchases totaled over $400 million in the fourth quarter and about $1.7 billion for the year. The company has about $1.8 billion remaining under its current share repurchase authorizations as of year-end.


7 Financial Assumptions For 2019, the company is providing the following financial assumptions based on information currently known that will affect 2019 financial results: Acquisitions announced in 2018 and January 2019 are expected to add incremental 2019 sales of approximately $225 to- $275 million, including the flowthrough impact from acquisitions made in the 2018 calendar year until their respective acquisition anniversary date. The acquisitions will contribute at or below their respective segment margins as they are being fully integrated during Throughout 2018, a variety of major foreign currencies continued to weaken versus the U.S. dollar, accelerating in the second half of the year. As a result, based on recent exchange rates, the company expects that year-over-year foreign currency translation will unfavorably impact sales by $400 -to- $500 million, and pre-tax income by about $50 -to- $70 million, with significantly higher unfavorable impacts in the first half 2019 due to the timing of the underlying 2018 currency decreases. The company generally purchases raw materials, incurs manufacturing costs and sells finished products in the same currency, so it does not typically incur significant foreign currencyrelated transaction impacts. The company has two active business-restructuring programs in place targeting about $200 million in total run-rate annual savings once fully implemented. Execution against these programs is expected to result in $60 -to- $70 million of cost savings in 2019, which is in addition to the $80 million achieved in The company s 2019 effective tax rate on income from continuing operations is expected to be in the range of 23 -to- 25 percent. The comparable rate for 2018 was about 22 percent. The increase primarily relates to non-recurring favorable discrete items in 2018, including the release of reserves relating to statutory audits and one-time tax planning opportunities relating to the 2017 Tax Cuts and Jobs Act legislation. Other factors may affect the 2019 effective tax rate throughout the year, including changes to various tax regulations in the U.S. and abroad.
8 Full-Year Summary In summary for the full year, the company generated adjusted earnings per diluted share from continuing operations of $5.92, up slightly versus the prior year. Full-year net sales increased by more than 4 percent, growing in both the Performance Coatings and Industrial Coatings segments and in each major geographic region of the world on a constant currency basis. Sales volumes increased nearly 1 percent over the prior year, led by the Industrial Coatings segment. Acquisition-related sales added nearly 1 percent year-over-year growth, with the largest contribution coming from The Crown Group. The company continued to perform well operationally, including aggressive management of the overall cost structure. The company s selling, general, and administrative costs as a percentage of sales were about 90 basis points lower year-overyear. Strategically, business portfolio optimization continued, including the announcement of 6 acquisitions, which will further broaden the company s geographical footprint and technology advantages. The company continues to have excellent financial flexibility with cash and short-term investments of about $1.0 billion at year-end. 8
9 9
10 10 Forward-Looking Statements The Private Securities Litigation Reform Act of 1995 provides a safe harbor for forward-looking statements made by or on behalf of the company. This presentation contains forward-looking statements that reflect the company s current views with respect to future events and financial performance. You can identify forward-looking statements by the fact that they do not relate strictly to current or historic facts. Forward-looking statements are identified by the use of the words aim, believe, expect, anticipate, intend, estimate, project, outlook, forecast and other expressions that indicate future events and trends. Any forward-looking statement speaks only as of the date on which such statement is made, and the company undertakes no obligation to update any forward looking statement, whether as a result of new information, future events or otherwise. You are advised, however, to consult any further disclosures we make on related subjects in our reports to the Securities and Exchange Commission. Also, note the following cautionary statements: Many factors could cause actual results to differ materially from the company s forward-looking statements. Such factors include global economic conditions, increasing price and product competition by foreign and domestic competitors, fluctuations in cost and availability of raw materials, the ability to achieve selling price increases, the ability to recover margins, customer inventory levels, the ability to maintain favorable supplier relationships and arrangements, the timing of realization of anticipated cost savings from restructuring initiatives, the ability to identify additional cost savings opportunities, difficulties in integrating acquired businesses and achieving expected synergies therefrom, economic and political conditions in international markets, the ability to penetrate existing, developing and emerging foreign and domestic markets, foreign exchange rates and fluctuations in such rates, fluctuations in tax rates, the impact of future legislation, the impact of environmental regulations, unexpected business disruptions, the unpredictability of existing and possible future litigation, including asbestos litigation, and governmental investigations. Such factors also include risks related to the impact of the restatement disclosed in our amended 2017 Annual Report on Form 10-K/A, including the impact on PPG s reputation and commercial contracts, our ability to successfully remediate the material weakness in our internal control over financial reporting disclosed in our amended Annual Report on Form 10-K/A within the time periods and in the manner currently anticipated, the effectiveness of our internal control over financial reporting, including the identification of additional control deficiencies and further expenditures related to our restatement. However, it is not possible to predict or identify all such factors. Consequently, while the list of factors presented here and in our amended Annual Report on Form 10- K/A are considered representative, no such list should be considered to be a complete statement of all potential risks and uncertainties. Unlisted factors may present significant additional obstacles to the realization of forward-looking statements. Consequences of material differences in results compared with those anticipated in the forward-looking statements could include, among other things, lower sales or earnings, business disruption, operational problems, financial loss, legal liability to third parties and similar risks, any of which could have a material adverse effect on PPG s consolidated financial condition, results of operations or liquidity. All of this information speaks only as of January 17, 2019, and any distribution of this earnings brief after that date is not intended and will not be construed as updating or confirming such information. PPG undertakes no obligation to update any forward-looking statement, except as otherwise required by applicable law.
PPG Industries, Inc. First Quarter 2019 Financial Results Earnings Brief April 18, 2019
 PPG Industries, Inc. First Quarter 2019 Financial Results Earnings Brief April 18, 2019 First Quarter Financial Highlights PPG first quarter net sales from continuing operations were approximately $3.6
PPG Industries, Inc. Second Quarter 2018 Financial Results Earnings Brief July 19, 2018
 PPG Industries, Inc. Second Quarter 2018 Financial Results Earnings Brief July 19, 2018 Second Quarter Financial Highlights PPG second quarter net sales from continuing operations were approximately $4.1
PPG Industries, Inc. Fourth 2017 Financial Results Earnings Brief January 18, 2018
 PPG Industries, Inc. Fourth 2017 Financial Results Earnings Brief January 18, 2018 Fourth Quarter Financial Highlights PPG fourth quarter net sales from continuing operations were approximately $3.7 billion,
PPG Industries, Inc. Fourth 2016 Financial Results Earnings Brief January 19, 2017
 PPG Industries, Inc. Fourth 2016 Financial Results Earnings Brief January 19, 2017 Fourth Quarter Financial Highlights PPG fourth quarter net sales from continuing operations of $3.5 billion were down
PPG Industries, Inc. First 2018 Financial Results Earnings Brief April 19, 2018
 PPG Industries, Inc. First 2018 Financial Results Earnings Brief April 19, 2018 First Quarter Financial Highlights PPG first quarter net sales from continuing operations were approximately $3.8 billion,
Fourth Quarter 2018 Financial Results
 Fourth Quarter 2018 Financial Results Michael H. McGarry, Chairman and Chief Executive Officer Vincent J. Morales, Senior Vice President and Chief Financial Officer John Bruno, Director, Investor Relations
PPG Industries, Inc. Second Quarter 2017 Financial Results Earnings Brief July 20, 2017
 PPG Industries, Inc. Second Quarter 2017 Financial Results Earnings Brief July 20, 2017 Second Quarter Financial Highlights Net sales for the second quarter 2017 were $3.8 billion, increasing about 1 percent
PPG Industries, Inc. Third 2016 Financial Results Earnings Brief October 20, 2016
 PPG Industries, Inc. Third 2016 Financial Results Earnings Brief October 20, 2016 Third Quarter 2016 Financial Highlights PPG net sales for the third quarter 2016 were $3.8 billion, up almost 2 percent
PPG Industries, Inc. Second 2016 Financial Results Earnings Brief July 21, 2016
 PPG Industries, Inc. Second 2016 Financial Results Earnings Brief July 21, 2016 Second Quarter 2016 Financial Highlights PPG net sales for the second quarter 2016 were $4.1 billion, down less than one
First Quarter 2019 Financial Results
 First Quarter 2019 Financial Results Michael H. McGarry, Chairman and Chief Executive Officer Vincent J. Morales, Senior Vice President and Chief Financial Officer John Bruno, Director, Investor Relations
PPG Industries, Inc. Second Quarter 2015 Financial Results Earnings Brief July 16, 2015
 PPG Industries, Inc. Second Quarter 2015 Financial Results Earnings Brief July 16, 2015 Second Quarter Financial Highlights PPG net sales for the second quarter 2015 increased to $4.10 billion versus the
Third Quarter 2018 Financial Results
 Third Quarter 2018 Financial Results Michael H. McGarry, Chairman and Chief Executive Officer Vincent J. Morales, Senior Vice President and Chief Financial Officer John Bruno, Director, Investor Relations
PPG Industries, Inc. Third Quarter 2015 Financial Results Earnings Brief October 15, 2015
 PPG Industries, Inc. Third Quarter 2015 Financial Results Earnings Brief October 15, 2015 Third Quarter Financial Highlights PPG net sales for the third quarter of 2015 were $3.87 billion versus the prior
News. PPG reports fourth quarter and full-year 2018 financial results
 News PPG Media Contact: Mark Silvey Corporate Communications +1-412-434-3046 silvey@ppg.com PPG Investor Contact: John Bruno Investor Relations +1-412-434-3466 jbruno@ppg.com investor.ppg.com PPG reports
PPG Third Quarter 2017 Financial Results
 PPG Third Quarter 2017 Financial Results Michael H. McGarry, Chairman and Chief Executive Officer Vincent J. Morales, Senior Vice President and Chief Financial Officer John Bruno, Director Investor Relations
PPG Industries, Inc. Second Quarter 2014 Financial Results Earnings Brief July 17, 2014
 PPG Industries, Inc. Second Quarter 2014 Financial Results Earnings Brief July 17, 2014 Second Quarter Financial Summary PPG net sales from continuing operations for the second quarter increased to $4.1
PPG Fourth Quarter and Full Year 2017 Financial Results
 PPG Fourth Quarter and Full Year 2017 Financial Results Michael H. McGarry, Chairman and Chief Executive Officer Vincent J. Morales, Senior Vice President and Chief Financial Officer John Bruno, Director,
News. PPG reports second quarter 2016 financial results
 News PPG Media Contact: Mark Silvey Corporate Communications +1-412-434-3046 silvey@ppg.com PPG Investor Contact: Scott Minder Investor Relations +1-412-434-3466 sminder@ppg.com www.ppg.com/investor PPG
PPG. Protecting and. Michael Beautifying H. McGarry the World Chairman and Chief Executive Officer. New York Nov. 28, 2017
 PPG Protecting and Michael Beautifying H. McGarry the World Chairman and Chief Executive Officer Citi Michael Basic Materials H. McGarry Conference New York Nov. 28, 2017 Forward Looking Statements The
PPG Frank S. Sklarsky Executive Vice President and Chief Financial Officer
 PPG Frank S. Sklarsky Executive Vice President and Chief Financial Officer Bank of America s 2016 Agriculture & Chemicals Conference Fort Lauderdale, FL Information current as of March 1, 2016 Forward
Q Earnings. October 31, 2018
 Q4 2018 Earnings October 31, 2018 Forward-Looking Statements and Non-GAAP Financial Measures Forward-Looking Statements This presentation contains certain forward-looking statements within the meaning
FRANKLIN ELECTRIC REPORTS 2010 EARNINGS PER SHARE INCREASED 48 PERCENT FROM 2009
 For Immediate Release For Further Information Refer to: John J. Haines 260-824-2900 FRANKLIN ELECTRIC REPORTS 2010 EARNINGS PER SHARE INCREASED 48 PERCENT FROM 2009 Bluffton, Indiana February 28, 2011
David Navikas Vice President and Controller
 David Navikas Vice President and Controller PPG Industries, Inc. New York City May 18, 2007 Forward-Looking Statement Statements contained herein relating to matters that are not historical facts are forward-looking
USANA Health Sciences, Inc. Q Management Commentary, Results and Outlook
 USANA Health Sciences, Inc. Q2 2017 Management Commentary, Results and Outlook July 25, 2017 9.69% Second to quarter 479,000 net sales were $257.1 million, a decrease of 0.6% year-over-year, but up 2.3%
Our results at a glance
 Report for the first quarter 2014 AkzoNobel I Report for the first quarter 2014 2 AkzoNobel around the world Revenue by destination (44 percent in high growth markets) A North America B Emerging Europe
2017 First Quarter Business Review
 2017 First Quarter Business Review (Unaudited) April 25, 2017 1 Earnings Conference Calls Q2: July 25, 2017 Q3: October 24, 2017 2018 Outlook Meeting December 12, 2017 2 Upcoming 2017 investor events European
Q Earnings. July 26, 2017
 Q3 2017 Earnings July 26, 2017 Forward-Looking Statements and Non-GAAP Measures Forward-Looking Statements This presentation contains certain forward-looking statements within the meaning of the U.S. Private
2017 Third Quarter Business Review
 2017 Third Quarter Business Review (Unaudited) October 24, 2017 1 Earnings Conference Calls Q4: January 25, 2018 2018 Outlook Meeting December 12, 2017 8:00 a.m. - 12:00 p.m. EST 2 Forward looking statement
Q Earnings Call. April 24, 2013
 Q2 2013 Earnings Call April 24, 2013 Forward-Looking Statements and Non-GAAP Measures Forward-Looking Statements -- This presentation contains certain forward-looking statements within the meaning of the
Net income to common stockholders improved $1.4 billion Y-O-Y to a Q3 record of $2.8 billion.
 1 2 3 Q3 global deliveries up 0.1 million units Y-O-Y, a 4% increase. Volume gains primarily in China, offset by reductions in other International Operations. Q3 market share is down 40 bps Y-O-Y, driven
Q Earnings. July 20, 2016
 Q3 2016 Earnings July 20, 2016 Forward-Looking Statements and Non-GAAP Measures Forward-Looking Statements This presentation contains certain forward-looking statements within the meaning of the U.S. Private
Webcast. Fourth Quarter Fiscal Year 2016 Results. Quarter ended February 26, 2016
 Webcast Fourth Quarter Fiscal Year Results Quarter ended February 26, Forward-looking statements From time to time, in written and oral statements, the company discusses its expectations regarding future
Second Quarter 2014 Earnings Call July 30, Ilene Gordon, Chairman and CEO Jack Fortnum, Chief Financial Officer
 Second Quarter 2014 Earnings Call July 30, 2014 Ilene Gordon, Chairman and CEO Jack Fortnum, Chief Financial Officer Forward-Looking Statements This presentation contains or may contain forward-looking
3 rd Quarter 2018 Earnings Conference Call. October 25, 2018
 3 rd Quarter 2018 Earnings Conference Call October 25, 2018 Safe Harbor Today s presentation includes forward-looking statements that reflect management s current expectations about the Company s future
2017 THIRD-QUARTER EARNINGS REVIEW October 24, 2017
 2017 THIRD-QUARTER EARNINGS REVIEW October 24, 2017 CAUTIONARY STATEMENT This presentation contains forward-looking statements about Whirlpool Corporation and its consolidated subsidiaries ( Whirlpool
2Q 2017 Highlights and Operating Results
 2Q 2017 Highlights and Operating Results July 25, 2017 1 2Q 2017 Highlights and Operating Results Table of Contents Page(s) 1 Sales Overview and Highlights 4-5 2 NSS Overview 6-7 3 EES Overview 8-9 4 UPS
Thank you, good morning everyone and welcome to our fourth quarter 2014 business review.
 Q4 2014 Earnings Call Transcript Inge Thulin & Nicholas Gangestad January 27, 2015 Slide 1, Opening Matt Ginter, Vice President, Investor Relations Thank you, good morning everyone and welcome to our fourth
Third Quarter 2017 Earnings Results
 POLARIS INDUSTRIES INC. Third Quarter 2017 Earnings Results October 24, 2017 SAFE HARBOR & NON-GAAP MEASURES Except for historical information contained herein, the matters set forth in this presentation,
Q4 & Full Year 2017 Financial Results
 Exhibit 99.2 Q4 & Full Year 2017 Financial Results February 6, 2018 Legal Notices Forward-Looking Statements This presentation and the oral remarks made in connection herewith may contain forward-looking
THIRD QUARTER REPORT Period Ended September 30, Management s Discussion and Analysis and Unaudited Consolidated Financial Statements
 THIRD QUARTER REPORT Period Ended 2010 Management s Discussion and Analysis and Unaudited Consolidated Financial Statements MANAGEMENT S DISCUSSION AND ANALYSIS This management s discussion and analysis
XYLEM INC. Q EARNINGS RELEASE FEBRUARY 1, 2018
 XYLEM INC. Q4 2017 EARNINGS RELEASE FEBRUARY 1, 2018 Q4 2017 EARNINGS RELEASE FORWARD-LOOKING STATEMENTS This presentation contains information that may constitute forward-looking statements. Forward-looking
4Q 2018 Highlights and Operating Results. Products. Technology. Services. Delivered Globally.
 4Q 2018 Highlights and Operating Results Products. Technology. Services. Delivered Globally. Table of Contents Page 3 Safe Harbor Statement and Non-GAAP Financial Measures 4 Sales Overview 9 Overview of
USANA Health Sciences, Inc. Q Management Commentary, Results and Outlook
 USANA Health Sciences, Inc. Q1 2017 Management Commentary, Results and Outlook May 3, 2017 9.69% First quarter to 479,000 net sales increased 6.2% to $255.3 million, up 8.8% in constant currency Number
3Q 2018 Highlights and Operating Results. Products. Technology. Services. Delivered Globally.
 3Q 2018 Highlights and Operating Results Products. Technology. Services. Delivered Globally. Table of Contents Page 3 Safe Harbor Statement and Non-GAAP Financial Measures 4 Sales Overview 9 Overview of
Financial Information
 Financial Information H1 revenues reached 12.8bn up 9.8%, flat org. in Q2 Adj. EBITA reached 1.6bn, up 6.4%, Adj. EBITA margin flat excl. Invensys in a challenging environment 2015 targets: Around flat
Thank you and good morning everyone. Welcome to our third quarter 2017 business review.
 Q3 2017 Earnings Call Transcript Inge Thulin & Nicholas Gangestad October 24, 2017 Slide 1, Opening Bruce Jermeland, Director of Investor Relations Thank you and good morning everyone. Welcome to our third
Axalta Releases Fourth Quarter and Full Year 2016 Results
 NEWS RELEASE Axalta Releases Fourth Quarter and Full Year 2016 Results 2/8/2017 Fourth Quarter 2016 Highlights: Net sales of $1,029.4 million driven by volume and pricing growth of 5.6%, offset by unfavorable
July 28, 2016 Conference Call Slide Presentation HARLEY-DAVIDSON, INC SECOND QUARTER UPDATE
 HARLEY-DAVIDSON, INC. 2016 SECOND QUARTER UPDATE JULY 28, 2016 2016 SECOND QUARTER UPDATE THIS PRESENTATION SUPPORTS THE AUDIO CONFERENCE CALL CONFERENCE CALL PARTICIPANTS Introduction Business Perspectives
Q Earnings. January 23, 2019
 Q1 2019 Earnings January 23, 2019 Forward-Looking Statements and Non-GAAP Financial Measures Forward-Looking Statements This presentation contains certain forward-looking statements within the meaning
Earnings Call Presentation
 Exhibit 99.2 February 27, 2017 Earnings Call Presentation 4 th Quarter 2016 Safe Harbor Statement 2 Our disclosures in this presentation, including without limitation, those relating to future financial
4 th Quarter 2018 Earnings Conference Call. January 29, 2019
 4 th Quarter 2018 Earnings Conference Call January 29, 2019 Safe Harbor Today s presentation includes forward-looking statements that reflect management s current expectations about the Company s future
Q Earnings. April 20, 2016
 Q2 2016 Earnings April 20, 2016 Forward-Looking Statements and Non-GAAP Measures Forward-Looking Statements This presentation contains certain forward-looking statements within the meaning of the U.S.
Sanford Bernstein Conference Rockwell Automation
 Sanford Bernstein Conference Rockwell Automation Keith D. Nosbusch Chairman and CEO May 31, 2013 Rev 5058-CO900D Safe Harbor Statement This presentation contains statements (including certain projections
Q Earnings. November 2, 2016
 Q4 2016 Earnings November 2, 2016 Forward-Looking Statements and Non-GAAP Measures Forward-Looking Statements This presentation contains certain forward-looking statements within the meaning of the U.S.
Earnings/News Release
 Earnings/News Release Avon Reports Fourth-Quarter and 2008 Results Fourth-Quarter Earnings Per Share Up 80% to $.54 Fourth-Quarter Total Revenue of $2.8 Billion 9% Lower; Up 2% on Local-Currency Basis
USANA Health Sciences, Inc. Q Management Commentary, Results and Outlook. First quarter EPS increased 18.0% to $1.77
 USANA Health Sciences, Inc. Q1 2016 Management Commentary, Results and Outlook First quarter net sales increased 9.6% to $240.4 million, up 16.1% based on constant currency First quarter EPS increased
CommScope Reports Fourth Quarter and Full Year 2018 Results
 CommScope Reports Fourth Quarter and Full Year 2018 Results February 21, 2019 Fourth Quarter 2018 Performance Sales of $1.06 billion GAAP operating income of $49 million Non-GAAP adjusted operating income
3M Reports Fourth-Quarter and Full-Year 2016 Results
 3M Reports Fourth-Quarter and Full-Year 2016 Results Fourth-Quarter Highlights: Sales of $7.3 billion, up 0.4 percent; organic local-currency increased 1.6 percent GAAP EPS of $1.88, up 13.3 percent year-on-year
Third Quarter Fiscal February 1, :00 am CDT
 Third Quarter Fiscal 2019 February 1, 2019 8:00 am CDT Forward-Looking Statements This presentation contains statements, including information about future financial performance and market conditions,
Axalta Coating Systems Ltd.
 Q1 2015 Conference Call May 6, 2015 Notice Regarding Forward Looking Statements, Non-GAAP Financial Measures and Defined Terms Forward-Looking Statements This presentation and the oral remarks made in
FOURTH-QUARTER 2017 EARNINGS REVIEW January 25, 2018
 FOURTH-QUARTER 2017 EARNINGS REVIEW January 25, 2018 GLOBAL OVERVIEW INSERT PHOTO HERE Marc Bitzer Chief Executive Officer 2 2017 FOURTH-QUARTER HIGHLIGHTS Ongoing EPS of $4.10 in Q4 and $13.74 for the
2016 THIRD-QUARTER EARNINGS REVIEW October 25, 2016
 2016 THIRD-QUARTER EARNINGS REVIEW October 25, 2016 0 THIRD-QUARTER EARNINGS PRESENTATION WHIRLPOOL CORPORATION ADDITIONAL INFORMATION This presentation contains forward-looking statements about Whirlpool
GENERAL MILLS REPORTS STRONG FISCAL 2019 THIRD-QUARTER RESULTS AND UPDATES FULL-YEAR GUIDANCE
 News/Information FOR IMMEDIATE RELEASE Investor Relations P. O. Box 1113 Minneapolis, MN 55440 March 20, Contact: (analysts) Jeff Siemon: 763-764-2301 (media) Rob Litt: 763-764-6364 GENERAL MILLS REPORTS
First Quarter 2015 Earnings Conference Call
 Earnings Conference Call February 3, 2015 Safe Harbor Statement Our commentary and responses to your questions may contain forward-looking statements, including our outlook for the remainder of the year,
Q Earnings. October 28, 2015
 Q4 2015 Earnings October 28, 2015 Forward-Looking Statements and Non-GAAP Measures Forward-Looking Statements This presentation contains certain forward-looking statements within the meaning of the U.S.
901 S. Central Expressway, Richardson, TX 75080
 901 S. Central Expressway, Richardson, TX 75080 FOSSIL GROUP REPORTS THIRD QUARTER RESULTS Net Sales Increase 18% to $810 Million Diluted EPS Increases 25% to $1.58 Maintains Full Year EPS Guidance and
Ecolab Acquisition of Champion
 Ecolab Acquisition of Champion Strengthening opportunities and positions in the fast-growing energy services markets October 12, 2012 1 Cautionary Statement Cautionary Statements Regarding Forward-Looking
Fourth Quarter & Full Year 2016 Earnings Results
 POLARIS INDUSTRIES INC. Fourth Quarter & Full Year 2016 Earnings Results January 24, 2017 Richard Edwards Director of Investor Relations POLARIS INDUSTRIES INC. Fourth Quarter & Full Year 2016 Earnings
Eastman Announces Fourth-Quarter and Full-Year 2018 Financial Results
 Eastman Announces Fourth-Quarter and Full-Year 2018 Financial Results KINGSPORT, Tenn., Jan. 31, 2019 Eastman Chemical Company (NYSE:EMN) announced its fourth-quarter and full-year 2018 financial results.
901 S. Central Expressway, Richardson, TX 75080
 901 S. Central Expressway, Richardson, TX 75080 FOSSIL GROUP REPORTS RECORD SECOND QUARTER RESULTS Net Sales Increase 11% to a Record $706 Million EPS Increases 25% to a Record $1.15 Provides Third Quarter
Third Quarter Report Period Ended September 30, Management s Discussion and Analysis and Unaudited Consolidated Financial Statements
 Third Quarter Report Period Ended September 30, 2017 Management s Discussion and Analysis and Unaudited Consolidated Financial Statements Management s Discussion and Analysis This management s discussion
14375 NW Science Park Drive Portland, OR April 29, 2014
 14375 NW Science Park Drive Portland, OR 97229 April 29, 2014 CFO Commentary on First Quarter 2014 Financial Results, Upward-Revised 2014 Pre-Acquisition Financial Outlook, and Agreement to Purchase prana
Second Quarter Review. 25 / April / 2014
 Second Quarter Review 25 / April / 2014 Forward-Looking Statements / Safe Harbor This presentation contains a number of forward-looking statements. In many cases forward-looking statements are identified
Q Financial Results. October 25, 2018
 Q3 2018 Financial Results October 25, 2018 Legal Notices Forward-Looking Statements This presentation and the oral remarks made in connection herewith may contain forward-looking statements within the
Q Financial Results. July 26, 2018
 Q2 2018 Financial Results July 26, 2018 Legal Notices Forward-Looking Statements This presentation and the oral remarks made in connection herewith may contain forward-looking statements within the meaning
1 st Quarter 2018 Earnings Conference Call. April 26, 2018
 1 st Quarter 2018 Earnings Conference Call April 26, 2018 Safe Harbor Today s presentation includes forward-looking statements that reflect management s current expectations about the Company s future
A X A L T A C O A T I N G S Y S T E M S. Q4 & FULL YEAR 2016 FINANCIAL RESULTS February 8 th, 2017
 A X A L T A C O A T I N G S Y S T E M S Q4 & FULL YEAR 2016 FINANCIAL RESULTS February 8 th, 2017 Legal Notices Forward-Looking Statements This presentation and the oral remarks made in connection herewith
ITT reports 2017 fourth-quarter and full-year results, 2018 guidance
 ITT Inc. 1133 Westchester Ave. White Plains, NY 10604 tel 914 641 2000 Press Release ITT reports 2017 fourth-quarter and full-year results, 2018 guidance 2017 Full-Year Results: Revenue up 8% to $2.6 billion,
Contact: Michael DeVeau VP, Corporate Strategy, Investor Relations & Communications
 FOR IMMEDIATE RELEASE Contact: Michael DeVeau VP, Corporate Strategy, Investor Relations & Communications 212.708.7164 Michael.DeVeau@iff.com IFF Reports Second Quarter 2018 Results Achieved strong first
Second-Quarter Earnings Review
 Second-Quarter 2018 Earnings Review GLOBAL OVERVIEW Marc Bitzer President and Chief Executive Officer 2 2018 SECOND-QUARTER HIGHLIGHTS Ongoing EBIT margin expansion despite challenging cost environment
First Quarter 2018 Conference Call. April 25, 2018
 First Quarter 2018 Conference Call April 25, 2018 Forward-Looking Statements Certain information contained in this presentation constitutes forward-looking statements for purposes of the safe harbor provisions
Herman Miller, Inc. Second Quarter Fiscal 2017 Investor Conference Call December 22, 2016
 Herman Miller, Inc. Second Quarter Fiscal 2017 Investor Conference Call December 22, 2016 The following document is a replication of the notes used in Herman Miller, Inc. s Second Quarter Fiscal 2017 conference
Bank of America Merrill Lynch 2015 Paper, Packaging and Builders Conference Owens-Illinois, Inc. December 10, 2015
 Bank of America Merrill Lynch 2015 Paper, Packaging and Builders Conference Owens-Illinois, Inc. December 10, 2015 Safe harbor comments Regulation G The information presented here regarding adjusted net
XYLEM INC. Q EARNINGS RELEASE OCTOBER 30, 2018
 XYLEM INC. Q3 2018 EARNINGS RELEASE OCTOBER 30, 2018 Q3 2018 EARNINGS RELEASE FORWARD-LOOKING STATEMENTS This presentation contains information that may constitute forward-looking statements. within the
Earnings Release. Q Results October 20, 2017
 Earnings Release Q1 2018 Results October 20, 2017 1 Business Results Q1 FY 2018 2 First Quarter 2018 Organic Sales Growth Organic Volume Growth Core EPS Growth Free Cash Flow Productivity Q1 18 +1% +1%
DuPont Segment Commentary
 This data should be read in conjunction with the Company s third quarter earnings news release dated October 22, and DuPont s 3Q Earnings Conference Call presentation materials posted on the Investor Center
A X A L T A C O A T I N G S Y S T E M S. Q FINANCIAL RESULTS October 27, 2016
 A X A L T A C O A T I N G S Y S T E M S Q3 2016 FINANCIAL RESULTS October 27, 2016 Legal Notices Forward-Looking Statements This presentation and the oral remarks made in connection herewith may contain
1Q 2018 Highlights and Operating Results
 1Q 2018 Highlights and Operating Results April 26, 2018 1 Table of Contents Page(s) 4 Announced Agreements to Acquire Australia and New Zealand Security Businesses 5-9 Sales Overview 10-17 Financial Performance
4Q 2017 Highlights and Operating Results
 4Q 2017 Highlights and Operating Results January 30, 2018 1 4Q 2017 Highlights and Operating Results Table of Contents Page(s) 1 Sales Overview 4-8 2 Financial Performance Trends 9-16 3 Leverage Metrics
Allegion Fourth-Quarter 2017 Results. February 20, 2018
 Allegion Fourth-Quarter 2017 Results February 20, 2018 Safe Harbor This presentation contains "forward-looking statements" within the meaning of the Private Securities Litigation Reform Act of 1995, including
Fiscal Year 2016 Fourth Quarter Conference Call
 Fiscal Year 2016 Fourth Quarter Conference Call November 7, 2016 2 Safe Harbor Statement This presentation includes statements related to the expected future results of the company and are therefore forward-looking
Kimberly-Clark Announces Year-End 2018 Results and 2019 Outlook and Introduces K-C Strategy 2022
 Kimberly-Clark Announces Year-End 2018 Results and 2019 Outlook and Introduces K-C Strategy 2022 January 23, 2019 DALLAS, Jan. 23, 2019 /PRNewswire/ -- Kimberly-Clark Corporation (NYSE: KMB) today reported
First Quarter 2018 May 3, 2018
 First Quarter 2018 May 3, 2018 Safe Harbor Please note that in this presentation, we may discuss events or results that have not yet occurred or been realized, commonly referred to as forward-looking statements.
Q Earnings. April 26, 2017
 Q2 2017 Earnings April 26, 2017 Forward-Looking Statements and Non-GAAP Measures Forward-Looking Statements This presentation contains certain forward-looking statements within the meaning of the U.S.
FOR IMMEDIATE RELEASE FEBRUARY 28, 2018 SYKES ENTERPRISES, INCORPORATED REPORTS FOURTH QUARTER AND FULL YEAR 2017 FINANCIAL RESULTS
 News Release news release FOR IMMEDIATE RELEASE FEBRUARY 28, 2018 SYKES ENTERPRISES, INCORPORATED REPORTS FOURTH QUARTER AND FULL YEAR 2017 FINANCIAL RESULTS --Higher overall demand drives strong underlying
Financial Information
 Accelerating & profit in H1: Revenue up +4% reported, Adj. EBITA +8%, Net Income +18%, FCF +15% H1 revenue of 12.2bn, +2.7% organic, +4.1% outside Infrastructure H1 adj. EBITA margin up 60bps 1 org., to
October 22, 2013 Media Contact: Patty Seif WILMINGTON, Del Investor Contact:
 October 22, 2013 Media Contact: Patty Seif WILMINGTON, Del. 302-774-4482 patricia.r.seif@dupont.com Investor Contact: 302-774-4994 DuPont Delivers 3Q 2013 Operating Earnings of $.45 per Share Sales Increase
Brunswick Earnings Conference Call Q3, 2018
 Brunswick Earnings Conference Call Q3, 2018 Forward-Looking Statements Certain statements in this presentation are forward-looking as defined in the Private Securities Litigation Reform Act of 1995. Forward-looking
AGCO Reports Third Quarter Results
 Oct 30, 2018, 7:45:00 AM AGCO Reports Third Quarter Results AGCO, Your Agriculture Company (NYSE:AGCO), a worldwide manufacturer distributor of agricultural equipment solutions, reported net sales of approximately
Gardner Denver Reports Strong Second Quarter 2018 Results and Raises Full Year 2018 Adjusted EBITDA Midpoint Guidance
 August 1, 2018 Gardner Denver Reports Strong Second Quarter 2018 Results and Raises Full Year 2018 Adjusted EBITDA Midpoint Guidance Revenues of $668.2 million increased 15% over the prior year, supported