Cornerstone Investors on the Swedish IPO Market Salvation or Damnation?
|
|
|
- Joseph Hunt
- 5 years ago
- Views:
Transcription

1 Cornerstone Investors on the Swedish IPO Market Salvation or Damnation? An event study on underpricing, aftermarket performance and effects of cornerstone investors By Jonathan Engman and Markus Levéen Pehrson Spring 2017 Master s Programme in Accounting & Finance Corporate Financial Management Supervisor: Maria Gårdängen Examiner: Niclas Andrén
2 Abstract Title: The effect of cornerstone investors on the Swedish IPO market - An event study on underpricing, aftermarket performance and effects of cornerstone investors Seminar date: Course: BUSN79: Degree Project in Accounting and Finance: Corporate Financial Management, Master level, 15 ECTS Authors: Jonathan Engman & Markus Levéen Pehrson Supervisor: Maria Gårdängen Purpose: The primary goal of this paper is to investigate cornerstone investor effect on underpricing and aftermarket performance in Swedish IPOs. By collecting an original and meticulous data set, the study examines underpricing, measured as first day returns, and aftermarket performance, measured in abnormal returns, one week to six months post-ipo. The ambition with this thesis is to contribute with augmenting research to the limited and scarce literature related to the new cornerstone investor phenomenon. Observed results will be subject to statistical tests to increase validity and reliability, which then will enable the study to conclude on any new findings related to initial public offerings. Methodology: An event study has been conducted on Swedish IPOs from To solve for concerns of cross-sectional dependence between data sets, this paper conducts parametric tests that enable the hypotheses to be statistically tested. Theoretical perspective: Due to the frequent usage in previous IPO and M&A literature, this thesis is based on signaling theory, information asymmetry and principal-agent theory. Information asymmetry suggests that there is a difference of valuable information held by management and the market. According to the signaling theory, announcements made by companies send signals to the market, to which investors then react. The principal-agent theory claims that there is a real demand for investment banking services as they are assumed to have more information about investor demand. Conclusion: Results observed confirm that underpricing exist on the Swedish market. As for positive aftermarket performance, it is observed on all time horizons if an allocation is given on the first day of trading (FDOT). If the investment occurs on FDOT+1, then positive abnormal returns are observed on a three to six-month time horizon. Looking at the effect of cornerstone investors, we find a positive correlation with underpricing and aftermarket performance on all time horizons given allocation on FDOT. If investing on FDOT+1, cornerstone investors show no correlation with underpricing or aftermarket performance but the percent of company sold affect abnormal returns on a three-month time horizon. We wish to thank our tutor, Assistant Professor Maria Gårdängen for the valuable comments and guidelines throughout the thesis writing process. Also, we wish to thank Tony Elofsson and Mathias Jensen-Vinstrup from Carnegie Investment Bank in Stockholm for the valuable input on cornerstone transactions on the Swedish IPO market.
3 Table of Contents 1. Introduction Background Problem Discussion Research Questions Research Contributions Scope and Limitations Thesis Structure Institutional Reference Frame The IPO Process The Prospectus Cornerstone Investors Literature Review Introduction to the Literature Review Underpricing Information Asymmetry Winner s Curse Signaling Theory Cornerstone Investor Principal-Agent Theory Post-IPO Performance Conclusions and Presentation of Hypotheses Method Introduction to the Methodology Chapter Underpricing Post-IPO Performance Time Regimes Measuring Post-IPO Performance Benchmark Statistical Tests Statistical Tests for Underpricing Statistical Tests for Post-IPO Performance Data Introduction Selection of Data Methodology of Data Collection Simplifications of the Data Set Qualitative Data Limitations of the Data Set Results Underpricing Post-IPO Performance Effects of Cornerstone Investors, Market Cap
4 and Percent of Company Sold Analysis Underpricing Post-IPO Performance Effect of Cornerstone Investors, Market Cap and Percent of Company Sold Underpricing Post-IPO Performance Percent of Company Sold Conclusions Implications Suggestions for Further Research References Appendixes List of Tables List of Figures 70 List of Illustrations Illustration 1. A Descriptive Picture of an IPO Process 13 Illustration 2. The Calendar time and Event time Approach 28
5 1. Introduction 1.1 Background This paper targets the most recent economic cycle and initial public offerings (IPOs) on the Swedish market. By doing so, the paper aims to research and explain the development of the IPO procedure. Features that are related to the procedure, and thus highlighted in this thesis, are underpricing, aftermarket performance and cornerstone investors. IPOs have been discussed and debated by academicians, professionals and the society as a whole. One of the primary reasons for this is IPOs ability to measure how hot financial markets are since more companies tend to go public when market valuation is high. There are several anomalies related to IPOs, such as underpricing, post-ipo performance and the cyclicality of IPOs. These topics have previously been covered by researchers, and despite consensus in the existence of underpricing, explanations for it differ, ranging from signaling (Rock, 1986) to change in the cost of capital (Guo 2011). As for aftermarket performance, early studies by Loughran & Ritter (1995) presents evidence that IPOs are outperformed by the market in the long term while more recent studies made by Ahmad-Zaluki et al. (2007) and Thomadakis et al. (2012) present evidence that new issues outperform the market. With regards to cornerstone investors, the number of studies investigating the effects on underpricing and aftermarket performance are limited. One major reason for this is that cornerstone investors are a relatively new phenomenon that occurred for the first time in Europe in 2011 and Sweden in After the first cornerstone transaction took place in Sweden, there has been a rapid shift in the use of cornerstone investors in Sweden, and today it is widespread among IPO transactions on Nasdaq OMX. This change is interesting, and thus the goal of this thesis is to examine how the use of cornerstone investors affects underpricing and aftermarket performance in Swedish IPOs. Doing this will contribute to valuable research and insights to investors (retail, institutional and potential cornerstone investors), owners and underwriters on a highly important phenomenon impacting Swedish IPOs today. By focusing on the recent changes within the Swedish IPO sector, we can examine how the different type of investors should act and also on which time horizons that particular investment decisions are especially interesting given the differences in abnormal returns for various time periods. Furthermore, owners and underwriters are provided with
6 valuable information as to whether using cornerstone investors is an economically sound decision, and thus legitimates, the use of cornerstone investors in IPOs. 1.2 Problem Discussion IPOs are often described as an expensive and time-consuming process for issuing firms. Based on the findings by Affleck-Graves (1996), stating that future stock price development is dependent on strong initial stock price momentum, it is crucial for companies to get positive exposure to the market and create a good aura surrounding the issue. Risks associated with IPOs include the risk of weak investor demand and negative stock price development on the first day of trading (Berk & DeMarzo, 2014). One explanation to why companies face these risks is the information asymmetry between firms and the market, causing uncertainty to go up and valuation to go down (Rock, 1986; Cohen and Dean, 2005). As a result of these risks, IPOs tend to be underpriced, leading to positive returns on the first day of trading (Loughran et al., 1994). The level of underpricing is generally associated with the risk level as more risk leads to more underpricing, which is a trade-off that firm owners have to face when considering going public. On the one hand, they want to get paid as much as possible, but on the contrary, they also want to minimize the risk of having a disatrous IPO that will harm both firm value and reputation. This risk has resulted in the rise of cornerstone investors, which is a phenomenon that started in Asia and has since inception continued to spread over the world. Despite no legal definition, cornerstone investors refer to institutional investors that commit to purchase a significant portion of shares pre-ipo and hold these shares for a predetermined period, a so-called lock-up. cornerstone investors benefit by getting large allocations and issuing firms profit from selling a significant portion of shares and the possibility of using cornerstone investors as marketing material to certify the quality of the deal, believed to increase investor trust and the chance of a successful offering (Chee Keong, 2009). This is confirmed by the findings of (Allen and Faulhaber, 1989), stating that cornerstone investors are a way to mitigate risks associated with IPOs since they lower information asymmetry and signal good quality. Despite a solid logic for using cornerstone investors, there is still a very limited amount of academic studies on this topic, especially in Sweden. Therefore, this study aims to investigate the effects of using cornerstone investors on the Swedish market, with regards to both underpricing and aftermarket performance, ranging up to six months of trading, since this is
7 when the majority of lock-ups for cornerstone investors expire. This study focuses on the Swedish market due to several reasons. One reason is the country s very high IPO activity (Bloomberg, 2017). Furthermore, the cornerstone investor phenomenon has grown strong on the Swedish market compared to many other financial markets where the normalization of cornerstone investors has not reached out to the same extent. One could argue that a study like this could be performed in the entire Scandinavian market instead. However, this is not possible since it would make the data incomparable due to the differences in cornerstone usage as well as the frequency of new listings for each country within Scandinavia (Bloomberg, 2017). McGuiness (2014) performed a study on the Hong Kong stock exchange and found results indicating that stocks that used cornerstone investors generated higher returns. Whether a similar relationship exists on the Swedish market is interesting to investigate. Since this phenomenon is relatively new, the number of cornerstone compatible observations will be limited. However, due to the large number of IPOs during , the increased popularity of cornerstone investors and practical relevance, we consider the upside of investigating the potential effects of cornerstone investors in Swedish IPOs to be larger than the downside of having a limited data set. Furthermore, by conducting research on this phenomenon, this thesis might potentially untangle new concepts relevant to IPO performance and whether investing in cornerstone backed IPOs is a good investment strategy. 1.3 Research Questions Previous studies covering underpricing have been conducted in numerous markets. The first studies were published by Logue (1973) and Ibbotson (1975). Westerholm (2006) also examined whether underpricing exists on the Nordic market, and concluded that IPOs, on average, between were underpriced by approximately 17%. Worth mentioning, however, is that the data used in Westerholm s study is collected during the period leading up to the IT-bubble, which questions whether if this still holds for the current market conditions. Furthermore, the relevance of cornerstones is relatively unexplored. When McGuiness (2012) conducted research regarding underpricing and cornerstone investors on the Chinese market, he found little evidence of underpricing in cornerstone-backed transactions. Interestingly though, McGuiness (2014) found evidence supporting that cornerstone backed IPOs had positive abnormal returns in the aftermarket. The empirical evidence obtained by McGuiness
8 (2014) is consistent with signaling and certification theory conducted by Megginson and Weiss (1991). However, it somewhat contradicted his previous research in Hence, this thesis will investigate whether underpricing still can be confirmed on Swedish market and test if IPO participation can be used as a successful investment strategy on a short to mediumterm time horizon. To make this study as useful and meaningful as possible, this study groups the observations into the three various market caps small, mid and large cap. This is due to the different characteristics that each of the different market caps has. This decision is in line with Leleux and Muzyka (1997) who highlight complications that small cap firms can suffer from. Two of the main complications are seen as the limited size, which constrains the number of available institutional investors that can invest in the firm, as well as the differences in the level of attention that a small or medium cap firm receives compared to large cap firms. A large cap firm is most certainly covered by more analysts compared to the smaller caps, where the amount of covering analysts might be close to none, which should have an impact on the level of information asymmetry (Booth and Smith, 1986). Based on this, we decided to divide the data into different groups based on the size of the firm at the date of issuance to examine if the market cap that has an impact on the level of underpricing and aftermarket performance. Lastly, this study investigates whether the percentage of a company sold in an IPO affects the level of underpricing. The correlation between underpricing and percentage of shares sold in a company relates to the principal-agent theory which suggests that the level of underpricing should depend on the incentives of the involved partners in an IPO (Habib and Ljungqvist, 2001). To conclude, this study uses a top-down approach where the first two fields of research concerns whether underpricing and abnormal returns occur in Swedish IPOs. The following two questions examines whether underpricing and abnormal returns occur on the Large, Mid and Small cap lists of Nasdaq OMX Stockholm separately. Once that has been covered, two questions cover the effect of cornerstone investors on underpricing and aftermarket performance. Lastly, two questions related to the percentage of the company sold are studied, to investigate if the issuer's incentive to underprice is related to the percentage of company sold.
9 Q1: Is underpricing present on the Swedish IPO market? Q2: Is abnormal aftermarket returns present on the Swedish IPO market? Q3: Is underpricing present on the Swedish Large, Mid and Small cap separately? Q4: Is abnormal aftermarket returns present on the Swedish Large, Mid and Small cap separately? Q5: Does cornerstone investors affect underpricing and/or abnormal aftermarket returns on the Swedish IPO market? Q6: Does cornerstone investors affect underpricing and/or abnormal aftermarket returns on the Swedish Large, Mid and Small cap separately? Q7: Does percent of company sold affect underpricing and/or abnormal aftermarket returns on the Swedish IPO market? Q8: Does percent of company sold affect underpricing and/or abnormal aftermarket returns on the Swedish Large, Mid and Small cap separately? 1.4 Research Contribution By researching the above-mentioned questions, this thesis aims to examine if underpricing still exists and also investigate if it has decreased or increased since Westerholm s (2006) study. Furthermore, the study aims to contribute to research on how the underpricing phenomenon in IPOs has been affected by the recent trend of using cornerstone investors, which currently is a quite unexplored area within the world of finance. Furthermore, this thesis also aims to contribute with insights into whether investing in IPOs is a successful investment strategy. IPOs have often been criticized for squeezing out retail investors with the argument that retail investors don t get the allocation that they asked for. By using FDOT+1 in this study, we can research if retail investors can benefit by creating an IPO investment strategy. Lastly, this study also contributes to existing research by examining if the different market caps and the percentage of company sold can give insights to whether if the IPO will be successful in terms of positive share price development. 1.5 Scope and Limitations The study is conducted on the Swedish market and to maximize chances of contributing with valuable insights, the data set consists of initial public offerings between The chosen period is assumed to have similar underlying market conditions since it has been a part of the same post-financial crisis bull market trend. The data set contains 57 Swedish
10 IPOs, of which 32 transactions are cornerstone-backed. Additional evidence supporting that data should be collected during the same IPO wave is that they have different characteristics, i.e. sector activity differs. Using data from the same IPO wave removes the chance of periodic inferences being unreliable (Lowry and Cambridge, 2000). Lastly, since this study is conducted on the Swedish market, it might be that the limited number of observations and geographic focus enable certain biases that make the findings in this study non-representable for other countries. This paper includes Swedish IPO transactions conducted between with a minimum transaction size of 36 EURm. Westerholm (2006) claimed that Nordic IPOs are groupable due to economic and institutional similarities amongst the Nordic countries. Thus, a Pan-Nordic approach would have been beneficial due to a larger number of observations. However, since both IPO and cornerstone activity has been much higher in Sweden than the other Nordic countries, including them might lower the possibility of extracting valuable information and insights about underpricing and the effects of cornerstone investors on the Swedish IPO market, hence this study is limited to the Swedish market. The size limitation is another important element in this thesis and the rationale is to create a sample of cornerstone compatible firms to minimize the risk of including transactions that would never be subject to cornerstone commitment, causing misrepresentative results. The smallest cornerstone transaction in Sweden so far has been the 36 EURm IPO of Garo in 2016 and thus this is set as a transaction size requirement. IPOs conducted on alternative stock exchanges, such as Aktietorget and NGM, are often associated with higher volatility and a larger number of outliers. The results from these observations are, due to its nature, unlikely to be comparable to transactions conducted on the OMX Stockholm large, mid and small cap. The rationale behind using Nasdaq OMX Stockholm is that cornerstone investors generally do not participate in IPOs on the alternative stock exchanges. The first issue with participating cornerstones was completed in 2014 when Didner & Gerge Fonder AB and Fjärde AP-Fonden participated as cornerstone investors in the 460 EURm IPO of Lifco. This started a trend that, as of today, is well established and commonly observed. We are aware of the fact that benchmarking IPOs with and without cornerstone investors during different time periods might decrease the validity of the study. This is however often a problem when studying IPOs as they never occur at the same time and thus reflects the reality of financial markets. Nevertheless, we still believe that the benefit of
11 exploring and contributing with new research and insights on the relevant cornerstone phenomenon outweighs the disadvantages of having a data sample that is not perfectly comparable. 1.6 Thesis Structure The remaining chapters of this thesis are organized as follows. Chapter 2 provides an institutional reference frame to help readers grasp the discussions and key takeaways of this study. Chapter 3 consists of a literature review where explanatory theories are combined with previous research. Chapter 4 outlines the research process and explains the methodologies used. Chapter 5 present the data set used. Chapter 6 presents the findings of the study, laying the ground for Chapter 7 which analyses the results and relates to previous research. Lastly, Chapter 8 concludes on the findings of the study and provides suggestions for further research. 2. Institutional reference frame 2.1 The IPO process The IPO process follows a standardized form and goes through the following steps: pitch, pre-marketing, roadshow, valuation, book building and the first day of trading (Berk & DeMarzo, 2014). When a company wants to go public, it invites investment banks to a pitch meeting where they get the chance to present why their bank should get the mandate of taking the company public. Which bank that gets the leading Global coordinator or bookrunner role depends on many different aspects but in general it is decided by the company s relationship with the bank, what they have done for the company previously, their IPO track record and what they claim they can sell the company for. After the pitch is finished, the company selects one or a selected few banks for bookrunner roles and a few other banks to act as co-managers, depending on deal size and complexity of the deal (ibid.). After the kick-off meeting, the banks start a due diligence process where they collect legal, financial and other relevant information about the company and the market it operates in.
12 This is conducted by the investment banks in close collaboration with consulting and law firms as well as the management of the company. When the information is collected, all relevant data is prepared as a registration document and handed to the SEC (Finansinspektionen in Sweden) for approval. Once approved by SEC, the document circulates among investors, which also is known as pilot fishing, for them to make a welleducated investment decision (ibid.). Once the registration statement is in place, the pre-marketing process starts, lasting for about two weeks. Research analysts working for the underwriters meet with institutional investors and tell them about the company and collect feedback about what investors think about the company, the sector and valuation. Based on this feedback, the investment banks will either keep or change the price range of the offering in the registration statement (ibid.). Following the pre-marketing process made by research analysts, management engages in a roadshow where they travel and meet with investors for about two weeks. During these meetings, investors ask questions and usually give some indication whether they want to invest or not and what price they are willing to pay. The investment bank collects this feedback to do a final revise on the price range. The final price is decided in collaboration with the management after the roadshow is finished and the order book is closed. If the deal is over-subscribed, price naturally tends to be in the higher range. Once the final price is set, the investment banks will allocate the shares (ibid.).
13 Illustration 1. A descriptive picture of an IPO process 2.2 The Prospectus The prospectus is a document that contains all necessary information about the issuing company and the shares it intends to issue to the public. The use of a prospectus is vital for investors to make well-educated investment decisions. A prospectus is to be created every time shares are offered to the public, independent of share type. The prospectus is important to establish investor trust, which is a key component in successful IPOs. 2.3 Cornerstone Investors Cornerstone investors are institutional investors that are invited, usually by coordinating investment bank, to purchase a large number of shares in the IPO before first day of trading. Cornerstone investors are, unlike other retail investors, guaranteed allotment in the IPO and serve to boost popularity and investor trust in the transaction. These investors do however commit to not sell the shares for a so-called lock-up period, usually ranging between 180 and 360 days (Business Standard, 2017). Based on Bloomberg (2017) IPO statistics, a clear shift has occurred since 2014 on the Swedish IPO market, going from no cornerstone commitment to that the majority of all transactions with a value above 36 EURm today have cornerstone investors.
14 3. Literature review 3.1 Introduction to the Literature Review The main purpose of this chapter is to outline a solid foundation of relevant theories and research to help explain the new cornerstone phenomenon on the Swedish IPO market. This is of great importance since one of the goals with this study is to investigate if established corporate finance theories can explain potential differences caused by cornerstone commitment in Swedish IPOs. By using previous theory and research, a solid foundation is established from which an analysis and a discussion can take place. The literature consists of established theories and research frequently used in similar areas of research, including underpricing, information asymmetry, winner's curse, signaling theory, cornerstone investors, principal-agent theory and post-ipo performance. The theoretical foundation is of significant importance to interpret the outcome of the research conducted in this thesis. For pedagogical reasons, the chapter ends with a summary of previous research and insights and from this, followed by a section where hypotheses are developed. 3.2 Underpricing A frequently discussed topic within the finance community and economic literature is the anomaly called underpricing. Underpricing is defined by Van der Geest and Van Frederikslust (2001) as the following: Underpricing is the positive return that a shareholder can achieve when a new public share is bought at its offering price and sold at its first closing day price. Underpricing is one anomaly spotted in IPO transactions worldwide but depth and breadth differ with country and sector (Sciencedirect.com, 2017). Several researchers have tried to explain this anomaly. Ritter (1984) conducted research on more than 5000 IPOs worldwide between 1960 and 1982 to examine whether underpricing was a stylized fact on other markets than the U.S market. The study reported average returns of 18.8% shortly after trading was initiated and 48.8% looking at a 15-month period. This is supported by Loughran et al. (1994) who found significant underpricing for 28 countries worldwide. Early studies conducted by
15 Reilly and Hatfield (1969), McDonald and Fisher (1972) and Logue (1973) also supports the underpricing phenomena of IPOs. Studies connected to IPOs and underpricing on the Scandinavian market have been conducted, among others, by Westerholm (2006). Westerholm s study is based on IPO data between 1991 and 2001 and concludes that underpricing, on average, is 17% on the Scandinavian market. Furthermore, Westerholm concludes that underpricing tend to be extra high in hot sectors during certain time periods. A great example of this is the period leading up to the IT bubble that emerged between (CNN, 2000) 3.3 Information asymmetry Information asymmetry is one of the most discussed theories in research related to financial markets and has large explanatory power of IPO underpricing. The theory was first introduced in the 1970s by G. Akerlof in his paper The Market for Lemons : Quality Uncertainty and the Market Mechanism. Akerlof argues that in most markets, buyers use a static approach to measure the value of a specific good. Consequently, buyers use the market average to value goods while sellers most certainly have more product specific information. To account for the information asymmetry between buyers and sellers, as well as the uncertainty about the quality of the specific good, buyers will demand a discount for taking on that specific risk (Akerlof, 1970). Established corporate finance theories and research have concluded that the management of a firm, due to their position, possess more company specific information than external investors (Dierkens, 1991). By not revealing all information, management can technically benefit by using their information advantage against other investors (ibid.). Just like the previously mentioned Market for Lemons study (Akerlof, 1970), an investor will demand an IPO discount to hedge against transaction specific risk associated with information asymmetry. To overcome and incentivize investors, despite the information asymmetry, underpricing can be used as a motivational tool (Berk & DeMarzo, 2014). According to Booth and Smith (1986), owners are motivated to take their company public since going public results in a wealth transfer from investors to the owners. Due to previous fact and the dynamics of financial markets, overvalued companies tend to be overrepresented among IPO candidates. Therefore, the announcement that insiders intend to raise public
16 equity indicates that the firm is potentially overvalued (ibid.). As a result, investors are likely to demand a risk premium to invest in the issuing company, which naturally translates to a lower IPO price. According to Booth & Smith (1986), a complementary solution to handle the problem of information asymmetry is to use an investment bank to certify the quality of the offering, this type of signaling method is further discussed in chapter Winner s curse One of the first researchers to discuss IPO underpricing as a result of information asymmetry was Rock (1986). Rock s model assumes there is two types of investors: informed and uninformed. According to him, uninformed investors are not able to tell the difference between good and bad IPOs, and as a result, uninformed investors are likely to be the only ones interested in bad offerings. Uninformed, primarily retail, investors are also more likely to be squeezed out in good offerings due to their weaker relationship and generally less importance to the investment bank. One way for underwriters to motivate these investors to engage in many IPOs, despite the risk of being squeezed out, is to leave money on the table by underpricing the offers. Hence, Rock (1986) concluded that underpricing is a powerful tool to ensure that both informed and uninformed investors participate in IPOs. Keloharju (1993) supports the problem related to winner s curse on the Finnish market, where uninformed investors on average received large allocations in bad offerings with negative initial returns and rationed allocations in good offerings with positive initial returns. These findings on the Helsinki Stock Exchange contradicts established efficient market theory and highlights the importance of having a good relationship with underwriters. 3.5 Signaling theory Due to information asymmetry, investors will primarily receive information shared by the company. The information shared will send signals to the public about the firm's future earnings potential, at which investors then react (Berk & DeMarzo, 2015; Van Horne & Wachowicz, 2005). For example, increased dividends could indicate that management is positive about the company's future earnings potential. Correspondingly, a decrease in dividends could indicate that management is pessimistic about the company's future earnings potential. According to Allen and Faulhaber (1989), another reason for underpricing except information
17 asymmetry is signaling theory. Ibbotson (1975), find evidence that high-quality firms leave money on the table to a greater extent than low-quality firms due to their confidence in regaining the money later in terms of increased stock price, good reputation and following SEOs. Thus, firms that underprice the most paradoxically signal the greatest quality. Allen and Faulhaber (1989) support the previous statement and concludes that underpricing of highquality firms is even higher during bullish market trends. Welch (1989) support previous claims and states that stronger firms underprice IPOs to stop weaker firms from imitating stronger ones. Issuers have incentives to use underpricing as a signaling tool if the information asymmetry is high and the benefit outweighs the cost of creating the signal (Francis et al., 2001). Weaker firms refrain from mimicking the underpricing strategy due to the risk of being detected as a low-quality firm and thus eliminate chances of regaining lost value in the aftermarket and subsequent SEOs. The signal theory can also be applied to cornerstone investors. When a firm that is about to go public reveals that cornerstone investors will participate in the offering, it is likely to be interpreted as a signal of good quality (Megginson and Weiss, 1991). Despite that underpricing is one of the most frequently used signaling tools in IPOs, it is questionable if firms would use it if a wider range of signaling tools were available. Alternative signaling tools to underpricing and cornerstone investors can be reputable underwriters (Booth and Smith, 1986), venture capitalists (Lee and Wahal, 2003) or auditors (Titman and Trueman, 1986). Involvement from any of these types of firms in an IPO is likely to create legitimacy and certify the quality of the offering. This is in line with previous research by Beatty and Ritter (1986), Carter and Manaster (1990), and Carter et al. (1998), indicating that investment banks enforce underpricing equilibrium and result in less short-run underpricing, explained by the fact that underwriters risk both their reputation and loss of future business in the offering. 3.6 Cornerstone investors The use of cornerstone investors in Swedish IPOs is a relatively new phenomenon that initially originates from Asia (Financial Times, 2017). McGuiness (2014) examined the effect of cornerstone investors on the Hong Kong market and found a positive relationship between cornerstone participation and IPO value, measured by Tobin s Q. Boehmer et al. (2006) suggest that large institutions get more allocation in good issues, supporting a stronger post- IPO performance with cornerstones than without. This can partly be explained by signaling
18 theory since cornerstone presence sends positive signals to the market about the quality of the issue. McGuiness (2014) found that issues with cornerstone investors have higher earnings growth, supporting the research by Tan and Ong (2013) who found that cornerstone investor backed IPOs have a more sustainable earnings growth, and thus can be seen as a sign of good quality. Tan and Ong also highlighted the importance of cornerstone investors on the Asian market due to their ability to create an interest for the stock, especially among retail investors. Financial times (FT) have expressed skepticism towards cornerstone investors, main concern being the reduced liquidity associated with lock-up provisions for cornerstones when participating in IPOs (Financial Times, 2017). Dagens Industri (DI) have however highlighted the importance of cornerstone investors and Joakim Bornold (Nordnet) have stated that the use of cornerstone investor Swedbank Robur was necessary to create enough investor demand in the Lauritz IPO (2016), previously canceled due to insufficient investor demand (Dagens industri, 2016). Other economists of the online retail bank Nordnet have however also criticized the use of cornerstone investors since retail investors get squeezed out. Supporting evidence confirming this theory is the Lifco IPO in 2014 where only 2% of the shares were allocated to retail investors (Dagens industri, 2016). 3.7 Principal-Agent Theory In a bookbuilding process, the investment bank's role is mainly two things: to allocate shares and gather necessary information to price the issue correctly. One of the first researchers to apply the principal-agent framework to explain IPO underpricing was Baron (1982). In his model, investment banks are assumed to have more knowledge about equity capital markets demand than the issuer, indicating a positive demand for investment banking services. According to Baron (1982) and Beatty and Ritter (1986), underpricing is a result of both information asymmetry and investment banks advising on a price that makes it possible to stand behind the offer and satisfy both selling shareholders and investors. Beatty and Ritter (1986) argue that investment banks who underprice too much will lose mandates but satisfy investors and that those who underprice too little will get mandates but won't be able to sell the shares. Previous theories are challenged by Muscarella and Vetsuypens (1989) as they find evidence of underpricing even when investment banks go public and distribute their own shares. Since there is little, if any, information asymmetry in these transactions, it would seem that Baron's model cannot fully explain the underpricing phenomena.
19 Habib and Ljungqvist (2001) present data supporting that underpricing can be explained by the amount of company stock the owners want to sell. Owners selling of large amounts of shares is more keen on avoiding underpricing than owners who sell of small amounts of shares. The study was conducted in several different markets and Habib and Ljungqvist concluded that underpricing was significantly lower on marketplaces where owners sold large parts of their firm and that underpricing is not a guarantee for a successful IPO. Hence, evidence suggests that the potential principal-agent conflict can affect the level of underpricing, depending on the incentives of the involved partners. Biais et al. (2002) use the agency cost setting presented by Baron (1982) and research by Benveniste and Spindt (1989) to present evidence that some investors keep price-relevant information to themselves before the offer price is settled. Should this be true, it is possible for bankers to cooperate with informed investors at the cost of the issuing firm. Biais et al. (2002) present a method to maximize the IPO price even if informed investors (e.g. institutional investors) have incentives to keep relevant information regarding the issue secret to lower the IPO price. The method goes as follows; positive signals from informed investors increase the price of the offering. Hence, a higher demand of allocation should result in a higher price of the IPO. When the demand from institutional investors is weak, allocation for retail investors increases and consequently results in a lower IPO price, which also results in a decreased winner s curse effect (Ljungqvist, 2004). Ljungqvist and Wilhelm (2003) presents evidence that monitoring incentives in the issuing firm increase as the equity stake held by decision-makers increase. They also present evidence supporting a positive correlation between underpricing and the amount of equity offered in the IPO, i.e., larger offerings as a percent of the company sold leads to less underpricing, supporting the theories earlier presented by Ljungqvist and Habib (2001). Loughran and Ritter (2003) claimed that a reasonable explanation for underpricing is the risk investors face when investing in IPOs. This was particularly noticeable during the IT-bubble when the majority of the issuing firms were unprofitable and risky, resulting in more underpricing. Similar to Baron (1982), Loughran and Ritter (2003) stress the potential agency problem between investment banks and issuing firms. Since the dot-com bubble, several regulatory investigations have been conducted to address the potential agency problems related to underpricing in IPOs. Ljungqvist (2004) discuss the problem of investors offering
20 side-payments to get full allocation in hyped IPOs. Examples of such a deal were discovered between Credit Suisse and First Boston in 2002 (Securities and Exchange Commission, 2017). One might argue that the fees received by the investment bank in case of a successful IPO are enough to align the interests of the investment bank with the remaining stakeholders. However, there can be a potential problem if the bank s benefit of underpricing the offering exceeds the payments received in a fairly priced IPO. 3.8 Post-IPO Performance Previous studies of post-ipo performance have discussed whether IPOs have underperformed against benchmark indices (Van Fredrikslust & Van der Gest 2004). Ritter (1984) found evidence of IPO underperformance when conducting research on a three-year period, with noteworthy differences in underpricing between sectors and time periods. Based on data from the s, Loughran and Ritter (1995) found evidence of underperformance during a five-year period. According to Ibbotson (1975), the degree of underperformance depends on the measured period. Westerholm (2006) studied Scandinavian IPOs and concluded that Nordic IPOs, similar to American IPOs, generate a negative post-ipo performance during a five-year period. Levis (2011) found contradictory results to previous research, indicating that IPOs don t underperform. This is supported by Gompers and Lerner (2003) who found no evidence of IPO underperformance when they compared IPOs to their benchmarking index. Buser and Chan (1987) even found evidence of positive abnormal returns looking at a period of two years. Gompers and Lerner (2003) did however also conclude that previous studies are dependent on methodology and benchmarks used. Ritter and Welch (2002) reached the same conclusion in their research and emphasized that the results in post-ipo performance studies are dependent on both methodology and time period used. Ibbotson (1975), as mentioned earlier, emphasized that the time period used in a study can have a significant impact on the outcome, which also is supported by Ritter (1991). Furthermore, Krigman et al. (1999) found evidence that IPOs with 10-60% underpricing outperformed corresponding benchmarks during a one-year period. A potential explanation of this can be seen in Affleck-Graves (1996) study which highlights the importance of positive momentum when a firm goes public. In their study, companies with positive FDOT returns, explained by underpricing, outperformed their benchmark during a one to three-month
21 period. The opposite effect was also found for companies with negative first day returns, were negative returns continued during a one to three-month period. Worth mentioning, however, is that the benchmark used was a chosen peer instead of an index, indicating that choice of methodology when studying post-ipo performance is significant. To summarize, there is little unison regarding post-ipo performance. Evidence of both over and underperformance has been presented. Explaining factors does, however, seem to be industry, choice of benchmark and most importantly, time horizon, indicating positive abnormal returns prior two years from FDOT and negative abnormal returns afterward. 3.9 Conclusions and presentation of hypotheses Previous research has covered whether underpricing occurs in IPOs. Logue (1973), Ritter (1984) and Westerholm (2006), who used Scandinavian IPOs between in his data set, concluded that underpricing occurs in IPOs. However, a lot has happened since 2001 and the rise of cornerstone investors on the Swedish IPO market has not yet been thoroughly explored. Based on previous research and the new cornerstone phenomenon, the following hypotheses related to IPO underpricing have been developed: Hypothesis I: Underpricing is present in Sweden between Hypothesis II (a) Underpricing is present on Nasdaq OMX Stockholm Large cap between Hypothesis II (b) Underpricing is present on Nasdaq OMX Stockholm Mid cap between Hypothesis II (c) Underpricing is present on Nasdaq OMX Stockholm Small cap between Post-IPO performance has previously been examined by various researchers. Ritter (1984), Loughran and Ritter (1995) and Westerholm (2006) found evidence of underperformance among IPOs when they were benchmarked against indices three, five and five years respectively. However, research by Ritter and Welch (2002), Gompers and Lerner (2003) and Levis (2011) contradicts earlier findings and find supporting evidence that IPOs outperform the corresponding index.
22 According to Ritter and Welch (2002), the methodology and choice of benchmark are crucial factors for the outcome of a study. Studies, where general market indices have been used as benchmarks, support post-ipo overperformance, whereas studies, where peers have been used to benchmark the IPO performance, have indicated that there is IPO underperformance (Gompers and Lerner, 2003). Ibbotson (1975) emphasized that different time periods can lead to different outcomes. Previous research with time periods longer than two years has concluded that IPOs underperform while papers with shorter than two years find no support of IPO underperformance (Buser and Chan, 1987; Ritter, 1991; Loughran and Ritter, 1995). Based on previous findings, this paper tests for IPO performance with indices, which we deem as more objective compared to using peers as a benchmark, and examines whether IPO overperformance can be confirmed when cornerstone investors participate over different time periods. Thus the following hypotheses were developed: Hypothesis III: Swedish IPOs outperform the market on a short to medium-term basis Hypothesis IV (a): IPO transactions on the Swedish Large cap outperform the market on a short to medium-term basis Hypothesis IV (b): IPO transactions on the Swedish Mid cap outperform the market on a short to medium-term basis Hypothesis IV (c): IPO transactions on the Swedish Small cap outperform the market on a short to medium-term basis McGuiness (2014) found that cornerstone backed IPOs tend to receive higher valuations, with the Tobin's Q formula. Tan and Ong (2013) found that cornerstone investors can be seen as a quality sign since the issues with participating cornerstone investors, in their study, have more sustainable earnings growth. This is further supported by McGuiness (2014), who found that cornerstone backed IPOs have higher earnings growth. Based on these findings this thesis further examines the relevance of cornerstone investors, with respect to the level of underpricing and post-ipo performance. Hence, the following hypotheses were developed:
23 Hypothesis V: Underpricing in Swedish IPOs is higher with cornerstone investors Hypothesis VI (a): Underpricing in IPOs on the Swedish Large cap is higher with cornerstone investors Hypothesis VI (b): Underpricing in IPOs on the Swedish Mid cap is higher with cornerstone investors Hypothesis VI (c): Underpricing in IPOs on the Swedish Small cap is higher with cornerstone investors Hypothesis VII: Aftermarket performance in Swedish IPOs is higher with cornerstone investors Hypothesis VIII (a): Aftermarket performance in IPOs on the Swedish Large cap is higher with cornerstone investors Hypothesis VIII (b): Aftermarket performance in IPOs on the Swedish Mid cap is higher with cornerstone investors Hypothesis VIII (c): Aftermarket performance in IPOs on the Swedish Small cap is higher with cornerstone investors Habib and Ljungqvist (2001) found that underpricing partly can be explained by the percentage of the company that the owners want to sell. Their study concluded that underpricing significantly decreased when the percentage of the company sold by owners increased, which relates to the principal agent theory and partly the signaling theory. Based on these findings, the following hypotheses were developed: Hypothesis IX: Underpricing in Swedish IPOs has a negative relationship with percent of company offered Hypothesis X (a): Underpricing in IPOs on the Swedish Mid cap has a negative relationship with percent of company offered Hypothesis X (b): Underpricing in IPOs on the Swedish Mid cap has a negative relationship with percent of company offered Hypothesis X (c): Underpricing in IPOs on the Swedish Small cap has a negative relationship with percent of company offered
24 4. Method 4.1 Introduction to the methodolgy chapter The purpose of this study is to analyze underpricing and post-ipo performance, a topic that many types of research have examined but to a limited extent on the Swedish market. Furthermore, the study aims to research whether if cornerstone investor participation in an IPO has an effect on the level of underpricing and post-ipo performance. The method chapter starts by focusing on underpricing and the method used to calculate underpricing. Once that has been covered the chapter continues by discussing the selected time periods and what implications these could have on the outcome and how abnormal returns are measured. Finally, statistical methods together with robustness tests are presented, since these are used to ensure and validate the quality of the research. 4.2 Underpricing To measure the underpricing of an IPO one needs to consider three different issues according to Schöber (2008). These are the period used to calculate the initial return, the price that should be used to calculate the underpricing and also whether if adjustments for market movements should be made. There seems to be no consensus on what time period that should be used to calculate the initial returns. One of the oldest studies, performed by Ibbotson (1975), based the calculations on the first month of trading to calculate the underpricing. This can partly be explained by the market conditions during this period since the trading liquidity was considerably lower compared to today's market conditions. More recent studies such as Ritter and Welch (2002) and Westerholm (2006) used the first day of trading to calculate the underpricing. This study will apply the more recent approach of calculating underpricing since today's market is substantially more liquid than in the 1970's. Hence the first day of trading will be used as the event window to calculate the level of underpricing used in today's financial market. According to Schöber (2008), recent studies have not adjusted for movements on the market, which is in line with Beatty and Ritter (1986) who argued that unadjusted initial returns are not significantly affected since the average daily market return is relatively small compared
25 to the initial stock return. Therefore, this study follows past research and uses the unadjusted initial stock returns to calculate underpricing. The prices used to calculate the underpricing have varied in previous research, Loughran et al. (1994) used the average between the bid and asked price while Loughran and Ritter (2003) used the closing price. This thesis uses the offer price of the IPO together with the daily closing price to calculate underpricing, which is in line with most of the previous research (Lowry & Schwert, 2002; Loughran & Ritter, 2003; Otchere et al., 2013). The formula used to calculate the underpricing can be defined as follows: The sample included in this study is sorted into different measurement groups, to see if certain characteristics have a significant effect on the level of underpricing. The first measurement group consists of all IPOs during the entire period ( ). The second measurement group consists of all IPOs between without cornerstone investors, while the third group uses all IPOs between with cornerstone investors. These are mentioned as the no cornerstone group and the cornerstone group correspondingly. Lastly, we divide the measurement groups by the following market caps: small, mid and large, where the sizes are divided by the market value at the time of each firm's IPO. The market value of small cap firms is below 150 EURm, mid cap firms between EURm and large cap firms larger than or equal to 1000 EURm. Dividing our sample into different measurement groups is done to capture potential differences between the firm s market cap and underpricing. This study will calculate an equally weighted mean, which is in line with most of the previous studies. By dividing the data into separate measurement groups we do not apply the value weighted approach of calculating underpricing, the samples are instead divided into groups depending on their market cap since the aim is to see if there is a difference between
26 underpricing on the different market caps. The previously mentioned formulas used to calculate this are the following: Each of the measurement groups is statistically tested to verify if underpricing can be proved. The statistical tests of underpricing are further described in chapter Post-IPO Performance How to measure the post-ipo performance has previously been widely discussed, however previous researchers haven't reached consensus on how to measure abnormal returns according to Barber and Lyon (1996). Due to this, there are several factors that need to be considered to make the measurement method as transparent as possible. Such factors are the time period used, the abnormal return metric that is used and also the benchmarks that are used to compare the performance of the offer Time regimes This study is focused on a relatively short time period after the initial public offering, which is done to avoid, in as large extent as possible, events that are not related to the IPO in the measurement. The time periods used are one day, one month, three months and six months since the stock's FDOT as well as FDOT+1, which is in line with previous studies that measured abnormal returns performed by Brown and Warner (1980, 1985), and Campbell and Wasley (1993). This contradicts the twelve-month measure periods used by Schöber
27 (2008) and Certo et al. (2009), however Bergström et al. (2006) defines long-term performance as all time horizons longer than 6 months and since the aim of this study isn't to measure long-term performance we can conclude that a six-month period can be seen as an appropriate upper time limit. Furthermore, since the lock up effect in most IPOs is at least 180 days, this also limits the biases of insiders that otherwise could sell their shares and make the data less trustworthy. To conclude, this study will define the short-term time period as the period between FDOT+1 and one month and the medium-term time period as the period between one and six months post FDOT. Furthermore, this paper studies issues from the same economic cycle and divides the measurement groups in the same way as in chapter 4.2. Hence our event window begins with the post-financial crisis bull market trend that started in This study employs two different starting measurement points for post-ipo performance. The first starting measurement point that is employed is the IPO offer price, while the second starting point of measurement is the closing price of the share's first day of trading (FDOT+1), which is supported by Ritter (1991). This is because investors can't always get the allocation that they initially asked for and hence needs to get more shares on the public market to get their 'optimal'' number of shares. Thus, the measurement period also starts at the closing price of the first day of trading since all investors have been given the opportunity to buy more shares if the investor didn't get the allocation that was asked for. There are two common methods that are used to measure abnormal returns, with respect to time regimes. These are the event-time and calendar-time approaches and both of these are commonly used when measuring aftermarket performance (Fama, 1998). Both of the methods have their strengths and weaknesses, hence the decision on which of these that should be used together with a description of them is presented below. The event-time approach bundles the aftermarket returns by their relative age and does not consider when the IPO went public. For e.g. in the event-time approach, the first-year returns are bundled together no matter if they occurred in 2010 or The calendar-time approach works the other way around since it instead bundles returns in accordance to their calendar-time and not the number of years since the company went public. To clarify, the calendar-time approach can use the first-year return of an IPO that went public in 2014 with the second-year return of
28 a company that went public in The differences between the two different methods are illustrated below: Illustration 2. Calendar-time and Event-time approach According to Schöber (2008), the event-time method is a more widely used approach when it comes to measurements of aftermarket performance. One should, however, be aware of the fact that the event-time approach assumes independence between the returns of IPOs when they, in fact, tend to cluster during times with high market valuations, which leads to overlapping that can create more cross-sectional dependence (Schultz, 2003; Gompers & Lerner, 2003). Despite being less popular, one of the strengths with the calendar-time method is that it eliminates the cross-sectional dependence since it bundles abnormal returns across stocks for each calendar period. Due to cross-sectional dependence between IPO returns, we have a conservative approach when making conclusions about the statistical results provided by our data set and hence the cross-sectional dependence is taken into consideration. Krigman et al. (1999) discussed the importance of event-time studies ability to capture an investor's actual return more accurately compared to the calendar-time approach, which supports the usage of the event-time approach. One of the aims of this study is to examine the investment strategy of participating in recent IPOs between and how new phenomenon have affected the development of IPOs. Due to this, together with the support
29 from previous studies within the field of this paper, we decided to apply the event-time method to measure the aftermarket performance Measuring post IPO performance The most widely used metrics used in order the measure the post-ipo performance in an event-time study are the cumulative abnormal return (CAR) metric and the buy-and-hold abnormal return (BHAR) metric (Ritter, 1991). Both of the two metrics measures the difference between a stock and its comparable index over a specific time period. What separates the two of them is that the CAR measurement uses single-periods (e.g. months) that are summarized together, while the BHAR measurement compounds the returns. The formulas for BHAR and CAR are presented below: The formulas above are of importance since they provide a measurement of post-ipo performance, which establishes a platform for the data in this paper and thus affects the statistical interpretations and conclusions. The difference between BHAR and CAR is that BHAR includes the monthly compounded returns which therefore better reflects the actual returns of an investor that applies a buy-and-hold strategy, compared to the CAR metric. Even though that BHAR produces a more accurate measurement, it can sometimes generate quite extreme numbers due to the compounding effect. This together with the fact that BHAR produce more skewed results (Kothari and Warner 1997) compared to the CAR metric could make one argue that CAR is a better measurement. However, previous research by Loughran and Ritter (1995), Schultz (2003) and Westerholm (2006) have all used BHAR as their measurement metric. To be more in line and comparable with previous research and to get this paper to match with previous research we choose to use BHAR as the metric for measuring the post-ipo performance. Barber and Lyon (1996) concluded that BHAR better simulated the investor experience since it compares the strategy of participating in IPOs with
30 the alternative of investing in i.e. an index and thus Barber and Lyon preferred the BHAR metric over CAR, which also is supported by Schöber (2008). Just as previously mentioned in this chapter, this paper will use the equally weighted averages of the BHAR metrics. This paper, compared to previous studies has chosen to not adjust for inflation. The main argument for this is due to the low rate of inflation during this thesis chosen time period. Thus, the inflation's impact on the data set used is seen as insignificant. The equally weighted (ev) average BHAR for the measurement groups defined in chapter 4.2 and chapter are calculated in the following way Benchmark Within the field of this study, there have been two different types of approaches used to benchmark the performance of an IPO. Westerholm (2006) used broad market indices to calculate abnormal returns in their studies, which is further supported by Bergström et al. (2006). According to Bergström et al. (2006), the market indices are exposed to the same fundamental risks as the IPOing firms. Thus, a broad index is seen as a suitable benchmark. However, previous research by Ritter (1991), Loughran and Ritter (1995) and Barber and Lyon (1996) instead used similar firms as their benchmarks, by matching them by industry and size. In order to keep the study as replicable and objective as possible, this paper follows the more recent approach of benchmarking, which is supported by Buser & Chan (1987); Brav & Gompers (1997); Gumpers & Lerner (2003); Bergström et al. (2006); Westerholm (2006) and Cao & Lerner, (2009). By using the benchmarking methodology by Westerholm (2006), we compare the IPOing firms against an all-share index, which includes dividends. By including the dividends in the comparing index the study better matches a buy-and-hold strategy and thus provides clearer
31 results concerning whether if participating in IPOs outperform a traditional buy-and-hold strategy. This paper is focused on the Swedish market, partly due to the country's relatively high IPO activity within the Scandinavian region. Additionally, the cornerstone investor phenomenon is well established on the Swedish market compared to other Scandinavian markets, which strengthen the decision to use the OMX Stockholm GI index as the benchmark in this paper. 4.4 Statistical tests To statistically verify the hypotheses regarding the post-ipo performance with and without cornerstone investors, numerous tests are employed on the data set, which is further discussed in chapter and chapter Based on the hypotheses presented in chapter 3.8, the statistical tests will be performed in the same top-down manner. First, we test for statistical significance of underpricing and aftermarket performance. This is followed by a regression that measures underpricing and aftermarket performance as a function of market cap, percent of company sold and cornerstone presence Statistical tests for underpricing There are two general categories of statistical test that are used to test the results of hypotheses; parametric and non-parametric tests. The parametric tests have stricter assumptions compared to non-parametric tests, especially when it comes to the distribution of the data set. Parametric tests are seen as more appropriate if the assumptions of a normal distribution are met, however, if the data isn't normally distributed then non-parametric tests are seen as more suitable (Conover, 1999). The data used in this thesis include all Swedish IPOs between , with the only exception being the transaction requirement of 36 EURm, to make the cornerstone backed IPOs comparable with the non-cornerstone backed IPOs. To ensure that the data follows a normal distribution this thesis employed a well-known and established test, namely the Jarque-Bera test, which is performed in Eviews 9.5. The Appendix (Figure 1) presents the results of the previously mentioned test and as shown in the appendix, all samples are normally distributed. Since the samples are normally distributed, T-tests are used to test the statistical significance of the outcomes in the different measurement groups. This approach of testing has previously
32 been performed in several papers, where for e.g. Westerholm (2006) is one of the authors that supports the approach. The T-tests are used to verify hypothesis I(a), stating that underpricing is present in Swedish IPOs between Furthermore, T-tests are used to examine hypothesis II (a-c), stating that underpricing is present in Swedish large, mid and small cap IPO transactions separately. Hypothesis V and VI (a-c) state that cornerstone investors have a positive relationship with underpricing. By dividing the data set into several groups, as discussed in chapter 4.2 and 4.3.1, this study can conclude on potential differences in underpricing between the measurement groups. Lastly, T-tests are also performed on hypothesis IX and X (a-c) to see if there is a negative relationship between underpricing and the percent of a company sold. Once a T-value is calculated, we can make use of the normal distribution. Due to this, we calculated the p-value to decide whether if our hypotheses can be statistically proved. The chosen significance level α is 5%, which is the most common level of significance (Dodge, 2008). If the P-value is equal to or below the chosen α (5%), then the null hypothesis is rejected Statistical tests for post IPO Performance Except testing for underpricing, this paper is also examining the short to medium term performance once a company has gone public. Hypothesis III is tested by using the BHAR metric previously presented in chapter Hypothesis III, the post-ipo performance, is tested to see if firms that recently went public significantly outperform the benchmarking index. Once that has been tested, hypotheses IV (a-c) are tested, to see if there is a significant difference between the different market caps that this study examines. Lastly, the cornerstone factor is included according to hypothesis VII and VIII (a-c), to test for a potential difference in post-ipo performance on both a short and medium term time horizon when cornerstone investors are considered. To be able to examine the hypotheses related to the post-ipo performance (1, 3, & 6 months since the FDOT) we, as previously mentioned, employed the Jarque Bera test and concluded
33 that the data is not skewed. By not applying a long-time horizon within the study, there is a potential risk of cross-sectional dependence between the companies that went public between In case of positive cross-sectional dependence there is a risk that traditional statistical tests such as the T-test is unable to handle the data in a reliable way (Cowan & Sergent, 2001) since the T-tests would tend to reject the null hypothesis even when it shouldn't, which also is known as a type I error (University of California Berkeley, 2017). One could argue that a non-parametric test such as the Wilcoxon Signed Rank test is appropriate due to its ability to work better with skewed datasets. However, previous research by Ritter (1991), Loughran & Ritter (1995), Affleck-Graves et al. (1996) all use parametric tests, which increases the support of our approach and also makes our findings more comparable to previous studies. Also, as seen in the appendix (Figure 1), the Jarque Berra test supports a normal distribution, hence the problem of having a skewed dataset is seen as limited. To this, we have conducted a Whites-test (seen in Figure 2 in the appendix) to check for heteroscedasticity. Since no test is statistically significant, we assume a homoscedastic data set, i.e., that the variance of the error term is constant, minimizing chances of OLS t-statistic and confidence intervals not being valid for the inference problem. Looking at Figure 3-8 in the appendix, VIF tests was also conducted to see whether there was any correlation among the independent variables. As shown in figure 3, looking at the entire sample, there is a high correlation between the constant variable (C) and market cap, causing the standard error to increase, something that might explain why there was no statistical significance for the market cap variable. Lastly, we conducted a Breusch-Godfrey Serial Correlation LM Test for autocorrelation to see whether there was any correlation between the independent variables and the dependent variable (Figure 9-14 in appendix). As shown by figure 9, autocorrelation is not significant, meaning that the error terms of different observations are not correlated with each other. The tests conducted in this thesis are aligned with the ones of previous studies and thus we assume them to be valid for the research conducted in this thesis.
34 5. Data 5.1 Introduction to the data chapter The following chapter aims to present the descriptive statistics of the data set in this thesis. First, statistics are discussed and accounted for, followed by how the data was collected and what considerations that were made. Finally, we present data limitations and actions made to deal with these issues. Number of IPOs With and without cornerstones With cornerstones Without cornerstones Large cap Mid-cap Small-cap Total Total (%) 100% 56% 44% Median transaction size Average transaction size Max Min Median market cap Average market cap Max Min Table 1: Swedish IPOs with offer size above 36 EURm Above, we present a summary of Swedish IPOs that took place between 2010 and 2017 with a transaction size exceeding or equal to 36 EURm. The data set shows a total number of 57 IPOs, sorted on market capitalization and whether cornerstone investors have been present or not. As shown in the table, 32 of these transactions have included cornerstone investors, representing 56% of the total sample. Looking at the table, we can see that transactions with
35 cornerstone investors, both on average and median, have a larger market capitalization than those without. Transaction size also tends, on average, to be marginally higher for cornerstone-backed transactions. Contradicting evidence against a positive relationship between transaction size and cornerstone involvement is that transactions without cornerstone investors both has the largest observation as well as the highest median value. The majority of the transactions appear in the mid-cap segment, representing 75% of the total sample. The data sample indicates that cornerstone presence is highest among mid cap transactions and lowest among small cap transactions, being 60% in the mid cap segment, 50% in the large cap segment and 40% in the small cap segment. Due to a limited number of observations, especially in the large and small cap segment, extracting statistically significant information is problematic. Year Number of IPOs With Cornerstones Without cornerstones Total Table 2: Swedish IPOs with offer size above 36 EURm on annual basis Above, the number of IPOs in our sample is presented on an annual basis, showing a clear shift to cornerstone transactions after that the first cornerstone transaction took place in 2014 when Lifco did their IPO. Also, as showed by the data, there has been an IPO boom, ranging from 2014 until today, representing 88% of the total number of IPOs during the entire period. Also, among the IPOs that have been conducted between 2015 and today, 82% of the IPOs
36 have had cornerstone investors, which shows a clear preference for cornerstone investors once a firm goes public. In line with the discoveries made by Megginson and Weiss (1991), the increased popularity of cornerstone investor s post-2014 is likely explained by its certification power and signal of good quality. 5.2 Selection of data Since Lifco s IPO took place in 2014, all cornerstone transactions except two have been on the Nasdaq OMX. The exceptions, LeoVegas and Catena Media, took place on First North Premier but have been included in our data set for two reasons: firstly, the transaction size is large enough to make it comparable to the other transactions in our data set and secondly, First North Premier, as of 2016, has the same requirements as the Nasdaq OMX. To optimize practical relevance for investors, this thesis has, with the LeoVegas and Catena Media exceptions, looked at Swedish Nasdaq OMX transactions with a size exceeding 36 EURm during the post-financial crisis bull market trend, ranging from 2010 until today. When measuring for aftermarket performance, companies that have been public for a shorter time period than six months have been included in earlier measuring points, i.e. three months, one month and one week. The smallest cornerstone transaction in our data sample is the 36 EURm IPO of GARO which went public on the 16th of March This transaction has been used as a benchmark when deciding whether to include Swedish Nasdaq OMX transactions in our sample or not. The transaction size limit is considered to be a good proxy when deciding whether transactions have been cornerstone eligible or not and to minimize the effect of stock illiquidity. The disadvantage of cutting out observations and thus lower degrees of freedom in our parametric tests is outweighed by getting a smaller, but comparable, sample with similar fundamentals. 5.3 Methodology of data collection To find relevant data for this thesis, such as issue prices and prospectuses, several databases, including Finansinspektionen, Bloomberg and press releases have been used. As previously mentioned, our study includes 57 IPOs on the Swedish market, and as seen below, the final data sample is presented, sorted by market cap and cornerstone presence.
37 Measurement groups Group n Group n All observations 57 Split by cornerstone investor Cornerstone 32 No cornerstone 25 Total 57 Split by time period Split by Market Cap 1 week 57 Large cap 4 1 month 57 Mid cap 43 3 months 57 Small cap 10 6 months 55 Total 57 Total 57 Table 3: Swedish IPOs with offer size above 36 EURm divided by time period, market cap and whether cornerstone investors have been present or not From the original data set, some of the IPOs have been excluded in our data collection process. The reason for exclusion has been due to failure in meeting the basic demands of being traded at Nasdaq OMX and transaction size being larger than 36 EURm. Information about the IPO structure, such as offer price, amount of company offered and cornerstone commitments has been collected from the IPO prospectus and then cross-referenced with Bloomberg. When calculating aftermarket performance, price data for both equities and index have been collected using Bloomberg solely. In cases where the prospectus was not found or did not contain enough information about cornerstone commitment or how much of the company that was sold, Bloomberg and company press releases were used. Bloomberg is widely considered by industry professionals to have the most extensive and complete market data setup, and thus we are confident that the data in our sample is reliable.
38 5.4 Simplifications of the data set To measure the aftermarket performance, some simplifications had to be made to make the study as replicable and objective as possible. This study used the OMX Stockholm Gross Index (total returns, including dividends) as the benchmark, which some might see as questionable. One alternative approach for looking at aftermarket performance is the Fama- French model, which incorporates value and size when looking at aftermarket performance of newly issued shares, and thus adjust for the outperformance tendency, i.e. that value companies tend to perform better than growth companies, and smaller companies tend to perform better than larger companies. However, since both Loughran and Ritter (1995) and Krigman et al. (1999) found evidence that momentum and book to market have a limited ability to explain aftermarket performance of newly issued shares, we have chosen to use an index, which, as previously mentioned, is supported by Buser & Chan (1987); Brav & Gompers (1997); Gompers & Lerner (2003); Bergström et al. (2006); Westerholm (2006) and Cao & Lerner (2009). Another significant simplification that has been made is the classification of cornerstone investors. As of today, there is no legal definition of what a cornerstone investor is in neither Sweden nor Europe, and thus this has required us to create our own definition of a cornerstone investor. In this thesis, we have defined cornerstone investors as pre-ipo investors disclosed in the prospectus, committing to a lock-up period and to acquire a certain amount of the newly issued shares, which is in line with the definition used in McGuiness (2014). 5.5 Qualitative data To get a complementary view of the area covered in this thesis, we have conducted an interview with Head of Equity Capital Markets Tony Elofsson (Tony) and Investment Banking Associate Mathias Jensen-Vinstrup (Mathias) at Carnegie Investment Bank in Stockholm. The main topics of the interviews were the role and impact of cornerstone investors in Swedish IPOs and, in particular, why the concept has increased in popularity in recent years. In addition, the interviews also covered the data sample, underpricing and aftermarket performance of Swedish IPOs. When presenting the rationale behind looking at the Swedish market and using the cornerstone backed 36 EURm IPO of GARO as a benchmark for creating a cornerstone
39 compatible data set, Tony thought it sounded reasonable. As previously presented, the average underpricing in our sample is 10.6%. Tony refers to this as a classical IPO discount and not an anomaly as the name would suggest. The IPO discount is a part of the concept of creating a good start for both the company and the investors. The company going public is considered unexplored territory and the IPO discount serves to provide initial support for the issuance. Mathias adds to this that a majority of the selling shareholders usually do not sell all of their shares in IPOs but often maintain significant ownership, which is then sequentially decreased in the year(s) following the IPO. Private equity funds often return to the market, either to sell remaining shares in previously listed companies or to introduce new companies to the stock exchange, and a good reputation among investors will support such subsequent sell-downs. Such funds may also incur significant costs in the long run from being short-sighted and myopic when pricing any given IPO too aggressively. With regards to aftermarket performance, both Tony and Mathias highlight the difficulties of such calculations as they depend on the choice of benchmark. The strength of using company peers as a benchmark is that performance is measured against identical companies with similar exposure (Mathias), but the strength of using a market index may have a higher practical relevance for investors if the goal is to see how IPOs perform in relation to the market (Tony). Looking at the effects of cornerstone investors, Tony does not think that the IPO-valuation depends on whether cornerstone investors are present or not since sellers would only agree if the price was right. According to Tony, a possible explanation to the larger underpricing in cornerstone-backed transactions is that the stock trades at a higher price in the aftermarket when cornerstone investors are involved than it would if cornerstone investors would not have been present. This can be explained by looking at the underlying dynamics of the market, were the remaining market participants have to compete for a smaller number of shares when cornerstones are present, causing a natural excess demand, resulting in a higher share price that benefits both buyers and sellers (given that they have shares left in the company in the wake of the IPO). Looking at the topic from a behavioral perspective, Mathias emphasizes the importance of signaling, i.e. when professional investors buy a company, perceived risk by less professional and retail investors goes down since professional investors have approved the company
40 based on their due-diligence, valuation etc. This may have a positive effect on demand and, as a result, on the share price in the aftermarket. Good quality firms can afford this signal and will leave money on the table as a strategy to make them stand out from firms with lower quality. Since the main shareholder(s) rarely sell their entire stake in a company, the firms using this signal may have good chances to regain the loss from underpricing later when they decide to do a placing or a seasoned equity offering. Mathias also provide us with an alternative game theoretical approach that could potentially explain why cornerstonebacked offerings are more underpriced, saying that if there were no extra returns, why would cornerstone investors take the risk of being in a lock-up with their holdings for a given number of months following the IPO, as is usually the case for such investors? With regards to cornerstone investors effect on aftermarket performance, and why the IPOs in our sample outperform the market up to six months after the IPO, both Tony and Mathias emphasize that the cornerstone investors in Sweden during this time period is among the best investors in the business, and it would thus seem reasonable that they invest in high-quality firms that have the potential to outperform the market. When discussing potential moral hazard behavior by cornerstone investors due to their signaling power, i.e. demanding a lower price, both Tony and Mathias say that the competition among cornerstone investors to participate in offerings is very high, thus minimizing any potential power imbalance between cornerstone investors and the selling shareholders. 5.6 Limitations of the data set The following section includes criticism of our data set and how we have chosen to deal with these problems. One of the major limitations in our data set is that the IPOs have happened at different points in time, which naturally lowers comparability among observations. Since aftermarket performance is benchmarked against the Nasdaq OMX Stockholm Gross Index, it accounts for differences in underlying market conditions, making it more reliable. However, when measuring underpricing, i.e. FDOT performance, differences in underlying market conditions are not accounted for, which decreases the comparability. Since our data sample has two indirect periods, pre-and post-lifco s IPO, going from 0% of the transactions to 84% of the transactions having cornerstone investors, it is difficult to say how much of the underpricing difference that is caused by cornerstone investors, compared to the underlying market
41 conditions. The rationale behind our choice of time period is that it captures the post-financial crisis bull market trend and despite the fact that all the years are not perfectly comparable, the underlying fundamentals of the market have been similar, i.e. valuations have moved upwards and while the volatility has moved downwards. Thus, we deem the differences small enough to make the comparison interesting. Another issue with the data set is the limited size as it makes it harder to extract relevant information. One of the reasons for the limited number of transactions is that, until today, all cornerstone investor backed offerings have been equal to or above 36 EURm. Since the purpose of this thesis is to investigate the effect of cornerstone investors on underpricing, a smaller and more comparable sample outweighs the advantages of having a larger less comparable sample that would include transactions that would never be eligible for cornerstone investor commitment. Furthermore, once aftermarket performance had been measured, we decided that observations that had not been traded for six months would not be excluded from the data set. The argument behind this was that instead of excluding them, we included them in the sample for the time periods that they had been traded for. The reasoning behind this was to include as many observations as possible and hence make the study more reliable. Another risk related to the data was the risk of missing historical IPOs. This potential problem was handled by cross-referencing all the observations from Finansinspektionen with the IPO database of Bloomberg. By doing this, we mitigated the risk of missing out on any observations and thus could see if the listings were initial, switches, carve-outs or spin-offs. Last but not least, we discovered a potential problem related to the calculation of the abnormal returns. Walker and Yost (2008) have previously used a comparable index while Autore et al has used a set of comparable companies. Nevertheless, abnormal return depends on the reference portfolio, and thus the findings in this essay apply to IPOs relative a general index and do not necessarily reflect the relative effect versus a small group of nished companies. Due to the limited number of observations and differences among the companies in market capitalization, transaction size, industry etc, the Nasdaq OMX Stockholm Gross Index is used to maximize practical relevance.
42 6. Results The following section presents the results of this thesis. The findings are presented in accordance with the top-down approach used throughout this essay. First, results about underpricing are presented, followed by results regarding aftermarket performance. Lastly, results from the regressions that measure underpricing as a function of market cap, percent of company sold and cornerstone presence are presented. 6.1 Underpricing Average underpricing per segment With and without cornerstones With cornerstones Without cornerstones All companies 10.6% 14.6% 5.4% Large cap 11.7% 7.8% 15.7% Mid cap 10.5% 13.7% 5.5% Small cap 10.6% 23.9% 1.7% Table 4: Average Underpricing of Swedish IPOs with offer size equal to or above 36 EURm Hypothesis Groups n Equally weighted max min I All % 48% -17% p-stat II a) Large cap % 22% 0% p-stat II b) Mid cap % 48% -7% p-stat II c) Small cap % 40% -17% p-stat Table 5: Average Underpricing Swedish IPOs with offer size equal to or above 36 EURm, divided by market cap
43 Above, average underpricing for the four groups, and thus the result for hypotheses I to II (c) are presented. P-stat refers to the statistical significance level, max refers to the largest underpricing observation in each group while min refers to the smallest underpricing observation in each group. The statistical tests have been performed on equally weighted averages. As previously described, we first test on a national level whether underpricing exist. Looking at Table 5, accounting for all observations in the sample, with no restrictions to either market cap or cornerstone presence, average underpricing is measured to be 10.6% at the strongest possible statistical significance. Thus, the rejection of the null hypothesis confirms that underpricing is statistically significant in Swedish IPO transactions exceeding or equal to 36 EURm. This number is also supported by both Carnegie bankers and previous academic. When underpricing on a national level now has been concluded, we test whether this phenomenon exists in the large, mid and small cap segment. The large cap segment does not contain enough observations to conduct a parametric t-test. For the Mid cap segment, underpricing is observed and statistically significant at the strongest statistical level, confirming that underpricing exist in Swedish mid cap IPO transactions. As for the small cap segment, underpricing is observed, but the limited sample size stops us from making any conclusions about underpricing in Swedish small cap transactions exceeding or equal to 36 EURm. 6.2 Post-IPO Performance Below we present the aftermarket performance on the time horizons one week, one month, three months and six months, presented in BHAR. P-stat is, as previously mentioned, the significance level at which the null hypothesis can be rejected. Table 6, shows aftermarket performance if investors were given shares in the IPO and Table 7 shows aftermarket performance given that investors were not given any shares and instead purchased the shares on the FDOT closing price, answering whether investors can miss the FDOT underpricing, buy in on day two and still generate positive abnormal returns.
44 Time period Hypothesis Groups BHAR 1W BHAR 1M BHAR 3M BHAR 6M III All 12,2% 11,4% 16,2% 24,4% p-stat IV a) Large cap 11,0% 8,7% 4,7% 7,2% p-stat ** IV b) Mid cap 12,5% 11,7% 16,9% 25,4% p-stat *** *** *** *** IV c) Small cap 11,3% 11,0% 17,8% 27,0% p-stat ** ** ** ** Table 6. BHAR IPO prospectus price (Equally Weighted) As with underpricing, we first test on a general level whether abnormal returns can be observed, independent of size. Looking at Table 6, accounting for all observations in the sample, with no restrictions to either market cap or cornerstone presence, positive BHAR is observed on all time horizons with the strongest possible statistical significance, confirming positive BHAR on Swedish IPO transactions exceeding or equal to 36 EURm based on the issue price. Following the BHAR on a general level, we test whether the same phenomena can be concluded in the large, mid and small cap segments. In the mid cap segment, we observe a positive BHAR on all time horizons with the strongest statistical significance, confirming positive aftermarket performance in Swedish mid cap IPOs given that investors get allocation on FDOT. As for small cap companies, positive BHAR is observed for all time horizons with 5% significance. However, due to the limited number of observations in the small cap segment, we do not draw any conclusions based on this data set.
45 Time period Groups BHAR 1W BHAR 1M BHAR 3M BHAR 6M All 1.4% 0.46% 4.4% 11.1% p-stat ** ** Large cap -0.4% -2.6% -6.6% -4.7% p-stat Mid cap 1,7% 1,0% 5,4% 12,9% p-stat *** ** *** *** Small cap 0,7% -0,5% 4,3% 9,4% p-stat Table 7. BHAR FDOT+1 (Equally Weighted) Following the results of BHAR if investors receive shares at FDOT+1 closing price, we now present evidence whether investors can purchase in the aftermarket as of day two and still receive positive abnormal returns. The results are found in Table 7 and as we can see, in general, Swedish IPOs above or equal to 36 EURm have positive BHAR on three and six months time horizons with a significance level of 5%, giving strong indications that investors can buy shares post-fdot and still make positive abnormal returns on their investment. As for the segments large, mid and small cap, positive BHAR is observed on all time horizons in the mid cap segment with the strongest statistical significance except for the one week period which can be rejected at 5% significance. As for large and small cap, no statistical significance is observed, and thus we can not draw any conclusions regarding aftermarket performance in these segments if investors purchase shares at the FDOT+1 closing price. 6.3 Effects of Cornerstone Investors, Market Cap and Percent of Company Sold Below we present one of the conducted cross sectional regression models that measure underpricing and aftermarket performance as a function of cornerstone involvement, percent
46 of company sold and market capitalization. All regressions have been checked for normal distribution and heteroskedasticity, all samples are normally distributed and homoskedastic. Groups Underpricing BHAR 1W BHAR 1M BHAR 3M BHAR 6M Cornerstone p-stat ** ** ** ** Company % p-stat Market Cap Log p-stat R-squared Adjusted R-squared No. observations Table 8. IPO prospectus price - all companies Observing the table above, we see the regression results of how cornerstone presence, market cap and percent of company offered affect underpricing and aftermarket performance on all IPOs exceeding or equal to 36 EURm, including FDOT. All statistically significant values have been confirmed using White standard errors. Starting with underpricing, we find strong statistical support that cornerstone investors have a positive relationship with underpricing. For small cap transactions, we observe statistical support that cornerstone investors have a positive relationship with underpricing. For large and mid cap transactions, no statistical significance is observed. Implications and possible explanations for this will be further discussed in the Analysis. As for aftermarket performance, the results are similar to the ones of underpricing. For all time horizons except one week, we find that cornerstone investors have a positive effect on aftermarket performance, statistically significant on the 5% level. Looking at large, mid and small cap transactions separately, we find that cornerstone investors in small cap transactions
47 have a positive relationship with aftermarket performance, at 5% significance level on one week, one month and six months and 1% significance level on three months. Looking at aftermarket performance, from the FDOT closing price, presented in figure 1 in the appendix, we see no significant effect of cornerstone investors on any of the time periods observed. However, the percent of company offered has a significant effect on a three-month time period. Looking at the segments separately, cornerstone investors have a significant effect on three and six months in the small cap transactions and the percent of a company offered has a significant effect in the mid cap segment on a three-month time horizon. 7. Analysis 7.1 Underpricing As previously mentioned, IPO underpricing is and has been a frequently discussed topic by both professionals and academia. The outline of the following section will be about underpricing in Swedish IPO transactions exceeding or equal to 36 EURm and cover previous academia, comments from Carnegie bankers and recent market evidence. To summarize, underpricing seems to be affected by both economical and behavioral causes as well as market participants. Previous academia that has covered underpricing include Ritter (1991) and Westerholm (2006). Ritter (1991) conducted research on more than 5000 IPOs worldwide between 1960 and 1982 to examine whether underpricing was a stylized fact on other markets than the U.S market. The study reported average returns of 18.8% on FDOT. Westerholm (2006) conducted a similar study on the Nordic market and concluded that underpricing, on average, during the period was about 17%, well in line with the results previously made by Ritter (1984). The results presented in this thesis indicate that average underpricing on Swedish IPO transactions, exceeding or equal to 36 EURm, is about 10.6%. One of the previously mentioned theories that could explain this difference is the one presented by Guo (2011). Guo had an economical approach to explain underpricing and claimed that underpricing can be
48 explained by the difference in cost of capital for owners before and after IPOs. When Westerholm (2006) conducted his research, the majority of companies going public was venture capital-backed IT companies. Today, however, it is much more common that portfolio companies of regular buyout firms go public. Since venture capital funds have a higher cost of capital than regular buyout firms, it seems reasonable that average underpricing is lower today compared to when the majority of IPOs was venture capital-backed. A behavioral approach to explain underpricing is the one presented by Affleck-Graves et al. (1996) and Krigman et al. (1999) who emphasized the importance of creating positive investor demand and momentum in an IPO. According to research made by Krigman, poor initial momentum will harm stock price development for a six-month time period post-ipo. The underpricing is further explained by Akerlof s (1970) market for lemons theory, which states that underpricing is a way to compensate for the uncertainty related to an IPO, this is also supported by Loughran & Ritter (2003) who claimed that underpricing is a result of the risks investors takes on in an IPO. When discussing the results and previous academia in our essay with Carnegie bankers, they comment that the IPO discount, i.e. underpricing, observations are normal and completely in line with industry professional expectations, ranging between 5-10%. They also confirm the theories presented by Affleck-Graves et al. (1996) and Krigman et al. (1999) that a modest amount of underpricing improve momentum and create a good aura, thus the underwriter can if necessary use price stabilization measures. Recent market evidence confirming the importance of the IPO discount to give a good start and create a good aura surrounding the offering is the case with Bactiguard who went public in Bactiguard s stock dropped 17% during FDOT and was called a total failure by Swedish media (Svenska Dagbladet, 2014). This failure has not only created a bad aura surrounding Bactiguard but also the responsible investment bank, causing it to have difficulties getting new mandates. 7.2 Post-IPO Performance The results observed regarding aftermarket performance in this thesis differ depending on whether you get allocation on the FDOT or have to purchase shares in the aftermarket as of FDOT+1. Given that you get allocation on the FDOT, positive BHAR is statistically
49 significant for all time horizons. Aftermarket performance, given that you have to purchase shares in the aftermarket as of FDOT+1, show positive statistically significant BHAR on the three and six months time horizons. Looking at large, mid and small cap separately, positive and statistically significant BHAR is observed in the mid cap segment on all time horizons if purchased on FDOT and on all time horizons except one week if purchased in the aftermarket as of FDOT+1, indicating that retail investors can purchase shares in the aftermarket and still make positive abnormal returns. Statistical proof of positive abnormal returns in the small and large cap segment on one-week time horizon is observed if purchased on the FDOT, however, due to the limited number of observations in the subgroups, no conclusions are drawn. Previous studies that have examined aftermarket performance include Ritter (1991) and Loughran and Ritter (1995). In these studies, evidence of negative long-term abnormal returns is presented on a one to five-year time horizon. This is further strengthened by the findings made by Westerholm (2006) who found evidence of negative abnormal returns among Swedish IPOs made between Despite strong indications of negative BHAR in the long term, the results in this thesis show positive BHAR on all time horizons. Though this is interesting, the results do not contradict with each other since they both occur at different points in time and measure different time horizons. The results aline previous findings by Levis & Gumpers (2003) and Levis (2011) who found no evidence of IPO underperformance. Furthermore, Buser and Chan (1987) found evidence of outperformance on a two-year period, which is aligned with the results of this study. The findings in this thesis were discussed with the Carnegie bankers to get further clarity on what a potential reason for this could be. Historically, IPO-booms have been characterized by strong economic fundamentals and thus the period following an IPO-boom is often characterized by a downturn in the economy. According to the Carnegie bankers, what usually happens in economic downturns is that investors, both institutional and retail, sell companies with short unproven track record and buy companies with a long history of proven track record. This could partly explain the findings of Ritter (1991) and Loughran & Ritter (1995) since their underperformance findings were based on a longer time period and thus the chance of being struck by a financial downturn is higher, which leads investors to, as explained by the employes of Carnegie, to sell newly issued companies and instead invest in
50 more established and well-known ones. Whether these findings, which also were made by Westerholm (2006) who employed a longer time horizon of five years, are still relevant will be possible to see during the next economic downturn. 7.3 Effect of Cornerstone Investors, Market Cap and Percent of Company Sold Underpricing The observed results in this thesis indicate that cornerstone investor-backed IPOs experience more underpricing than transactions without cornerstone investors. Previous cornerstonefocused studies have almost exclusively conducted research on the Chinese market, and due to the limited amount of research on this topic in Sweden, we feel that this has been the most interesting about our findings. Tan and Ong (2013) implied that cornerstone investors can be seen as a sign of quality and that they play an important role in creating demand among investors. Due to the certification power of the cornerstone investors, mitigating the risks of information asymmetry and winner's curse, the argument could be made that the risk premium, i.e. underpricing demanded by investors should be lower. This claim is supported by McGuinness (2014), observing that cornerstone backed IPOs have higher valuation multiples than IPOs without cornerstone investors. The increased underpricing in cornerstone backed IPOs can also be related to the principalagent theory since the underwriter wants to maintain their relationships with cornerstone investors. Even if the cornerstone investors can buy in at a price below the price offered in the IPO prospectus they are still keen on having a successful IPO, with a positive momentum effect (Affleck-Graves et al., 1996). The relationship between the underwriter and the cornerstone investor could lead to even more underpricing, compared to an IPO without cornerstone investors, where there are no cornerstone investors to consider. Beatty and Ritter (1986) argued that investment banks that underprice too much lose mandates, thus the same logic should hold when looking at the new cornerstone phenomenon and the related relationships that investment banks also needs to consider.
51 During our interview session, the Carnegie bankers said that cornerstone investors act as a positive signal and a form of insurance since a large portion of the firm is already sold pre- IPO, and that the price for this insurance potentially translates into underpricing. This is in line with Megginson & Weiss (1991), who explained that the usage of cornerstone investors sends good quality signals. In cases where companies are considered controversial, e.g. private healthcare, the rationale behind using a cornerstone investor is to signal high quality and lower the controversy. Naturally, more risky objects cost more to insure and thus, in these transactions, both underpricing and cornerstone involvement tend to be high, translating to high insurance costs Post-IPO Performance With regards to cornerstone investors effect on aftermarket performance, we observe statistically significant evidence that cornerstone investors have a positive effect on aftermarket performance on all time horizons except one week. This despite the relatively low number of observations in our sample. The findings in this thesis are further supported by the theories of Loughran and Ritter (2003), claiming that the optimal way for underwriters to conduct IPOs is to sell the shares to investors who will not flip them in the aftermarket. The post-ipo performance of cornerstone investor-backed IPO s is further supported by McGuiness (2014) who found that IPOs backed by cornerstone investors have higher earnings growth, which, together with Tan and Ong s (2013) findings of cornerstone investor backed IPOs having more sustainable earnings growth, supports the findings of this study. Thus, we can conclude that the signals of quality that cornerstone investor participation in IPOs sends seems to be justified, based on their post-ipo performance Percent of Company Sold The percentage of a company offered in an IPO has a significant effect on a three-month period given that investors purchase shares on FDOT +1, while all the other time periods can not be statistically proved, indicating that we should be cautious when making conclusions about the results displayed on a three-month time horizon. These findings contradict Habib and Ljungqvist (2001) who found that underpricing, in their study, could be explained by the amount of company stock that the owners wanted to sell, where a higher percentage of the stocks being sold resulted in less underpricing. Ljungqvist and Wilhelm (2003) also presented evidence supporting that as the percentage of a firm offered increased, the amount of
52 underpricing decreased. The results of this study are in line with the incentives of firm owners who want to gain short term profits, and as a result of this finds that the IPO profits outweighs the effects of having a negative share price momentum effect, since the share in such a case is less underpriced (Affleck-Graves, 1996). 8. Conclusion This study confirms, as previously stated by Westerholm (2006), that underpricing on the Swedish market still exists, however, it seems as if the underpricing, which in Westerholm s study were approximately 17% between , today has decreased since the data sample in this study showed underpricing of 10,6% once adjustments for size had been made, which can have an explanatory reason for the decreased underpricing. Cornerstone investor-backed IPOs showed, quite surprisingly, that the level of underpricing is higher in IPOs were cornerstone investor participate. One explanation of this can be that the cornerstone investors are often used in issues related to controversial sectors such as the private healthcare and education industry. Due to the level of controversy, the need of having cornerstone investors to signal quality is higher, and as the risks in such issues can be seen as high. Thus, the demand of a higher level of underpricing is still needed, which is supported by the investment bankers of Carnegie. Additionally, this thesis concludes that the post-ipo performance significantly outperforms the benchmarking index (OMX Stockholm GI) on all time periods if the investor gets allocation on the FDOT. These findings also hold for all cornerstone investor-backed IPOs for all time periods except the one-week time period. If the investor, which often is the case for retail investors in popular issues, would not get the allocation on the first day of trading, the study concludes that investing on FDOT+1 still is a profitable strategy on a three and six months time horizon. These findings are of relevance since previous studies, at the best of our knowledge, only have used the FDOT in their aftermarket performance research. Thus, this study clarifies that investing in IPOs on the Swedish market can still be a profitable investment strategy even if the initial allocation is limited. Previous research related to cornerstone investors is very limited and mostly based on the Asian market. Thus, this study contributes by examining the potential effects that cornerstone investors contribute with.
53 Since the cornerstone investor phenomenon is relatively new this has, by obvious reasons, resulted in a limited data sample, which complicates statistical tests. However, this study can conclude that participating in Cornerstone investor-backed issues is a good investment strategy both with regards to increased level of underpricing as well as the post-ipo performance. Hypothesis Underpricing Support α I Underpricing is present in Sweden between Yes 1% II (a) Underpricing is present on Nasdaq OMX Stockholm No n.a. Large cap between II (b) Underpricing is present on Nasdaq OMX Stockholm Yes 1% Mid cap between II (c) Underpricing is present on Nasdaq OMX Stockholm Small cap between No n.a. Hypothesis Aftermarket Performance Support α III Swedish IPOs outperform the market on a short to Yes 1% medium term basis IV (a) Transactions on the Swedish Large cap outperform the No n.a. market on a short to medium -term basis IV (b) Transactions on the Swedish Mid cap outperform the Yes 1% market on a short to medium -term basis IV (c) Transactions on the Swedish Small cap outperform the market on a short to medium -term basis No n.a. Hypothesis Effect of cornerstone investors on underpricing Support α V Underpricing in Swedish IPOs is higher with Yes 1% cornerstone investors VI (a) Underpricing in IPOs on the Swedish Large Cap is No n.a. higher with cornerstone investors VI (b) Underpricing in IPOs on the Swedish Mid Cap is Yes 5% higher with cornerstone investors VI (c) Underpricing in IPOs on the Swedish Small Cap is higher with cornerstone investors Yes 5%
54 Hypothesis VII VIII (a) VIII (b) VIII (c) Effect of cornerstone investors on aftermarket performance The level of aftermarket performance in Swedish IPOs is higher with cornerstone investors Aftermarket performance on the Swedish Large Cap is higher with cornerstone investors Aftermarket performance on the Swedish Mid Cap is higher with cornerstone investors Aftermarket performance on the Swedish Small Cap is higher with cornerstone investors Support α Yes 1% No n.a. Yes 1% Yes 5% Hypothesis Effect of cornerstone investors on aftermarket Support α performance IX Underpricing in Swedish IPOs has a negative No n.a. relationship with percent of company sold X (a) Underpricing in IPOs on the Swedish Large Cap has No n.a. a negative relationship with percent of company sold X (b) Underpricing in IPOs on the Swedish Mid Cap has a No n.a. negative relationship with percent of company sold X (c) Underpricing in IPOs on the Swedish Small Cap has No n.a. a negative relationship with percent of company sold 8.1 Implications As mentioned in the research contribution chapter, this thesis aimed to research whether underpricing still exist in Sweden and whether investing in Swedish IPOs could be a successful investment strategy, both given that you get allocation on FDOT and FDOT+1. Furthermore, our ambition was to see whether market cap, percent of company sold and most importantly, cornerstone investors affect underpricing and aftermarket performance. Based on the findings in this thesis, we find strong evidence that underpricing still occur on the Swedish IPO market. We also find that investors not only can get abnormal market returns if investing on FDOT but also on three to six months given that investment is made at FDOT+1. Finally, we find evidence supporting that cornerstone investor-backed IPOs are more underpriced and perform better in the aftermarket given that you get allocation on FDOT.
55 Thus, based on our findings, our recommendation for investors is to pursue an IPO investment strategy backed by cornerstone investors as long as you can get allocation equal to or below the FDOT+1 price and hold three to six months. 8.2 Suggestions for further research Since the cornerstone investor phenomena are quite unexplored when it comes to studies based on the European markets, there are several interesting areas that can be further examined once the data set has increased in size. An interesting approach would be to study the post-ipo performance on a longer time period, which would make it comparable to previous studies that have used a longer time period. By doing this, potential conclusions can be drawn regarding the aftermarket performance on a longer time horizon, since cornerstone backed issues should signal that the firms are of high quality, which has been proved on other geographical markets. This could contradict previous studies that have concluded that IPOs underperform their corresponding benchmark on a longer time horizon of two to five years. By doing this, future research would also be able to consider the potential effects of expiring lock-up agreements. An additional approach could be to study how the valuation multiples are affected by cornerstone investors, by investigating whether if the multiples statistically differs from their peers when a cornerstone investor participates in an issue. McGuiness (2012, 2014) was one of the first to research cornerstone investors, based on the Asian market, where he used Tobin s Q to measure the valuation. McGuiness concluded that cornerstone investor-backed IPOs had higher multiples. Thus, it would be interesting to see if the same holds for the European markets as well. Lastly, another relevant area of research would be to examine if the earnings growth of cornerstone investor-backed firms outperforms non-cornerstone backed firms since the cornerstone phenomena should signal that the firms are of high quality. This could be done with inspiration from Tan and Ong (2013) who found that cornerstone backed firms had more sustainable earnings growth. Lastly, based on the theories displayed by Tony Elofsson at Carnegie Investment Bank regarding market dynamics, it would be interesting to see whether if the increased underpricing is the effect of limited ability to shortsell the issuance.
56 9. References Affleck Graves, J., Hegde, S., and Miller, R. E. (1996). Conditional price trends in the aftermarket for initial public offerings. Financial Management, pp Ahmad-Zaluki, A., Campbell, K., Goodacre, A., The Long Run Share Price Performance of Malaysian Initial Public Offerings (IPOs). Journal of Business Finance & Accounting. Jan- Mar. 2007, Vol. 34. Issue 1/2, p Akerlof, G., The Market for Lemons : Quality Uncertainty and the Market Mechanism. The Quarterly Journal of Economics, Vol. 84. No. 3 (Aug 1970), pp Allen, F. and Faulhaber G.R., Signaling by underpricing in the IPO market. Journal of financial economics 23, pp Autore, D. M., Shome, D. K., & Kumar, R. (2008). The revival of shelf-registered corporate equity offerings. Journal of Corporate Finance, 14, Barber, B.M. & Lyon, J.D. 1996, Detecting long-run abnormal stock returns: The empirical power and specification of test statistics, Journal of Financial Economics, Vol. 41. No.3, pp Baron, D.P., 1982, A Model of the Demand for Investment Banking Advising and Distribution Services for New Issues, Journal of Finance 37, Beatty, R.P. Ritter, J.R., Investment banking, reputation, and the underpricing of initial public offerings, J. Financ. Econ. 15, Beatty, Randolph P., and Jay R. Ritter, 1986, Investment banking, reputation, and the underpricing of initial public offerings, Journal of Financial Economics 15, Benveniste, L.M., and P.A. Spindt, 1989, How Investment Bankers Determine the Offer Price and Allocation of New Issues, Journal of Financial Economics 24, Bergström, C., Nilsson, D. & Wahlberg, M. 2006, "Underpricing and Long-Run Performance Patterns of European Private-Equity-Backed and Non-Private-Equity-Backed IPOs", Journal of Private Equity, vol. 9, no. 4, pp Berk, J., DeMarzo, P. (2014). Corporate Finance. 3: rd edition. Harlow: Pearson Education Limited. 3rd Edition.
57 Biais, B., P. Bossaerts, and J.-C. Rochet, 2002, An Optimal IPO Mechanism, Review of Boehmer, B., Boehmer, E., and Fishe, R. P. (2006). Do institutions receive favorable allocations in IPOs with better long-run returns? Journal of Financial and Quantitative Analysis, 41(04) pp Booth, J.R., and R. Smith, 1986, Capital Raising, Underwriting and Certification Hypothesis, Journal of Financial Economics 15, Brav, A., Geczy, C. & Gompers, P.A. 2000, "Is the abnormal return following equity issuances anomalous?, Journal of Financial Economics, vol. 56, no. 2, pp Brown, Stephen J. and Jerold B. Warner, 1980, Measuring security price performance, Journal of Financial Economics 8, Brown, Stephen J. and Jerold B. Warner, 1985, Using Daily Stock Returns: The Case of Event Studies. Journal of Financial Economics 14(1):3-31. February Buser, S. and Chan, K. (1987). Nasdaq/nms qualication stand, ohio registration experience and the price performance of initial public offerings. Ohio Department of Commerce and National Association of Securities Dealers Inc., Columbus Campbell, Cynthia J. and Charles E. Wasley, Measuring security price performance using daily NASDAQ returns, Journal of Financial Economics 33, Cao, J. & Lerner, J. 2009, "The performance of reverse leveraged buyouts", Journal of Financial Economics, vol. 91, no. 2, pp Carter, R. Manaster, S Initial public offerings and the underwriter reputation, J. Financ. 45 (4) Carter, R.B., Dark, F.H., Singh. A.K., Underwriter reputation, initial returns, and the long-run performance of IPO stocks. J.Financ. 53 (1) Certo, S. T., Holcomb, T. R., and Holmes, R. M. (2009). Ipo research in management and entrepreneurship: Moving the agenda forward. Journal of Management. Journal of Management. Oct 19. Chee Keong, L. (2009). Cornerstone investors and initial public offerings on the stock exchange of Hong Kong. Fordham Journal Of Corporate & Financial Law, 14(3), Cohen, Boyd D. and Dean, Thomas J. Information asymmetry and investor valuation of IPOs: Top Management Team Legitimacy as a Capital Market Signal. Strategic Management Journal, 7/1/2005, Vol. 26, Issue 7, p
58 Conover, W. J., Practical nonparametric statistics. New York: Wiley. 3rd Edition. Cowan, A.R. & Sergent, A. 2001, "Interacting biases, non-normal return distributions and the performance of tests for long-horizon event studies, Journal of banking & finance, vol. 25, no.4, pp Dierkens N. (1991). Information asymmetry and equity issues. Journal of Financial and Quantitative Analysis vol.26. pp Dodge, Y., The Concise Encyclopedia of Statistics. 1st ed. Neuchatel: Springer Science + Business Media, LLC. Fama, E.F. 1998, "Market efficiency, long-term returns, and behavioral finance", Journal of Financial Economics, vol. 49, no. 3, pp Francis B, Hasan I, Li, F (2001): Underpricing of Foreign and Domestic IPOs in the U.S. Market: Empirical Evidence. Financial Markets, Institutions and Instruments, 10:1-18. Gompers, P.A. & Lerner, J. 2003, "The really long-run performance of initial public offerings: The pre-nasdaq evidence", The journal of finance, vol. 58, no. 4, pp Guo, H. (2011). IPO first-day return and ex ante equity premium. Journal of Financial and Quantitative Analysis, 46(03): Habib, M.A., and A. Ljungqvist, 2001, Underpricing and Entrepreneurial Wealth Losses in IPOs: Theory and Evidence, Review of Financial Studies 14, Harvard Business Review (2014). Focusing Capital on the Long Term. [Online; 22-Mar-2016]. Ibbotson, R.g:, 1975, Price Performance of Common Stock New Issues, Journal of Financial Economics 2, Keloharju, Matti. (1993) The winner s curse, legal liability and the long-run price performance of initial public offerings in Finland. Journal of Financial Economics, Vol.34. Issue2. October pp Kothari, S. & Warner, J.B. 1997, "Measuring long-horizon security price performance", Journal of Financial Economics, vol. 43, no. 3, pp Krigman, L., Shaw, W. H., and Womack, K. L. (1999). The persistence of ipo mispricing and the predictive power of flipping. The Journal of Finance, 54(3):
59 Lee, P.M., and S. Wahal, 2003, Grandstanding, Certification and the Underpricing of Venture Capital Backed IPOs, Journal of Financial Economic, forthcoming. Leleux, B.F. and D.F. Muzyka (1997) European IPO Markets: The Post-Issue Performance Imperative. Entrepreneurship: Theory and Practice, 21:4 pp Levis, M. 2011, "The Performance of Private Equity-Backed IPOs", Financial Management, vol. 40, no. 1, pp Ljungqvist, A. and W.J. Wilhelm, 2003, IPO pricing in the Dot-Com Bubble, Journal of Finance 58, Ljungqvist, A., IPO Underpricing: A Survey, Handbook in Corporate Finance: Emprical Corporate Finance, B., Espen Eckbo, ed., Forthcoming, Logue, Dennis E., 1973, On the pricing of unseasoned equity issues: , Journal of Financial and Quantitative Analysis 8, Loughran, T. and Ritter, J. R. (2003). Why has IPO underpricing changed over time? Financial Management, Vol. 33, Issue 3. Loughran, T., Ritter, J.R., The New Issues Puzzle. The Journal of Finance Vol. 50 Issue 1, March 1995, pp Loughran, Tim, Jay R. Ritter, and Kristian Rydqvist, 1994, Initial public offerings: International insights, Pacific-Basin Finance Journal 2, Lowry, M., Schwert, W.G., IPO Market Cycles: Bubbles or Sequential Learning?, The Journal of Finance, Vol LXVII No.3. June Lowry, Michelle. and Cambridge, Mass. IPO market cycles: bubbles or sequential learning, National Bureau of Economic Research, McDonald, J. G., and A. K. Fisher, 1972, New-issue stock price behavior, The Journal of Finance 27, McGuiness, P.B. (2012) The role of cornerstone investors and the Chinese state in the relative underpricing of state- and privately controlled IPO firms. Applied Financial Economics Vol. 22, Issue 18 McGuiness, P.B. (2014) IPO firm value and its connection with cornerstone and wider signaling effects. Pacific Basin Finance Journal, 27:
60 Megginson, W., and K.a. Weiss, 1991, Venture Capitalist Certification in Initial Public Offerings, Journal of Finance 46, Muscarella, C.J. and M.R. Vetsuypens, 1989, A Simple Test of Baron s Model of IPO Underpricing, Journal of Financial Economics 24, Otchere, I., Owusu - Antwi, G. & Mohsni, S. 2013, "Why are stock exchange IPOs so underpriced and yet outperform in the long run?", Journal of International Financial Markets, Institutions and Money, vol. 27, pp Reilly, Frank K., and Kenneth Hatfield, 1969, Investor experience with new stock issues, Financial Analysts Journal 25, Ritter, J. R. (1991). The long-run performance of initial public offerings. The journal of finance, 46(1):3{27. Ritter, Jay R., 1984, The "hot issue" market of 1980, The Journal of Business 57, Ritter, Jay R., and Ivo Welch, 2002, A review of IPO activity, pricing, and allocations, The Journal of Finance 57, Rock, K. (1986). Why new issues are underpriced. Journal of financial economics, 15(1): Schultz, P. 2003, "Pseudo market timing and the long-run underperformance of IPOs", The Journal of Finance,vol. 58, no. 2, pp Schöber, T. (2008). Buyout-Backed Initial Public Offerings. PhD thesis, University of St. Gallen. Tan, T.-G. and Ong, J. (2013). Cornerstone investors in ipos an asian perspective. Capital Markets Law Journal, 8(4):427{449. The relationship between IPO returns and factors influencing IPO performance: case of Istanbul Stock Exchange (PDF Download Available). Available from: s_and_factors_influencing_ipo_performance_case_of_istanbul_stock_exchange [accessed Jun 8, 2017]. Thomadakis, S., Nounis, C., Gounopoulos, D., Long-term Performance of Greek IPOs. European Financial Management. Jan 2012, Vol. 18 Issue 1, pp Titman, S., and B. Trueman, 1986, Information Quality and the Valuation of New issues, Journal of Accounting and Economics 8,
61 Van der Geest, R. and Van Frederikslust, R. A. (2001). Initial returns and long-run performance of private equity-backed initial public offerings on the amsterdam stock exchange. Van Horne, J.C., Wachowicz, J.M. (2005). Fundamentals of Financial Management, twelfth edition. Harlow: Pearson Education Limited Walker, M.D., Yost, K., Seasoned Equity Offerings: What firms say, do and how the market reacts. Journal of Corporate Finance, Vol. 14., Issue 4, pp Welch, 1989, Seasoned offerings, imitation costs and underpricing of initial public offerings. Journal of finance, 44: Westerholm, P. J. (2006) Industry clustering in nordic initial public offering markets. International Review of Finance, &(1-2): Digital References Bloomberg, May 8th, Nordic Listings on Path to New Record Year Amid Swedish Business Standard, November 27, Last Updated at 3:59 PM. IPO Boom _1.html CNN, 9th November, The $1.7 trillion dot.com lesson Last Updated at 5:24 AM. Dagens Industri, June 14th, Nytt börsförsök för Lauritz.com Dagens Industri, January 26th, Småsparare förlorar på ankarinvesterare
62 Financial Times, March 15th, Cornerstone IPO structure may be Asia s latest export Last Updated 1:46PM Financial Times, August 28th, Cornerstone investors surger for HK IPOs Last updated 2:30PM U.S. Securities and Exchange Comission. January 22th, Securities and Exchange Comission v. Credit Suisse First Boston Corporation Svenska Dagbladet, August 15th, Dyster börsresa för Bactiguard.
63 10. Appendix 10.1 List of tables Table 10: Data sample The table below present the 57 IPOs used in this thesis. For each IPO, we present listing date, market cap at offer, transaction size, percent of company sold and whether cornerstone investors have been present or not. Issuer Name Listing Date (INTL) Market Cap EURm Transaction Size EURm Cornerstone Investor Percent of company sold MIPS AB 23-Mar ,1 68,8 No 49% Oncopeptides AB 22-Feb ,8 68,7 Yes 36% Edgeware AB 09-Dec-16 44,9 43,7 Yes 61% Volati AB 30-Nov ,7 122,9 Yes 26% Serneke Group AB 24-Nov ,4 65,3 Yes 26% Alligator Bioscience AB 23-Nov ,0 48,0 Yes 20% THQ Nordic AB 22-Nov ,6 44,2 Yes 30% Ahlsell AB 28-Oct ,0 755,5 No 36% Internationella Engelska Skola 29-Sep ,7 62,6 Yes 25% AcadeMedia AB 15-Jun ,1 117,9 Yes 25% TF Bank AB 14-Jun ,4 50,8 Yes 30% Nordic Waterproofing Holding A 10-Jun ,1 115,2 Yes 60% Paradox Interactive AB 31-May ,5 58,0 No 15% Wilson Therapeutics AB 12-May ,0 48,2 No 34% Resurs Holding AB 29-Apr ,0 408,2 Yes 32% Humana AB 22-Mar ,4 91,5 Yes 27% LeoVegas AB 17-Mar ,0 107,0 Yes 29% GARO AB 16-Mar-16 78,2 36,0 Yes 46% Catena Media 11-Feb ,7 104,9 Yes 67% Camurus AB 03-Dec ,4 66,9 Yes 30% Scandic Hotels Group AB 02-Dec ,5 326,1 Yes 44% Attendo AB 30-Nov ,4 514,4 Yes 60% Dometic Group AB 25-Nov ,0 589,3 Yes 37% Bravida Holding AB 16-Oct ,3 342,2 No 40% CLX Communications AB 08-Oct ,8 90,1 Yes 44% Capio AB 30-Jun ,4 271,1 Yes 38% Pandox AB 18-Jun ,5 661,1 Yes 80% Nobina AB 18-Jun ,9 219,9 No 71% Nordax Group AB 17-Jun ,3 275,7 Yes 52% Alimak Group AB 17-Jun ,6 230,1 Yes 53% Coor Service Management Holdin 16-Jun ,1 243,4 No 63% Collector AB 10-Jun ,8 110,7 Yes 19% Tobii AB 24-Apr ,9 56,4 Yes 23% Troax Group AB 27-Mar ,2 90,7 Yes 54% Hoist Finance AB 25-Mar ,5 307,4 Yes 63% Evolution Gaming Group AB 20-Mar ,8 158,8 Yes 50% Dustin Group AB 13-Feb ,3 212,8 Yes 52% Eltel AB 06-Feb ,1 312,7 Yes 67% Thule Group AB 26-Nov ,4 197,2 No 26% Lifco AB 21-Nov ,4 460,7 Yes 50% Granges AB 10-Oct ,9 237,8 No 69% Inwido AB 26-Sep ,4 288,1 No 65% Scandi Standard AB 27-Jun ,0 176,1 No 57%
64 Bactiguard Holding AB 19-Jun ,9 52,7 No 43% Com Hem Holding AB 17-Jun ,6 689,1 No 50% Besqab AB 12-Jun ,6 42,8 No 33% D Carnegie & Co AB 09-Apr ,2 77,2 No 65% Recipharm AB 03-Apr ,0 189,7 No 0%* Hemfosa Fastigheter AB 21-Mar ,7 411,5 No 59% Bufab AB 21-Feb ,1 144,7 No 63% Platzer Fastigheter Holding AB 29-Nov ,1 64,8 No 23% Transmode AB 27-May ,2 58,3 No 35% Bulten AB 20-May ,9 64,8 No 57% Karolinska Development AB 15-Apr ,7 67,7 No 0%* MQ Holding AB 18-Jun ,6 64,8 No 47% Byggmax Group AB 02-Jun ,9 140,0 No 43% Arise AB 24-Mar ,7 60,6 No 0% *For companies with 0% of company sold, it simply means that they have not sold any secondary shares but only issued new primary shares. Table 11: Descriptive statistics FDOT The table below present the descriptive statistics for all our data samples with regards to average underpricing and BHAR, median, maximum and minimum values, divided by whether cornerstone investors have been present or not Average Underpricing With and without With Cornerstones Without Cornerstones cornerstones All observations 10.6% 14.6% 5.4% Large Cap 11.7% 7.8% 15.7% Mid Cap 10.5% 13.7% 5.5% Small Cap 10.6% 23.9% 1.7% Max 47.5% 47.5% 34.5% Min -17.1% -4.9% -17.1% Median 7.5% 14.3% 2.8% BHAR 1 week FDOT With and without With Cornerstones Without Cornerstones cornerstones All observations 12.2% 16.1% 7.2% Large Cap 11.0% 9.4% 12.6% Mid Cap 12.5% 15.2% 8.5% Small Cap 11.3% 25.3% 2.0% Max 71.4% 46.2% 71.4% Min -11.1% -7.9% -11.1% Median 8.8% 15.8% 3.5%
65 BHAR 1 month FDOT With and without With Cornerstones Without Cornerstones cornerstones All observations 11.4% 16.1% 5.4% Large Cap 8.7% 6.8% 10.5% Mid Cap 11.7% 15.0% 6.8% Small Cap 11.0% 27.8% -0.2% Max 59.4% 59.4% 59.1% Min -26.5% 12.0% -26.5% Median 9.4% 13.5% 1.6% BHAR 3 month FDOT With and without With Cornerstones Without Cornerstones cornerstones All observations 16.2% 23.3% 7.0% Large Cap 4.7% 4.2% 5.1% Mid Cap 16.9% 20.1% 12.0% Small Cap 17.8% 54.2% -6.5% Max 84.7% 84.7% 63.9% Min -27.2% 84.7% -27.2% Median 14.0% 19.6% 4.7% BHAR 6 month FDOT With and without With Cornerstones Without Cornerstones cornerstones All observations 24.4% 37.1% 8.2% Large Cap 7.2% 6.5% 7.9% Mid Cap 25.4% 32.6% 14.5% Small Cap 27.0% 82.0% -9.7% Max 181.6% 181.6% 43.7% Min -59.7% -18.2% -59.7% Median 13.0% 15.6% 10.6%
66 Table 12: Descriptive statistics FDOT+1 The table below present the descriptive statistics for all our data samples with regards to average BHAR given that allocation is given at closing price on the first day of trading (FDOT+1), median, maximum and minimum values, divided by whether cornerstone investors have been present or not BHAR 1 week FDOT +1 With and without With Cornerstones Without Cornerstones cornerstones All observations 1.4% 1.3% 1.5% Large Cap -0.4% 1.3% -2.2% Mid Cap 1.7% 1.4% 2.2% Small Cap 0.7% 0.7% 0.7% Max 27.5% 21.7% 27.5% Min -12.9% -12.9% -5.0% Median 0.6% 1.3% 0.3% BHAR 1 month FDOT +1 With and without With Cornerstones Without Cornerstones cornerstones All observations 0.5% 1.2% -0.5% Large Cap -2.6% -0.8% -4.3% Mid Cap 1.0% 1.2% 0.6% Small Cap -0.5% 2.3% -2.4% Max 21.6% 21.6% 18.9% Min -21.0% -21% -11.4% Median -1.0% 0.3% -2.7% BHAR 3 month FDOT +1 With and without With Cornerstones Without Cornerstones cornerstones All observations 4.4% 7.1% 0.8% Large Cap -6.6% -3.4% -9.9% Mid Cap 5.4% 5.5% 5.3% Small Cap 4.3% 23.3% -8.4% Max 43.3% 43.3% 29.7% Min -24.2% -24.2% -15.2% Median 2.1% 4.8% 0.7% BHAR 6 month FDOT +1 With and without With Cornerstones Without Cornerstones cornerstones All observations 11.0% 18.2% 1.9% Large Cap -4.7% -1.3% -8.1% Mid Cap 12.9% 15.9% 8.2% Small Cap 9.4% 42.7% -12.7% Max 152.1% 152.1% 40.5% Min -50.4% -31.2% -50.4% Median 2.0% 4.8% -0.1%
67 Table 13: Cornerstone backed IPOs Overview The table below present an overview of the cornerstone backed IPOs in this thesis. For each transaction, we present the following: cornerstone investors, percent of the transaction they covered and involved investment banks, ranging from Global Coordinators to Co-lead managers. Stock Oncopeptides Edgeware Volati Serneke Alligator THQ Nordic Internationella Engleska skolan AcadeMedia TF Bank Nordic Waterproofing Resurs Holding Humana LeoVegas Investors Carnegie Asset Management, Gladiator, SEB-stiftelsen Catella, Grenspecialisten, LMK Forward, Swedbank Robur, Ostvast Capital AP4, Didner & Gerge, Handelsbanken, Peter Lindell Carnegie Fonder, Cliens, Solder, Stena Sphere Catella, Investment AB Öresund, Norron Didner & Gerge, Swedbank Robur, Handelsbanken, RAM ONE, Novobis, Lancelot AM Investment AB Öresund, Norron, Swedbank Robur AP2, Lannebo, Mellby Gård, Odin Fonder, Swedbank Robur Erik Selin, Lazard, Swedbank Robur AMF, Carnegie Fonder, Swedbank Robur AP2, Catella, Handelsbanken, Swedbank Robur Bodenholm Capital, Handelsbanken, Incentive, Odin Fonder, Swedbank Robur, Zeres Alcur, AMF, Carnegie Asset Management, Catella, Handelsbanken, Keel Capital, Swedbank Robur % of offering Global Coordinators Bookrunner/s 26% Carnegie, ABGSC, DNB, 46% Carnegie Handelsbanken 58% Carnegie, Nordea, 40% Carnegie Co-lead manager/s 31% Carnegie DNB Redeye 30% Pareto Securities 45% ABGSC, Handelsbanken 53% Carnegie SEB, Nordea DNB 39% Carnegie ABGSC 23% Carnegie, ABGSC 33% Carnegie, Morgan Stanley, Goldman Sachs SEB 51% Carngie, SEB, ABGSC, DNB 39% Carnegie, SEB, Garo Svolder, Vätterleden 30% Carnegie Catena Media AMF, Erik Selin, Investment 46% Carnegie AB Öresund, Knutsson Holdings, Niclas Eriksson, RAM ONE, Swedbank Robur Camurus AP4, AXIS-Founders, Catella, 33% Carnegie, SEB E.P., Gladiator Scandic Provobis 10% SEB, Morgan Stanley ABGSC, Deutsche Bank Attendo Carve, Didner & Gerge, ELO, 61% Carnegie, SEB Nordea Danske Bank Nordstjernan, Swedbank Robur Dometic AMF, Handelsbanken, Nordea 26% SEB, Jefferies, Carnegie, UBS Handelsbanken CLX Alecta, AP1, AP4, AXIS founders, RAM ONE, Swedbank Robur Capio AP4, Handelsbanken, R12, Swedbank Robur Morgan Stanley 74% Carnegie, Handelsbanken 54% SEB, J.P. Morgan Carnegie, Deutsche Bank Pandox AMF, Swedbank Robur 35% ABGSC Handelsbanken, Morgan Stanley Nordax Swedbank Robur 17% Carnegie, Morgan Citi Stanley Alimak Lannebo, Pete Pråhl, 29% SEB, Citi Carnegie Swedbank Robur Collector AP2, Swedbank Robur 28% SEB, Tobii AP6, Investor, RAM ONE 29% Carnegie ABGSC Troax Latour, Svolder 65% Carnegie Handelsbanken Hoist finance Carve, Lancelot, Zenit 29% Carnegie, Morgan Stanley Citi Carnegie, SEB, DNB ABGSC
68 Evolution gaming Dustin Eltel Swedbank Robur, Staffan Persson, Peter Lindell, Erik Selin, Niclas Eriksson AP4, Axel Johnson, Swedbank Robur AP4, Lannebo, Swedbank 34% Carnegie SEB 39% Carnegie, Nordea SEB, ABGSC 43% SEB, BNP Paribas, Morgan Stanley Robur Lifco AP4, Didner & Gerge 15% SEB Carnegie, ABGSC Table 14: Subsample regressions FDOT The table below presents the regression results for each of the subsamples. Due to insufficient degrees of freedom, it was not possible to conduct a regression on the large cap subsample. FDOT Mid Cap Groups 1W 1M 3M 6M Cornerstone (MC) p-stat Company % p-stat Market Cap Log p-stat R-squared Adjusted R-squared FDOT Small cap Groups 1W 1M 3M 6M Cornerstone (SC) p-stat ** ** *** ** Company % p-stat Market Cap Log p-stat R-squared Adjusted R-squared
69 Table 15: Subsample regressions FDOT+1 The table below presents the regression results for each of the subsamples given that allocation is given at closing price on the first day (FDOT+1). Due to insufficient degrees of freedom, it was not possible to conduct a regression on the large cap subsample. FDOT +1 All companies Groups 1W 1M 3M 6M Cornerstone (alla) p-stat Company % p-stat ** Market Cap Log p-stat R-squared Adjusted R-squared FDOT+1 Mid Cap Groups 1W 1M 3M 6M Cornerstone p-stat Company % p-stat ** Market Cap Log p-stat R-squared Adjusted R-squared

70 FDOT+1 Small Cap Groups 1W 1M 3M 6M Cornerstone p-stat *** ** Company % p-stat Market Cap Log p-stat R-squared Adjusted R-squared Figures Figure 1: Jacque Berra test for normal distribution The table below presents the Jacque Berra test results for all samples. Due to insufficient degrees of freedom, a test for normal distribution was possible to conduct on the large cap sample.
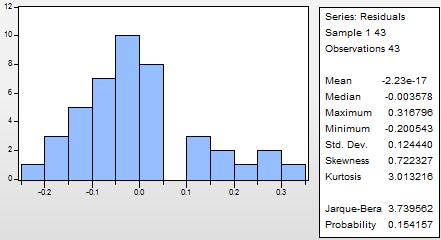
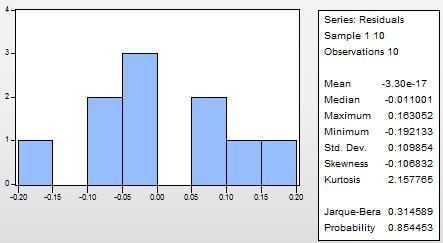
71


72 Figure 2: Whites test for heteroscedasticity The table below presents the whites test results for the samples. Due to insufficient degrees of freedom, a Whites test was possible to conduct on the large cap sample.


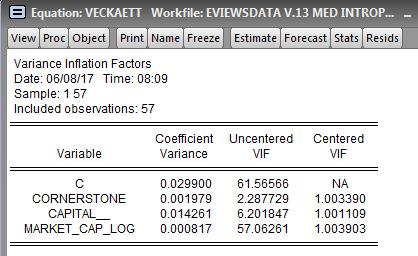
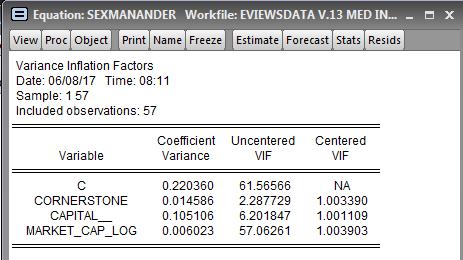
73 Figure 3: VIF test for multicollinearity FDOT All companies


74 Figure 4: VIF test for multicollinearity FDOT Mid Cap Figure 5: VIF test for multicollinearity FDOT Small Cap


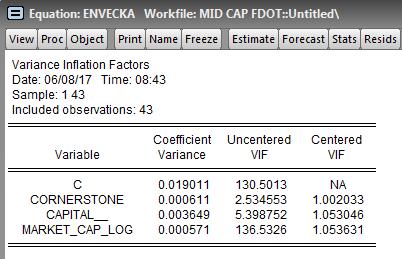


75 Figure 6: VIF test for multicollinearity FDOT+1 All companies Figure 7: VIF test for multicollinearity FDOT+1 Mid cap


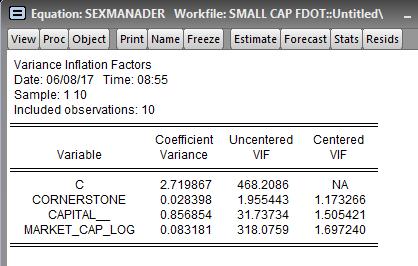
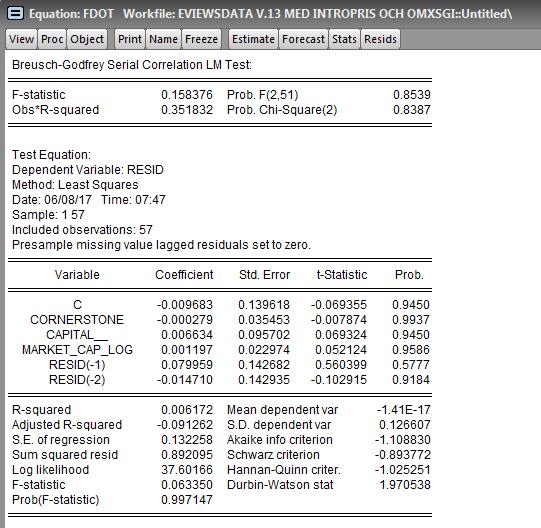
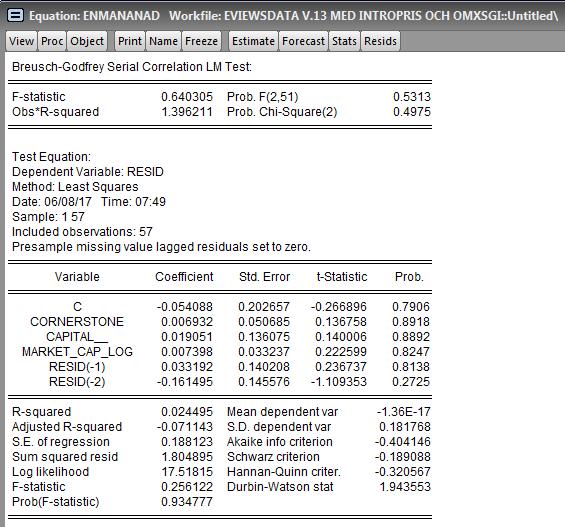
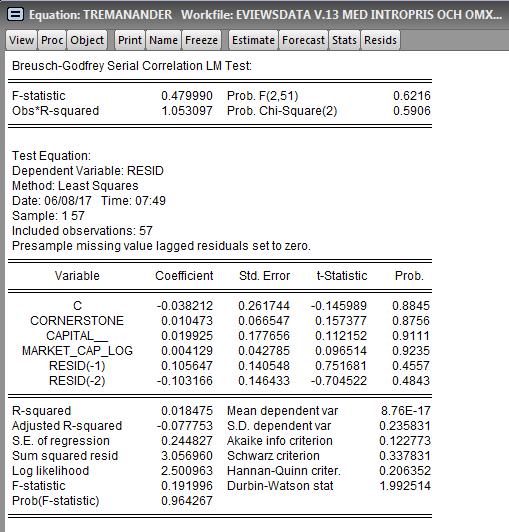
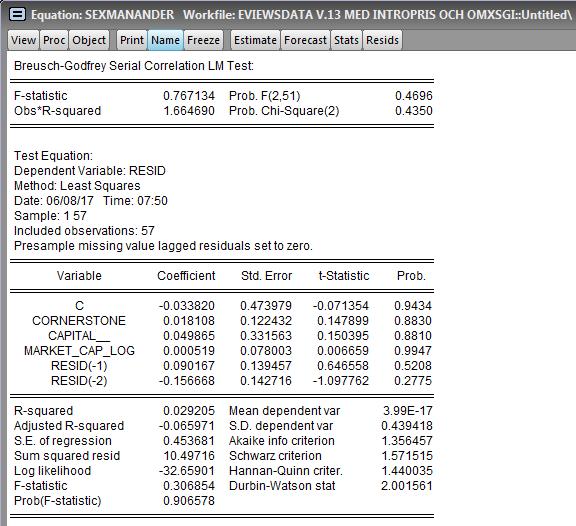
76 Figure 8: VIF test for multicollinearity FDOT+1 Small cap Figure 9: Breusch-Godfrey Serial Correlation LM Test for autocorrelation FDOT All companies


77 Figure 10: Breusch-Godfrey Serial Correlation LM Test for autocorrelation FDOT Mid Cap Figure 11: Breusch-Godfrey Serial Correlation LM Test for autocorrelation FDOT Small Cap

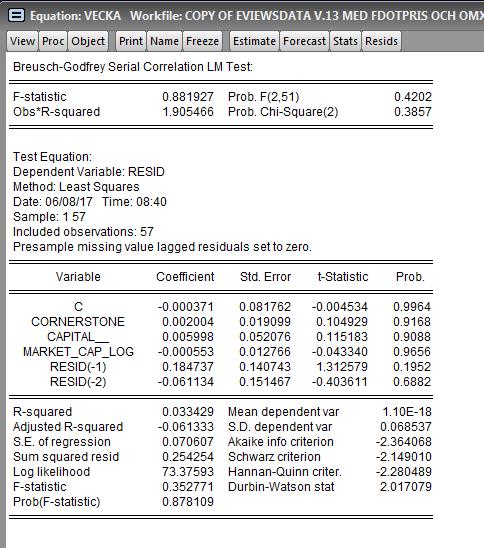
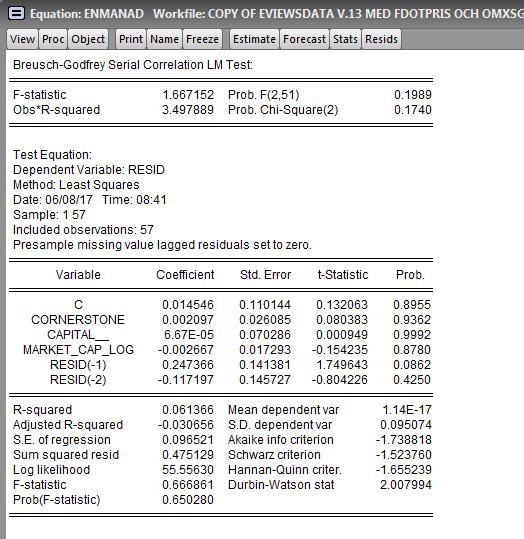
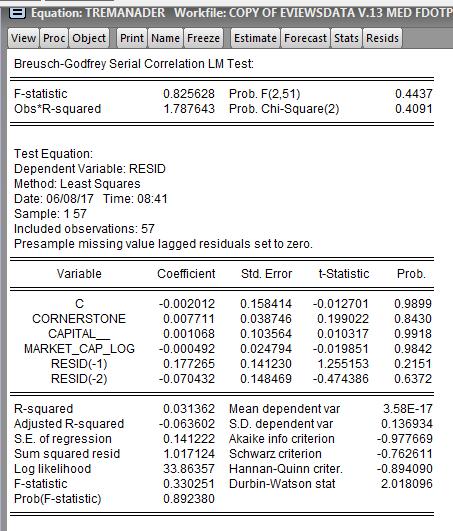

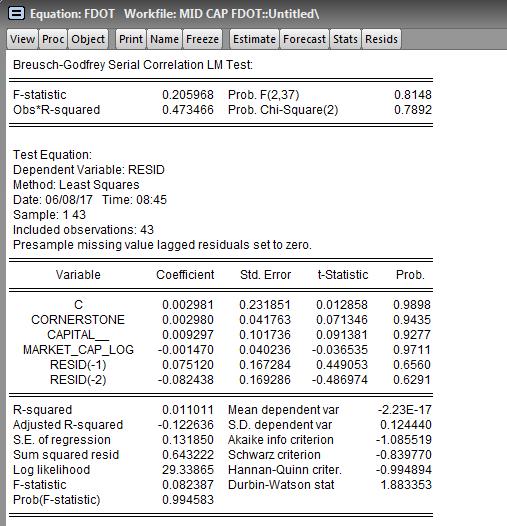
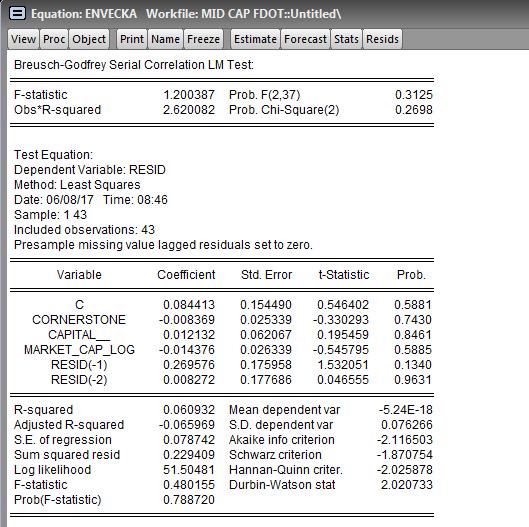
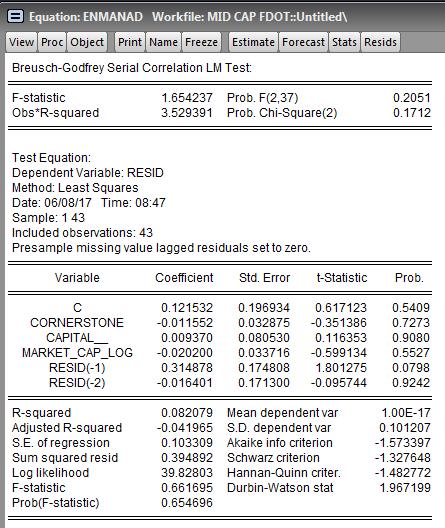
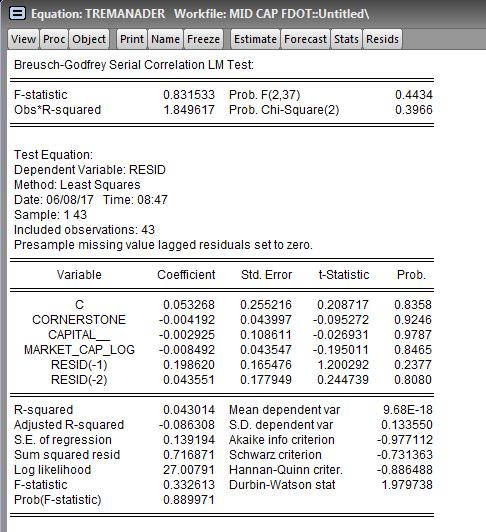
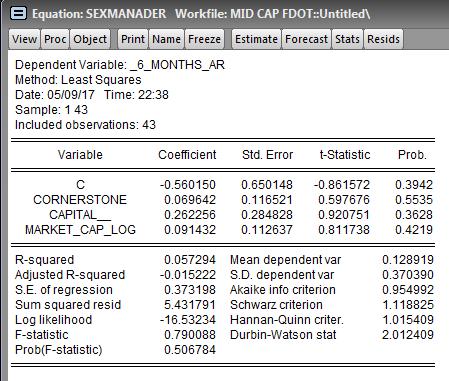
78 Figure 12: Breusch-Godfrey Serial Correlation LM Test for autocorrelation FDOT+1 All companies Figure 13: Breusch-Godfrey Serial Correlation LM Test for autocorrelation FDOT+1 Mid cap

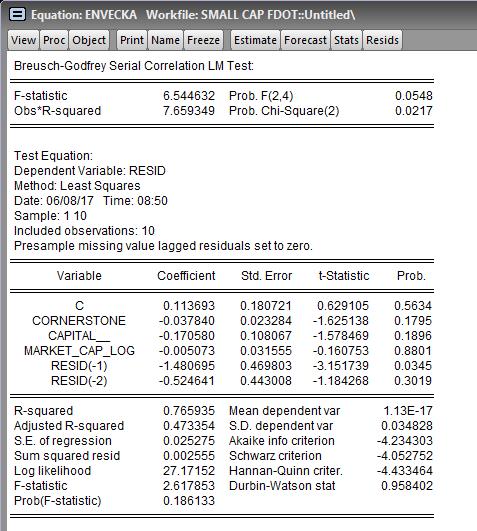
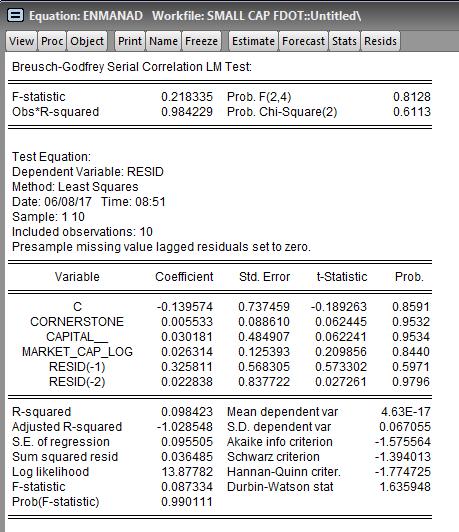
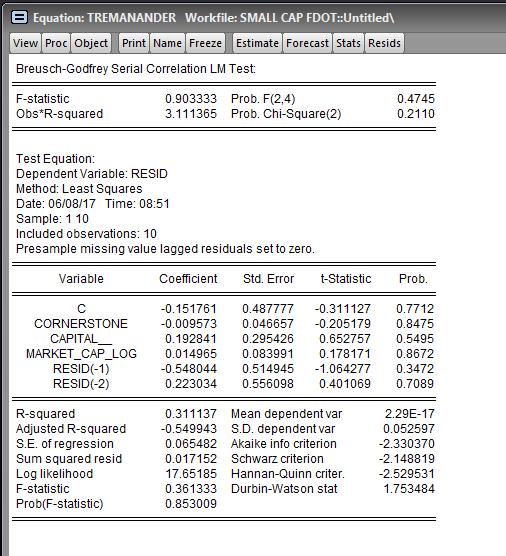
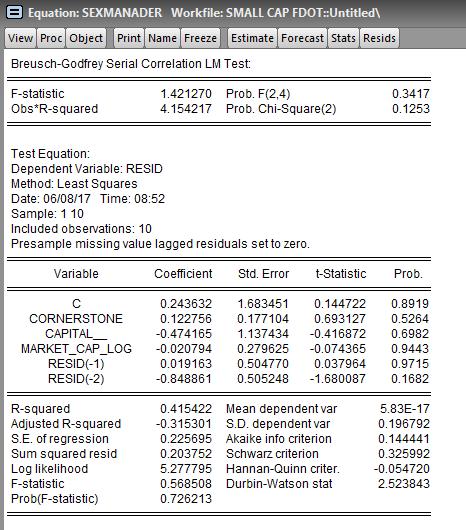
79 Figure 14: Breusch-Godfrey Serial Correlation LM Test for autocorrelation FDOT+1 Small cap
IPO Underpricing on Aktietorget & First North - An empirical study on how Guarantors, Management ownership and
 Master Degree Project in Finance IPO Underpricing on Aktietorget & First North - An empirical study on how Guarantors, Management ownership and Management commitments affect underpricing Alexander Erlingsson
The Influence of Underpricing to IPO Aftermarket Performance: Comparison between Fixed Price and Book Building System on the Indonesia Stock Exchange
 International Journal of Economics and Financial Issues ISSN: 2146-4138 available at http: www.econjournals.com International Journal of Economics and Financial Issues, 2017, 7(4), 157-161. The Influence
The performance of initial public offerings in the biotechnology industry
 Gonzaga University From the SelectedWorks of Todd A Finkle 1998 The performance of initial public offerings in the biotechnology industry Todd A Finkle, Gonzaga University Dan French, University of Missouri
Underpricing of private equity backed, venture capital backed and non-sponsored IPOs
 Underpricing of private equity backed, venture capital backed and non-sponsored IPOs AUTHORS ARTICLE INFO JOURNAL FOUNDER Vlad Mogilevsky Zoltan Murgulov Vlad Mogilevsky and Zoltan Murgulov (2012). Underpricing
The Role of Industry Affiliation in the Underpricing of U.S. IPOs
 The Role of Industry Affiliation in the Underpricing of U.S. IPOs Bryan Henrick ABSTRACT: Haverford College Department of Economics Spring 2012 This paper examines the significance of a firm s industry
Advanced Corporate Finance. 8. Raising Equity Capital
 Advanced Corporate Finance 8. Raising Equity Capital Objectives of the session 1. Explain the mechanism related to Equity Financing 2. Understand how IPOs and SEOs work 3. See the stylized facts related
2. Initial Public Offerings
 2.1 Process of an 5 2. Initial Public Offerings 2.1 Process of an The process of going public in the US is governed by the Securities Act of 1933. Usually, if companies decide to go public, an underwriting
Winner s Curse in Initial Public Offering Subscriptions with Investors Withdrawal Options
 Asia-Pacific Journal of Financial Studies (2010) 39, 3 27 doi:10.1111/j.2041-6156.2009.00001.x Winner s Curse in Initial Public Offering Subscriptions with Investors Withdrawal Options Dennis K. J. Lin
CONFLICTS OF INTEREST AND THE PERFORMANCE OF VENTURE- CAPITAL-BACKED IPOs: A PRELIMINARY LOOK AT THE UK
 CONFLICTS OF INTEREST AND THE PERFORMANCE OF VENTURE- CAPITAL-BACKED IPOs: A PRELIMINARY LOOK AT THE UK by Susanne Espenlaub Ian Garrett Wei Peng Mun First draft: August 1998 This version: 18 March 1999
LONG RUN PRICE PERFORMANCE OF IPO STOCKS IN BANGLADESH. M. Sadiqul Islam 1 Mahfuja Malik Mohammad Riaz Uddin
 Journal of Finance and Banking Volume 9, Number 2 December 2011 LONG RUN PRICE PERFORMANCE OF IPO STOCKS IN BANGLADESH M. Sadiqul Islam 1 Mahfuja Malik Mohammad Riaz Uddin Abstract: This study was conducted
IPO Underpricing in Hong Kong GEM
 IPO Underpricing in Hong Kong GEM by Xisheng Wang A research project submitted in partial fulfillment of the requirements for the degree of Master of Finance Saint Mary s University Copyright Xisheng Wang
The Nordic Puzzle. A study about the long-run performance of IPOs on the Nordic Markets. Authors: Supervisor/s: Department of Business Administration
 Department of Business Administration FEKH80 Bachelor Thesis in Corporate Finance Autumn 2017 The Nordic Puzzle A study about the long-run performance of IPOs on the Nordic Markets Authors: Daniel Tegmark
Initial Public Offering. Corporate Equity Financing Decisions. Venture Capital. Topics Venture Capital IPO
 Initial Public Offering Topics Venture Capital IPO Corporate Equity Financing Decisions Venture Capital Initial Public Offering Seasoned Offering Venture Capital Venture capital is money provided by professionals
Ownership Concentration and Initial Public Offering Performance: Evidence from Thailand
 Ownership Concentration and Initial Public Offering Performance: Evidence from Thailand Abstract This study examines the relation between ownership concentration and performance of initial public offerings
The Geography of Institutional Investors, Information. Production, and Initial Public Offerings. December 7, 2016
 The Geography of Institutional Investors, Information Production, and Initial Public Offerings December 7, 2016 The Geography of Institutional Investors, Information Production, and Initial Public Offerings
Initial and after market performance of initial public offerings (IPOS): New evidence from Colombo Stock Exchange (CSE)
: New evidence from Colombo Stock Exchange (CSE)") Initial and after market performance of initial public offerings (IPOS): New evidence from Colombo Stock Exchange (CSE) 1 2 Wijethunga A.W.G.C.N and Dayaratne D.A.I 1&2 Department of Accountancy & Finance,
Initial and after market performance of initial public offerings (IPOS): New evidence from Colombo Stock Exchange (CSE) 1 2 Wijethunga A.W.G.C.N and Dayaratne D.A.I 1&2 Department of Accountancy & Finance,
The Role of Demand-Side Uncertainty in IPO Underpricing
 The Role of Demand-Side Uncertainty in IPO Underpricing Philip Drake Thunderbird, The American Graduate School of International Management 15249 N 59 th Avenue Glendale, AZ 85306 USA drakep@t-bird.edu
Underpricing in Swedish IPOs An investigation of the current situation and possible causes
 Underpricing in Swedish IPOs An investigation of the current situation and possible causes Master thesis within Business Administration Authors: Kristoffer Göthner Anders Ramsin Tutor: Andreas Stephan
Do Venture Capitalists Certify New Issues in the IPO Market? Yan Gao
 Do Venture Capitalists Certify New Issues in the IPO Market? Yan Gao Northwestern University Baruch College, City University of New York, New York, NY 10010 Current version: 6 Novermber 2002 Abstract In
PROSIDING PERKEM IV, JILID 1 (2009) ISSN: X
 ISSN: X") PROSIDING PERKEM IV, JILID 1 (2009) 395-412 ISSN: 2231-962X SIGNIFICANCE OF INVESTOR DEMAND, FIRM SIZE, OFFER TYPE AND OFFER SIZE ON THE INITIAL PREMIUM, FIRST-DAY PRICE SPREAD AND FLIPPING ACTIVITY OF
PROSIDING PERKEM IV, JILID 1 (2009) 395-412 ISSN: 2231-962X SIGNIFICANCE OF INVESTOR DEMAND, FIRM SIZE, OFFER TYPE AND OFFER SIZE ON THE INITIAL PREMIUM, FIRST-DAY PRICE SPREAD AND FLIPPING ACTIVITY OF
Grandstanding and Venture Capital Firms in Newly Established IPO Markets
 The Journal of Entrepreneurial Finance Volume 9 Issue 3 Fall 2004 Article 7 December 2004 Grandstanding and Venture Capital Firms in Newly Established IPO Markets Nobuhiko Hibara University of Saskatchewan
Declining IPO volume: Cold issue market or structural change in the capital markets?
 Declining IPO volume: Cold issue market or structural change in the capital markets? Preliminary thesis Hanne Levardsen, Iselin Dybing Vaarlund BI Norwegian Business School Supervisor: Janis Berzins 16.01.2016
Most public firms tend to finance their projects first with retained earnings, then with debt, and only finally with equity (as a last resort)
") LECTURE 1: RAISING CAPITAL- EQUITY 1. FINANCING POLICY Sources of funds: 1. Internal funds i.e. Retained earnings, cash 2. External funds Debt i.e. Borrowing Equity i.e. Issuing new shares Hybrids Pecking
LECTURE 1: RAISING CAPITAL- EQUITY 1. FINANCING POLICY Sources of funds: 1. Internal funds i.e. Retained earnings, cash 2. External funds Debt i.e. Borrowing Equity i.e. Issuing new shares Hybrids Pecking
FIN 540 Initial Public Offerings (IPOs) Why Issue Public Equity?
 Why Issue Public Equity?") FIN 540 Initial Public Offerings (IPOs) Why Issue Public Equity? Cost & Benefits of IPOs Why Is There Underpricing? Hot Issues Markets Why Issue Public Equity? 1. lower the cost of capital for the firm
FIN 540 Initial Public Offerings (IPOs) Why Issue Public Equity? Cost & Benefits of IPOs Why Is There Underpricing? Hot Issues Markets Why Issue Public Equity? 1. lower the cost of capital for the firm
Underpricing, explained by ex-ante uncertainty
 Underpricing, explained by ex-ante uncertainty By, Thijs van Rijn Master Thesis 11-10-2016 Supervisor: Drs. Siraj Zubair Radboud Universiteit Nijmegen Nijmegen 1 Abstract This paper examines the influence
Chapter 15 Raising Capital
 Topics Covered Chapter 15 Raising Capital Konan Chan Financial Management, Fall 2018 Venture capital Equity offering procedure Alternative issue methods Underwriters IPO underpricing Costs of issuing securities
Initial Public Offerings
 NORGES HANDELSHØYSKOLE Bergen, Spring 2012 Initial Public Offerings An empirical study of how the IPOs on Oslo Stock Exchange are priced relative to the indicative price range Birgitte Heskestad Ellingsen
A test of momentum strategies in funded pension systems - the case of Sweden. Tomas Sorensson*
 A test of momentum strategies in funded pension systems - the case of Sweden Tomas Sorensson* This draft: January, 2013 Acknowledgement: I would like to thank Mikael Andersson and Jonas Murman for excellent
UNDERPRICING IN COLD AND HOT ISSUE MARKETS:
 UNDERPRICING IN COLD AND HOT ISSUE MARKETS: Testing the Changing Risk Composition Hypothesis on the Swedish IPO Market DAVID JOHANSSON & DAVID ÖSTERMAN JUNE 8, 2017 BACHELOR OF SCIENCE IN FINANCIAL ECONOMICS
MAGISTERARBEIT. Titel der Magisterarbeit. ''How to Determine the IPO Share Price?'' Verfasser. Miho Katić. angestrebter akademischer Grad
 MAGISTERARBEIT Titel der Magisterarbeit ''How to Determine the IPO Share Price?'' Verfasser Miho Katić angestrebter akademischer Grad Magister der Sozial- und Wirtschaftswissenschaften (Mag. rer. soc.
The Role of Venture Capital Backing in the Underpricing and Long-Run Performance of Chinese IPOs
 The Role of Venture Capital Backing in the Underpricing and Long-Run Performance of Chinese IPOs ERIC ABRAHAMSSON and JONATHAN JOHANSSON Stockholm School of Economics Master Thesis in Finance Spring 2017
Do VCs Provide More Than Money? Venture Capital Backing & Future Access to Capital
 LV11066 Do VCs Provide More Than Money? Venture Capital Backing & Future Access to Capital Donald Flagg University of Tampa John H. Sykes College of Business Speros Margetis University of Tampa John H.
Should IPOs be Auctioned? The Impacts of Japanese Auction-Priced IPOs
 Should IPOs be Auctioned? The Impacts of Japanese Auction-Priced IPOs By Richard H. Pettway College of Business and Public Administration 239 Middlebush Hall University of Missouri-Columbia Columbia, MO
BANK REPUTATION AND IPO UNDERPRICING: EVIDENCE FROM THE ISTANBUL STOCK EXCHANGE
 BANK REPUTATION AND IPO UNDERPRICING: EVIDENCE FROM THE ISTANBUL STOCK EXCHANGE Abstract This study examines the effect of underwriter reputation on the initial-day and long-term IPO returns in an emerging
EXPECTED AND ACTUAL PROCEEDS FROM SHARE ISSUE ON THE WARSAW STOCK EXCHANGE
 EXPECTED AND ACTUAL PROCEEDS FROM SHARE ISSUE ON THE WARSAW STOCK EXCHANGE Anna Wawryszuk-Misztal Maria Curie Skłodowska University, Poland anna.w-misztal@wp.pl Abstract: The paper aims to assess the impact
Influence of family ownership on IPO underpricing
 Influence of family ownership on IPO underpricing Abstract The purpose of this thesis is to determine if there is a difference between family ownership and non-family ownership regarding IPO underpricing.
Mr. Kedar Mukund Phadke 1, Dr. Manoj S. Kamat 2 ABSTRACT
 IMPACT OF IPO GRADING ON LISTING RETURNS AT THE NATIONAL STOCK EXCHANGE (NSE) IN INDIA Mr. Kedar Mukund Phadke 1, Research Scholar Assistant Professor National Institute of Construction Management and
Demand uncertainty, Bayesian update, and IPO pricing. The 2011 China International Conference in Finance, Wuhan, China, 4-7 July 2011.
 Title Demand uncertainty, Bayesian update, and IPO pricing Author(s) Qi, R; Zhou, X Citation The 211 China International Conference in Finance, Wuhan, China, 4-7 July 211. Issued Date 211 URL http://hdl.handle.net/1722/141188
Corporate Governance, IPO (Initial Public Offering) Long Term Return in Malaysia
 Long Term Return in Malaysia") 2012 International Conference on Economics, Business and Marketing Management IPEDR vol.29 (2012) (2012) IACSIT Press, Singapore Corporate Governance, IPO (Initial Public Offering) Long Term Return in
2012 International Conference on Economics, Business and Marketing Management IPEDR vol.29 (2012) (2012) IACSIT Press, Singapore Corporate Governance, IPO (Initial Public Offering) Long Term Return in
Who Receives IPO Allocations? An Analysis of Regular Investors
 Who Receives IPO Allocations? An Analysis of Regular Investors Ekkehart Boehmer New York Stock Exchange eboehmer@nyse.com 212-656-5486 Raymond P. H. Fishe University of Miami pfishe@miami.edu 305-284-4397
Investor Demand in Bookbuilding IPOs: The US Evidence
 Investor Demand in Bookbuilding IPOs: The US Evidence Yiming Qian University of Iowa Jay Ritter University of Florida An Yan Fordham University August, 2014 Abstract Existing studies of auctioned IPOs
Key words: Incentive fees; Underwriter compensation; Hong Kong; Underwriter reputation; Initial Public offerings.
 Incentive Fees: Do they bond underwriters and IPO issuers? Abdulkadir Mohamed Cranfield University Brahim Saadouni The University of Manchester This paper examines the impact of incentive fees in mitigating
Litigation Risk and IPO Underpricing
 Litigation Risk and IPO Underpricing Presentation by Gennaro Bernile Michelle Lowry Penn State University Susan Shu Boston College Problem in hand and related literature Model proposed and problems with
Potential drivers of insurers equity investments
 Potential drivers of insurers equity investments Petr Jakubik and Eveline Turturescu 67 Abstract As a consequence of the ongoing low-yield environment, insurers are changing their business models and looking
Equity Offerings. Sources of Fund. Management Fee. Company life cycle. What is a VC? Venture capital IPO IPO features SEO.
 Equity Offerings Venture capital IPO IPO features SEO 2018 Konan Chan Konan Chan 2 STAGE CYCLE TYPE OF FUNDING SOURCE OF FUNDING R&D Proof of Concept Funding Company life cycle START- UP Seed Corn EARLY
Does Corporate Hedging Affect Firm Value? Evidence from the IPO Market. Zheng Qiao, Yuhui Wu, Chongwu Xia, and Lei Zhang * Abstract
 Does Corporate Hedging Affect Firm Value? Evidence from the IPO Market Zheng Qiao, Yuhui Wu, Chongwu Xia, and Lei Zhang * Abstract Focusing on the IPO market, this study examines the influence of corporate
Explaining Mispricing of Initial Public Offerings
 Explaining Mispricing of Initial Public Offerings Beat Reber a* and Caroline Fong b a Nottingham University Business School, Nottingham, NG8 1BB, UK b Singapore Exchange, Singapore 068804, Singapore This
Literature survey : Equity Issues and their Impact on Stockholders Wealth
 Literature survey : Equity Issues and their Impact on Stockholders Wealth The University of Georgia, Athens, June 1997 Matej BLAŠKO Literature survey : This study surveys the most important facts about
Litigation Risk and IPO Underpricing
 Litigation Risk and IPO Underpricing Michelle Lowry Penn State University Email: mlowry@psu.edu Phone: (814) 863-6372 Fax: (814) 865-3362 Susan Shu Boston College Email: shus@bc.edu Phone: (617) 552-1759
Evaluation of Short-run Market Performance of Initial Public Offerings: Evidence from Karachi Stock Exchange. Khalil Ahmad
 Volume 6 Issue 1 (2016) PP. 1-31 Evaluation of Short-run Market Performance of Initial Public Offerings: Evidence from Karachi Stock Exchange Khalil Ahmad Professor of Economics at Government College Women
Performance of Initial Public Offerings in Public and Private Owned Firms of Pakistan. Henna and Attiya Yasmin Javid
 Performance of Initial Public Offerings in Public and Private Owned Firms of Pakistan Henna and Attiya Yasmin Javid Introduction When any private company first time sells his stock to general public is
Founder CEOs and IPO Underpricing
 Founder CEOs and IPO Underpricing Adrian Gehrig a B.Sc. Business and Economics Stockholm School of Economics Mårten Strömberg b B.Sc. Business and Economics Stockholm School of Economics ABSTRACT The purpose
CHANGES IN VENTURE CAPITAL FUNDING AND THE PROCESS OF CREATING NASCENT FIRM VALUE. Stephen Glenn Martin
 CHANGES IN VENTURE CAPITAL FUNDING AND THE PROCESS OF CREATING NASCENT FIRM VALUE by Stephen Glenn Martin A dissertation submitted to the faculty of The University of North Carolina at Charlotte in partial
The Changing Influence of Underwriter Prestige on Initial Public Offerings
 Journal of Finance and Economics Volume 3, Issue 3 (2015), 26-37 ISSN 2291-4951 E-ISSN 2291-496X Published by Science and Education Centre of North America The Changing Influence of Underwriter Prestige
An Empirical Investigation of Short-Run Performance of Ipos in India
 An Empirical Investigation of Short-Run Performance of Ipos in India Himanshu Puri Abstract Initial Public Offering (IPO), is a way for companies to go public and meet its financing needs. IPOs are known
Is Operating Cash Flow a Contributing Factor to IPO Underpricing?
 Is Operating Cash Flow a Contributing Factor to IPO Underpricing? - A study of all IPOs conducted on the Stockholm Stock Exchange from 1995-2010 Bachelor Thesis Industrial and Financial Management School
VENTURE-CAPITAL CERTIFICATION IN EUROPEAN IPOs
 FACULTY OF ECONOMICS AND BUSINESS VENTURE-CAPITAL CERTIFICATION IN EUROPEAN IPOs Rik De Dobbeleer Hendrik Vermeersch R0297944 R0303616 Thesis submitted to obtain the degree of MASTER IN DE TOEGEPASTE ECONOMISCHE
AFM 371 Winter 2008 Chapter 20 - Issuing Equity Securities
 AFM 371 Winter 2008 Chapter 20 - Issuing Equity Securities 1 / 18 Outline Background Public Equity Issues Rights Offerings Private Equity and Venture Capital 2 / 18 Background the procedures for selling
1 An Analysis of Factors Affecting Investor Demand for Initial Public Offerings in Singapore*
 1 An Analysis of Factors Affecting Investor Demand for Initial Public Offerings in Singapore* Li Li Eng The National University of Singapore, Singapore Hwee Shan Aw The National University of Singapore,
Discounting and Underpricing of REIT Seasoned Equity Offers
 Discounting and Underpricing of REIT Seasoned Equity Offers Author Kimberly R. Goodwin Abstract For seasoned equity offerings, the discounting of the offer price from the closing price on the previous
IPO Underpricing in the Hospitality Industry: A Necessary Evil?
 Cornell University School of Hotel Administration The Scholarly Commons Articles and Chapters School of Hotel Administration Collection 2008 IPO Underpricing in the Hospitality Industry: A Necessary Evil?
Aftermarket Performance of Micro-Capitalized Initial Public Offerings
 Aftermarket Performance of Micro-Capitalized Initial Public Offerings Fredrik Lüsch Stockholm Business School Master s Degree Thesis 30 HE credits Subject: Finance Program: Master's Programme in Banking
Investor Preferences, Mutual Fund Flows, and the Timing of IPOs
 Investor Preferences, Mutual Fund Flows, and the Timing of IPOs by Hsin-Hui Chiu 1 EFM Classification Code: 230, 330 1 Chapman University, Argyros School of Business, One University Drive, Orange, CA 92866,
Does Ownership Structure Effect IPO underpricing: Evidence from Thai IPOs
 Does Ownership Structure Effect IPO underpricing: Evidence from Thai IPOs Dr. Sunder Venkatesh, Suman Neupane* 1 School of Management, Asian Institute of Technology, Bangkok, Thailand Abstract The study
Chapter 19. Raising Capital. Private financing for new, high-risk businesses in exchange for stock Individual investors Venture capital firms
 Chapter 19 Raising Capital Private financing for new, high-risk businesses in exchange for stock Individual investors Venture capital firms Usually involves active participation by venture capitalists
Long-Run IPO Performance for Family Firms
 Long-Run IPO Performance for Family Firms A study on the Swedish market by Linus Olsson Marcus Östman May 2015 Master s Programme in Corporate and Financial Management Supervisor: Naciye Sekerci Abstract
INITIAL PUBLIC OFFERINGS:
 INITIAL PUBLIC OFFERINGS: THE MALAYSIAN EXPERIENCE 1990-1994 Othman Yong ABSTRACT The existence of underpricing for initial public offerings (IPOs) of stocks in the advanced markets in the West is well
LIQUIDITY EXTERNALITIES OF CONVERTIBLE BOND ISSUANCE IN CANADA
 LIQUIDITY EXTERNALITIES OF CONVERTIBLE BOND ISSUANCE IN CANADA by Brandon Lam BBA, Simon Fraser University, 2009 and Ming Xin Li BA, University of Prince Edward Island, 2008 THESIS SUBMITTED IN PARTIAL
Real Estate Crashes and Bank Lending. March 2004
 Real Estate Crashes and Bank Lending March 2004 Andrey Pavlov Simon Fraser University 8888 University Dr. Burnaby, BC V5A 1S6, Canada E-mail: apavlov@sfu.ca, Tel: 604 291 5835 Fax: 604 291 4920 and Susan
Econ 234C Corporate Finance Lecture 11: IPOs
 Econ 234C Corporate Finance Lecture 11: IPOs Ulrike Malmendier UC Berkeley April 24, 2007 Outline 1. Organization 2. IPOs basics and stylized facts 3. IPOs Initial underpricing 4. IPOs LR underperformance?
Keywords: Underpricing, Venture capital backed IPOs, Certification theory, Grandstanding theory, Offer price to intrinsic value ratio
 Int. J. Mgmt. Res. Res. & & Bus. Bus. Strat. Strat. 2015 2015 Nibu Raj Abraham and Antony Joseph, 2015 ISSN 2319-345X www.ijmrbs.com Vol. 4, No. 4, October 2015 2015 IJMRBS. All Rights Reserved UNDERPRICING
Chapter 19. Raising Capital. Private financing for new, high-risk businesses in exchange for stock Individual investors Venture capital firms
 Chapter 19 Raising Capital Private financing for new, high-risk businesses in exchange for stock Individual investors Venture capital firms Usually involves active participation by venture capitalists
IPO Underpricing and Conflict of Interest inside the Intermediation Structure. November 9, Chatchai Thisadoldilok* Abstract. I.
 IPO Underpricing and Conflict of Interest inside the Intermediation Structure November 9, 2012 Chatchai Thisadoldilok* Abstract This paper examines the role of financial advisors in IPO transactions in
AFM 371 Winter 2008 Chapter 14 - Efficient Capital Markets
 AFM 371 Winter 2008 Chapter 14 - Efficient Capital Markets 1 / 24 Outline Background What Is Market Efficiency? Different Levels Of Efficiency Empirical Evidence Implications Of Market Efficiency For Corporate
The Effects of Venture Capital Syndicate on the IPO Underpricing Phenomenon --Based on China Growth Enterprise Market from
 First International Conference on Economic and Business Management (FEBM 2016) The Effects of Venture Capital Syndicate on the IPO Underpricing Phenomenon --Based on China Growth Enterprise Market from
DOES OWNERSHIP STRUCTURE EFFECT IPO UNDERPRICING: EVIDENCE FROM THAI IPOS
 DOES OWNERSHIP STRUCTURE EFFECT IPO UNDERPRICING: EVIDENCE FROM THAI IPOS Sunder Venkatesh, Suman Neupane* Abstract The study utilizes a unique set of IPOs data in Thailand post Asian Financial crises
Underwriter reputation and the underwriter investor relationship in IPO markets
 Underwriter reputation and the underwriter investor relationship in IPO markets Author Neupane, Suman, Thapa, Chandra Published 2013 Journal Title Journal of International Financial Markets, Institutions
Auditor s Reputation, Equity Offerings, and Firm Size: The Case of Arthur Andersen
 Auditor s Reputation, Equity Offerings, and Firm Size: The Case of Arthur Andersen Stephanie Yates Rauterkus Louisiana State University Kyojik Roy Song University of Louisiana at Lafayette First Draft:
IPO Underpricing and Management Quality
 NORGES HANDELSHØYSKOLE Bergen, 14.06.2007 IPO Underpricing and Management Quality An Empirical Study of The Norwegian Equity Market Kristine Hesjedal Supervisor: Carsten Bienz Thesis in specialisation:
Open Market Repurchase Programs - Evidence from Finland
 International Journal of Economics and Finance; Vol. 9, No. 12; 2017 ISSN 1916-971X E-ISSN 1916-9728 Published by Canadian Center of Science and Education Open Market Repurchase Programs - Evidence from
formal organization dealing in securities in Malaya then. Subsequently in 1964, the Stock
 CHAPTER 2: REVIEW OF PRIOR LITERATURE Chapter 2 begins with history and background information of Kuala Lumpur Stock Exchange. It is then followed by introduction on FTSE Bursa Malaysia Kuala Lumpur Composite
Pre-IPO Market, Underwritting Procedure, and IPO Performance
 Pre-IPO Market, Underwritting Procedure, and IPO Performance Hsuan-Chi Chen a, Sue-Jane Chiang b*, Pei-Gi Shu b a Anderson School of Management, University of New Mexico, Albuquerque, NM 87131, USA b Department
IPOs and Venture Backed IPOs
 F. Philipp Ghadri IPOs and Venture Backed IPOs A Theoretical and Practical Code of Practice plus Implication Nomos F. Philipp Ghadri IPOs and Venture Backed IPOs A Theoretical and Practical Code of Practice
Problems with seniority based pay and possible solutions. Difficulties that arise and how to incentivize firm and worker towards the right incentives
 Problems with seniority based pay and possible solutions Difficulties that arise and how to incentivize firm and worker towards the right incentives Master s Thesis Laurens Lennard Schiebroek Student number:
SUBSTANCE, SYMBOLISM AND THE SIGNAL STRENGTH OF VENTURE CAPITALIST PRESTIGE
 SUBSTANCE, SYMBOLISM AND THE SIGNAL STRENGTH OF VENTURE CAPITALIST PRESTIGE PEGGY M. LEE W.P. Carey School of Business Arizona State University Tempe, AZ 85287-4006 TIMOTHY G. POLLOCK Pennsylvania State
Parent Firm Characteristics and the Abnormal Return of Equity Carve-outs
 Parent Firm Characteristics and the Abnormal Return of Equity Carve-outs Feng Huang ANR: 313834 MSc. Finance Supervisor: Fabio Braggion Second reader: Lieven Baele - 2014 - Parent firm characteristics
Private Equity and IPO Performance. A Case Study of the US Energy & Consumer Sectors
 Private Equity and IPO Performance A Case Study of the US Energy & Consumer Sectors Jamie Kerester and Josh Kim Economics 190 Professor Smith April 30, 2017 2 1 Introduction An initial public offering
Managerial confidence and initial public offerings
 Managerial confidence and initial public offerings Thomas J. Boulton a, T. Colin Campbell b,* May, 2014 Abstract Initial public offering (IPO) underpricing is positively correlated with managerial confidence.
Impact Assessment Case Study. Short Selling
 Impact Assessment Case Study Short Selling Impact Assessment Case Study Short Selling Objectives of this case study This case study takes the form of a role play exercise. The objectives of this case study
FIRM TRANSPARENCY AND THE COSTS OF GOING PUBLIC. Abstract. I. Introduction
 The Journal of Financial Research Vol. XXV, No. 1 Pages 1 17 Spring 2002 FIRM TRANSPARENCY AND THE COSTS OF GOING PUBLIC James S. Ang Florida State University James C. Brau Brigham Young University Abstract
DECODING INSIDER INFORMATION
 DECODING INSIDER INFORMATION ON THE SWEDISH STOCK MARKET -A COMPARISON OF THE ABNORMAL RETURNS GAINED BY ROUTINE AND OPPORTUNISTIC INSIDERS Master thesis School of Business and Economics, Department of
Venture Capital Backing, Investor Attention, and. Initial Public Offerings
 Venture Capital Backing, Investor Attention, and Initial Public Offerings Thomas J. Chemmanur Karthik Krishnan Qianqian Yu First Draft: January 15, 2016 Current Draft: December 31, 2016 Abstract We hypothesize
Biases in the IPO Pricing Process
 University of Rochester William E. Simon Graduate School of Business Administration The Bradley Policy Research Center Financial Research and Policy Working Paper No. FR 01-02 February, 2001 Biases in
Management Science Letters
 Management Science Letters 3 (2013) 2161 2166 Contents lists available at GrowingScience Management Science Letters homepage: www.growingscience.com/msl A study on effect of information asymmetry on earning
Tie-In Agreements and First-Day Trading in Initial Public Offerings
 Tie-In Agreements and First-Day Trading in Initial Public Offerings Hsuan-Chi Chen 1 Robin K. Chou 2 Grace C.H. Kuan 3 Abstract When stock returns in certain industrial sectors are rising, shares of initial
RESEARCH ARTICLE. Change in Capital Gains Tax Rates and IPO Underpricing
 RESEARCH ARTICLE Business and Economics Journal, Vol. 2013: BEJ-72 Change in Capital Gains Tax Rates and IPO Underpricing 1 Change in Capital Gains Tax Rates and IPO Underpricing Chien-Chih Peng Department
From the IPO to the First Trade: Is Underpricing Related to the Trading Mechanism?
 From the IPO to the First Trade: Is Underpricing Related to the Trading Mechanism? Sonia Falconieri Tilburg University Warandelaan 2 P.O. Box 90153 5000 LE Tilburg Netherlands Phone: 31 13 466 2872 E-mail:
Determinants of Stock Returns Subsequent to Initial Public Offerings
 Determinants of Stock Returns Subsequent to Initial Public Offerings by Dimitrios Ghicas* Georgia Siougle* Leonidas Doukakis* *Athens University of Economics and Business Department of Accounting and Finance
Lund University School of Economics and Management. Master s thesis June 2008
 Lund University School of Economics and Management Master s thesis June 2008 THE UNDERPRICING AND LONG RUN PERFORMANCE OF INITIAL PUBLIC OFFERINGS - Evidence from Turkey Kivilcim Eraydin* ABSTRACT This
Global Finance Journal
 Global Finance Journal 21 (2010) 253 261 Contents lists available at ScienceDirect Global Finance Journal journal homepage: www.elsevier.com/locate/gfj The short-run price performance of initial public