Private Equity and IPO Performance. A Case Study of the US Energy & Consumer Sectors
|
|
|
- Tamsin Jacobs
- 6 years ago
- Views:
Transcription
1 Private Equity and IPO Performance A Case Study of the US Energy & Consumer Sectors Jamie Kerester and Josh Kim Economics 190 Professor Smith April 30, 2017
2 2 1 Introduction An initial public offering (IPO) can be a pivotal moment for a company s financial success, and an exciting event for the firm and investors. However, the pricing and subsequent performance of an IPO s stock is still a topic that intrigues and confounds many in the financial world. As an investor, the concept of buying shares of a new public company is exciting, but do long-run returns hold up to the hype? Previous studies conducted by Jay Ritter (1991) have found that IPO shares exhibit abnormal short-run returns, followed by long-run underperformance. The reason for this phenomenon has been widely analyzed, leading to a multitude of hypothesis. Using a three-year time frame, Ritter found that companies that went public significantly underperformed comparable public firms in similar industries, leading to his conclusion that in the long-run, IPO investments tend to do worse than the market. Over a three-year holding period, returns from 1,526 IPOs had an average return of 34.47% compared to a group of 1,526 companies similar in industry and size, which had an average return of 61.86% over the same period. Ritter theorized that investor sentiment about future growth opportunity is overly optimistic at the time of the IPO. He suggests that this may be the case because many firms go public near the peak of industry-related booms.
3 3 Instead of trying to explain the mispricing or underperformance of IPOs, we hope to examine the key determinants of IPO performance, specifically looking if private equity-backed firms perform better or worse after the IPO compared to those that are not backed by a financial sponsor. It is important to first understand how private equity relates to initial public offerings. Private equity (PE) firms are financial intermediaries that raise capital for investment funds, using large amounts of debt (up to 80%) to buy companies (Kaplan and Per Strömberg, 2008). Due to the highly leveraged nature of these transactions, these investments carry considerable risk, yet these funds aim to produce above-average returns for investors. Indeed, gross of fees, investors in private equity funds tend to outperform the S&P 500; however, the industry maintains a one to two percent management fee and twenty percent carry fee over profits, yielding a net investor return slightly below the market (Gompers, Kaplan and Mukharlyamov, 2015). Unlike a strategic buyer, a PE firm looks to exit the investment. This can be done via a sale to a strategic buyer, another PE firm (called a secondary), or through an IPO. After taking a company private, private equity firms utilize a combination of financial engineering, governance engineering, and operational improvements in order to profit from the purchased company (Gompers, Kaplan and Mukharlyamov, 2015). Among other strategies, a PE firm may add specific industry knowledge, provide equity incentives to management teams, maintain a smaller board, or cut company costs. In general, supporters of PE would claim that PE firms create value by partnering with the company and improving operations. This added value, in turn, may lead to greater company performance. Because our paper focused on IPO performance, we hypothesized that this increase in company performance would lead to greater capital gains later on. To that end, our paper
4 4 seeks to analyze how a private equity-backed company performs after an IPO in comparison to a company not backed by private equity. Although there is no literature that addresses the questions that we aim to answer, there are several studies that have explored how underwriter and venture capital reputation affects IPO performance. Brav and Gompers (1997) find that firms backed by venture capital outperform firms not backed by venture capital in IPOs over a time span of five years after IPO, however only when returns are equally weighted. They discuss the fact that venture capital firms spend a lot of time and energy in analyzing information about new companies, which has positive signaling effects to the public when the firm chooses to invest in a company. This partially overcomes the informational asymmetries that are associated with startup companies (Brav and Gompers, 1997). However, one must question whether this hypothesis fully explains long-run performance, since such positive signaling is likely already priced into the initial IPO. Krishnan, Ivanov, Masulis, and Singh (2011) find similar results, reporting that the relationship between long-run performance and IPOs backed by venture capital is positive and significant. The paper states that, while more reputable VCs initially select better-quality firms, more reputable VCs continue to be associated with superior long-run performance, even after controlling for VC selectivity, a phenomenon due to post-ipo involvement of the VC firm. Such post-ipo involvement is also possible in private equity, although it may not always occur. Dong, Michel, and Pandes (2011) evaluate a similar topic, finding that the quality and reputation of underwriters (as measured by market share) affect longrun performance of IPOs in a positive manner. Datta, Gruskin, and Iskandar-Datta (2015) look more specifically at venture-backed IPOs and reverse leveraged
5 5 buyouts, finding evidence that company restructuring during the private period when the firm is owned by a PE firm can lead to greater long-run performance. This is because PE firms can use management strategies to increase sales growth, thus leading to better stock returns post-ipo. In this paper, we test whether private equity backing influences long-run performance of IPOs. Based on existing literature concerning venture capital and private equity, we believe that private equity-backed IPOs outperform non-pe backed IPOs. This paper analyzes the three-year post-ipo returns to investors of IPOs from 2008 to This time frame was chosen for two primary reasons. First, private equity is a cyclical industry, and while considerable amounts of research have been conducted on past cycles, there is not as much available research on trends since the 08 recession. Second, after the recession, the nature of private equity became more conservative, with PE firms not bidding as aggressively due to tighter credit markets and a fear of over-levering. We believe that these changes will allow us to discover new insights to add to existing literature. In our paper, we examine both the Energy Sector and Consumer Sector with two separate data sets. Through studying multiple industries, we hope to gain a wider view of how private equity backings affect IPO performance. 2 Data and Methodology A. IPO Data Sample For the purpose of this paper, we constructed a data sample of IPOs that took place in the US between 2008 and 2013 within the Energy and Consumer sector. Using Pitchbook, we filtered Energy companies by exit type and date, ending with a sample of 60 companies within the Energy Equipment, Exploration,
6 6 Production and Refining, and Energy Services subsectors. These particular subsectors were chosen arbitrarily to cut the data sample to a reasonable size, where data from other resources could be entered manually. Of these 60 companies, 32 were private equity-backed at the time of the IPO. We then conducted the same process for companies within the Consumer industry. We chose the Consumer industry in order to expand our data scope, and because it tends to be somewhat stable, unlike many of the cyclical subsectors in Energy. Within the Consumer industry, we compiled a data set of 63 companies that had IPOs between 2008 and Of these 63 companies, 44 were private equity-backed at the time of the IPO. We also used Pitchbook and Center for Research in Security Prices (CRSP) to acquire the same IPO characteristics, as well as data on daily stock returns. Our data set excludes companies that are not listed on CRSP, as well as any firms that had unsuccessful IPOs. B. Measuring Financial Performance In contrast to preceding literature, much of which uses Return on Assets and the Market-to-Book ratio to measure performance, we chose to view the IPOs from an investor s point of view. As a result, we measured performance through holding period return, the total return on a stock or portfolio held over a specified period of time. Using CRSP, we compared this daily holding period stock returns to daily returns of the S&P 500, a common benchmark of the stock market. We then calculated excess daily returns by finding the difference between the daily stock return and the daily S&P return, for a total period of three years. We then converted our daily excess returns into a cumulative three-year excess return. This three-year excess return represented the excess return over the market that an investor would have earned by buying the individual firm s stock at the IPO and
7 7 holding for three years. It is this excess return that we will use as our dependent variable in our regression analysis. Cumulative 3 Year Excess Return = [(1+X 1 ) (1+X 2 )(1+X 3 )* *(1+X 754 )(1+X 755 )] 1 Where X t = Daily Excess Return, t Days After IPO = Daily Stock Return, t Days After IPO Daily S&P Return, t Days After IPO We used excess returns over the S&P 500 in order to control for the difference in market conditions during our five-year time horizon of IPO data. For example, even though the market was still in the midst of the recession in 2008, our method accounted for this, and still shows how a particular company stock performed in relation to the overall market. As a result, our comparison of returns from IPOs that occurred in different years will be more controlled. C. Regression Control Variables When asking how a PE backing affects post-ipo stock returns, we started with a broader question: what are the factors affecting IPO performance? To examine a company s IPO, we looked at the model: IPO Performance = β 0 + β 1 Deal Size + β 2 Firm Size + β 3 Firm Age + β 4 First Day Return + μ Our model is formulated based on previous literature, specifically papers written by Durukan (2002), Krishnan, Ivanov, Masulis, and Singh (2011), and Dong, Michel, and Pandes (2011). As seen above, we must first control for the effects of issuer characteristics to isolate the effects of a PE backing.
8 8 Variables: IPO Performance, the dependent variable, is measured by the three-year excess stock holding return over the market. We do not take the natural logarithm of this number, since many firms exhibit negative returns during this period. Deal Size is measured in millions of US dollars, and is calculated by multiplying the offer price by the number of shares offered at the IPO. Another term for Deal Size would be gross proceeds. We will use the natural logarithm of IPO gross proceeds (Ln Deal Size). In general, Deal Size should positively correlate with IPO Performance, since stronger IPO issuers are largely better equipped to make larger IPO offers (Krishnan, Ivanov, Masulis, and Singh, 2011). Firm Size is measured through the company s revenue in terms of millions of US dollars, and is recorded right before the IPO. Again, we will use the natural logarithm (Ln Firm Size). Firm Age, measured in years, controls for the age of the company at the time of the IPO, and is calculated by finding the difference between the firm s founding year and the year of the IPO. We include this variable to account for the fact that older, more established firms with more experienced management, an extensive network of customers, and more tangible assets are more mature in their business cycle, and thus may exhibit lower growth. Following the techniques of Krishnan, Ivanov,
9 9 Masulis, and Singh (2011) and previous researchers, we will take the natural logarithm of 1 + firm age at IPO (Ln Firm Age + 1) in an effort to minimize skewness. First Day Return captures the change in price on the first day of trading, controlling for excessive IPO demand. Jay Ritter (1991) has demonstrated that in general, IPOs tend to be underpriced by the investment banks. This often causes frenzy on the first day of trading. Therefore, First Day Return will control the situations where the initial price per share does not reflect true firm quality. Similar to IPO Performance, this variable is negative for many firms. As such, we will not take the natural logarithm. While the equation above captures the variables affecting a company s IPO performance, we also included a dummy variable that tests whether private equity backing yields greater IPO performance. Thus, our model is shown below: IPO Performance = β 0 + β 1 Deal Size + β 2 Firm Size + β 3 Firm Age + β 4 First Day Return + β 5 Private Equity + μ The independent variable Private Equity is equal to 1 for a private equity backing, and 0 otherwise. Through examining the coefficient on this particular independent variable, we aim to determine the influence of private equity on IPO performance. We expect this variable to have a positive, significant effect on the dependent variable.
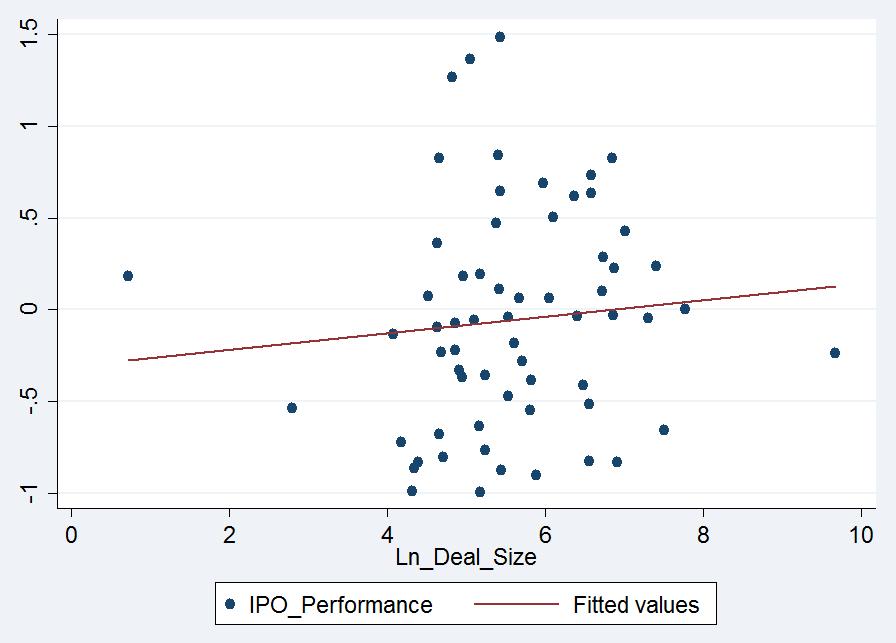
10 10 D. Summary Statistics and Two-Way Relationships Energy The summary statistics of our raw data set for the Energy industry is shown below. As shown in the data table, 52% of the 60 companies in the data set are Variable Observations Mean Std. Dev. Min Max IPO 3-yr returns (%) Deal size ($, mm) Firm size ($, mm) Firm age (years) First day return (%) Private equity backed by private equity, while 48% are not. Several two-way relationships should be explored in this data set. First and foremost, companies backed by PE firms exhibit better IPO performance than those firms not backed by PE. More specifically, the average cumulative threeyear return, excess of the S&P, for all PE-backed companies is 0.41 (41%), while the equivalent number for the non PE-backed companies is 0.16 (-16%). Figure 1 demonstrates this trend, showing that the distribution of returns reaches a greater, positive number for companies backed by PE. Figures 2, 3, 4, and 5 exhibit the two-way relationships between the dependent variable, IPO Performance, and the other control variables, including Ln (Deal Size), Ln (Firm Size), Ln (Firm Age + 1), and First Day Return. While Figures 2 and 3, the scatter plots comparing IPO Performance to Ln (Firm Size)
11 11 and Ln (Firm Age + 1) respectively, do not showcase any strong relationships between the variables, Figures 4 and 5 both indicate the presence of a trend. Figure 4, the scatter plot comparing IPO Performance to Ln (Deal Size), suggests a positive relationship between the two variables. Conversely, Figure 5 implies a negative relationship between IPO Performance and First Day Return. As we move forward with our analysis, we will see if these two-way relationships from the raw data hold up in our regression. Consumer The summary statistics of the Consumer data set show similar results, although the mean Deal Size and Firm Size are significantly larger for the Consumer Sector than they are for Energy Sector. The mean IPO three-year returns are also negative, in contrast to the positive value for the Energy Sector. As shown in the data table, 70% of the 63 companies in the data set are backed by private equity, while 30% are not. Variable Observations Mean Std. Dev. Min Max IPO 3-yr returns (%) Deal size ($, mm) Firm size ($, mm) Firm age (years) First day return (%) Private equity As before, we examined the two-way relationships in the data. Once again, companies backed by PE firms demonstrate better IPO performance, which in this
12 12 data set, means that three-year returns are less negative. More specifically, the average cumulative three-year return, excess of the S&P for all PE-backed companies is (-0.1%), while the equivalent number for the non PE-backed companies is (-18.5%). Figure 6 confirms these results, demonstrating that the distribution of returns reaches a higher, positive number for companies backed by PE. Figures 7, 8, 9, and 10 present the two-way relationships between the dependent variable, IPO Performance, and the other control variables, including Ln (Deal Size), Ln (Firm Size), Ln (Firm Age + 1), and First Day Return respectively. As in the Energy data set, the Consumer data set does not show any significant trends through these scatter plots. In all four cases, the relationship between the variables appears to be slightly positive, although the trend is almost negligible. Figure 8, the plot between IPO Performance and Ln (Firm Size) suggests the strongest positive relationship between the two variables. However, we need to examine results of our multiple regression analysis to fully understand the impact of all these explanatory variables. E. The Independent T-test After analyzing our regression results, we make use of the independentsamples t-test to further analyze our data. The t-test is designed to determine if the average of the dependent variable, in this case IPO Performance, is equal in two different groups. More specifically, it tests the null hypothesis that the means of the two groups are equal. In this paper, we utilize this test to establish whether the mean difference in IPO performance between companies backed by private equity and companies not backed by private equity is statistically significantly different from zero.
13 13 Difference in Group Means = x Non-PE x PE where x = average group IPO performance 3 Results Energy Initial Regression Results Observations 59 R-squared VARIABLES IPO Performance Ln(Deal Size) 0.314* (0.168) Ln(Firm Size) (0.0903) Ln(Firm Age + 1) (0.136) First Day Return (3.107) Private Equity (0.295) Standard errors in parenthesis *** p<0.01, ** p<0.05, * p<0.1 As indicated in our analysis of two-way relationships, Ln (Deal Size) has a positive correlation with IPO Performance, while First Day Return has a negative correlation with the same dependent variable. This is not surprising, as the scatter plots mentioned above initially showed evidence of these trends. In our initial hypothesis, we stated our expectation that Ln (Deal Size) would positively correlate
14 14 with IPO Performance, as stronger IPO issuers are generally better equipped to make larger IPO offers (Krishnan, Ivanov, Masulis, and Singh, 2011). The regression results confirm this hypothesis, as the coefficient on Ln (Deal Size) is statistically significant for the Energy Sector. Beyond Ln (Deal Size), none of our variables had statistical significance, leading to an inconclusive analysis. R-squared was 0.145, meaning that our independent variables explained just 14.5% of the variation in our data set. Even First Day Return, which exhibited a strong negative relationship with IPO Performance, thus confirming our scatter plot analysis, did not show statistical significance. The coefficient, however, is notable, due to its relatively large negative value of With these results, one can hypothesize that firms are grossly overpriced because investors rightfully expect them to perform well. If this is the case, then the high initial price leads to a large negative first day return, but the supposedly strong firm ends up performing well in the long run. Ln (Firm Size) had a negative coefficient of , which would indicate that larger firms do worse in terms of IPO performance. However, this value is not statistically significant, which precludes us from making that conclusion. Ln (Firm Age + 1) also lacked statistical significance, although the positive value of might otherwise imply that older, more established firms do better in the long run. While this is possible, it is also feasible that these mature firms exhibit less growth, which may hinder performance. As such, the inconclusive results are not inconceivable. Finally, the independent variable of interest, Private Equity, had a positive yet statistically insignificant coefficient. The positive correlation confirms the implications of Figures 1, which compares the distributions of PE-backed and non- PE-backed firms in terms of IPO performance, and suggests that PE-backed IPOs
15 15 in the Energy sector perform better. However, despite the fact that the coefficient on our main variable was positive as expected, the lack of statistical significance means that we cannot reject the null that a PE backing has no effect on IPO performance. As a result, we do not have enough evidence to prove our hypothesis in the Energy sector. Consumer Initial Regression Results Observations 63 R-squared VARIABLES IPO Performance Ln (Deal Size) (0.073) Ln (Firm Size) 0.165** (0.070) Ln (Firm Age + 1) (0.085) First Day Return (2.131) Private Equity (0.171) Standard errors in parenthesis *** p<0.01, ** p<0.05, * p<0.1 Without finding statistical significance of the term Private Equity in the Energy data set regression, we turn to the Consumer data set. However, the
16 16 Consumer sector results were similar to the Energy sector results in that neither exhibited a lot of statistical significance, nor did they allow us to prove our hypothesis. Our R-squared value of meant that our explanatory variables accounted for 14.2% of the variation in this data set. Once again, the coefficient on Private Equity was positive, confirming the implications of Figure 7, which indicates that PE-backed firms exhibit greater IPO performance. However, statistical insignificance precludes us from concluding that the Private Equity factor has a real effect on three-year returns. Beyond the dummy variable Private Equity, the signs of the coefficients proved to be quite different from the previous regression. For example, Ln (Deal Size), measured in millions raised by the IPO, had a negative coefficient of in the Consumer sector. While this result is surprising give our expectations as well as the results from the Energy sector, it is not statistically significant. In fact, the only statically significant variable was Ln(Firm Size), which had a positive coefficient. When compared to the previous regression, this result is surprising, as the same variable had produced the opposite effect on the dependent variable. Another difference from the last regression is that Ln (Firm Age + 1) had a negative coefficient, which would implicate that more mature firms exhibit less growth, and thus do not perform as well in IPOs. This result, while statistically insignificant, meets our initial expectations of this variable. Finally, First Day Return also showed an opposite result from before, exhibiting a large, positive coefficient. In contrast to the explanation of why this variable might display a negative coefficient, as it did previously, it is possible that the firms that beat market expectations on the first day simply continue to do so for three years. It is also likely that the large coefficient is the result of potential outliers.
17 17 Although we were not able to find statistical significance in our regression analysis (thus not allowing us to prove our hypothesis), the t-test allows for further analysis that may provide further insight onto our topic. The results of our t-test are as follows: Energy Two sample t-test with equal variance Group Observations Mean Std. Error Combined diff = mean(0) - mean(1) H o : diff = 0 Degrees of freedom = 58 t = H a : diff < 0 H a : diff!= 0 H a : diff > 0 Pr(T<t) = Pr( T > t ) = Pr(T>t) = Because the t-test analyzes the differences in means, this test confirms our findings that PE-backed IPOs outperform non-pe-backed IPOs in the Energy sector during three-year time span. The difference in means, calculated as the mean of non-pe-backed firms minus the mean of PE-backed firms, is , which is statistically significant given the degrees of freedom. The two-sided p-value, indicating the probability that the difference in means is either less than or greater than zero, is close to zero, providing enough evidence that we can reject the null hypothesis that there is no difference in means. As a result, we conclude that there is a statistically significant difference in IPO performance between firms backed by PE, and firms not backed by PE, results which confirm the findings of previous literature.
18 18 Consumer Two sample t-test with equal variance Group Observations Mean Std. Error Combined diff = mean(0) - mean(1) H o : diff = 0 Degrees of freedom = 61 t = H a : diff < 0 H a : diff!= 0 H a : diff > 0 Pr(T<t) = Pr( T > t ) = Pr (T>t) = Again, we can see that that PE-backed firms and non-pe-backed firms exhibit different group averages within the Consumer sector, as mentioned in a previous section. However, in contrast to the results of the Energy sector, the difference in means of the Consumer sector does not demonstrate statistical significance. The two-sided alternative is that the difference in means is either less than or greater than zero has a p-value of This number does not allow us to reject the null hypothesis. Consequently, we cannot conclude that there is a statistically significant difference in IPO performance between firms backed by PE, and firms not backed by PE in the Consumer sector. As a result of our varied t-test results, as well as our inconclusive regression analysis, we cannot, at this point, confirm nor deny our hypothesis that a company backed by a private equity firm will perform better over a three-year time horizon. There are several possible explanations for these results. First, it is possible that backing by a private equity firm simply does not have an impact on IPO performance. As shown by Ritter s study, investing in
19 19 IPOs is generally not a winning strategy, as in the long run; IPO s tend to underperform the S&P 500. With this in mind, whether or not a company is backed by private equity may not make a significant difference. While our results in both the Energy and Consumer data set did show that private equity has a positive effect on IPO performance, the results were not statistically significant at the 95% confidence interval. Consequently, we cannot say that the correlation is equal to causation. In addition, the prospect remains that the effects a PE-backing are already priced into the market. If this is the case, then companies backed by private equity should not exhibit significantly different returns from companies not backed by private equity. Furthermore, our sample size may have not been sufficiently large. Even with two data sets, 123 companies could simply have not been enough to provide an accurate picture. With more data, we may have seen our independent variables explaining more of the variation in data, thus yielding larger R-squared values. In addition, with data sets of around 60 companies, it is possible that certain outliers could have had a larger impact on the regression results. Moreover, our choice of industry and timing may have impacted our results. Energy is a volatile and cyclical industry that often moves in relation to oil prices and exogenous factors. Our results may have been more influenced by how the Energy Sector had performed during the time period of This is especially true, as this was a particularly volatile time for the Energy industry and markets in general. While the Consumer industry is generally less volatile than Energy, the public s spending habits may have been impacted by the recession, even after the recession ended. As a result, the Consumer industry may have been adversely affected (more than that of the S&P 500), thus resulting in a deflation of
20 20 excess stock returns. Although our measurements of performance accounted for market conditions, they did not account for cyclicality of industries. It is possible that the entire industry followed such a strong trend that differences in IPO backings did not make a difference. 4 Conclusion Ultimately, we were unable to reach any strong conclusions regarding the impact that private equity has on three-year IPO performance. Although we found statistical significance when we conducted a t-test on the Energy Sector data, this result is not enough to prove our hypothesis. As a result, we would not recommend that the average investor should invest in private equity-backed IPOs as an investment strategy. In contrast, in congruence with Ritter s findings, we would not recommend that a person should invest in IPOs at all as a strategy. Moving forward, we hope to expand this study. Using more data from a wider range of industries, we believe that we would obtain a clearer picture about the effect of private equity on IPO performance. 5 References Appelbaum, E., & Batt, R. (2014). Private Equity at Work: When Wall Street Manages Main Street. Russell Sage Foundation. Retrieved from Brav, A., and P.A. Gompers, Myth or Reality? The Long-Run Underperformance of Initial Public Offerings: Evidence from Venture Capital and Nonventure Capital-Backed Companies, Journal of Finance 52,
21 21 Datta, S., Gruskin, and Iskandar-Datta, On post-ipo stock price performance: A comparative analysis of RLBOs and IPOs, Journal of Banking and Finance 55, Dong, M., J.S. Michel, and J.A. Pandes, Underwriter Quality and Long-Run IPO Performance, Financial Management 40, Durukan, M.B., The relationship between IPO returns and factors influencing IPO performance: case of Instabul Stock Exchange, Managerial Finance 28, Gompers, Paul, Steven Kaplan, and Vladimir Mukharlyamov, "What Do Private Equity Firms Say They Do?" Kaplan, Steven, and Per Strömberg, "Leveraged Buyouts and Private Equity." Journal of Economic Perspectives. Krishnan, C.N.V; V. Ivanov. R. Masulis; and A. Singh, Venture Capital Reputation, Post-IPO Performance, and Corporate Governance, The Journal of Financial and Quantitative Analysis 46, Ritter, Jay R, "The Long-Run Performance of Initial Public Offerings." The Journal of Finance Figures Energy Figure 1: Comparing IPO Performance Between Groups


22 22 (0 = Non PE-Backed, 1 = PE-Backed) Figure 2: IPO Performance vs. Ln(Firm Age+1) Figure 3: IPO Performance vs. Ln(Firm Size)
 Figure 5: IPO")


23 23 Figure 4: IPO Performance vs. Ln(Deal Size) Figure 5: IPO Performance vs. First Day Return Consumer Figure 6: Comparing IPO Performance Between Groups (0 = Non PE-Backed, 1 = PE-Backed)

")
 Figure 10: IPO")
24 24 Figure 7: IPO Performance vs. Ln(Firm Age+1) Figure 8: IPO Performance vs. Ln(Firm Size) Figure 9: IPO Performance vs. Ln(Deal Size) Figure 10: IPO Performance vs. First Day Return
Investor Demand in Bookbuilding IPOs: The US Evidence
 Investor Demand in Bookbuilding IPOs: The US Evidence Yiming Qian University of Iowa Jay Ritter University of Florida An Yan Fordham University August, 2014 Abstract Existing studies of auctioned IPOs
Do VCs Provide More Than Money? Venture Capital Backing & Future Access to Capital
 LV11066 Do VCs Provide More Than Money? Venture Capital Backing & Future Access to Capital Donald Flagg University of Tampa John H. Sykes College of Business Speros Margetis University of Tampa John H.
Why Do Companies Choose to Go IPOs? New Results Using Data from Taiwan;
 University of New Orleans ScholarWorks@UNO Department of Economics and Finance Working Papers, 1991-2006 Department of Economics and Finance 1-1-2006 Why Do Companies Choose to Go IPOs? New Results Using
Journal Of Financial And Strategic Decisions Volume 10 Number 2 Summer 1997 AN ANALYSIS OF VALUE LINE S ABILITY TO FORECAST LONG-RUN RETURNS
 Journal Of Financial And Strategic Decisions Volume 10 Number 2 Summer 1997 AN ANALYSIS OF VALUE LINE S ABILITY TO FORECAST LONG-RUN RETURNS Gary A. Benesh * and Steven B. Perfect * Abstract Value Line
The Consistency between Analysts Earnings Forecast Errors and Recommendations
 The Consistency between Analysts Earnings Forecast Errors and Recommendations by Lei Wang Applied Economics Bachelor, United International College (2013) and Yao Liu Bachelor of Business Administration,
The Golub Capital Altman Index
 The Golub Capital Altman Index Edward I. Altman Max L. Heine Professor of Finance at the NYU Stern School of Business and a consultant for Golub Capital on this project Robert Benhenni Executive Officer
UNDERPRICING OF INITIAL PUBLIC OFFERINGS: AN INDIAN EVIDENCE
 Available online at : http://euroasiapub.org/current.php?title=ijrfm, pp. 44~49 Thomson Reuters Researcher ID: L-5236-2015 UNDERPRICING OF INITIAL PUBLIC OFFERINGS: AN INDIAN EVIDENCE Sahil Narang 1, Assistant
PE: Where has it been? Where is it now? Where is it going?
 PE: Where has it been? Where is it now? Where is it going? Steve Kaplan 1 Steven N. Kaplan Overview What does PE do at the portfolio company level? Why? What does PE do at the fund level? Talk about some
THE RELATIVE ACCURACY OF MANAGEMENT EARNINGS FORECAST AND IPO PERFORMANCE
 Jurnal Keuangan dan Perbankan, Vol.15, No.1 Januari 2011, hlm. 15 22 Terakreditasi SK. No. 64a/DIKTI/Kep/2010 THE RELATIVE ACCURACY OF MANAGEMENT EARNINGS FORECAST AND IPO PERFORMANCE Yanthi Hutagaol I
Venture Capital Flows: Does IT Sector Investment Diminish Investment in Other Industries
 Venture Capital Flows: Does IT Sector Investment Diminish Investment in Other Industries Manohar Singh The Pennsylvania State University- Abington While recently the Venture Capital activity in Information
The Role of Agents in Private Finance. Douglas J. Cumming * J. Ari Pandes Michael J. Robinson. January Abstract
 The Role of Agents in Private Finance Douglas J. Cumming * J. Ari Pandes Michael J. Robinson January 2011 Abstract In this paper we examine for the first time the role of agents in the private financing
The Determinants of Capital Structure: Analysis of Non Financial Firms Listed in Karachi Stock Exchange in Pakistan
 Analysis of Non Financial Firms Listed in Karachi Stock Exchange in Pakistan Introduction The capital structure of a company is a particular combination of debt, equity and other sources of finance that
IPO s Long-Run Performance: Hot Market vs. Earnings Management
 IPO s Long-Run Performance: Hot Market vs. Earnings Management Tsai-Yin Lin Department of Financial Management National Kaohsiung First University of Science and Technology Jerry Yu * Department of Finance
Discounting and Underpricing of REIT Seasoned Equity Offers
 Discounting and Underpricing of REIT Seasoned Equity Offers Author Kimberly R. Goodwin Abstract For seasoned equity offerings, the discounting of the offer price from the closing price on the previous
Mr. Kedar Mukund Phadke 1, Dr. Manoj S. Kamat 2 ABSTRACT
 IMPACT OF IPO GRADING ON LISTING RETURNS AT THE NATIONAL STOCK EXCHANGE (NSE) IN INDIA Mr. Kedar Mukund Phadke 1, Research Scholar Assistant Professor National Institute of Construction Management and
Underpricing of private equity backed, venture capital backed and non-sponsored IPOs
 Underpricing of private equity backed, venture capital backed and non-sponsored IPOs AUTHORS ARTICLE INFO JOURNAL FOUNDER Vlad Mogilevsky Zoltan Murgulov Vlad Mogilevsky and Zoltan Murgulov (2012). Underpricing
Impact of Weekdays on the Return Rate of Stock Price Index: Evidence from the Stock Exchange of Thailand
 Journal of Finance and Accounting 2018; 6(1): 35-41 http://www.sciencepublishinggroup.com/j/jfa doi: 10.11648/j.jfa.20180601.15 ISSN: 2330-7331 (Print); ISSN: 2330-7323 (Online) Impact of Weekdays on the
Grandstanding and Venture Capital Firms in Newly Established IPO Markets
 The Journal of Entrepreneurial Finance Volume 9 Issue 3 Fall 2004 Article 7 December 2004 Grandstanding and Venture Capital Firms in Newly Established IPO Markets Nobuhiko Hibara University of Saskatchewan
IPO Underpricing in Hong Kong GEM
 IPO Underpricing in Hong Kong GEM by Xisheng Wang A research project submitted in partial fulfillment of the requirements for the degree of Master of Finance Saint Mary s University Copyright Xisheng Wang
RESEARCH ARTICLE. Change in Capital Gains Tax Rates and IPO Underpricing
 RESEARCH ARTICLE Business and Economics Journal, Vol. 2013: BEJ-72 Change in Capital Gains Tax Rates and IPO Underpricing 1 Change in Capital Gains Tax Rates and IPO Underpricing Chien-Chih Peng Department
Leverage Buyout Activity: A Tale of Developed and Developing Economies ( Preliminary and not to be Quoted). ABSTRACT
. ABSTRACT") Leverage Buyout Activity: A Tale of Developed and Developing Economies ( Preliminary and not to be Quoted). ABSTRACT In this study we explain and compare the returns on Leveraged Buyouts (LBOs) in developed
Leverage Buyout Activity: A Tale of Developed and Developing Economies ( Preliminary and not to be Quoted). ABSTRACT In this study we explain and compare the returns on Leveraged Buyouts (LBOs) in developed
Ownership Structure and Capital Structure Decision
 Modern Applied Science; Vol. 9, No. 4; 2015 ISSN 1913-1844 E-ISSN 1913-1852 Published by Canadian Center of Science and Education Ownership Structure and Capital Structure Decision Seok Weon Lee 1 1 Division
Center for Analytical Finance University of California, Santa Cruz. Working Paper No. 30
 Center for Analytical Finance University of California, Santa Cruz Working Paper No. 30 Private Equity Performance, Fund Size and Historical Investment Wentao Su Bank of America, wentao.su@bankofamerica.com
Does Managerial Optimism Lead to Long-Run Underperformance? Evidence from Venture Capital-Backed IPOs. Jean-Sébastien Michel
 Does Managerial Optimism Lead to Long-Run Underperformance? Evidence from Venture Capital-Backed IPOs Jean-Sébastien Michel Current Version: February 27, 2009 Abstract In a sample of 340 venture capital-backed
Model Construction & Forecast Based Portfolio Allocation:
 QBUS6830 Financial Time Series and Forecasting Model Construction & Forecast Based Portfolio Allocation: Is Quantitative Method Worth It? Members: Bowei Li (303083) Wenjian Xu (308077237) Xiaoyun Lu (3295347)
SHORT RUN PERFORMANCE OF INITIAL PUBLIC OFFERINGS IN INDIA
 CHAPTER 5 SHORT RUN PERFORMANCE OF INITIAL PUBLIC OFFERINGS IN INDIA It is a pervasive feature of markets, the world over, those investors who subscribed to initial public offerings, on the offer day,
Internet Appendix for Private Equity Firms Reputational Concerns and the Costs of Debt Financing. Rongbing Huang, Jay R. Ritter, and Donghang Zhang
 Internet Appendix for Private Equity Firms Reputational Concerns and the Costs of Debt Financing Rongbing Huang, Jay R. Ritter, and Donghang Zhang February 20, 2014 This internet appendix provides additional
AN EMPIRICAL EXAMINATION OF NEGATIVE ECONOMIC VALUE ADDED FIRMS
 The International Journal of Business and Finance Research VOLUME 8 NUMBER 1 2014 AN EMPIRICAL EXAMINATION OF NEGATIVE ECONOMIC VALUE ADDED FIRMS Stoyu I. Ivanov, San Jose State University Kenneth Leong,
Sources of Financing in Different Forms of Corporate Liquidity and the Performance of M&As
 Sources of Financing in Different Forms of Corporate Liquidity and the Performance of M&As Zhenxu Tong * University of Exeter Jian Liu ** University of Exeter This draft: August 2016 Abstract We examine
Post IPO-Performance: A Comparative Analysis between the US and China.
 Post IPO-Performance: A Comparative Analysis between the US and China. This paper discusses and analyses the post-ipo long-term performance of firms in a cross-country analysis of the United States and
Long run performance of initial public offerings in India
 Long run performance of initial public offerings in India Madhuri Malhotra Loyola Institute of Business Administration, India N. Premkumar Madras School of Economics, India Key Words Initial Public Offer,
Do Value-added Real Estate Investments Add Value? * September 1, Abstract
 Do Value-added Real Estate Investments Add Value? * Liang Peng and Thomas G. Thibodeau September 1, 2013 Abstract Not really. This paper compares the unlevered returns on value added and core investments
MERGERS AND ACQUISITIONS: THE ROLE OF GENDER IN EUROPE AND THE UNITED KINGDOM
 ) MERGERS AND ACQUISITIONS: THE ROLE OF GENDER IN EUROPE AND THE UNITED KINGDOM Ersin Güner 559370 Master Finance Supervisor: dr. P.C. (Peter) de Goeij December 2013 Abstract Evidence from the US shows
DOES IPO GRADING POSITIVELY INFLUENCE RETAIL INVESTORS? A QUANTITATIVE STUDY IN INDIAN CAPITAL MARKET
 DOES IPO GRADING POSITIVELY INFLUENCE RETAIL INVESTORS? A QUANTITATIVE STUDY IN INDIAN CAPITAL MARKET Abstract S.Saravanan, Research Scholar, Sathyabama University, Chennai Dr.R.Satish, Associate Professor,
Minimum Variance and Tracking Error: Combining Absolute and Relative Risk in a Single Strategy
 White Paper Minimum Variance and Tracking Error: Combining Absolute and Relative Risk in a Single Strategy Matthew Van Der Weide Minimum Variance and Tracking Error: Combining Absolute and Relative Risk
Performance of Initial Public Offerings in Public and Private Owned Firms of Pakistan. Henna and Attiya Yasmin Javid
 Performance of Initial Public Offerings in Public and Private Owned Firms of Pakistan Henna and Attiya Yasmin Javid Introduction When any private company first time sells his stock to general public is
The relationship between share repurchase announcement and share price behaviour
 The relationship between share repurchase announcement and share price behaviour Name: P.G.J. van Erp Submission date: 18/12/2014 Supervisor: B. Melenberg Second reader: F. Castiglionesi Master Thesis
Marketability, Control, and the Pricing of Block Shares
 Marketability, Control, and the Pricing of Block Shares Zhangkai Huang * and Xingzhong Xu Guanghua School of Management Peking University Abstract Unlike in other countries, negotiated block shares have
Introducing the JPMorgan Cross Sectional Volatility Model & Report
 Equity Derivatives Introducing the JPMorgan Cross Sectional Volatility Model & Report A multi-factor model for valuing implied volatility For more information, please contact Ben Graves or Wilson Er in
Performance and Capital Flows in Private Equity
 Performance and Capital Flows in Private Equity Q Group Fall Seminar 2008 November, 2008 Antoinette Schoar, MIT and NBER Overview Is private equity an asset class? True story lies beyond the aggregates
A STUDY ON INITIAL PERFORMANCE OF IPO S IN SINDIA DURING COMPARISON OF BOOK BUILDING AND FIXED PRICE MECHANISM
 A STUDY ON INITIAL PERFORMANCE OF IPO S IN SINDIA DURING 2015-16 - COMPARISON OF BOOK BUILDING AND FIXED PRICE MECHANISM Dr. P. Roopa Assistant Professor, Sree Vidyanikethan Institute of Management, Tirupati
Implied Volatility v/s Realized Volatility: A Forecasting Dimension
 4 Implied Volatility v/s Realized Volatility: A Forecasting Dimension 4.1 Introduction Modelling and predicting financial market volatility has played an important role for market participants as it enables
The IPO Derby: Are there Consistent Losers and Winners on this Track?
 The IPO Derby: Are there Consistent Losers and Winners on this Track? Konan Chan *, John W. Cooney, Jr. **, Joonghyuk Kim ***, and Ajai K. Singh **** This version: June, 2007 Abstract We examine the individual
1 An Analysis of Factors Affecting Investor Demand for Initial Public Offerings in Singapore*
 1 An Analysis of Factors Affecting Investor Demand for Initial Public Offerings in Singapore* Li Li Eng The National University of Singapore, Singapore Hwee Shan Aw The National University of Singapore,
Does Venture Capital Reputation Matter? Evidence from Subsequent IPOs.
 Does Venture Capital Reputation Matter? Evidence from Subsequent IPOs. C.N.V. Krishnan Weatherhead School of Management, Case Western Reserve University 216.368.2116 cnk2@cwru.edu Ronald W. Masulis Owen
An Empirical Investigation of Short-Run Performance of Ipos in India
 An Empirical Investigation of Short-Run Performance of Ipos in India Himanshu Puri Abstract Initial Public Offering (IPO), is a way for companies to go public and meet its financing needs. IPOs are known
An Evaluation of the Relationship Between Private and Public R&D Funds with Consideration of Level of Government
 1 An Evaluation of the Relationship Between Private and Public R&D Funds with Consideration of Level of Government Sebastian Hamirani Fall 2017 Advisor: Professor Stephen Hamilton Submitted 7 December
Cross Border Carve-out Initial Returns and Long-term Performance
 Financial Decisions, Winter 2012, Article 3 Abstract Cross Border Carve-out Initial Returns and Long-term Performance Thomas H. Thompson Lamar University This study examines initial period and three-year
Venture Capitalists and Closely Held IPOs: Lessons for Family-Controlled Firms
 Kennesaw State University DigitalCommons@Kennesaw State University Faculty Publications 12-2001 Venture Capitalists and Closely Held IPOs: Lessons for Family-Controlled Firms Joseph H. Astrachan Kennesaw
Does Spending Time in the Minors Pay Off? Michele Meoli * J. Ari Pandes Michael Robinson Silvio Vismara. Abstract
 Does Spending Time in the Minors Pay Off? Michele Meoli * J. Ari Pandes Michael Robinson Silvio Vismara Abstract This paper compares the performance of firms that first go public on the Toronto Venture
The Performance of Private Equity Backed IPOs. Mario Levis* January 2010
 The Performance of Private Equity Backed IPOs Mario Levis* January 2010 Cass Business School City University, London Cass Private Equity Centre (CPEC) 106 Bunhill Row London EC1Y 8TZ email: m.levis@city.ac.uk
Syndicate Size In Global IPO Underwriting Demissew Diro Ejara, ( University of New Haven
 Syndicate Size In Global IPO Underwriting Demissew Diro Ejara, (E-mail: dejara@newhaven.edu), University of New Haven ABSTRACT This study analyzes factors that determine syndicate size in ADR IPO underwriting.
Journal Of Financial And Strategic Decisions Volume 7 Number 3 Fall 1994 ASYMMETRIC INFORMATION: THE CASE OF BANK LOAN COMMITMENTS
 Journal Of Financial And Strategic Decisions Volume 7 Number 3 Fall 1994 ASYMMETRIC INFORMATION: THE CASE OF BANK LOAN COMMITMENTS James E. McDonald * Abstract This study analyzes common stock return behavior
The Role of Agents in Private Finance. Douglas J. Cumming * J. Ari Pandes Michael J. Robinson. January Abstract
 The Role of Agents in Private Finance Douglas J. Cumming * J. Ari Pandes Michael J. Robinson January 2011 Abstract In this paper we examine for the first time the role of agents in private-market financings.
ONLINE APPENDIX. Do Individual Currency Traders Make Money?
 ONLINE APPENDIX Do Individual Currency Traders Make Money? 5.7 Robustness Checks with Second Data Set The performance results from the main data set, presented in Panel B of Table 2, show that the top
Biases in the IPO Pricing Process
 University of Rochester William E. Simon Graduate School of Business Administration The Bradley Policy Research Center Financial Research and Policy Working Paper No. FR 01-02 February, 2001 Biases in
M&A ANNOUNCEMENT AND SHAREHOLDER S WEALTH: TARGET COMPANY
 CHAPTER 5 M&A ANNOUNCEMENT AND SHAREHOLDER S WEALTH: TARGET COMPANY While an acquiring company is expected to create value through synergies when it acquires a target company, the shareholders of target-company
CAN AGENCY COSTS OF DEBT BE REDUCED WITHOUT EXPLICIT PROTECTIVE COVENANTS? THE CASE OF RESTRICTION ON THE SALE AND LEASE-BACK ARRANGEMENT
 CAN AGENCY COSTS OF DEBT BE REDUCED WITHOUT EXPLICIT PROTECTIVE COVENANTS? THE CASE OF RESTRICTION ON THE SALE AND LEASE-BACK ARRANGEMENT Jung, Minje University of Central Oklahoma mjung@ucok.edu Ellis,
Initial Public Offering. Corporate Equity Financing Decisions. Venture Capital. Topics Venture Capital IPO
 Initial Public Offering Topics Venture Capital IPO Corporate Equity Financing Decisions Venture Capital Initial Public Offering Seasoned Offering Venture Capital Venture capital is money provided by professionals
The Geography of Institutional Investors, Information. Production, and Initial Public Offerings. December 7, 2016
 The Geography of Institutional Investors, Information Production, and Initial Public Offerings December 7, 2016 The Geography of Institutional Investors, Information Production, and Initial Public Offerings
The use of real-time data is critical, for the Federal Reserve
 Capacity Utilization As a Real-Time Predictor of Manufacturing Output Evan F. Koenig Research Officer Federal Reserve Bank of Dallas The use of real-time data is critical, for the Federal Reserve indices
The Journal of Applied Business Research January/February 2013 Volume 29, Number 1
 Stock Price Reactions To Debt Initial Public Offering Announcements Kelly Cai, University of Michigan Dearborn, USA Heiwai Lee, University of Michigan Dearborn, USA ABSTRACT We examine the valuation effect
The performance of listed European innovative firms
 The performance of listed European innovative firms Luisa Anderloni a, Alessandra Tanda b This version 27 June 2014 Abstract The paper examines the performance of European VC backed firms operating in
Bank Risk Ratings and the Pricing of Agricultural Loans
 Bank Risk Ratings and the Pricing of Agricultural Loans Nick Walraven and Peter Barry Financing Agriculture and Rural America: Issues of Policy, Structure and Technical Change Proceedings of the NC-221
LONG-RUN IPO PERFORMANCES AND ITS INFLUENCING FACTORS: THE CASE OF INDONESIAN STOCK EXCHANGE
 Hal: 151 171 LONG-RUN IPO PERFORMANCES AND ITS INFLUENCING FACTORS: THE CASE OF INDONESIAN STOCK EXCHANGE Mahardhini Fuadillah Bank Mandiri Jakarta e-mail: mahardhini@gmail.com D. Agus Harjito Fakultas
Does the Equity Market affect Economic Growth?
 The Macalester Review Volume 2 Issue 2 Article 1 8-5-2012 Does the Equity Market affect Economic Growth? Kwame D. Fynn Macalester College, kwamefynn@gmail.com Follow this and additional works at: http://digitalcommons.macalester.edu/macreview
To study Influence of IPO Rating on demand in Indian IPO market in special context to Retail Investors.
 To study Influence of IPO Rating on demand in Indian IPO market in special context to Retail Investors. Mrs. Amita Jadhav (Research Scholar, The Indian Institute of cost and Management Studies and Research
Journal of Insurance and Financial Management, Vol. 1, Issue 4 (2016)
") Journal of Insurance and Financial Management, Vol. 1, Issue 4 (2016) 68-131 An Investigation of the Structural Characteristics of the Indian IT Sector and the Capital Goods Sector An Application of the
Journal of Insurance and Financial Management, Vol. 1, Issue 4 (2016) 68-131 An Investigation of the Structural Characteristics of the Indian IT Sector and the Capital Goods Sector An Application of the
What Drives the Earnings Announcement Premium?
 What Drives the Earnings Announcement Premium? Hae mi Choi Loyola University Chicago This study investigates what drives the earnings announcement premium. Prior studies have offered various explanations
The Journal of Applied Business Research July/August 2017 Volume 33, Number 4
 Stock Market Liquidity And Dividend Policy In Korean Corporations Jeong Hwan Lee, Hanyang University, South Korea Bohyun Yoon, Kangwon National University, South Korea ABSTRACT The liquidity hypothesis
Stock Price Reaction to Brokers Recommendation Updates and Their Quality Joon Young Song
 Stock Price Reaction to Brokers Recommendation Updates and Their Quality Joon Young Song Abstract This study presents that stock price reaction to the recommendation updates really matters with the recommendation
Institutional Trading in IPOs and Post-IPOs: Value-Based vs Speculative
 Front. Bus. Res. China 2011, 5(1): 144 162 DOI 10.1007/s11782-011-0125-4 RESEARCH ARTICLE Dongmin Kong, Yuanyuan Shao, Jing Huang Institutional Trading in IPOs and Post-IPOs: Value-Based vs Speculative
The Free Cash Flow Effects of Capital Expenditure Announcements. Catherine Shenoy and Nikos Vafeas* Abstract
 The Free Cash Flow Effects of Capital Expenditure Announcements Catherine Shenoy and Nikos Vafeas* Abstract In this paper we study the market reaction to capital expenditure announcements in the backdrop
Chapter IV. Forecasting Daily and Weekly Stock Returns
 Forecasting Daily and Weekly Stock Returns An unsophisticated forecaster uses statistics as a drunken man uses lamp-posts -for support rather than for illumination.0 Introduction In the previous chapter,
Deviations from Optimal Corporate Cash Holdings and the Valuation from a Shareholder s Perspective
 Deviations from Optimal Corporate Cash Holdings and the Valuation from a Shareholder s Perspective Zhenxu Tong * University of Exeter Abstract The tradeoff theory of corporate cash holdings predicts that
Elisabetta Basilico and Tommi Johnsen. Disentangling the Accruals Mispricing in Europe: Is It an Industry Effect? Working Paper n.
 Elisabetta Basilico and Tommi Johnsen Disentangling the Accruals Mispricing in Europe: Is It an Industry Effect? Working Paper n. 5/2014 April 2014 ISSN: 2239-2734 This Working Paper is published under
DISCRETIONARY DELETIONS FROM THE S&P 500 INDEX: EVIDENCE ON FORECASTED AND REALIZED EARNINGS Stoyu I. Ivanov, San Jose State University
 DISCRETIONARY DELETIONS FROM THE S&P 500 INDEX: EVIDENCE ON FORECASTED AND REALIZED EARNINGS Stoyu I. Ivanov, San Jose State University ABSTRACT The literature in the area of index changes finds evidence
Conflict in Whispers and Analyst Forecasts: Which One Should Be Your Guide?
 Abstract Conflict in Whispers and Analyst Forecasts: Which One Should Be Your Guide? Janis K. Zaima and Maretno Agus Harjoto * San Jose State University This study examines the market reaction to conflicts
Online Appendix to. The Value of Crowdsourced Earnings Forecasts
 Online Appendix to The Value of Crowdsourced Earnings Forecasts This online appendix tabulates and discusses the results of robustness checks and supplementary analyses mentioned in the paper. A1. Estimating
Seeking Beta in the Bond Market: A Mathdriven Investment Strategy for Higher Returns
 Seeking Beta in the Bond Market: A Mathdriven Investment Strategy for Higher Returns November 23, 2010 by Georg Vrba, P.E. Advisor Perspectives welcomes guest contributions. The views presented here do
THE ECONOMICS OF BANK ROBBERIES IN NEW ENGLAND 1. Kimberly A. Leonard, Diane L. Marley & Charlotte A. Senno
 THE ECONOMICS OF BANK ROBBERIES IN NEW ENGLAND 1 The Economics of Bank Robberies in New England Kimberly A. Leonard, Diane L. Marley & Charlotte A. Senno The University of Rhode Island, STA308 Comment
CHAPTER 4 DATA ANALYSIS Data Hypothesis
 CHAPTER 4 DATA ANALYSIS 4.1. Data Hypothesis The hypothesis for each independent variable to express our expectations about the characteristic of each independent variable and the pay back performance
Daily Stock Returns: Momentum, Reversal, or Both. Steven D. Dolvin * and Mark K. Pyles **
 Daily Stock Returns: Momentum, Reversal, or Both Steven D. Dolvin * and Mark K. Pyles ** * Butler University ** College of Charleston Abstract Much attention has been given to the momentum and reversal
Risk-Adjusted Futures and Intermeeting Moves
 issn 1936-5330 Risk-Adjusted Futures and Intermeeting Moves Brent Bundick Federal Reserve Bank of Kansas City First Version: October 2007 This Version: June 2008 RWP 07-08 Abstract Piazzesi and Swanson
Spin-offs Revisited: A Review of a Structural Pricing Anomaly
 Spin-offs Revisited: A Review of a Structural Pricing Anomaly by Horizon Asset Management, Inc. 342 Madison Avenue, Suite 702 New York City, NY 10173 Phone (212) 499-7720 Fax (212) 599-4676 Research property
State Switching in US Equity Index Returns based on SETAR Model with Kalman Filter Tracking
 State Switching in US Equity Index Returns based on SETAR Model with Kalman Filter Tracking Timothy Little, Xiao-Ping Zhang Dept. of Electrical and Computer Engineering Ryerson University 350 Victoria
The Variability of IPO Initial Returns
 THE JOURNAL OF FINANCE (forthcoming) The Variability of IPO Initial Returns MICHELLE LOWRY, MICAH S. OFFICER, and G. WILLIAM SCHWERT * ABSTRACT The monthly volatility of IPO initial returns is substantial,
Booth School of Business, University of Chicago Business 41202, Spring Quarter 2014, Mr. Ruey S. Tsay. Solutions to Midterm
 Booth School of Business, University of Chicago Business 41202, Spring Quarter 2014, Mr. Ruey S. Tsay Solutions to Midterm Problem A: (30 pts) Answer briefly the following questions. Each question has
Indian Institute of Management Calcutta. Working Paper Series. WPS No. 797 March Implied Volatility and Predictability of GARCH Models
 Indian Institute of Management Calcutta Working Paper Series WPS No. 797 March 2017 Implied Volatility and Predictability of GARCH Models Vivek Rajvanshi Assistant Professor, Indian Institute of Management
The Variability of IPO Initial Returns
 The Variability of IPO Initial Returns Michelle Lowry Penn State University, University Park, PA 16082, Micah S. Officer University of Southern California, Los Angeles, CA 90089, G. William Schwert University
Cumulative Abnormal Returns
 Cumulative Abnormal Returns 0.800000 DAY - 20 T0 +186 0.600000 CUMULATIVE ABNORMAL RETURNS 0.400000 0.200000 0.000000-0.200000-0.400000-0.600000-0.800000 3 5 13 16 7 15 17 23 12-20 -10 0 10 20 30 40 50
Nasdaq s Equity Index for an Environment of Rising Interest Rates
 Nasdaq s Equity Index for an Environment of Rising Interest Rates Introduction Nearly ten years after the financial crisis, an unprecedented period of ultra-low interest rates appears to be drawing to
General Business 706 Midterm #3 November 25, 1997
 General Business 706 Midterm #3 November 25, 1997 There are 9 questions on this exam for a total of 40 points. Please be sure to put your name and ID in the spaces provided below. Now, if you feel any
Private Equity Performance: What Do We Know?
 Preliminary Private Equity Performance: What Do We Know? by Robert Harris*, Tim Jenkinson** and Steven N. Kaplan*** This Draft: September 9, 2011 Abstract We present time series evidence on the performance
Short Selling and the Subsequent Performance of Initial Public Offerings
 Short Selling and the Subsequent Performance of Initial Public Offerings Biljana Seistrajkova 1 Swiss Finance Institute and Università della Svizzera Italiana August 2017 Abstract This paper examines short
Winner s Curse in Initial Public Offering Subscriptions with Investors Withdrawal Options
 Asia-Pacific Journal of Financial Studies (2010) 39, 3 27 doi:10.1111/j.2041-6156.2009.00001.x Winner s Curse in Initial Public Offering Subscriptions with Investors Withdrawal Options Dennis K. J. Lin
CEM Benchmarking DEFINED BENEFIT THE WEEN. did not have.
 Alexander D. Beath, PhD CEM Benchmarking Inc. 372 Bay Street, Suite 1000 Toronto, ON, M5H 2W9 www.cembenchmarking.com June 2014 ASSET ALLOCATION AND FUND PERFORMANCE OF DEFINED BENEFIT PENSIONN FUNDS IN
Does Asset Allocation Policy Explain 40, 90, or 100 Percent of Performance?
 Does Asset Allocation Policy Explain 40, 90, or 100 Percent of Performance? Roger G. Ibbotson and Paul D. Kaplan Disagreement over the importance of asset allocation policy stems from asking different
Expensive Goods, Inexpensive Equities: An Explanation of IPO Hot Time from Market Condition Perspective. Xiaomin Guo 1
 Journal of International Business and Economics September 2014, Vol. 2, No. 3, pp. 4355 ISSN: 23742208 (Print, 23742194 (Online Copyright The Author(s. 2014. All Rights Reserved. Published by American
Stock Price Behavior of Pure Capital Structure Issuance and Cancellation Announcements
 Stock Price Behavior of Pure Capital Structure Issuance and Cancellation Announcements Robert M. Hull Abstract I examine planned senior-for-junior and junior-for-senior transactions that are subsequently